")
Back to Journals » International Journal of Nanomedicine » Volume 13
Physiologically based pharmacokinetic modeling of nanoceria systemic distribution in rats suggests dose- and route-dependent biokinetics
Authors Carlander U, Moto TP, Desalegn AA , Yokel RA , Johanson G
Received 16 November 2017
Accepted for publication 6 January 2018
Published 1 May 2018 Volume 2018:13 Pages 2631—2646
DOI https://doi.org/10.2147/IJN.S157210
Checked for plagiarism Yes
Review by Single anonymous peer review
Peer reviewer comments 3
Editor who approved publication: Dr Thomas Webster
Ulrika Carlander,1 Tshepo Paulsen Moto,2 Anteneh Assefa Desalegn,1 Robert A Yokel,3 Gunnar Johanson1
1Unit of Work Environment Toxicology, Institute of Environmental Medicine, Karolinska Institutet, Solna, Sweden; 2Faculty of Health Sciences, School of Health Systems and Public Health, University of Pretoria, Pretoria, South Africa; 3Department of Pharmaceutical Sciences, University of Kentucky, Lexington, KY, USA
Background: Cerium dioxide nanoparticles (nanoceria) are increasingly being used in a variety of products as catalysts, coatings, and polishing agents. Furthermore, their antioxidant properties make nanoceria potential candidates for biomedical applications. To predict and avoid toxicity, information about their biokinetics is essential. A useful tool to explore such associations between exposure and internal target dose is physiologically based pharmacokinetic (PBPK) modeling. The aim of this study was to test the appropriateness of our previously published PBPK model developed for intravenous (IV) administration when applied to various sizes of nanoceria and to exposure routes relevant for humans.
Methods: Experimental biokinetic data on nanoceria (obtained from various exposure routes, sizes, coatings, doses, and tissues sampled) in rats were collected from the literature and also obtained from the researchers. The PBPK model was first calibrated and validated against IV data for 30 nm citrate coated ceria and then recalibrated for 5 nm ceria. Finally, the model was modified and tested against inhalation, intratracheal (IT) instillation, and oral nanoceria data.
Results: The PBPK model adequately described nanoceria time courses in various tissues for 5 nm ceria given IV. The time courses of 30 nm ceria were reasonably well predicted for liver and spleen, whereas the biokinetics in other tissues were not well captured. For the inhalation, IT instillation, and oral exposure routes, re-optimization was difficult due to low absorption and, hence, low and variable nanoceria tissue levels. Moreover, the nanoceria properties and exposure conditions varied widely among the inhalation, IT instillation, and oral studies, making it difficult to assess the importance of different factors.
Conclusion: Overall, our modeling efforts suggest that nanoceria biokinetics depend largely on the exposure route and dose.
Keywords: biodistribution, cerium dioxide, inhalation, instillation, intravenous, oral
Introduction
The most common commercial form of cerium is cerium dioxide, also known as ceric oxide or ceria. Nanoscale forms of ceria (nanoceria) are used in a variety of products as catalysts, fuel additives and cells, polishing agents, and coatings.1–4 The ability of nanoceria to react catalytically with reactive oxygen species has made it interesting for use in biomedical applications, such as therapeutic agents in the treatment of diseases related to oxidative stress, including obesity, wound healing, retinal degeneration, and Alzheimer’s disease.5–10
Increased consumer and worker exposure to nanoceria combined with sparse availability and conflicting toxicological information have raised concerns for health effects in the human population.3,11,12 Systemic uptake of nanoceria is quite low (typically <1% for inhalation and even less for oral exposure), nevertheless bioaccumulation may occur due to slow dissolution and excretion.13–15 Acute toxicity is considered to be low; however, long-term inhalation and oral studies show that toxicity may occur in tissues distant to the uptake site, suggesting systemic uptake is of importance.3,16–18 For example, high oral doses of nanoceria caused severe liver, spleen, and brain damage in rats.17 The results of safe-by-design concepts used in an attempt to reduce toxicity are promising. For example, the lung inflammatory response to intratracheal (IT) instillation of nanoceria coated with amorphous silica was lower compared to uncoated nanoceria.19
To better predict the toxic effects and toxic mechanisms of nanomaterials, understanding their biokinetics is crucial. Biokinetics can be elucidated by physiologically based pharmacokinetic (PBPK) modeling. The PBPK model converts physiological and anatomical properties to mass balance equations and describes the time-dependent fate of substances in the body, linking exposure to the internal (target) dose.20,21 By use of experimental data from biodistribution studies, the model can be developed, calibrated, refined, and validated.22,23 There is a limited number of PBPK models for nanoparticles, and to our knowledge, so far, no model for intravenous (IV) exposure has been calibrated and validated for nanoceria.24–51
Modeling efforts have demonstrated that there are many challenges to the development of models for nanoparticles.22,23,52 The biological activity of nanoparticles differs from their solute and larger forms.53–59 However, these factors are not well characterized in quantitative terms and thus not readily implemented in PBPK models. One limiting factor in the development of PBPK models for nanoparticles is the availability of rich in vivo data, with well-characterized properties of nanoparticles, multiple doses, multiple tissues, and multiple sampling times. The IV route is important as bioavailability is 100%; hence, IV studies serve as a reference when studying biokinetics after exposure via other routes. In addition, IV dosing is the likely choice if nanoceria are to be used as therapeutic agents, since bioavailability via other routes is low.
In this study, we applied our previously developed PBPK model for different nanoparticles given IV to rats to nanoceria of different sizes and coatings.52 We further modified the model to account for inhalation, IT instillation, and oral exposures to nanoceria.
Materials and methods
Data source
Experimental data on the biodistribution of nanoceria administered to rats were collected from the literature or received directly from authors. Data published only in graphs were extracted using WebPlotDigitizer version 2.6. Only studies where dose and tissue levels of nanoceria could be converted to mass or concentration were included. Data were converted to cerium dioxide concentration. We found eight publications of biodistribution studies with IV exposure, reporting 21 data sets with different nanoceria sizes (3, 5, 15, 30, 40, and 55 nm), coatings (uncoated, citrate, or EDTA-citrate), doses (between 6 and 750 mg/kg), and dosing methods (bolus and infusion).15,60–66 Inhalation or IT instillation were addressed in seven publications, which included 14 data sets.13,14,18,49,53,67,68 Oral uptake was described in six publications, which included 12 data sets.14,17,53,67,69,70 The experimental studies are summarized in Tables 1–4.
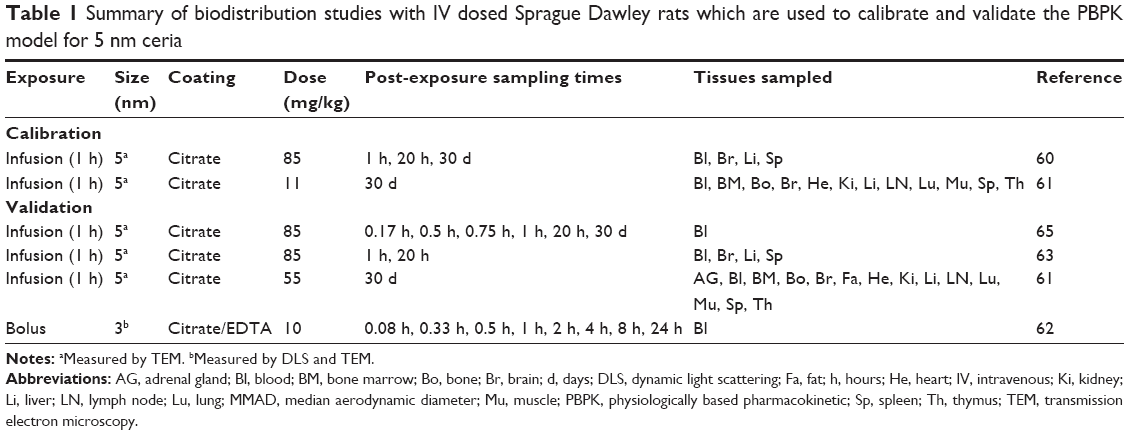 | Table 1 Summary of biodistribution studies with IV dosed Sprague Dawley rats which are used to calibrate and validate the PBPK model for 5 nm ceria |
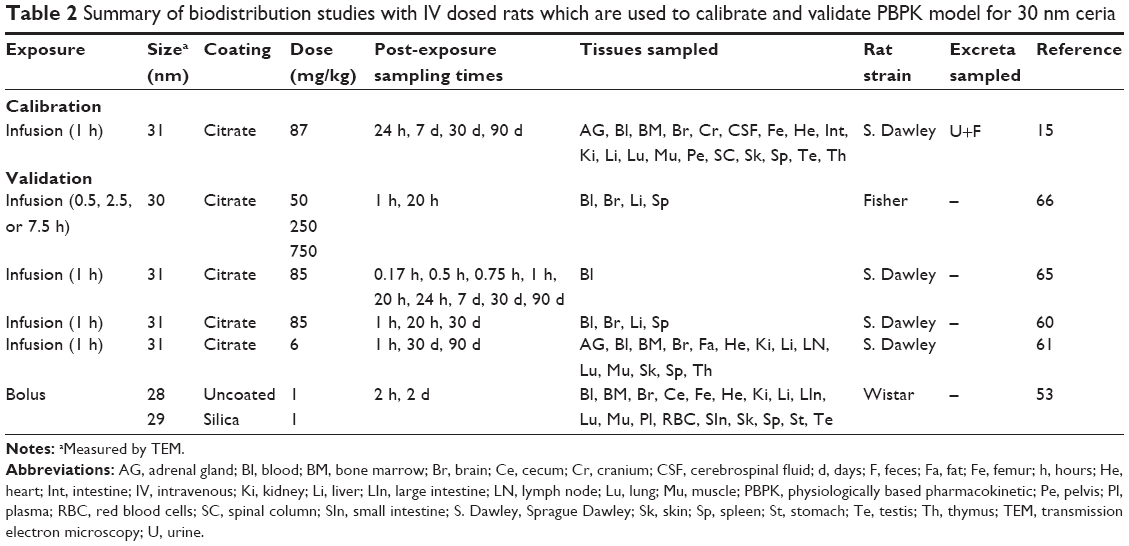 | Table 2 Summary of biodistribution studies with IV dosed rats which are used to calibrate and validate PBPK model for 30 nm ceria |
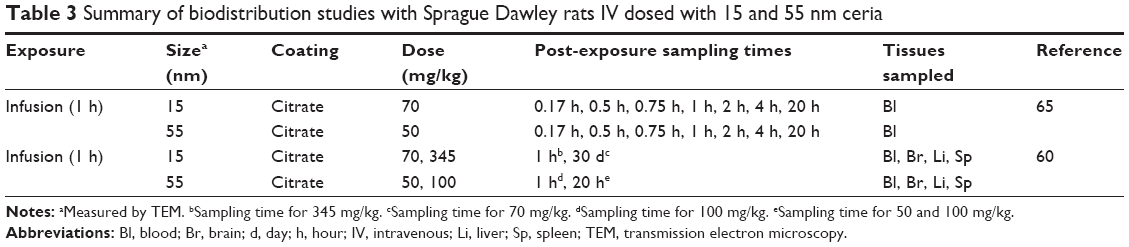 | Table 3 Summary of biodistribution studies with Sprague Dawley rats IV dosed with 15 and 55 nm ceria |
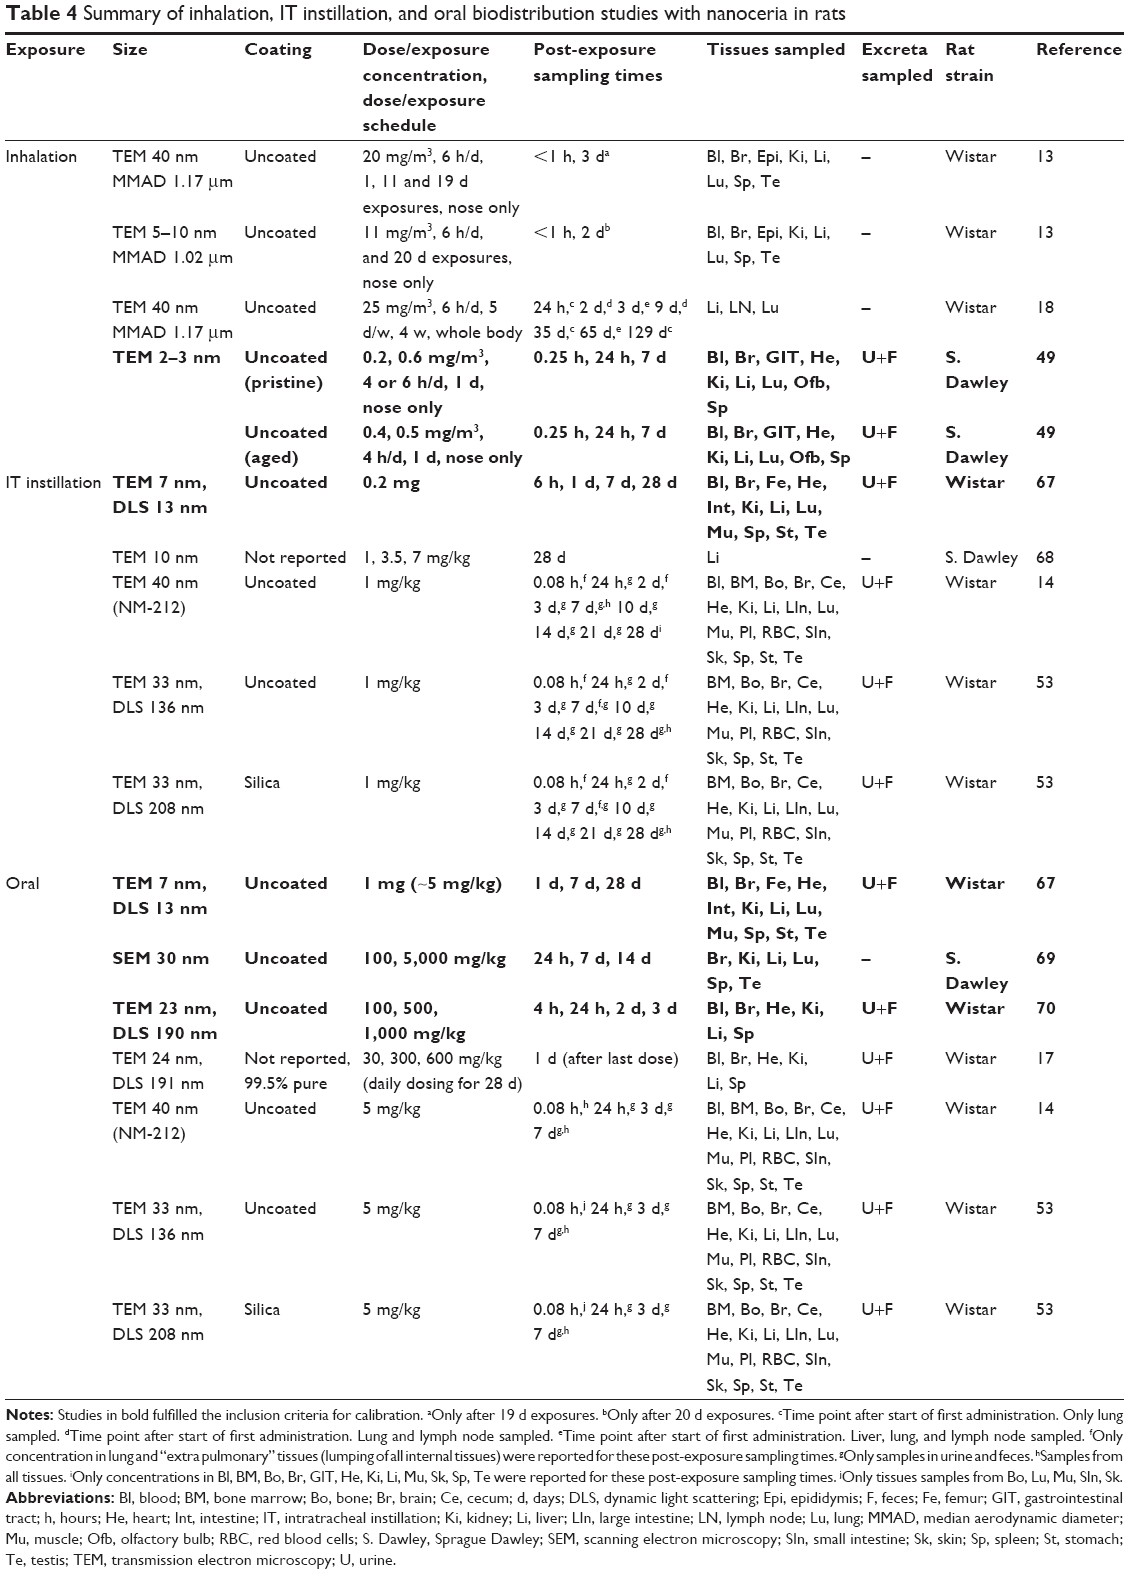 | Table 4 Summary of inhalation, IT instillation, and oral biodistribution studies with nanoceria in rats |
Due to the limited and scattered nature of these biodistribution studies, assigning the data to calibration and validation sets could not be randomized. Instead, the data sets for calibration were chosen based on the following inclusion criteria: 1) the total recovered mass in analyzed tissues should be at least 25% of the injected dose, and 2) nanoceria levels should be reported for more than four internal tissues and include at least three time points. The remaining data sets were used for validation.
Comparison of biodistribution data for the non-IV exposure routes
The collected data sets for biodistribution after inhalation exposure, IT instillation, and oral administration varied in study design (dose, dose frequency, sampling frequency, and collected tissues), and the nanoceria used had different properties.
Only the administered dose was given in these data sets, the systemically absorbed fraction being unknown. However, liver is a major target tissue for nanoceria and the most frequently sampled internal organ in the data sets. The nanoceria mass in liver was therefore used as a surrogate for systemic absorption; this allowed for comparison among the different studies. Nanoceria translocation from the lung and gastrointestinal tract was thus calculated by dividing the mass in liver with the IT and orally administered dose, respectively. For inhalation, the nanoceria mass in lung was used instead of administered dose.
Reported delivered dose and internal organ concentrations differed substantially among exposure routes. To allow for comparisons of the biodistribution among data sets and exposure routes, the experimental data were first normalized by dividing the nanoceria concentration in each tissue by the average concentration in the liver, here called the tissue:liver concentration ratio.
PBPK model structure
Studies of nanoceria given IV to rats show, as do similar studies with other nanoparticles, that nanoceria are captured by phagocytic cells (PCs) in tissues belonging to the mononuclear phagocyte system (MPS), including liver, spleen, and bone marrow.14,53,61,63 Once distributed to the MPS, nanoceria reside there for a long time.14,15 We based the PBPK model on the one previously developed by Carlander et al.52 The model consists of 10 compartments: arterial blood, venous blood, liver, spleen, lung, kidney, heart, brain, bone marrow, and other tissues (Figure 1). Each compartment is divided into three sub compartments: 1) blood in tissue, 2) tissue, and 3) PCs in the tissue, with venous and arterial blood described by two subcompartments: blood and PCs.
 | Figure 1 Schematic illustration of the physiologically based pharmacokinetic (PBPK) model. |
The PCs are described by a particle-dependent uptake rate constant (Ksab0 for spleen and Kab0 for all other tissues), an exocytosis rate constant (Kde), and a maximum uptake capacity (Mcap). With one exception (Ksab0), all PCs are assumed to have the same properties (ie, same Kab0 and Mcap), and only their numbers (a particle-independent parameter) differ among compartments. The model includes flow and diffusion-limited processes from blood to tissues described by three permeability coefficients (Xfast for liver, spleen, and bone marrow; Xbrain for the blood–brain barrier; and Xrest for other tissues). Partitioning between blood and other tissues is expressed by a partition coefficient (P). Excretion occurs from the liver and kidney and is accounted for by clearance rate constants (CLf and CLu, respectively).
Systemic uptake after inhalation, IT instillation, and oral exposure is addressed by adding a first-order absorption compartment to the PBPK model. The absorption rate constant (a route- and particle-dependent parameter) was obtained by best fit to each data set. Clearances from the lungs via the mucociliary escalator and from the gastrointestinal tract to feces are also described by first-order kinetics and were obtained by best fit to the respective data sets. Dissolution of nanoceria has been reported but experimental data useful for modeling are lacking so far.71 For this reason, dissolution is not included in the model.
Model calibration
The model was parameterized by best fit against experimental tissue concentrations of nanoceria given IV to rats. All physiological (nanoparticle independent) parameters of the model were kept the same as previously reported by Carlander et al (Table S1), except for scaling to body weight in the individual experiments.52 The fitted (nanoparticle-dependent) parameters were CLf, CLu, kab0, ksab0, kde, P, Mcap, Xbrain, Xrest, and Xfast.
As size has been reported to influence the biokinetics of nanoparticles, the model was fitted against 5 and 30 nm experimental IV data separately.15,60,61 Excretion data for nanoceria have only been reported for 30 nm particles, where the amount of nanoceria recovered in feces and urine was reported to be <0.5% and 0.01% of the dose, respectively.14,15 The clearance rate constants for urine and feces were estimated during the calibration of the PBPK model for 30 nm ceria and next used as fixed values in the calibration of 5 nm ceria.
For calibration of the model for 5 nm ceria, we used two sets of experimental data reported by Yokel et al (85 mg/kg, 1 h infusion, and 11 mg/kg, 1 h infusion) (Table 1).60,61 Both the data sets cover three sampling times (1 h, 20 h, and 30 d post-infusion) and report concentrations for all tissues defined in our PBPK model. Calibration of the model for 30 nm ceria was carried out using the richest available data set (number of tissues collected, number of sampling times, and time span) (87 mg/kg, 1 h infusion) (Table 2).15 This data set covers four sampling times and cerium concentrations in all tissues in our model as well as in urine and feces.
Regarding inhalation, IT instillation, and oral exposure studies, only one study for inhalation, one for IT instillation, and three for the oral route fulfilled the calibration criteria (Table 4). The studies that did not fulfill the calibration criteria were used to calculate liver:dose ratios for comparison among exposure routes. The calibration involved fitting each data set by changing nanoparticle-dependent parameters, the absorption rate constant (all three routes), the mucociliary clearance rate constant (inhalation and IT instillation), and the gastrointestinal clearance rate constant (oral route).
In the calibration using inhalation, IT instillation, and ingestion data, we departed from the initial calibration with 5 and 30 nm IV data and added two route-dependent rate constants, for absorption (all three routes) and clearance (mucociliary for inhalation and IT instillation, gastrointestinal for the oral route). We first tried to achieve calibration by fitting all nanoparticle-dependent parameters. However, no results could be obtained due to the high number of parameters combined with relatively few data points and widely disparate experimental data. In a second attempt, we considered the parameters from the IV calibration and fitted the route-dependent parameters only.
Model validation
The model was validated with additional independent biodistribution studies that used 5 and 30 nm, or similarly sized, ceria. In addition, as proposed by the WHO, the validation was considered adequate if the simulated values were within a factor of two of the measured mean values.21
Four IV data sets were used for the validation of our PBPK model for 5 nm ceria (Table 1),61–63,65 and for the 30 nm PBPK model, five IV data sets (Table 2)53,60,61,65 were used. The data sets cover doses of 1–750 mg/kg, infusion durations between 0 and 7.5 h, and post-dosing sampling up to 90 days. The nanoceria were either uncoated or coated with citrate, citrate/EDTA, or silica.
Sensitivity analysis
Local sensitivity analyses were carried out to identify the most influential model parameters. Normalized sensitivity coefficients were calculated by dividing the percent change in the area under the concentration–time curve in tissues (blood, liver, spleen, brain, and PCs) by the percent change in different model parameters, as described by Carlander et al.52
Modeling software and algorithms
Computer simulations were carried out with acslX Libero™ version 3.0.2.1 using the Gear algorithm or Berkeley Madonna™ version 8.3.18 using the Runge-Kutta (4th-order) method. AcslX Libero with the Nedler Mead method was used for optimization.
The overall goodness of fit between the simulated and experimental data was evaluated using linear regression in GraphPad Prism 6 (GraphPad Software, Inc., La Jolla, CA, USA).
Results
IV exposure – 5 nm ceria
As shown in Figure 2, the PBPK model adequately describes the measured concentration of 5 nm ceria in liver, brain, and bone marrow (less than twofold differences) and in blood, spleen, lung, kidney, and heart reasonably well (less than 10-fold difference). Furthermore, the simulated values correlate well with the experimental data reported by Yokel et al in 2013 (Figure S1A) and correlate reasonably well with those reported by Yokel et al in 2014 (Figure S1B).60,61 The overall coefficient of determination (R2) for both the data sets is 0.91 (Figure 2).
 | Figure 2 Physiologically based pharmacokinetic (PBPK) model calibration of 5 nm ceria administered intravenously to rats. |
Four independent data sets were used to validate the PBPK model for 5 nm ceria. In three of the data sets, the properties were identical to those in the calibration data sets, whereas in the fourth, the size (3 nm instead of 5 nm) and coating (citrate/EDTA instead of citrate only) differed slightly. The simulations indicate differences in time courses in blood between these two types of nanoceria. Thus, for the 5 nm ceria, the model predicts well the most observed concentrations in tissues, whereas for the 3 nm ceria, it underpredicts the concentration in blood at every time point, suggesting dependence on size and coating (Figures 3 and S2). This suggests that EDTA/citrate coating prolongs the circulation time in blood, a conclusion also drawn by Heckman et al.62
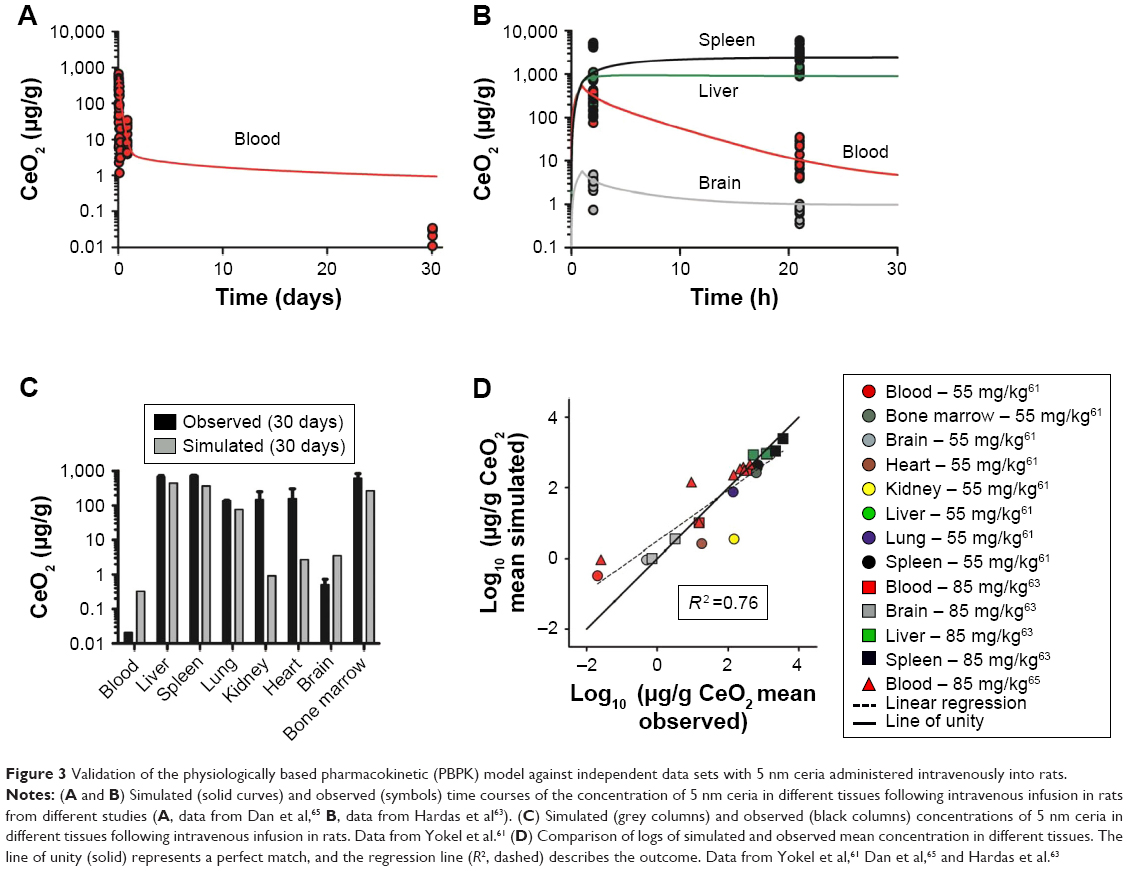 | Figure 3 Validation of the physiologically based pharmacokinetic (PBPK) model against independent data sets with 5 nm ceria administered intravenously into rats. |
The sensitivity analysis showed that the concentrations in the different compartments are influenced by physiological- and nanoparticle-dependent parameters and dose and are time dependent (Figure 4 and Tables S2–S7, sensitivity coefficients are shown for two time points only for each dose set). The most influential nanoparticle-dependent parameters are kab0, ksab0, Mcap, P, Xbrain, and Xrest, as described further in the “Discussion” section (Figure 4). As a consequence of nonlinear kinetics in the model (saturation of PCs), the concentration in tissues does not increase in proportion to dose as dose increases from 11 to 85 mg/kg. This nonlinearity is seen as sensitivity coefficients that change with dose (Figure 5). For most tissues, the sensitivity coefficients generally increase with dose rate. For liver, the trend is opposite with decreasing sensitivity coefficients for all examined nanoparticles (Figure 5C).
 | Figure 4 Sensitivity analyses of the physiologically based pharmacokinetic (PBPK) model calibrated with 5 and 30 nm ceria administered intravenously to rats. |
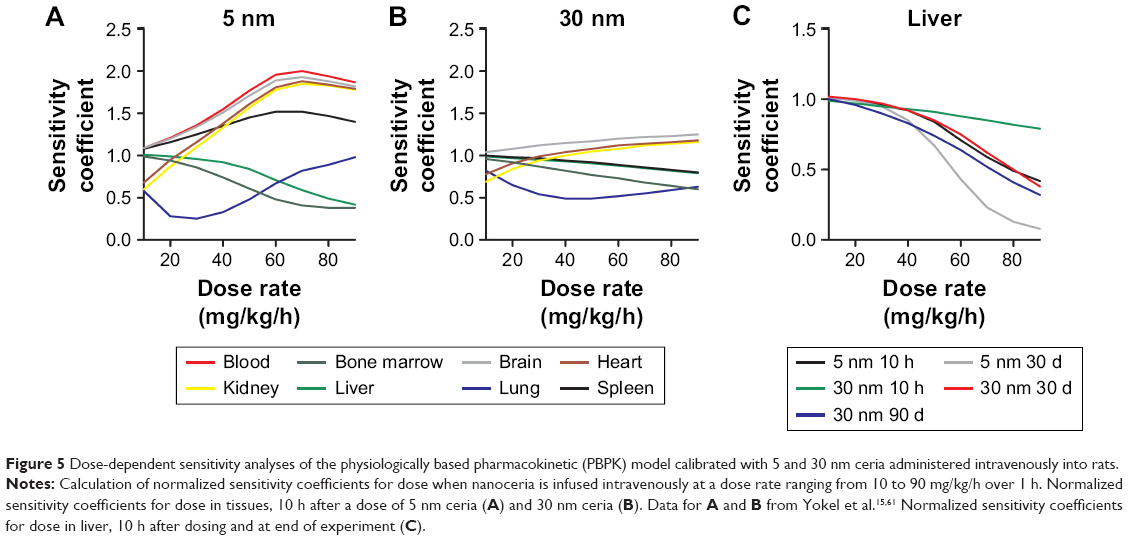 | Figure 5 Dose-dependent sensitivity analyses of the physiologically based pharmacokinetic (PBPK) model calibrated with 5 and 30 nm ceria administered intravenously into rats. |
IV exposure – 30 nm ceria
The model describes the experimental data for 30 nm ceria fairly well with a reasonable correlation between simulated and measured values (R2 =0.82, Figure 6). In particular, the time courses in liver and bone marrow are adequately captured with less than twofold difference between measured and simulated values. However, the increases in concentration observed after 90 days compared to 30 days after dosing in various tissues (blood, brain, heart, lung, and spleen) are not well captured, that is, the model overestimates at 30 days but underestimates at 90 days (Figure 6).
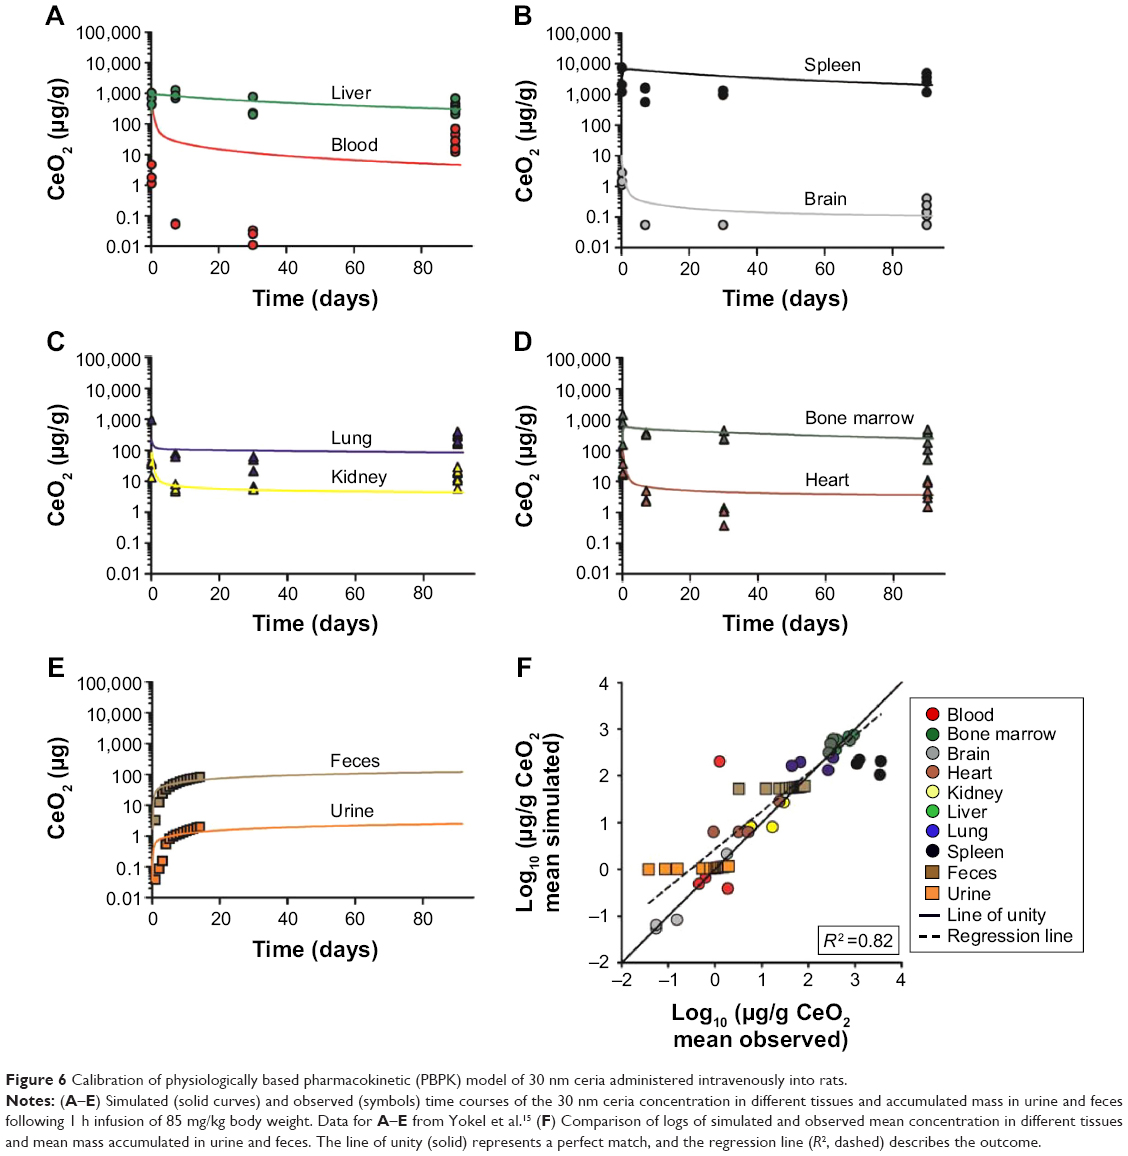 | Figure 6 Calibration of physiologically based pharmacokinetic (PBPK) model of 30 nm ceria administered intravenously into rats. |
As expected, the nanoparticle-dependent parameters obtained for 30 nm ceria deviate from those obtained for 5 nm ceria (Table 5). Four of the fitted nanoparticle-dependent parameters (kab0, kde, Mcap, and Xfast) are similar, that is, within a factor of 2. The remaining four parameters differ more, thus, the uptake rate constant for PCs in spleen (ksab0) is 22-fold lower; the partition coefficient between blood and tissues (P) is fivefold lower; the coefficient of permeability from blood to lung, kidney, heart, and carcass (Xrest) is eightfold lower; and the coefficient of permeability from blood to brain (Xbrain) is 242-fold lower for the 30 nm compared to 5 nm ceria.
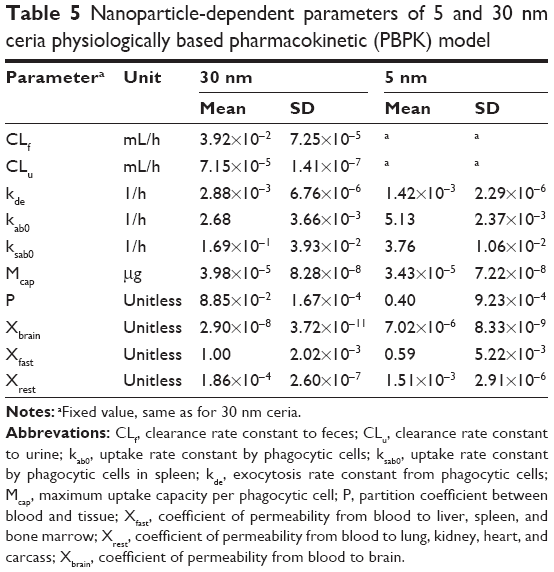 | Table 5 Nanoparticle-dependent parameters of 5 and 30 nm ceria physiologically based pharmacokinetic (PBPK) model |
The validation of the model against independent data from 30 nm ceria show poor predictions for most tissues (Figures 7 and S3–S10). The predictions are somewhat better for liver and spleen, compared to other tissues. Half of the predictions are within twofold of the experimental values.
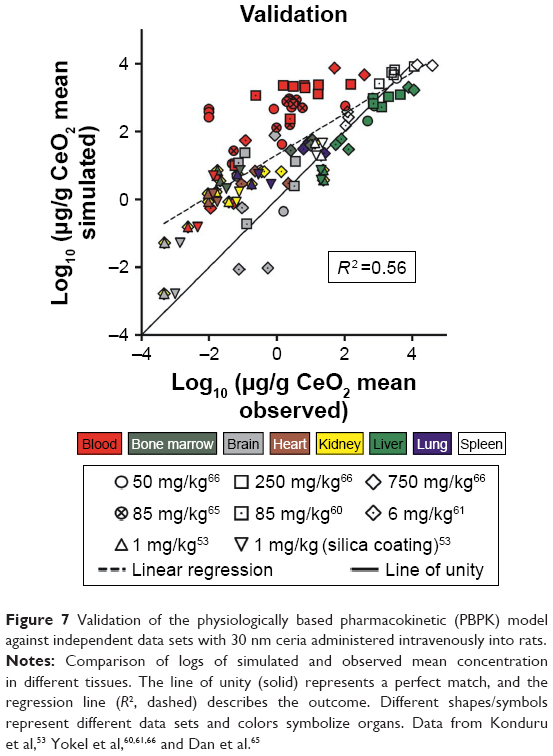 | Figure 7 Validation of the physiologically based pharmacokinetic (PBPK) model against independent data sets with 30 nm ceria administered intravenously into rats. |
The sensitivity analysis for the 30 nm ceria shows similar pattern as for 5 nm but with fewer highly sensitive parameters (Figure 4 and Tables S2–S7). The most influential nanoparticle-dependent parameters are kab0, ksab0, Mcap, P, and Xrest. A change in maximum uptake capacity of PCs has less influence on the sensitivity coefficient in the 30 nm model than in the 5 nm model (Figure 4). Similar to the 5 nm PBPK model, the 30 nm PBPK model suggests nonlinear (saturated) biokinetics for nanoceria.
IV exposure – other sizes
It was not possible to calibrate the model for 15 and 55 nm ceria due to the limited and scattered experimental data. We therefore compared these two data sets to predictions based on the calibrations obtained with the 5 and 30 nm data. For both the data sets, the 5 nm provides better predictions than the 30 nm calibration. A closer look at the simulations reveals that the predictions for liver and spleen are reasonable, whereas those for blood and brain are poorer. For the 15 nm ceria, all liver and spleen values are within twofold difference, whereas for the 55 nm ceria, 80% are within fivefold and none differ more than 10-fold (Figures S11 and S12).
Inhalation, IT instillation, and oral exposure
The compilation of data from inhalation, IT instillation, and oral biodistribution studies underscores that the systemic uptake via these routes is limited, in agreement with conclusions previously reached by others (Figure 8).16 Less than 1% (on mass basis) of the administered dose was distributed from lung to liver, and after oral gavage, the uptake to liver was <0.001%.
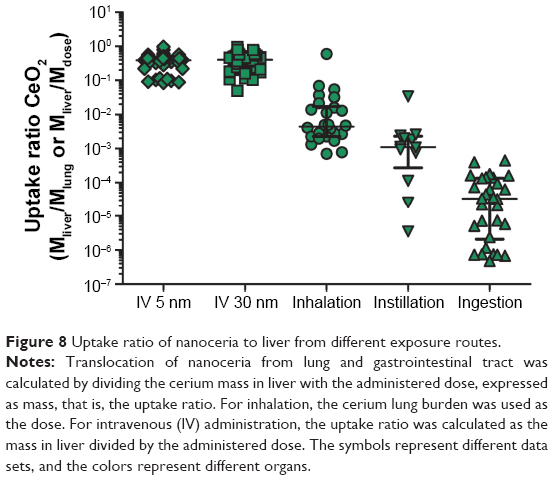 | Figure 8 Uptake ratio of nanoceria to liver from different exposure routes. |
As systemic bioavailability differs among exposure routes, we normalized the time courses of concentration in tissues to that in liver. A comparison of the time courses to the blood:liver, spleen:liver, and brain:liver concentration ratios suggest several orders of magnitude of differences, between and among the IV, inhalation, IT instillation, and oral routes (Figures S13–S15). The time courses of the tissue:liver concentration ratios differ not only among exposure routes and studies but also between tissues (Figures S13–S15).
In spite of differences in size and coatings, the time courses of the ratios after IV administration differed distinctly from the ratios for other exposure routes, illustrated, for example, by the clearly lower blood:liver concentration ratios and the apparently higher spleen:liver concentration ratios (Figures S13–S15). Noticeably and expected, the concentration in brain was substantially lower than in liver after IV administration (3–5 orders of magnitude) and IT instillation (2–4 orders of magnitude) compared to inhalation exposure (0–2 order of magnitude), suggesting uptake via olfactory nerves (Figure S15). This contrasts to the distribution after oral dosing where, with few exceptions, the concentrations in brain are in the same range as, or up to 1 order of magnitude lower than, in the liver. Finally, this suggests that the exposure route has a large influence on the biokinetics.
The first calibration efforts with inhalation, IT instillation, and oral data were unsuccessful, in that the model parameters could not be estimated. In a second attempt, calibrations were performed by adjusting the route-specific parameters only and keeping all other model parameters from the 5 and 30 nm calibrations. With the second approach, the calibration was still unsuccessful for data set 1 from Li et al.49 No calibration of the Kumari et al study was carried out as these data were considered uncertain due to the small amounts recovered in feces and analyzed organs, apparently <10% of the administered dose (Figure S16).70 With few exceptions, poor fits were achieved for the remaining data sets (Figures S17–S23).17,49,67,69,70
Discussion
The PBPK model described herein is the first to describe the biokinetics of nanoceria injected IV in rats. In line with previous studies, our simulations give additional support that both properties of nanoparticles (size and coating) and exposure conditions (dose and route) affect the biokinetics of nanoceria.53,60 It should be noted that there are data available on experimental biokinetics of nanoceria in mice.72–74 However, rats and mice differ substantially, especially with respect to the anatomy of the spleen and the properties of the MPS, which requires modification of the model.75–77
In a unique attempt to compare different exposure routes using PBPK modeling, the model structure was modified to include inhalation, instillation, and oral administration. However, modeling of these routes was difficult, and the results were inconclusive. We did not include intraperitoneal exposure as this route is not relevant for environmental exposure or pharmacological treatment. Moreover, when we carried out a literature search on IP administration, we did not find any suitable biodistribution data for PBPK modeling.
The model adequately predicts the biokinetics of 5 nm ceria with citrate coating given IV to rats. The model is less successful in capturing the kinetics of other sizes of nanoceria, which partly can be explained by the larger spread in properties among these particles. Size-dependent uptake of nanoparticles in PCs has been reported by several research groups, and the optimum uptake by cells seems to occur for sizes around 40–60 nm.78,79 However, several other factors may also affect the uptake and excretion, such as cell type, nanoparticle–membrane binding energy, nanoparticle curvature, and corona composition.80–83 In our simulations, some of the fitted parameters differed between 5 and 30 nm ceria suggesting size dependencies, whereas other parameters were similar for the two nanoceria sizes. Overall, our modeling results point to dependence not only on size but also on coating, dose, and exposure route on the biokinetics.
Coating is a known modifying factor of biokinetics for nanoparticles, including nanoceria.53,58,62 According to Heckman et al, the clearance of nanoceria from blood is reduced when EDTA is added to the citrate coating.62 Our model is well in line with this finding as our model, calibrated with citrate-coated 5 nm ceria, predicts a faster clearance than observed in experimental data with citrate/EDTA-coated 3 nm ceria.62 Heckman et al argued that the prolonged blood circulation time observed for citrate/EDTA-coated nanoceria compared to citrate-coated nanoceria may be explained by fewer adsorbed proteins, resulting in reduced recognition and uptake by the mononuclear phagocytic system.62 Similarly, Konduru et al proposed that the alteration in biodistribution patterns between uncoated and silica-coated nanoceria correlates with differences in the corona composition.53
Our PBPK model includes saturable uptake of nanoceria in PCs as a major feature. At sufficiently high doses, tissue levels will be less than proportional to dose as the PCs approach saturation. Moreover, PCs are unevenly distributed among tissues and permeability into tissues varies, as high, medium, or low (Xbrain, Xfast, and Xrest). Therefore, the nanoceria distribution pattern will change as the dose increases. To develop reliable and validated PBPK models, one would need to validate them against low (non-saturating) as well as high (saturating) doses. Unfortunately, nearly all experimental studies that could be used for modeling used a single dose only, or a very narrow dose span (Tables 1–4).
Our model was not designed to, and cannot, account for the peculiar biokinetic behavior seen in one of Yokel et al studies, where the concentration increased up to three orders of magnitude in various tissues between 1 and 3 months after IV infusion of 30 nm ceria (Figure 6).15 One possible explanation might be the dissolution of nanoceria in the liver and subsequent release of cerium ion, resulting in increased cerium in the blood and redistribution to the spleen.71,84 On the other hand, the observed biokinetic pattern is not consistent with that reported for cerium ion.14 If this peculiar increase is indeed a true biokinetic phenomenon, better understanding of the underlying physical or physiological mechanisms is needed in order to further develop the PBPK model. In addition, improved quantitative analytical methods that are able to distinguish between primary and secondary cerium oxide nanoparticles and cerium ions would be needed.
When comparing the experimental data for different exposure routes, it quickly became apparent that the present PBPK model is unable to describe the biokinetics for the non-IV routes. This was later confirmed during our modeling efforts. However, our comparison of the experimental data for IV, inhalation, instillation, and oral exposure suggests that the tissue distribution pattern is a result of the need for nanoceria to cross epithelial barriers before reaching the systemic circulation (see Figures S13–S15 for time course plots of tissue:liver concentration ratios for the different exposure routes). Modification of biodistribution as a result of exposure route has also been demonstrated for other types of nanoparticles such as gold.85,86 These pattern changes may be due to a “true” route dependency, but may also reflect differences in nanoparticle property, dose, tissue sampling techniques, sample treatment, analytical method, and so on among the studies. The underlying mechanisms are unclear; however, modified protein binding has been suggested as a likely factor.86 Additional studies are needed to understand the possible route dependency and to rule out other experiment-related factors.
Development, calibration, and validation of PBPK models for nanoparticles require reliable and relevant experimental data that provide information about properties of nanoparticles as well as quantities in several tissues at multiple time points over extended periods. Among all published reports on nanoceria, only a few data sets comprised this type of information. Small sample size in combination with high intra- and inter-individual variability and method error are other complication factors for modeling as these lower the confidence in the parameter estimates as well as the model structure. An additional problem with the non-IV exposure routes is that absorption is generally low, resulting in very low tissue levels, sometimes below the detection limit and/or not different from background.
In the data sets provided by Yokel et al, we had access to raw data, and hence individual data on body weight and tissue weights could be used in the model.15,60,61,63,65,66 Information for the other data sets are more uncertain as they were reported as mean values. The latter situation typically reflects how data are reported in published biodistribution studies where individual data points are rarely provided. More frequent reporting of individual data would be helpful to improve model development and to facilitate discrimination between variability and uncertainty.
Due to lack of quantitative physiological knowledge, several of the PBPK parameters had to be fitted to experimental data. Such approaches may result in over parameterization, especially if the experimental data are limited to a few tissues and time points. In this study, 10 parameters were optimized and 156 data points were used to calibrate the model. Noteworthily, the number of data points were well above the number of parameters optimized which reduces the risk for over fitting. In addition, the model has successfully been used to describe the biokinetics of other nanoparticles (titanium dioxide, gold, and polyethylene-coated and -uncoated polyacryl amide) administered IV.38,52
A parameter with a high sensitivity coefficient means that a small change in this parameter will have a high impact on the model output. Reliable experimental data on these parameters are hence critical. On the other hand, a parameter with very low sensitivity can have a range of values with negligible impact on the output. Model estimates of such parameters are thus more uncertain. Overall, the sensitivity analysis showed time, dose, and size dependencies (Figure 4, Tables S2–S7). The model parameters were generally more sensitive for the 5 nm than 30 nm ceria, and in addition, the sensitivity of the parameters increased with dose. The dose-dependent increase in sensitivity can be explained by increased nanoceria burden in the PCs, expressed as higher sensitivity coefficients for such parameters as the maximum uptake capacity per PC (Mcap), number of PCs per gram liver (ncap in liver), and liver fraction of body weight (kwl) (Tables S2–S7).
Experimental values for physiologically based parameters can be found in the literature, and many of them can also be readily measured.87,88 However, reliable data on, for example, residual amount of blood in tissues and number of PCs in tissues are sparse. Relevant and reliable experimental data on nanoparticle-dependent parameters are more difficult to find. Methods, primarily in vitro, are under development, but the result will depend on the properties of the nanoparticles and the test method used.46,89–91 Correlations between in vitro and in vivo results need to be established to make route-to-route extrapolations.92 Consequently, it is difficult, at least so far, to predict how properties of nanoparticles may affect the parameters of the PBPK model.
The biological environments in the gastrointestinal tract and the lungs differ from that in blood, and this may affect the behavior of the nanoparticles with respect to processes such as agglomeration, corona formation, and nanoparticle dissolution.57,93–95 These processes depend not only on the environment but also on the properties of nanoparticles and contribute to changes in the biodistribution pattern.54,81,96 There are also indications that the processes are dynamic and change over time.54,97,98 Hence, an obvious next step would be to examine if introduction of these processes in the PBPK model improves the predictions. To our knowledge, there is no PBPK model for nanoparticles with physically relevant descriptions of agglomeration, corona formation, and dissolution, although dissolution has been empirically implemented in PBPK models for silver and zinc.35,45 A limiting factor is that the three processes have so far not been well characterized in quantitative terms, and consequently, they cannot yet be used in PBPK modeling.54
Our model has a simplified structure that describes the deposition and transport processes in the lung and gastrointestinal tract. Research groups have shown that a more complex model structure for deposition and clearance in the respiratory system via mucociliary clearance to pharynx and uptake to brain via olfactory and trigeminal nerves is more adequate to predict the deposition of inhaled nanoparticles.47,49 Systemic uptake of nanoparticles via the lymphatic system and subsequent distribution to tissues has been demonstrated but so far not incorporated in any PBPK model for nanoparticles.99,100 This can be explained by the challenge in visualization and sampling of lymph nodes and the small amounts of nanoparticles therein; thus, the observations are qualitative rather than quantitative. Even if incorporated, the model would still not be able to explain the route-dependent biodistribution patterns.
Our study illustrates well the usefulness of PBPK modeling to better understand the biokinetics of nanoparticles. First, PBPK modeling can be used to challenge or generate hypotheses. Thus, the PBPK model described herein supports the hypothesis that coating and size influence biokinetics. Second, PBPK models can be used to identify knowledge gaps. In this study, we identified the need to update future models with mechanistic understanding of exposure route dependencies and nanoparticle interactions with body fluids such as corona formation, agglomeration, and dissolution. Third, PBPK models may be used to improve the design of experimental studies. Our modeling efforts suggest dose- and route-dependent biokinetics of nanoceria. Hopefully this will be taken into consideration when future biodistribution studies are designed. Fourth, PBPK models can be used to predict the biokinetics and tissue doses for new exposure scenarios without need for new experiments. This is particularly important in risk assessment of nanoparticles when there seems to be dose- or route-dependent biokinetics.
Conclusion
The PBPK model could adequately describe and predict the biokinetics for 5 nm ceria with citrate coating given IV but less well so for other sizes. For non-IV exposure routes, calibration was difficult due to low absorption, few samples, widely disparate data, and concentrations below or close to the detection limit. However, the tissue time courses seemed to differ from those in the IV experiments and had shapes that were difficult to reproduce with the PBPK model. Overall, our modeling results suggest that the biokinetics of nanoceria depend not only on the properties of nanoparticles (size and coating) but also, and even more so, on the exposure conditions (route and dose). Inclusion of physically and physiologically adequate descriptions of lung deposition, agglomeration, corona formation, and dissolution is needed. This requires improved mechanistic understanding and targeted experimental studies.
Acknowledgments
The study was financed by the Swedish Research Council for Health, Working Life and Welfare (Forte, grant number 2010-0702), Sweden, and by the United States Environmental Protection Agency Science to Achieve Results (grant number RD-833772). Although the research described in this article has been funded in part by the United States Environmental Protection Agency through STAR Grant RD-833772, it has not been subjected to the Agency’s required peer and policy review and therefore does not necessarily reflect the views of the Agency and no official endorsement should be inferred.
Author contributions
All authors contributed toward data analysis, drafting, and critically revising the paper and agree to be accountable for all aspects of the work.
Disclosure
The authors report no conflicts of interest in this work.
References
Sun CW, Li H, Chen LQ. Nanostructured ceria-based materials: synthesis, properties, and applications. Energy Environ Sci. 2012;5(9):8475–8505. | ||
Melchionna M, Fornasiero P. The role of ceria-based nanostructured materials in energy applications. Mater Today. 2014;17(7):349–357. | ||
Cassee FR, van Balen EC, Singh C, et al. Exposure, health and ecological effects review of engineered nanoscale cerium and cerium oxide associated with its use as a fuel additive. Crit Rev Toxicol. 2011;41(3):213–229. | ||
Castano CE, O’Keefe MJ, Fahrenholtz WG. Cerium-based oxide coatings. Curr Opin Solid State Mater. 2015;19(2):69–76. | ||
Celardo I, Pedersen JZ, Traversa E, Ghibelli L. Pharmacological potential of cerium oxide nanoparticles. Nanoscale. 2011;3(4):1411–1420. | ||
Rocca A, Moscato S, Ronca F, et al. Pilot in vivo investigation of cerium oxide nanoparticles as a novel anti-obesity pharmaceutical formulation. Nanomedicine. 2015;11(7):1725–1734. | ||
Walkey C, Das S, Seal S, et al. Catalytic properties and biomedical applications of cerium oxide nanoparticles. Environ Sci Nano. 2015;2(1):33–53. | ||
Chigurupati S, Mughal MR, Okun E, et al. Effects of cerium oxide nanoparticles on the growth of keratinocytes, fibroblasts and vascular endothelial cells in cutaneous wound healing. Biomaterials. 2013;34(9):2194–2201. | ||
Zhou XH, Wong LL, Karakoti AS, Seal S, McGinnis JF. Nanoceria inhibit the development and promote the regression of pathologic retinal neovascularization in the Vldlr knockout mouse. PLoS One. 2011;6(2):e16733. | ||
Kwon HJ, Cha MY, Kim D, et al. Mitochondria-targeting ceria nanoparticles as antioxidants for Alzheimer’s disease. ACS Nano. 2016;10(2):2860–2870. | ||
Integrated laboratory Systems (ILS). Chemical information profile for ceric oxide [CAS No. 1306-38-3]. Supporting Nomination for Toxicological Evaluation by the National Toxicology Program; 2006. Available from: http://ntp.niehs.nih.gov/ntp/htdocs/chem_background/exsumpdf/ceric_oxide2_508.pdf. Accessed March 12, 2018. | ||
Organisation for Economic Co-operation and Development (OECD). List of manufactured nanomaterials and list of endpoints for phase one of the sponsorship programme for the testing of manufactured nanomaterials: revision; 2010. Available from: http://www.oecd.org/officialdocuments/publicdisplaydocumentpdf/?cote=env/jm/mono(2010)46&doclanguage=en. Accessed March 12, 2018. | ||
Geraets L, Oomen AG, Schroeter JD, Coleman VA, Cassee FR. Tissue distribution of inhaled micro- and nano-sized cerium oxide particles in rats: results from a 28-day exposure study. Toxicol Sci. 2012;127(2):463–473. | ||
Molina RM, Konduru NV, Jimenez RJ, et al. Bioavailability, distribution and clearance of tracheally instilled, gavaged or injected cerium dioxide nanoparticles and ionic cerium. Environ Sci Nano. 2014;1(6):561–573. | ||
Yokel RA, Au TC, MacPhail R, et al. Distribution, elimination, and biopersistence to 90 days of a systemically introduced 30 nm ceria-engineered nanomaterial in rats. Toxicol Sci. 2012;127(1):256–268. | ||
Yokel RA, Hussain S, Garantziotis S, Demokritou P, Castranova V, Cassee FR. The yin: an adverse health perspective of nanoceria: uptake, distribution, accumulation, and mechanisms of its toxicity. Environ Sci Nano. 2014;1(5):406–428. | ||
Kumari M, Kumari SI, Grover P. Genotoxicity analysis of cerium oxide micro and nanoparticles in Wistar rats after 28 days of repeated oral administration. Mutagenesis. 2014;29(6):467–479. | ||
Keller J, Wohlleben W, Ma-Hock L, et al. Time course of lung retention and toxicity of inhaled particles: short-term exposure to nano-ceria. Arch Toxicol. 2014;88(11):2033–2059. | ||
Demokritou P, Gass S, Pyrgiotakis G, et al. An in vivo and in vitro toxicological characterisation of realistic nanoscale CeO2 inhalation exposures. Nanotoxicology. 2013;7(8):1338–1350. | ||
Johanson G. Toxicokinetics and modeling. In: McQueen C, editor. Comprehensive Toxicology. Vol 1, 3rd ed. 2018:165–187. Oxford: Elsevier Ltd. | ||
IPCS. Characterization and application of physiologically based pharmacokinetic models in risk assessment. IPCS Harmonization Project Document No. 9. Geneve, Switzerland: World Health Organization (WHO); 2010. Available from: http://www.who.int/ipcs/methods/harmonization/areas/pbpk_models.pdf. Accessed March 12, 2018. | ||
Lin Z, Monteiro-Riviere NA, Riviere JE. Pharmacokinetics of metallic nanoparticles. Wiley Interdiscip Rev Nanomed Nanobiotechnol. 2015;7(2):189–217. | ||
Li M, Al-Jamal KT, Kostarelos K, Reineke J. Physiologically based pharmacokinetic modeling of nanoparticles. ACS Nano. 2010;4(11):6303–6317. | ||
Snipes MB. Long-term retention and clearance of particles inhaled by mammalian species. Crit Rev Toxicol. 1989;20(3):175–211. | ||
Peng B, Andrews J, Nestorov I, Brennan B, Nicklin P, Rowland M. Tissue distribution and physiologically based pharmacokinetics of antisense phosphorothioate oligonucleotide ISIS 1082 in rat. Antisense Nucleic Acid Drug Dev. 2001;11(1):15–27. | ||
Lin P, Chen JW, Chang LW, et al. Computational and ultrastructural toxicology of a nanoparticle, Quantum Dot 705, in mice. Environ Sci Technol. 2008;42(16):6264–6270. | ||
Lee HA, Leavens TL, Mason SE, Monteiro-Riviere NA, Riviere JE. Comparison of quantum dot biodistribution with a blood-flow-limited physiologically based pharmacokinetic model. Nano Lett. 2009;9(2):794–799. | ||
Pery AR, Brochot C, Hoet PH, Nemmar A, Bois FY. Development of a physiologically based kinetic model for 99m-technetium-labelled carbon nanoparticles inhaled by humans. Inhal Toxicol. 2009;21(13):1099–1107. | ||
MacCalman L, Tran CL, Kuempel E. Development of a bio-mathematical model in rats to describe clearance, retention and translocation of inhaled nano particles throughout the body. J Phys Conf Ser. 2009;151(1):012028. | ||
Lankveld DP, Oomen AG, Krystek P, et al. The kinetics of the tissue distribution of silver nanoparticles of different sizes. Biomaterials. 2010;31(32):8350–8361. | ||
Opitz AW, Wickstrom E, Thakur ML, Wagner NJ. Physiologically based pharmacokinetics of molecular imaging nanoparticles for mRNA detection determined in tumor-bearing mice. Oligonucleotides. 2010;20(3):117–125. | ||
Li M, Reineke J. Mathemathical modelling of nanoparticle biodistribution: extrapolation among intravenous, oral and pulmonary administration routes. Int J Nano Biomaterials. 2011;3(3):222–238. | ||
Mager DE, Mody V, Xu C, et al. Physiologically based pharmacokinetic model for composite nanodevices: effect of charge and size on in vivo disposition. Pharmaceut Res. 2012;29(9):2534–2542. | ||
Li M, Panagi Z, Avgoustakis K, Reineke J. Physiologically based pharmacokinetic modeling of PLGA nanoparticles with varied mPEG content. Int J Nanomedicine. 2012;7:1345–1356. | ||
Bachler G, von Goetz N, Hungerbuhler K. A physiologically based pharmacokinetic model for ionic silver and silver nanoparticles. Int J Nanomedicine. 2013;8:3365–3382. | ||
Kolanjiyil AV, Kleinstreuer C. Nanoparticle mass transfer from lung airways to systemic regions – Part II: multi-compartmental modeling. J Biomech Eng. 2013;135(12):121004. | ||
Kagan L, Gershkovich P, Wasan KM, Mager DE. Dual physiologically based pharmacokinetic model of liposomal and nonliposomal amphotericin B disposition. Pharm Res. 2014;31(1):35–45. | ||
Li D, Johanson G, Emond C, Carlander U, Philbert M, Jolliet O. Physiologically based pharmacokinetic modeling of polyethylene glycol-coated polyacrylamide nanoparticles in rats. Nanotoxicology. 2014;8(S1):128–137. | ||
Rajoli RKR, Back DJ, Rannard S, et al. Physiologically based pharmacokinetic modelling to inform development of intramuscular long-acting nanoformulations for HIV. Clin Pharmacokinet. 2015;54(6):639–650. | ||
Bachler G, von Goetz N, Hungerbuhler K. Using physiologically based pharmacokinetic (PBPK) modeling for dietary risk assessment of titanium dioxide (TiO2) nanoparticles. Nanotoxicology. 2015;9(3):373–380. | ||
Dong D, Wang X, Wang HL, Zhang XW, Wang YF, Wu BJ. Elucidating the in vivo fate of nanocrystals using a physiologically based pharmacokinetic model: a case study with the anticancer agent SNX-2112. Int J Nanomedicine. 2015;10:2521–2535. | ||
Lin Z, Monteiro-Riviere NA, Riviere JE. A physiologically based pharmacokinetic model for polyethylene glycol-coated gold nanoparticles of different sizes in adult mice. Nanotoxicology. 2016;10(2):162–172. | ||
Gilkey MJ, Krishnan V, Scheetz L, Jia X, Rajasekaran AK, Dhurjati PS. Physiologically based pharmacokinetic modeling of fluorescently labeled block copolymer nanoparticles for controlled drug delivery in leukemia therapy. CPT Pharmacometrics Syst Pharmacol. 2015;4(3):e00013. | ||
Elgrabli D, Beaudouin R, Jbilou N, et al. Biodistribution and clearance of TiO2 nanoparticles in rats after intravenous injection. PLoS One. 2015;10(4):e0124490. | ||
Chen WY, Cheng YH, Hsieh NH, et al. Physiologically based pharmacokinetic modeling of zinc oxide nanoparticles and zinc nitrate in mice. Int J Nanomedicine. 2015;10:6277–6292. | ||
Bachler G, Losert S, Umehara Y, et al. Translocation of gold nanoparticles across the lung epithelial tissue barrier: combining in vitro and in silico methods to substitute in vivo experiments. Part Fibre Toxicol. 2015;12(1):18. | ||
Sweeney LM, MacCalman L, Haber LT, Kuempel ED, Tran CL. Bayesian evaluation of a physiologically-based pharmacokinetic (PBPK) model of long-term kinetics of metal nanoparticles in rats. Regul Toxicol Pharmacol. 2015;73(1):151–163. | ||
Lin Z, Monteiro-Riviere NA, Kannan R, Riviere JE. A computational framework for interspecies pharmacokinetics, exposure and toxicity assessment of gold nanoparticles. Nanomedicine. 2016;11(2):107–119. | ||
Li D, Morishita M, Wagner JG, et al. In vivo biodistribution and physiologically based pharmacokinetic modeling of inhaled fresh and aged cerium oxide nanoparticles in rats. Part Fibre Toxicol. 2016;13(1):45. | ||
Laomettachit T, Puri IK, Liangruksa M. A two-step model of TiO2 nanoparticle toxicity in human liver tissue. Toxicol Appl Pharm. 2017;334:47–54. | ||
Lin Z, Jaberi-Douraki M, He C, et al. Performance assessment and translation of physiologically based pharmacokinetic models from acslX to Berkeley Madonna, MATLAB, and R Language: Oxytetracycline and gold nanoparticles as case examples. Toxicol Sci. 2017;158(1):23–35. | ||
Carlander U, Li D, Jolliet O, Emond C, Johanson G. Toward a general physiologically-based pharmacokinetic model for intravenously injected nanoparticles. Int J Nanomedicine. 2016;11:625–640. | ||
Konduru NV, Jimenez RJ, Swami A, et al. Silica coating influences the corona and biokinetics of cerium oxide nanoparticles. Part Fibre Toxicol. 2015;12:31. | ||
Utembe W, Potgieter K, Stefaniak AB, Gulumian M. Dissolution and biodurability: Important parameters needed for risk assessment of nanomaterials. Part Fibre Toxicol. 2015;12:11. | ||
Decuzzi P, Godin B, Tanaka T, et al. Size and shape effects in the biodistribution of intravascularly injected particles. J Control Release. 2010;141(3):320–327. | ||
Keene AM, Peters D, Rouse R, Stewart S, Rosen ET, Tyner KM. Tissue and cellular distribution of gold nanoparticles varies based on aggregation/agglomeration status. Nanomedicine. 2012;7(2):199–209. | ||
Tenzer S, Docter D, Kuharev J, et al. Rapid formation of plasma protein corona critically affects nanoparticle pathophysiology. Nat Nanotechnol. 2013;8(10):772–781. | ||
Owens DE 3rd, Peppas NA. Opsonization, biodistribution, and pharmacokinetics of polymeric nanoparticles. Int J Pharmaceut. 2006;307(1):93–102. | ||
Canton I, Battaglia G. Endocytosis at the nanoscale. Chem Soc Rev. 2012;41(7):2718–2739. | ||
Yokel RA, Tseng MT, Dan M, et al. Biodistribution and biopersistence of ceria engineered nanomaterials: size dependence. Nanomedicine. 2013;9(3):398–407. | ||
Yokel RA, Unrine JM, Wu P, Wang BH, Grulke EA. Nanoceria biodistribution and retention in the rat after its intravenous administration are not greatly influenced by dosing schedule, dose, or particle shape. Environ Sci Nano. 2014;1(6):549–560. | ||
Heckman KL, DeCoteau W, Estevez A, et al. Custom cerium oxide nanoparticles protect against a free radical mediated autoimmune degenerative disease in the brain. ACS Nano. 2013;7(12):10582–10596. | ||
Hardas SS, Butterfield DA, Sultana R, et al. Brain distribution and toxicological evaluation of a systemically delivered engineered nanoscale ceria. Toxicol Sci. 2010;116(2):562–576. | ||
Konduru NV, Jimenez RJ, Swami A, et al. Erratum to: Silica coating influences the corona and biokinetics of cerium oxide nanoparticles (vol 12, 31, 2015). Part Fibre Toxicol. 2016;13:35. | ||
Dan M, Wu P, Grulke EA, Graham UM, Unrine JM, Yokel RA. Ceria-engineered nanomaterial distribution in, and clearance from, blood: size matters. Nanomedicine (Lond). 2012;7(1):95–110. | ||
Yokel RA, Florence RL, Unrine JM, et al. Biodistribution and oxidative stress effects of a systemically-introduced commercial ceria engineered nanomaterial. Nanotoxicology. 2009;3(3):234–248. | ||
He X, Zhang H, Ma Y, et al. Lung deposition and extrapulmonary translocation of nano-ceria after intratracheal instillation. Nanotechnology. 2010;21(28):285103. | ||
Nalabotu SK, Kolli MB, Triest WE, et al. Intratracheal instillation of cerium oxide nanoparticles induces hepatic toxicity in male Sprague-Dawley rats. Int J Nanomedicine. 2011;6:2327–2335. | ||
Park EJ, Park YK, Park K. Acute toxicity and tissue distribution of cerium oxide nanoparticles by a single oral administration in rats. Toxicol Res. 2009;25(2):79–84. | ||
Kumari M, Kumari SI, Kamal SSK, Grover P. Genotoxicity assessment of cerium oxide nanoparticles in female Wistar rats after acute oral exposure. Mutat Res Genet Toxicol Environ Mutagen. 2014;775:7–19. | ||
Graham UM, Tseng MT, Jasinski JB, et al. In vivo processing of ceria nanoparticles inside liver: impact on free-radical scavenging activity and oxidative stress. Chempluschem. 2014;79(8):1083–1088. | ||
Hirst SM, Karakoti A, Singh S, et al. Bio-distribution and in vivo antioxidant effects of cerium oxide nanoparticles in mice. Environ Toxicol. 2013;28(2):107–118. | ||
Portioli C, Benati D, Pil Y, et al. Short-term biodistribution of cerium oxide nanoparticles in mice: Focus on brain parenchyma. Nanosci Nanotechnol Lett. 2013;5(11):1174–1181. | ||
Aalapati S, Ganapathy S, Manapuram S, Anumolu G, Prakya BM. Toxicity and bio-accumulation of inhaled cerium oxide nanoparticles in CD1 mice. Nanotoxicology. 2014;8(7):786–798. | ||
Cesta MF. Normal structure, function, and histology of the spleen. Toxicol Pathol. 2006;34(5):455–465. | ||
Van Furth R, Diesselhoff-den Dulk MM. Characterization of mononuclear phagocytes from the mouse, guinea pig, rat, and man. Inflammation. 1982;6(1):39–53. | ||
Haley PJ. Species differences in the structure and function of the immune system. Toxicology. 2003;188(1):49–71. | ||
Chithrani BD, Ghazani AA, Chan WC. Determining the size and shape dependence of gold nanoparticle uptake into mammalian cells. Nano Lett. 2006;6(4):662–668. | ||
Zhang S, Li J, Lykotrafitis G, Bao G, Suresh S. Size-dependent endocytosis of nanoparticles. Adv Mater. 2009;21:419–424. | ||
Dasgupta S, Auth T, Gompper G. Shape and orientation matter for the cellular uptake of nonspherical particles. Nano Lett. 2014;14(2):687–693. | ||
Docter D, Westmeier D, Markiewicz M, Stolte S, Knauer SK, Stauber RH. The nanoparticle biomolecule corona: lessons learned – challenge accepted? Chem Soc Rev. 2015;44(17):6094–6121. | ||
Mu QX, Jiang GB, Chen LX, et al. Chemical basis of interactions between engineered nanoparticles and biological systems. Chem Rev. 2014;114(15):7740–7781. | ||
Yokel RA. Physicochemical properties of engineered nanomaterials that influence their nervous system distribution and effects. Nanomed Nanotechnol. 2016;12(7):2081–2093. | ||
Graham UM, Yokel RA, Dozier AK, et al. Analytical high-resolution electron microscopy reveals organ-specific nanoceria bioprocessing. Toxicol Pathol. 2017;46(1):47–61. | ||
Semmler-Behnke M, Kreyling WG, Lipka J, et al. Biodistribution of 1.4- and 18-nm gold particles in rats. Small. 2008;4(12):2108–2111. | ||
Kreyling WG, Hirn S, Moller W, et al. Air-blood barrier translocation of tracheally instilled gold nanoparticles inversely depends on particle size. ACS Nano. 2014;8(1):222–233. | ||
Brown RP, Delp MD, Lindstedt SL, Rhomberg LR, Beliles RP. Physiological parameter values for physiologically based pharmacokinetic models. Toxicol Ind Health. 1997;13(4):407–484. | ||
Davies B, Morris T. Physiological parameters in laboratory animals and humans. Pharm Res. 1993;10(7):1093–1095. | ||
Treuel L, Brandholt S, Maffre P, Wiegele S, Shang L, Nienhaus GU. Impact of protein modification on the protein corona on nanoparticles and nanoparticle-cell interactions. ACS Nano. 2014;8(1):503–513. | ||
Cohen JM, DeLoid GM, Demokritou P. A critical review of in vitro dosimetry for engineered nanomaterials. Nanomedicine (Lond). 2015;10(19):3015–3032. | ||
Salvati A, Aberg C, dos Santos T, et al. Experimental and theoretical comparison of intracellular import of polymeric nanoparticles and small molecules: toward models of uptake kinetics. Nanomedicine. 2011;7(6):818–826. | ||
Yoon M, Campbell JL, Andersen ME, Clewell HJ. Quantitative in vitro to in vivo extrapolation of cell-based toxicity assay results. Crit Rev Toxicol. 2012;42(8):633–652. | ||
Wohlleben W, Driessen MD, Raesch S, et al. Influence of agglomeration and specific lung lining lipid/protein interaction on short-term inhalation toxicity. Nanotoxicology. 2016;10(7):970–980. | ||
Walczak AP, Fokkink R, Peters R, et al. Behaviour of silver nanoparticles and silver ions in an in vitro human gastrointestinal digestion model. Nanotoxicology. 2013;7(7):1198–1210. | ||
Marques MRC, Loebenberg R, Almukainzi M. Simulated biological fluids with possible application in dissolution testing. Dissolution Technol. 2011;18(3):15–28. | ||
Bruinink A, Wang J, Wick P. Effect of particle agglomeration in nanotoxicology. Arch Toxicol. 2015;89(5):659–675. | ||
Zhang W. Nanoparticle aggregation: principles and modeling. Adv Exp Med Biol. 2014;811:19–43. | ||
Walkey CD, Olsen JB, Song F, et al. Protein corona fingerprinting predicts the cellular interaction of gold and silver nanoparticles. ACS Nano. 2014;8(3):2439–2455. | ||
Choi HS, Ashitate Y, Lee JH, et al. Rapid translocation of nanoparticles from the lung airspaces to the body. Nat Biotechnol. 2010;28(12):1300–1303. | ||
Tobio M, Sanchez A, Vila A, et al. The role of PEG on the stability in digestive fluids and in vivo fate of PEG-PLA nanoparticles following oral administration. Colloids Surf B Biointerfaces. 2000;18(3–4):315–323. |
 © 2018 The Author(s). This work is published and licensed by Dove Medical Press Limited. The full terms of this license are available at https://www.dovepress.com/terms.php and incorporate the Creative Commons Attribution - Non Commercial (unported, v3.0) License.
By accessing the work you hereby accept the Terms. Non-commercial uses of the work are permitted without any further permission from Dove Medical Press Limited, provided the work is properly attributed. For permission for commercial use of this work, please see paragraphs 4.2 and 5 of our Terms.
© 2018 The Author(s). This work is published and licensed by Dove Medical Press Limited. The full terms of this license are available at https://www.dovepress.com/terms.php and incorporate the Creative Commons Attribution - Non Commercial (unported, v3.0) License.
By accessing the work you hereby accept the Terms. Non-commercial uses of the work are permitted without any further permission from Dove Medical Press Limited, provided the work is properly attributed. For permission for commercial use of this work, please see paragraphs 4.2 and 5 of our Terms.