Back to Journals » Drug Design, Development and Therapy » Volume 20
Physiologically Based Pharmacokinetic Modeling and Therapeutic Drug Monitoring for Ertapenem Dose Optimization in Hypoalbuminemia Elderly Patients
Authors Du X, Dong Z, Li Y, Wu Y, Wu H ![]()
Received 24 March 2026
Accepted for publication 27 May 2026
Published 16 June 2026 Volume 2026:20 611549
DOI https://doi.org/10.2147/DDDT.S611549
Checked for plagiarism Yes
Review by Single anonymous peer review
Peer reviewer comments 2
Editor who approved publication: Professor Anastasios Lymperopoulos
Xiaoyu Du,1,2 Zixuan Dong,1,2 Yumeng Li,1 Yin Wu,1,2 Huizhen Wu1,2
1School of Pharmacy, Graduate School of Hebei Medical University, Shijiazhuang, Hebei, People’s Republic of China; 2Hebei Key Laboratory of Clinical Pharmacy, Department of Pharmacy, Hebei General Hospital, Shijiazhuang, Hebei, People’s Republic of China
Correspondence: Huizhen Wu, Hebei Key Laboratory of Clinical Pharmacy, Department of Pharmacy, Hebei General Hospital, Shijiazhuang, Hebei, People’s Republic of China, Tel +86-13582005982, Email [email protected]
Objective: As a highly protein-bound, time-dependent antibiotic, the duration for which the unbound concentration of ertapenem remains above the minimum inhibitory concentration (%T>MIC) is a critical pharmacokinetic/pharmacodynamic (PK/PD) parameter. In our clinical TDM practice, most enrolled patients were elderly (mean age 62± 21 years), with hypoalbuminemia present in 23/39 (59.0%), and the protein binding rate in these patients was significantly lower than literature-reported values. This study aimed to (1) establish a method for determining total and unbound ertapenem concentrations; (2) investigate factors influencing protein binding, focusing on hypoalbuminemia in the elderly; and (3) evaluate individualized dosing regimens for hypoalbuminemia elderly patients using a physiologically based pharmacokinetic (PBPK) model.
Methods: Protein precipitation (for total concentration) and hollow-fiber centrifugal ultrafiltration (for unbound concentration) were used for sample pretreatment, followed by quantitative analysis using liquid chromatography–tandem mass spectrometry (LC-MS/MS). This method was applied to therapeutic drug monitoring (TDM) in clinical patients. A PBPK model was developed and validated using both our TDM data and published data to simulate dose–exposure relationships specifically in hypoalbuminemia elderly patients.
Results: The developed method successfully quantified the total and unbound ertapenem concentrations. Clinical monitoring revealed that the protein binding rate in some patients was significantly lower than that reported in the literature. Correlation analysis indicated that albumin levels (p < 0.05) after outlier exclusion was the key factor influencing protein binding. The PBPK model demonstrated good agreement between the predicted and observed concentrations (AFE 0.78– 1.26). Simulations indicated that standard doses (1 g q24h) may lead to excessive unbound exposure in hypoalbuminemia elderly patients, while 0.5 g q12h improved target attainment and reduced peak concentrations.
Conclusion: Albumin level plays a pivotal role in regulating ertapenem protein binding. Standard doses are unsuitable for hypoalbuminemia elderly patients, and TDM-guided dose adjustments are necessary. The PBPK model provides a valuable tool for individualized dosing in this specific population.
Keywords: ertapenem, hollow fiber centrifugal ultrafiltration technology, therapeutic drug monitoring, PBPK model, hypoalbuminemia, elderly
Introduction
Ertapenem is a carbapenem antibiotic widely used to treat infections caused by Gram-negative, Gram-positive, and anaerobic bacteria.1,2 The pharmacological activity of antibiotics largely depends on the concentration of unbound drugs at the site of infection. Ertapenem exhibits high plasma protein binding (85%–95%);3 therefore, it is challenging to accurately estimate unbound concentrations from total plasma levels.4 Monitoring the unbound concentration may provide more clinically relevant information than total drug levels when adjusting the dosages.5
Various studies and case reports have suggested that the pharmacokinetics of ertapenem can be significantly altered in certain populations, potentially compromising its antimicrobial efficacy. Moreover, elevated unbound ertapenem concentrations are associated with an increased risk of central nervous system toxicity, particularly seizures.6–10 Therefore, therapeutic drug monitoring (TDM) is essential for optimizing dosing, balancing efficacy and toxicity, and preventing antimicrobial resistance.
In recent years, the use of highly protein-bound antimicrobials in patients with hypoalbuminemia has gained increasing attention. According to the 2023 Infectious Diseases Society of America (IDSA) guidelines for the treatment of antimicrobial-resistant gram-negative infections, an increased unbound fraction of ertapenem in hypoalbuminemia and critically ill patients can markedly shorten its serum half-life.11 Despite these findings, pharmacokinetic studies and dosing evaluations in hypoalbuminemia populations are limited.
To address this gap, a physiologically based pharmacokinetic (PBPK) model of ertapenem was developed in this study. Based on real-world therapeutic drug monitoring (TDM) data, we observed that the majority of enrolled patients were elderly, with 59.0% presenting with hypoalbuminemia, and the protein binding rate in these hypoalbuminemia patients was significantly lower than literature-reported normal values. We therefore further applied the PBPK model to simulate drug exposure in hypoalbuminemia elderly patients. This study aimed to evaluate the impact of hypoalbuminemia on ertapenem exposure and provide a scientific basis for optimizing clinical dosing regimens in this population. Unlike previous PBPK models validated only in healthy populations, this study combines real-world TDM data with PBPK modeling to specifically evaluate three dosing regimens (0.5 g q24h, 0.5 g q12h, 1 g q24h) in hypoalbuminemic elderly patients and to propose individualized dosing recommendations.
Methods
The study protocol was approved by the Ethics Committee of Hebei General Hospital (Approval No. 2024380).
Establishment of Blood Drug Concentration Measurement Method
To assess changes in plasma ertapenem concentrations, a LC–MS/MS method based on hollow-fiber centrifugal ultrafiltration (HFCF-UF) was established and validated for determining unbound ertapenem concentrations in human plasma.12 Total drug concentrations and plasma protein binding rates were determined using the same plasma samples processed by protein precipitation. The stability of ertapenem under various storage conditions was evaluated because of the inherent instability of carbapenem antibiotics.
Chromatographic conditions: The separation was performed on a Titan C18 column (2.1 mm × 50 mm, 3.0 μm). The mobile phase consisted of 0.1% formic acid in water (A) and 0.1% formic acid in methanol (B). The gradient program was as follows: initial 2% B; 0.5–1.0 min, 2%→70% B; 1.0–2.0 min, 70% B; 2.0–4.0 min, 70%→2% B; 4.1–5.0 min, 3% B. The flow rate was 0.45 mL/min, and the injection volume was 5 μL.
Mass spectrometric conditions: Mass spectrometry was performed using an electrospray ionization (ESI) source in positive ion mode with multiple reaction monitoring (MRM). The ion source temperature was set to 600°C, and the ion spray voltage was 5500 V. The nebulizer gas, heater gas, and curtain gas were set to 60 kPa, 60 kPa, and 30 kPa, respectively. The collision gas was set to 8 kPa. The entrance potential (EP) was 10 V, and the exit potential (CXP) was 14 V. The mass spectrometric parameters for the analytes are summarized in Table 1.
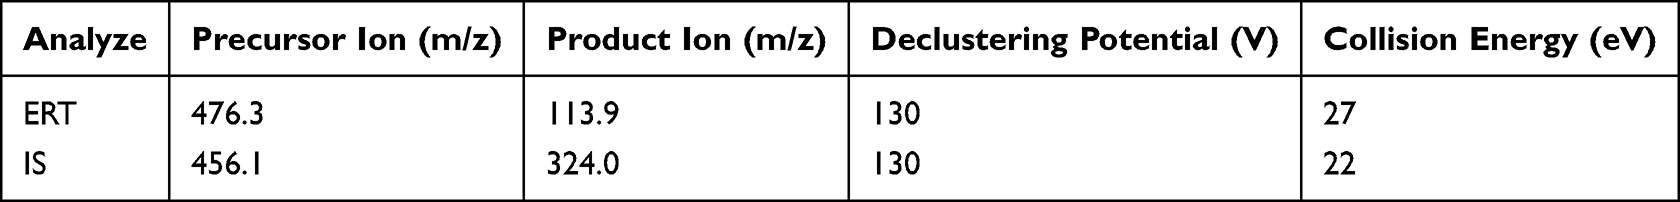 |
Table 1 Parameters of Mass Spectrometry |
Total Plasma Drug Concentration: Sample Preparation and Standard Curve
To determine the total plasma concentration, 100 μL of plasma was mixed with 10 μL of internal standard (IS) and 350 μL of methanol. The mixture was vortexed for 5 min and centrifuged at 12,000 rpm for 10 min to precipitate the plasma proteins. A 50 μL aliquot of the supernatant was diluted 1:1 with 50 μL of purified water, and chromatographic analysis was performed. A calibration curve was established over a concentration range of 0.1–50 mg/L, with cefotaxime (20 mg/L) used as the IS.
Unbound Plasma Drug Concentration: Sample Preparation and Standard Curve
To measure the unbound drug concentration, hollow fibers were cut into approximately 15 cm segments, immersed in distilled water, and ultrasonicated for 15 min. After drying, the fibers were folded into a U-shape and inserted into a glass tube to assemble the HFCF-UF device. Plasma samples (200 μL) were diluted with 300 μL of purified water, followed by the addition of 10 μL of IS. The mixture was vortexed for 5 min, and 450 μL of it was loaded into the HFCF-UF device. The mixture was centrifuged at 3500 rpm for 15 min. A 20 μL aliquot of the resulting ultrafiltrate was diluted with 80 μL of purified water and subjected to chromatographic analysis. A calibration curve for the unbound drug was established over a concentration range of 0.025–25 mg/L, with cefotaxime (5 mg/L) used as the IS.
Method Validation
Method validation was conducted in accordance with the Chinese Pharmacopoeia (2020) guidelines for quantitative analysis of biological samples. The performance of the method was evaluated based on its selectivity, linearity, accuracy, precision, recovery, and stability. The non-specific adsorption characteristics of three different hollow fiber materials—polysulfone, polyethersulfone, and polyvinylidene fluoride (PVDF)—were assessed to determine their effects on analyte recovery.13,14
The stability of the stock solutions was evaluated by comparing solutions prepared in pure methanol and 5% aqueous methanol after storage at −20 °C for 1 and 2 weeks. Post-treatment sample stability was assessed by placing the processed samples in an autosampler for 12 and 24 h, and short-term stability was tested at room temperature and 4 °C for 4, 8, and 12 h. Intermediate stability was assessed at 4 °C for 1, 3, and 7 days. Long-term stability was evaluated by storing the samples at −20 °C for 1 and 3 months. The freeze–thaw stability of the unbound drug samples was analyzed over three freeze–thaw cycles at −20 °C.
Based on the stability results, all collected blood samples were processed and stored at 4–8 °C within 4 days, then transferred to −20 °C for storage and analyzed within 1 month.
Analysis of Influencing Factors of Clinical Samples
Clinical data were collected from patients who received ertapenem for antimicrobial therapy between October 2023 and November 2024 at the Hebei General Hospital. Residual blood samples obtained after routine clinical testing were processed and stored at −20 °C. All samples were stored at −20 °C and analyzed within 1 month. Plasma ertapenem concentrations were determined using a validated LC–MS/MS.
Inclusion and Exclusion Criteria
The inclusion criteria for the analysis were as follows: (1) patients who had received ertapenem treatment for at least two consecutive days and (2) blood samples collected prior to the next scheduled dose, with measurable concentrations above the lower limit of quantification of the assay. The exclusion criteria were as follows: (1) incomplete medical records; (2) unclear timing of the last ertapenem dose or blood sampling before achieving steady-state concentrations; and (3) pregnancy or breastfeeding; (4) samples stored for more than 1 month were excluded.
Data Collection
Clinical and laboratory data were extracted from medical records and included the following: (1) baseline characteristics, such as age, sex, height, weight, clinical diagnosis, comorbidities, infectious pathogens, and clinical outcomes; (2) details of concomitant antimicrobial therapy, including ertapenem dosage and combination regimens; and (3) laboratory test results, including renal function parameters (serum creatinine and estimated glomerular filtration rate [GFR]) and levels of total protein (TP) and albumin (ALB). The data were further analyzed within the relevant subgroups.
Outcome Indicators
Pharmacodynamic assessments were based on the minimum inhibitory concentration (MIC) values determined for the infecting pathogen according to the breakpoints established by the European Committee on Antimicrobial Susceptibility Testing. For empirical treatments without confirmed pathogens, an MIC of 2 mg/L was used as the target, with a pharmacodynamic goal of 40%fT>MIC.
Clinical effectiveness was assessed by the treating physician at the end of therapy based on the patient’s symptoms, physical examination findings, laboratory parameters and imaging results. Therapeutic outcomes were categorized as follows: (1) poor, defined as no improvement or worsening of symptoms or clinical parameters; (2) improved, defined as partial resolution, such as symptom relief, normalization of laboratory or imaging results, or improvement in any one domain; and (3) cured, defined as complete resolution of clinical symptoms and normalization of all relevant laboratory and imaging findings with no further antimicrobial treatment required.
Statistical Methods
Statistical analyses were performed using Origin 2024 (OriginLab) and SPSS version 27.0 (IBM Corp). Multiple group comparisons were performed using the Kruskal–Wallis test, and two-group comparisons were performed using the Mann–Whitney U-test. Plasma ertapenem concentrations were normalized using the concentration-to-dose ratio (CDR; CDR [µg/mL] = drug concentration/dose administered) for subsequent analysis.15
Modeling and Application of a PBPK Model in Older Healthy and Hypoalbuminemia Patients Receiving Ertapenem
An initial intravenous PBPK model was established in a healthy adult population and subsequently optimized and validated. This base model was extrapolated to simulate an older population, with further stratification into normoalbuminemic and hypoalbuminemia subgroups. The predicted ertapenem plasma concentrations in these virtual populations were compared with the observed clinical values to assess the model accuracy. After final validation, simulations using various dosing regimens were conducted in older subgroups to evaluate the impact of hypoalbuminemia on key pharmacokinetic parameters.
Data Acquisition
When complete concentration–time profile data were available in the literature, full pharmacokinetic curves for total and/or unbound ertapenem following intravenous administration were digitized using the GetData Graph Digitizer software. In the absence of complete profiles, pharmacokinetic parameters, such as the maximum plasma concentration (Cmax) and area under the concentration–time curve (AUC), were extracted for model input and comparison.
The physicochemical and absorption, distribution, metabolism, and excretion (ADME) parameters of ertapenem, as well as relevant pharmacokinetic data for intravenous administration, were obtained from the DrugBank database and through literature searches in Web of Science, PubMed, MEDLINE, and CNKI using the keywords “ertapenem” and “pharmacokinetics”. To retrieve data specific to older adults, the terms “elder” and “elderly” were included. Because hypoalbuminemia is common in critically ill patients,16 additional searches included the terms “critically ill patients” and “hypoalbuminemia”. The final set of included studies was categorized according to the dosing regimen and study characteristics, as summarized in Table 2.
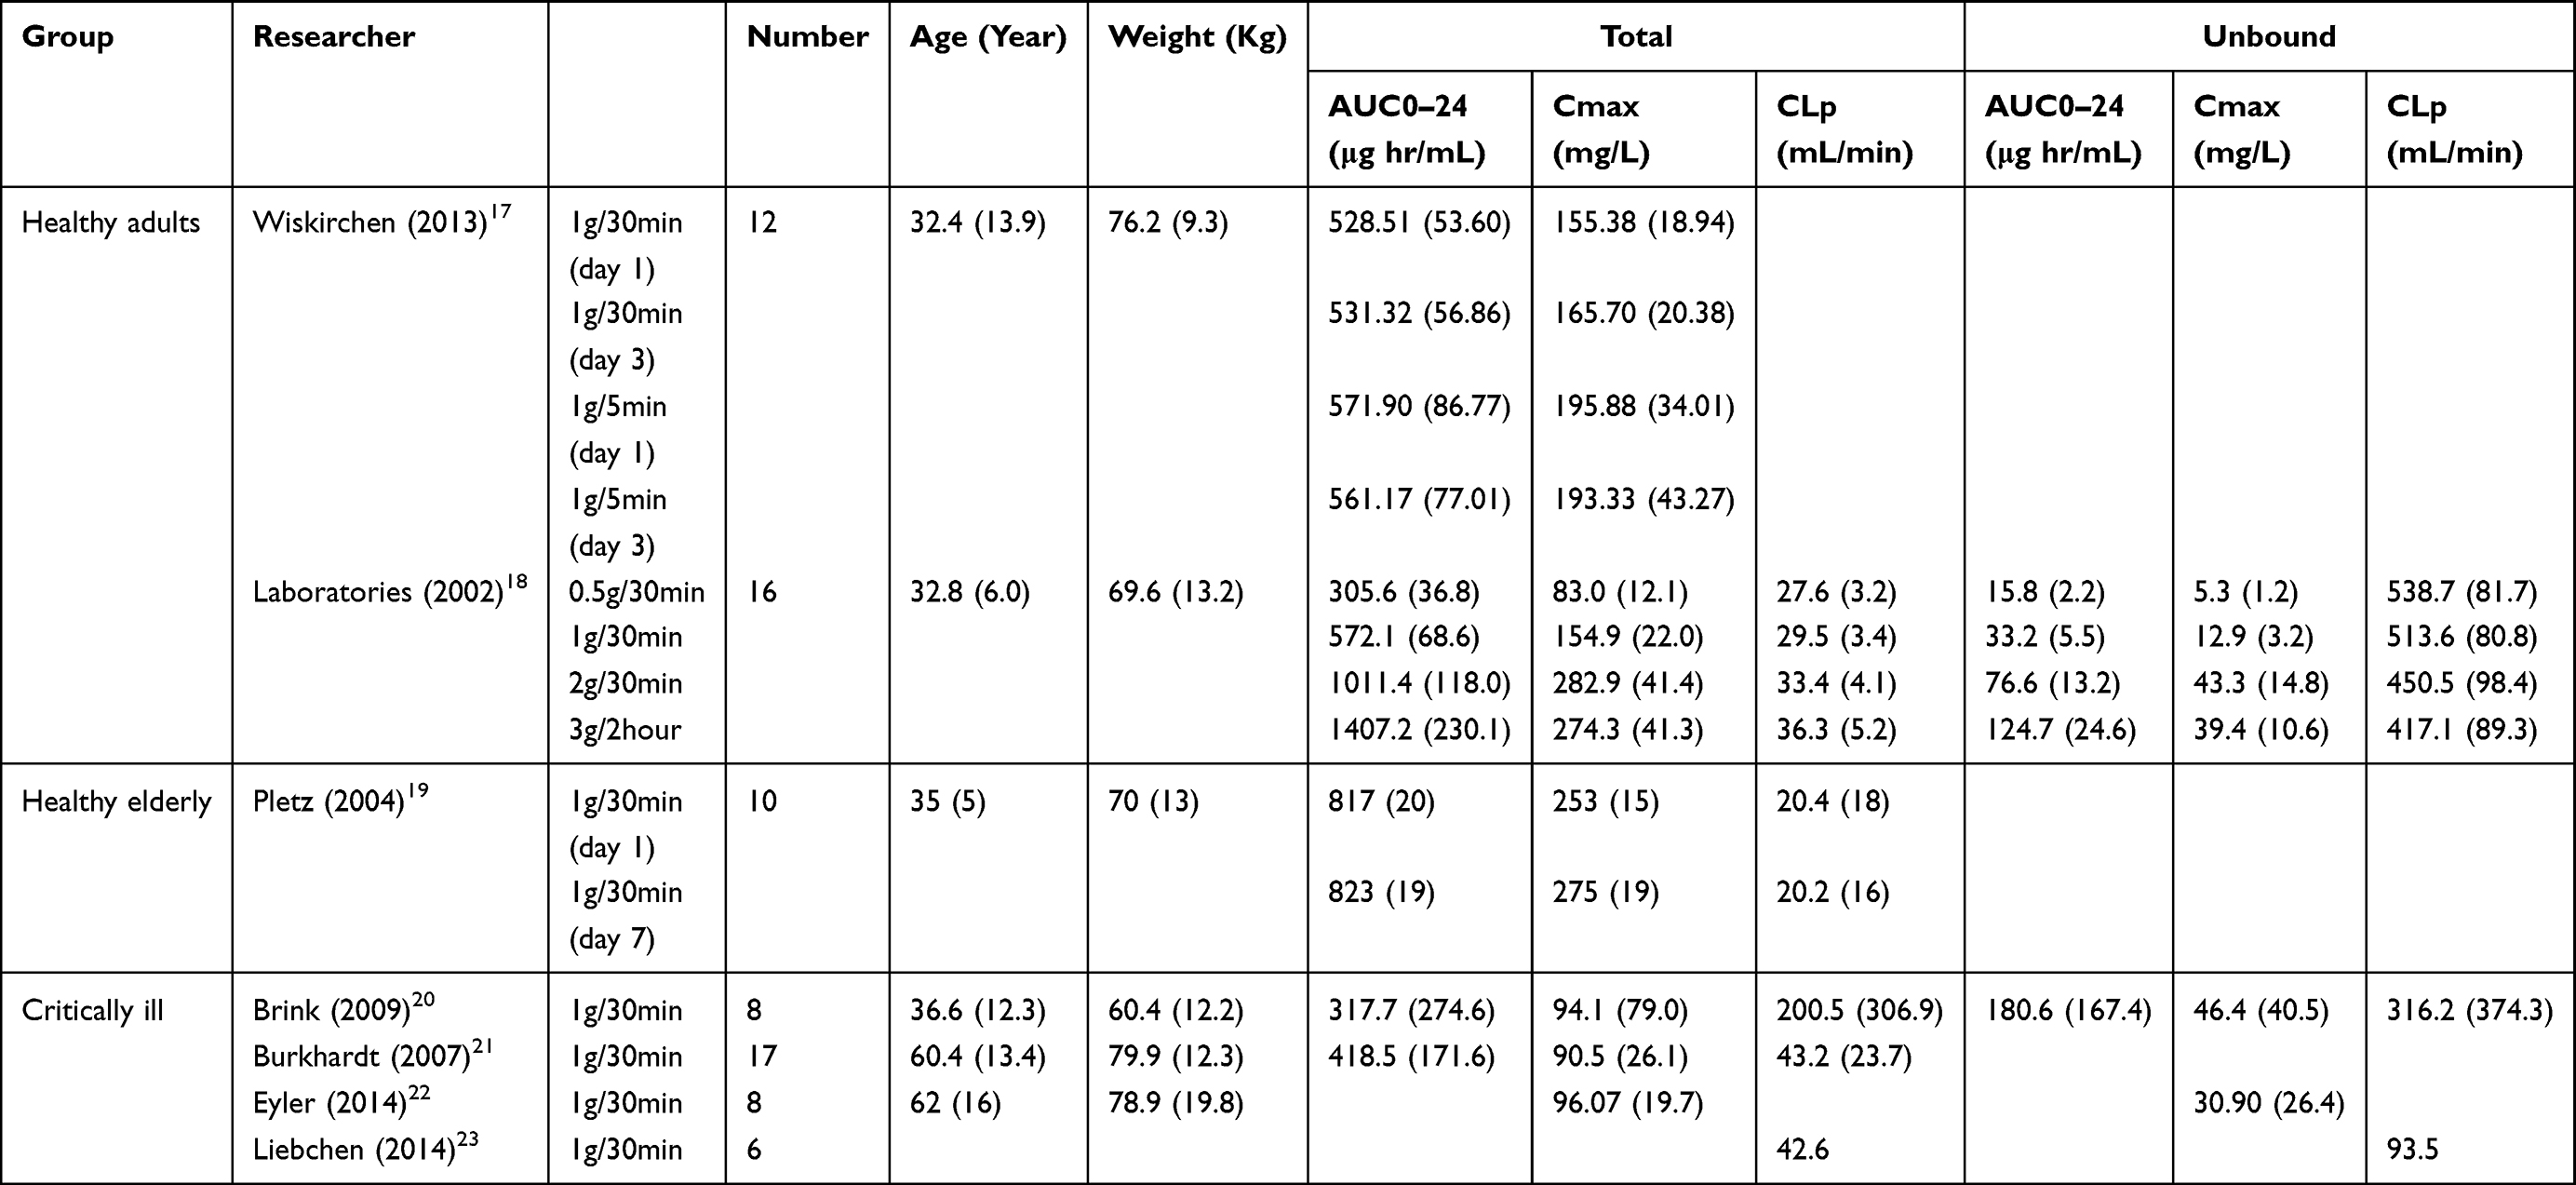 |
Table 2 Population Pharmacokinetic Modeling Studies in China and Abroad |
Adult Modeling and Evaluation
The compound-specific ertapenem module was constructed using the PK-Sim software, and the key physicochemical and pharmacokinetic parameters are summarized in Table 3. Renal clearance was estimated based on the total plasma clearance and unbound plasma fraction of ertapenem. To simulate individual pharmacokinetics, virtual adult subject modules were generated using demographic variables such as height, age, and body weight of the subjects.
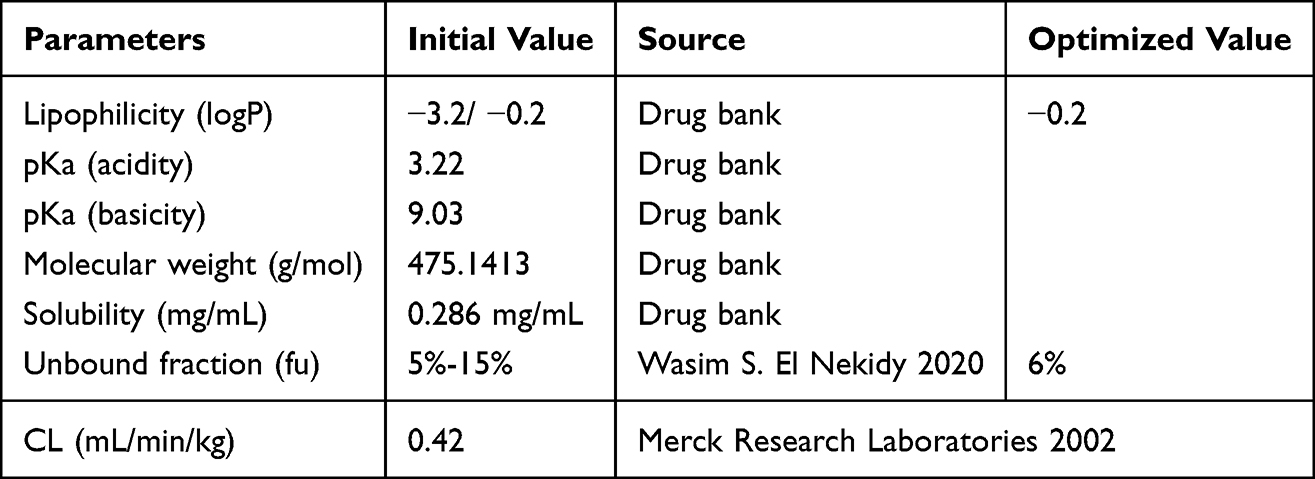 |
Table 3 Parameters of Physical and Chemical Properties of Ertapenem |
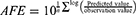
In adult ertapenem pharmacokinetic studies, subjects received intravenous administration, and albumin was designated as the sole plasma protein-binding ligand, which was assumed to be exclusively present in plasma at 100% relative abundance. A population-level PBPK model was constructed based on individual virtual subject modules to ensure consistency with the physiological parameter ranges of the clinical population. The predictive performance of the final model was visually evaluated by comparing the simulated population profiles. In addition, the model performance was assessed by comparing key pharmacokinetic parameters, such as AUC, Cmax, and plasma clearance (CLp), between the observed and simulated values. The average fold error (AFE) was used as a quantitative evaluation metric, with values between 0.5 and 2.0 considered acceptable.24
PBPK Modeling and Evaluation in Older Adults
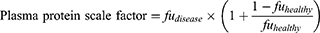
After establishing a validated adult PBPK model for ertapenem, it was extrapolated to simulate an older adult population (n = 1000), incorporating age-related physiological changes, such as reduced organ size, altered perfusion, and decreased renal function. Renal clearance was modeled using the default age-based GFR function in PK-Sim, which accounts for the progressive decline in renal function with age. To evaluate the impact of albumin levels on the disposition of total and unbound ertapenem, two subgroup models were constructed: one representing older individuals with norm albuminemia and the other representing individuals with hypoalbuminemia. Albumin concentrations were assigned using independent normal distributions with mean ALB values of 3.96 g/dL and 2.69 g/dL. As the hypoalbuminemia subgroup closely resembled the critically ill population, model parameters were adopted based on data reported in the literature on critically ill patients. Although ertapenem exhibits concentration-dependent, saturable binding to plasma proteins,25 previous studies have shown that its nonlinear binding has a minimal impact on overall pharmacokinetics. Therefore, the present study assumed approximately linear pharmacokinetics and used the AUC data under this assumption for clinical interpretation.26 The unbound fraction of ertapenem was adjusted using the plasma protein scale factor, defined as:
Model accuracy was assessed by visual comparison between simulated and observed population data, as well as by numerical comparison of key pharmacokinetic parameters (AUC, Cmax, and CL). All elderly PBPK models satisfied the predefined acceptance criteria. For external validation, individual models were constructed for older patients (aged 60–95 years, ALB < 40 g/L, serum creatinine 45–98 μmol/L) with available post–steady-state plasma samples with both total and unbound ertapenem concentrations. The simulated parameters were compared with the observed concentrations for each individual, further confirming the model accuracy.
Drug Dosing Simulations
Following successful validation of the PBPK models for healthy older and hypoalbuminemia populations, the models were used to simulate the pharmacokinetics of various ertapenem dosing regimens. A virtual population of 1000 individuals was generated in PK-Sim, and intravenous ertapenem was administered once daily for seven days using three regimens: 0.5 g twice daily (q12h), 0.5 g once daily (q24h), and 1 g once daily (q24h). The attainment of pharmacodynamic targets was compared between normoalbuminemic and hypoalbuminemia groups at different MICs: 0.5 mg/L (Enterobacteriaceae and Haemophilus spp)., 1 mg/L (Streptococcus spp)., and 2 mg/L (Staphylococcus aureus).26 Based on animal models, the optimal bactericidal efficacy of carbapenems is achieved at 40%fT>MIC. Given that hypoalbuminemia may require prolonged drug exposure, both 40%fT>MIC and 100%fT>MIC were evaluated as pharmacodynamic endpoints to assess the probability of target attainment in the two groups.
Results
Methodological Validation of Plasma Drug Concentration Measurements
The retention times for ERT and IS were 2.72 min and 2.42 min, respectively; the ion chromatogram is shown in Figure S1. The developed method exhibited excellent linearity, with correlation coefficients (r) greater than 0.998 across the calibration ranges of 0.1–50 mg/L for the total plasma concentration and 0.025–25 mg/L for the unbound plasma concentration. Intra- and inter-batch precision, expressed as relative standard deviation (RSD), remained within 15% for low-, medium-, and high-quality control samples.(Table S1) Since patient plasma samples with concentrations exceeding the quantitation limit were encountered in clinical practice, a reliability analysis of the dilution process was conducted. The process was validated for 5-fold and 10-fold dilutions; the results are shown in Table S2, demonstrating that drug concentration measurements are reliable within this dilution range. Plasma samples stored at −20°C showed signs of degradation after 3 months, whereas good stability was maintained under all other tested conditions, including storage for up to 7 days at 4°C. Based on these stability results, all blood samples were processed within 4 days at 4°C and stored at −20°C for no more than 1 month, under which the samples demonstrated good stability (recovery within the acceptable range of ±15%). The stability of ERT stock solutions prepared in different solvents was also evaluated (Figure 1, Tables S4 and S5), and no significant matrix effects were observed (Table S3). Among the three evaluated fiber membrane materials, polysulfone demonstrated the least nonspecific adsorption, yielding a recovery rate of over 95%. (Table S6) These results confirm that the method is rapid, reliable, and suitable for quantifying ertapenem in clinical plasma sample.
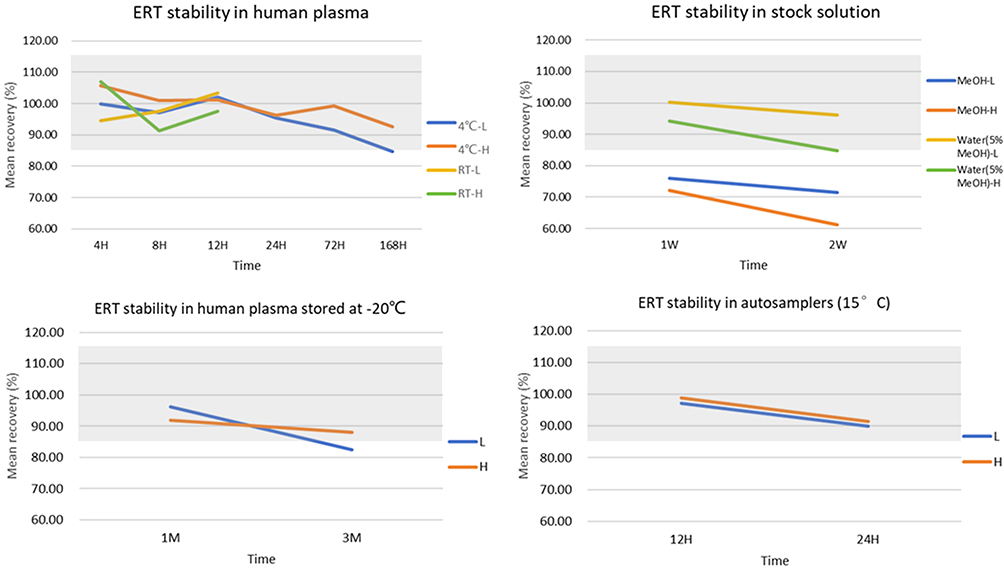 |
Figure 1 Ertapenem (ERT) sample stability under different storage conditions. Grey area indicates the acceptable range of 85% to 115%. |
Analysis of Clinical Patient Plasma Samples
Patient Demographics and Descriptive Characteristics
Table 4 summarizes the demographic characteristics, laboratory findings, and clinical outcomes of the patients in the ertapenem cohort. A total of 39 patients were enrolled, with male predominance (n = 21, 53.8%) and a mean age of 62 years. The primary diagnoses included pneumonia (n = 25, 64.1%) and acute pyelonephritis (n = 4, 10.3%). The most common comorbidities were hypertension (n = 18, 46.1%), type 2 diabetes mellitus (n = 21, 53.8%), and hypoproteinemia (n = 23, 59.0%). The most frequently used combination of antibiotics was moxifloxacin and omadacycline. Among the cohort, 34 patients received the standard recommended regimen of 1 g/day of ertapenem, whereas the dose was reduced to 0.5 g/day in five patients because of renal impairment.
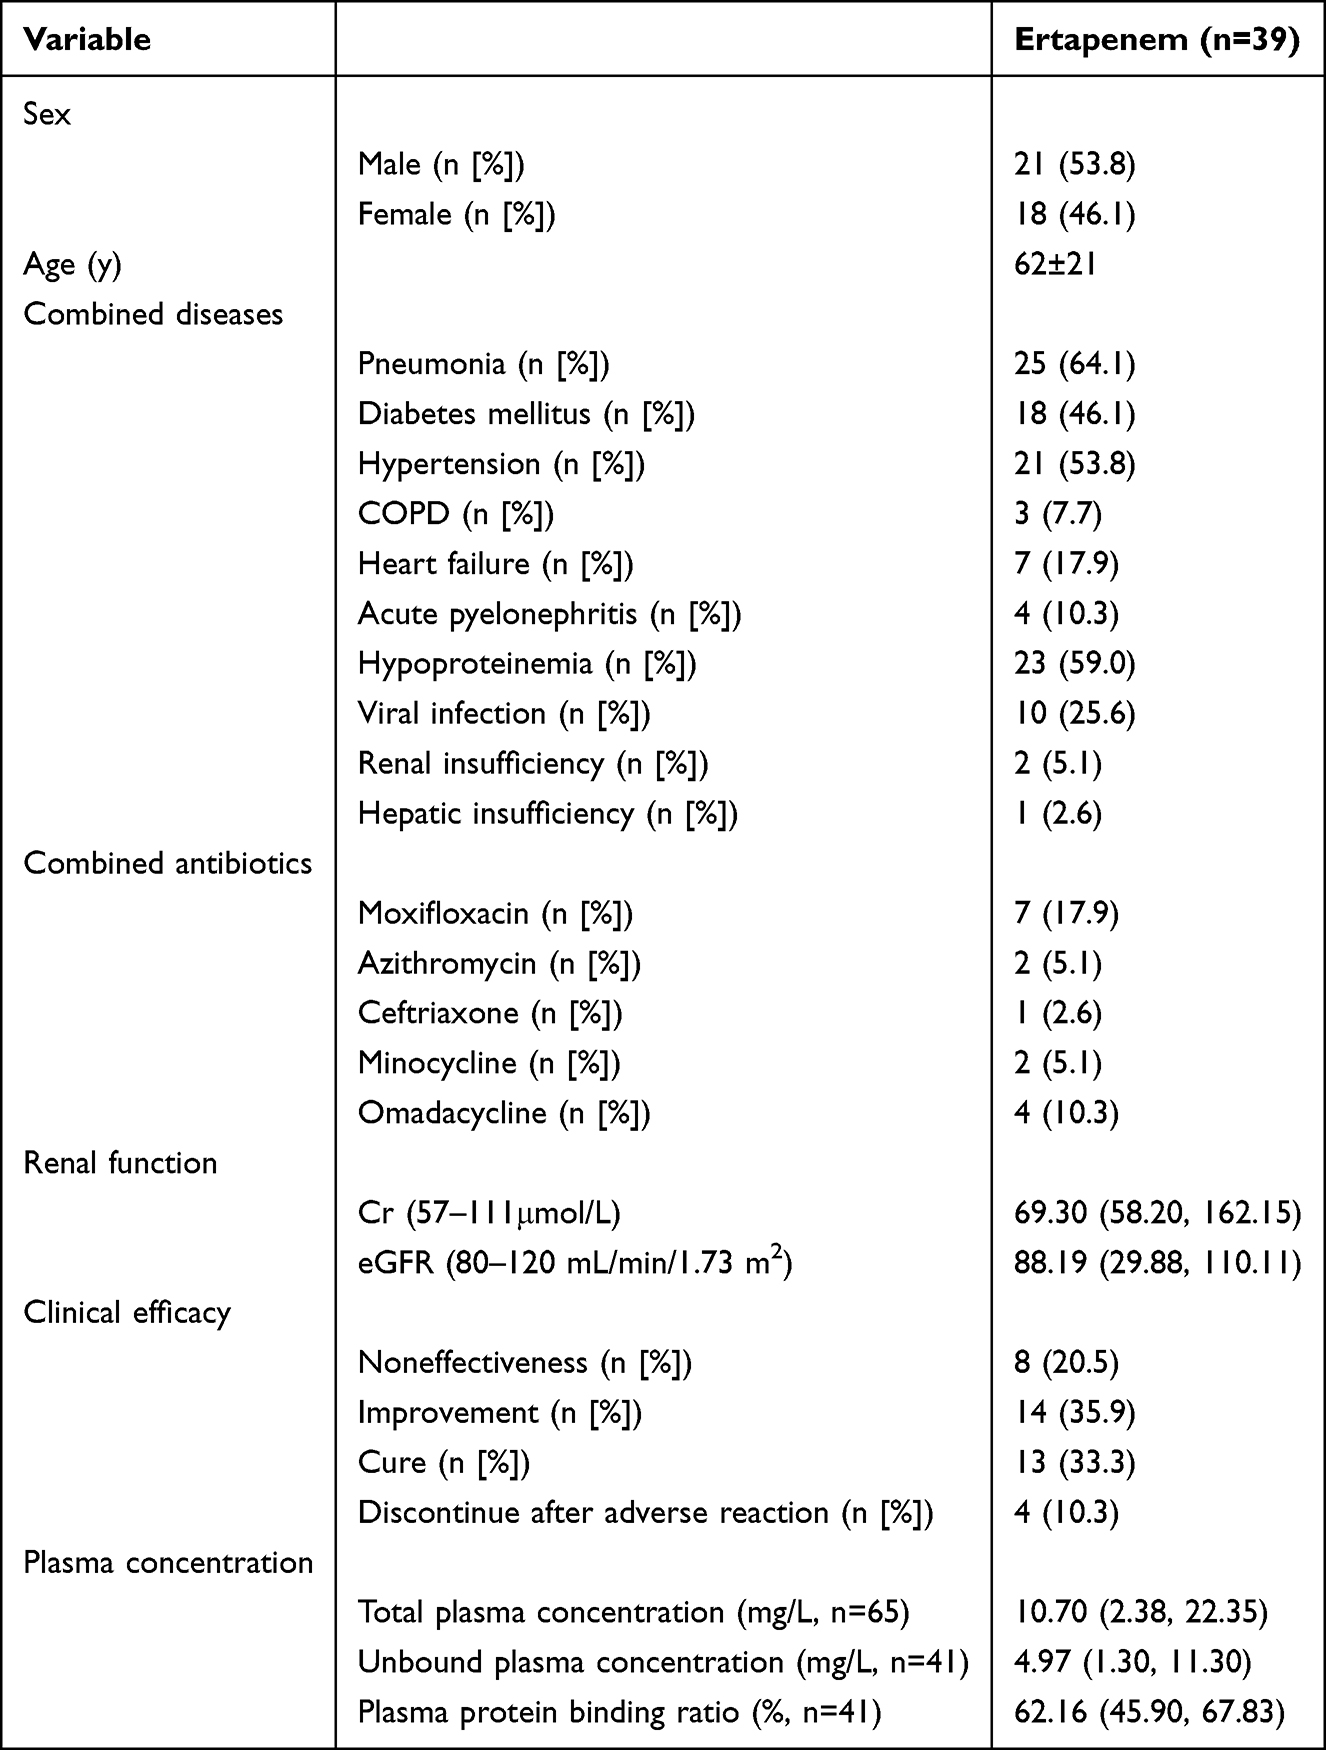 |
Table 4 Basic Information of Included Patients |
Plasma Drug Concentration and Protein Binding Analysis
Plasma samples from 39 patients were analyzed using a validated LC–MS/MS method. In addition, samples with a storage time exceeding 1 month were excluded, as prolonged storage may affect drug stability and protein binding characteristics. After exclusions, 65 total and 41 unbound ertapenem plasma samples from 36 patients were included in the final analysis.
The median trough concentrations of total and unbound plasma ertapenem were 10.70 mg/L (interquartile range [IQR]: 2.38–22.35 mg/L) and 4.97 mg/L (IQR: 1.30–11.30 mg/L), respectively. The protein binding ranged from 30.86% to 95.88%, with a median of 62.16% (IQR: 45.90%–67.83%). A strong linear correlation was observed between the total and unbound concentrations (R2 = 0.92).
Based on the pharmacodynamic target of 40%fT>MIC, 61.97% of the samples achieved the desired exposure threshold. Clinical outcomes were favorable in 69% of the patients (defined as improvement or cure). Three patients experienced delirium during ertapenem therapy, and one case was confirmed to be an ertapenem-related adverse drug reaction. One patient experienced seizure. All adverse events resolved after the drug was withdrawn.
Analysis of Influencing Factors
To identify the predictors of ertapenem plasma concentration, multiple linear regression analysis was conducted using age, GFR, TP, and ALB as independent variables. GFR was the only factor significantly associated with the total ertapenem concentration (P < 0.001). Additional nonparametric analysis using the Mann–Whitney U-test confirmed that both age and GFR significantly influenced CDR (P < 0.05).
Age-stratified analysis (Table 5 and Figure 2) revealed that the median CDR was significantly higher in the elderly group (≥65 years) than in the pediatric (<18 years) and adult (18–64 years) groups (both P < 0.01). No statistically significant difference was observed between the pediatric and adult groups (P = 0.213). The pediatric subgroup had a small sample size (n=4); therefore, these results are for descriptive purposes only and do not represent a primary conclusion of this study. GFR showed a dose–response relationship: compared with the normal renal function group (GFR > 90 mL/min/1.73 m2), the mild impairment group (GFR 60–90 mL/min/1.73 m2) had a 4.39-fold increase in CDR. The moderate impairment group (GFR < 60 mL/min/1.73 m2) showed an additional 1.67-fold increase compared with the mild impairment group.
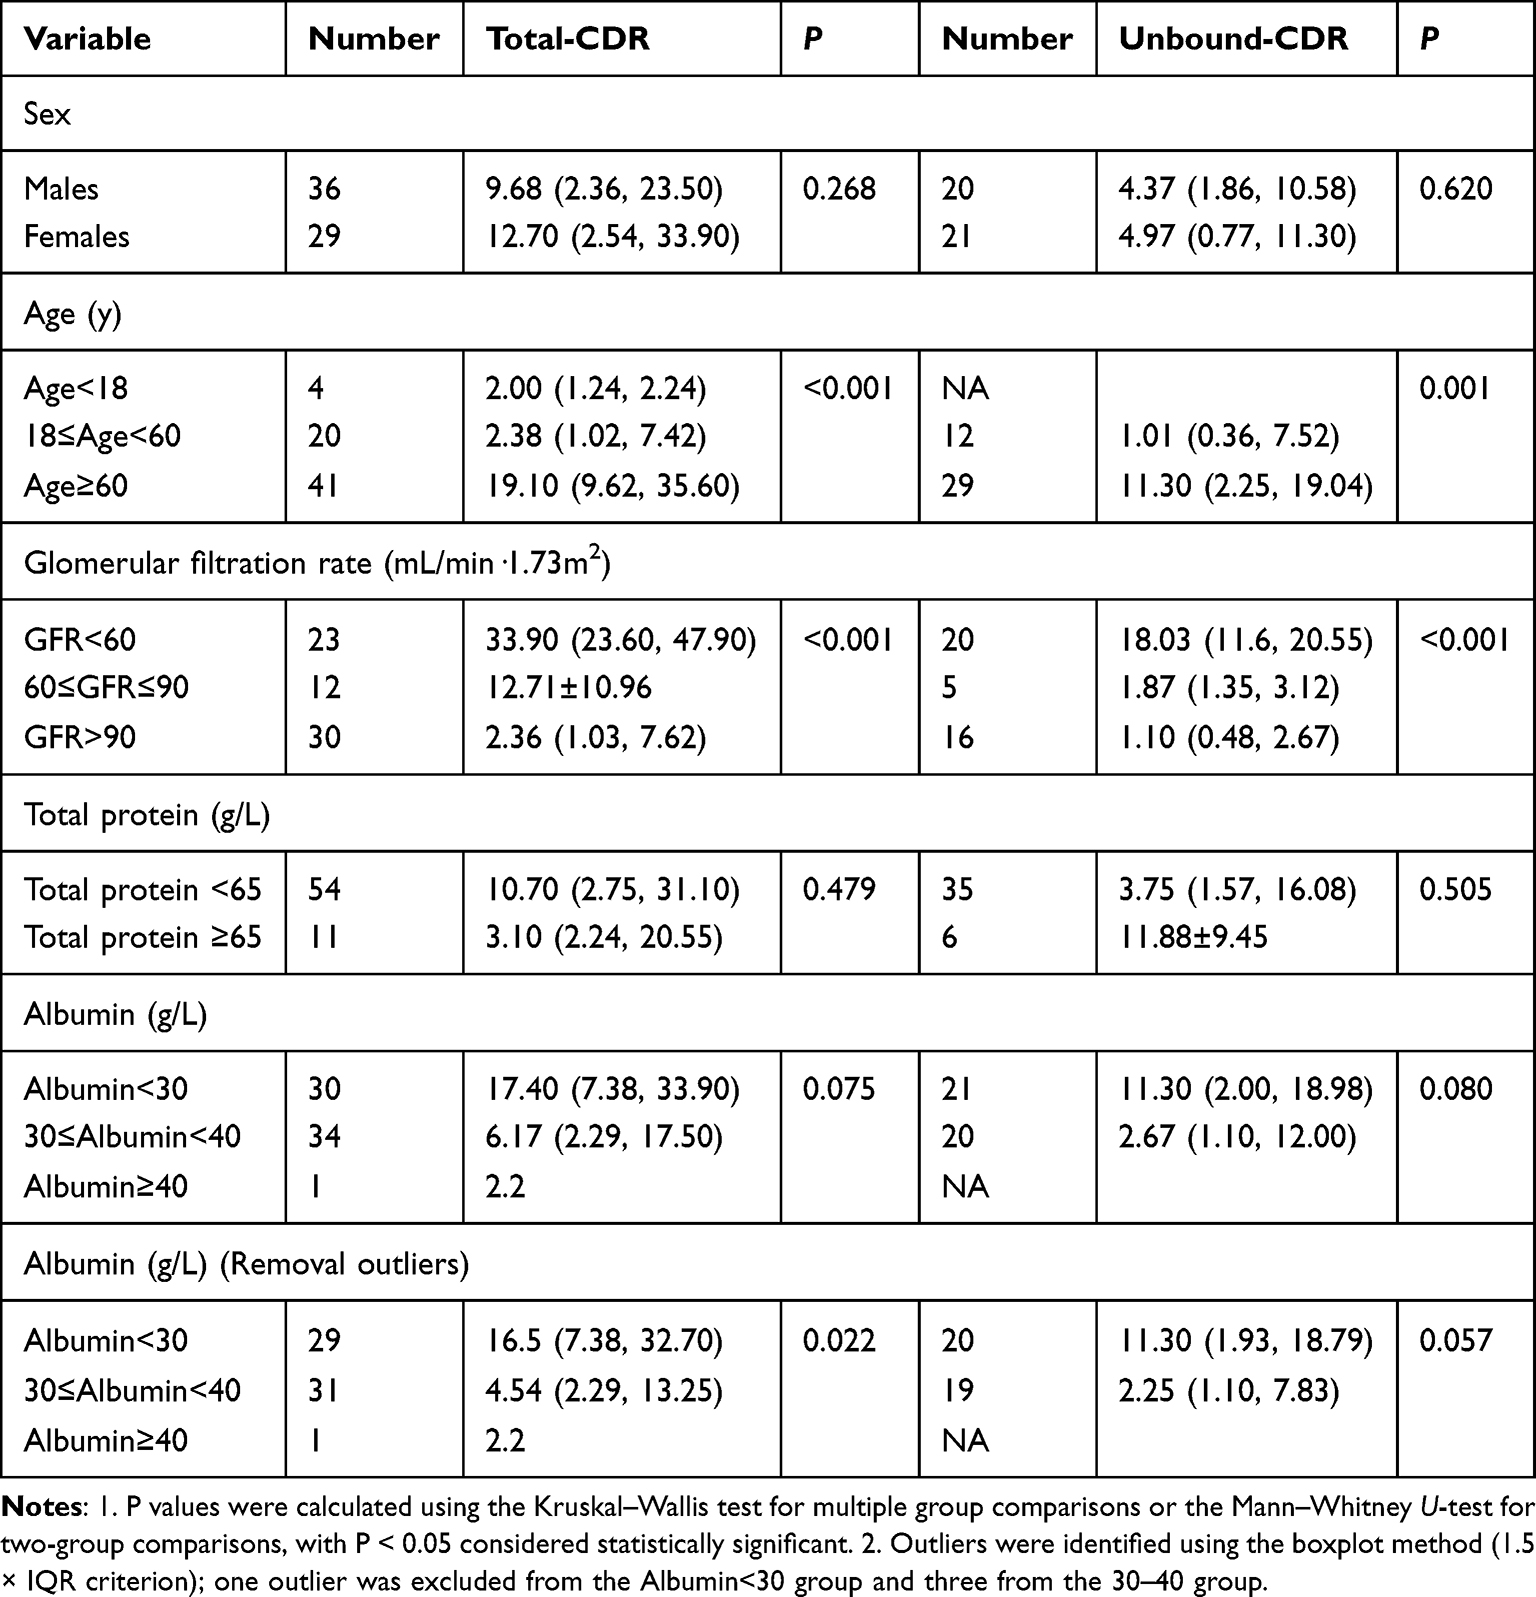 |
Table 5 Plasma Concentration Data for Ertapenem |
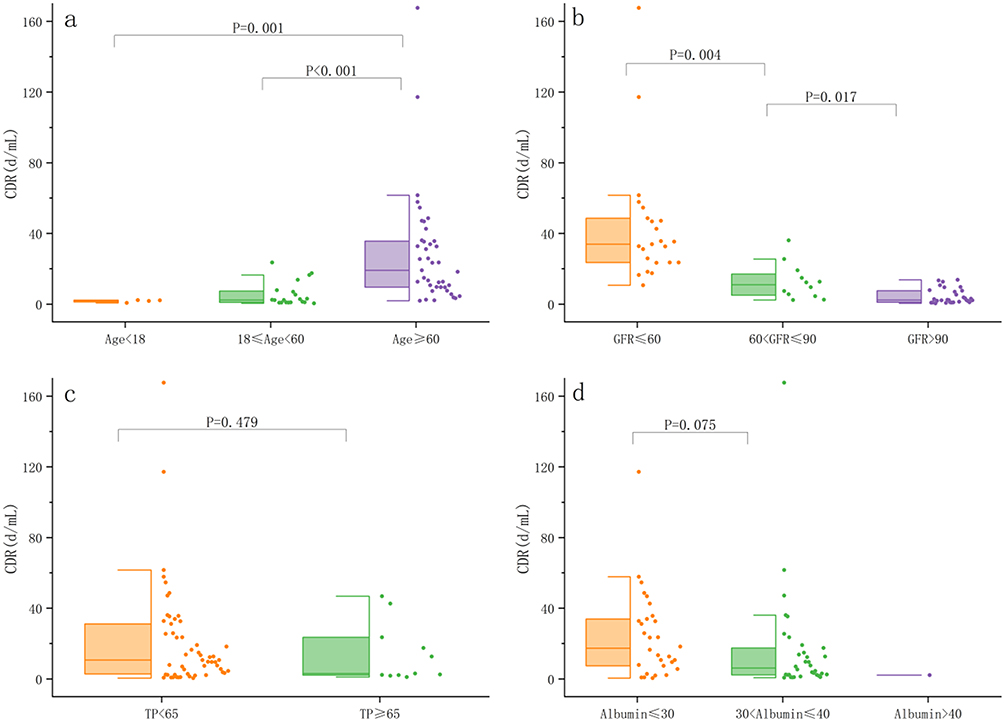 |
Figure 2 Factors influencing the total blood concentration of ertapenem (ERT). (a) age; (b) GFR; (c) total protein; (d) albumin. Boxes represent interquartile range (IQR); horizontal lines indicate medians; whiskers extend to 1.5×IQR (one extreme value is not shown in the figure due to scale limits); scatter points represent individual measured values. |
Although TP and ALB were not statistically significant predictors in the overall regression model (P > 0.05), patients in the low TP group (<60 g/L) had a 2.45-fold higher median CDR than those in the high TP group (≥60 g/L), whereas the low ALB group (<35 g/L) had a 1.82-fold higher CDR than the normal ALB group. Sensitivity analysis showed a significant association between ALB and total concentration after excluding outliers (P = 0.022), outliers were identified using the boxplot method (1.5 × IQR criterion). The lack of a significant association between albumin and unbound CDR may be explained by the dominant effect of GFR on drug clearance and the compensatory increase in unbound drug elimination in hypoalbuminemia patients, which partially offsets changes in unbound concentration.
The unbound concentration analysis yielded similar trends (Table 5 and Figure 3). Age-stratified analysis showed a 10.19-fold increase in unbound CDR in the elderly group compared to that in the adult group (95% CI: 8.77–11.61). GFR exhibited a stepwise effect: the mild impairment group showed a 0.7-fold increase relative to the normal group, and the moderate impairment group showed an 8.64-fold increase relative to the mild impairment group (95% CI: 7.25–10.03). The CDR was 4.02-fold higher in the low ALB group. However, after excluding outliers, the association between ALB and unbound concentrations was no longer statistically significant (P = 0.057).
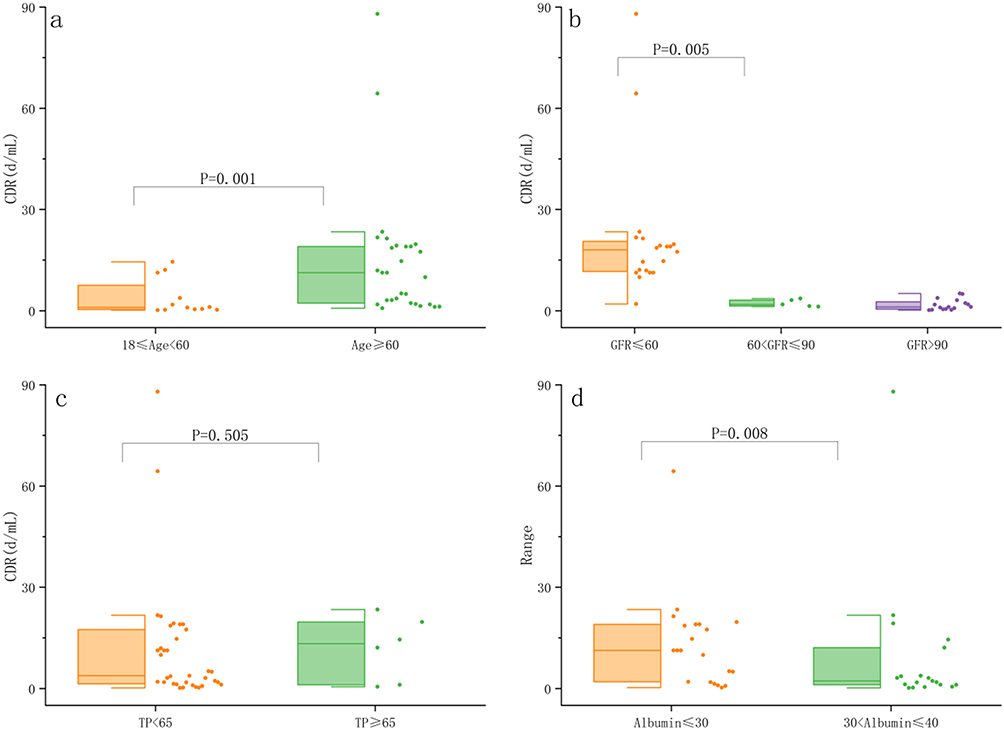 |
Figure 3 Factors influencing the unbound blood concentration of ertapenem (ERT). (a) age; (b) GFR; (c) total protein; (d) albumin. Boxes represent interquartile range (IQR); horizontal lines indicate medians; whiskers extend to 1.5×IQR (one extreme value is not shown in the figure due to scale limits); scatter points represent individual measured values. |
PBPK Model Simulation
Adult PBPK Modeling
The parameters were optimized using data from three published pharmacokinetic studies to construct a representative virtual subject (a 34-year-old healthy European male). This individual model was used to simulate the plasma concentration–time profile of ertapenem following a single 1 g intravenous dose of ertapenem.
After successful validation of the individual model, a virtual cohort of 1000 healthy adults was generated using the PK-Sim population library to develop the PBPK model for ertapenem. Figure 4 illustrates the simulated total plasma concentration–time profiles along with the observed data from healthy participants receiving intravenous ertapenem. The average AFE values for both total and unbound ertapenem plasma concentration–time profiles calculated from the final adult population model are presented in Table 6. The predicted and observed mean pharmacokinetic parameters were in close agreement, confirming the model’s reliability and predictive accuracy.
 |
Table 6 Healthy Adult Model Predicted and Observed Values |
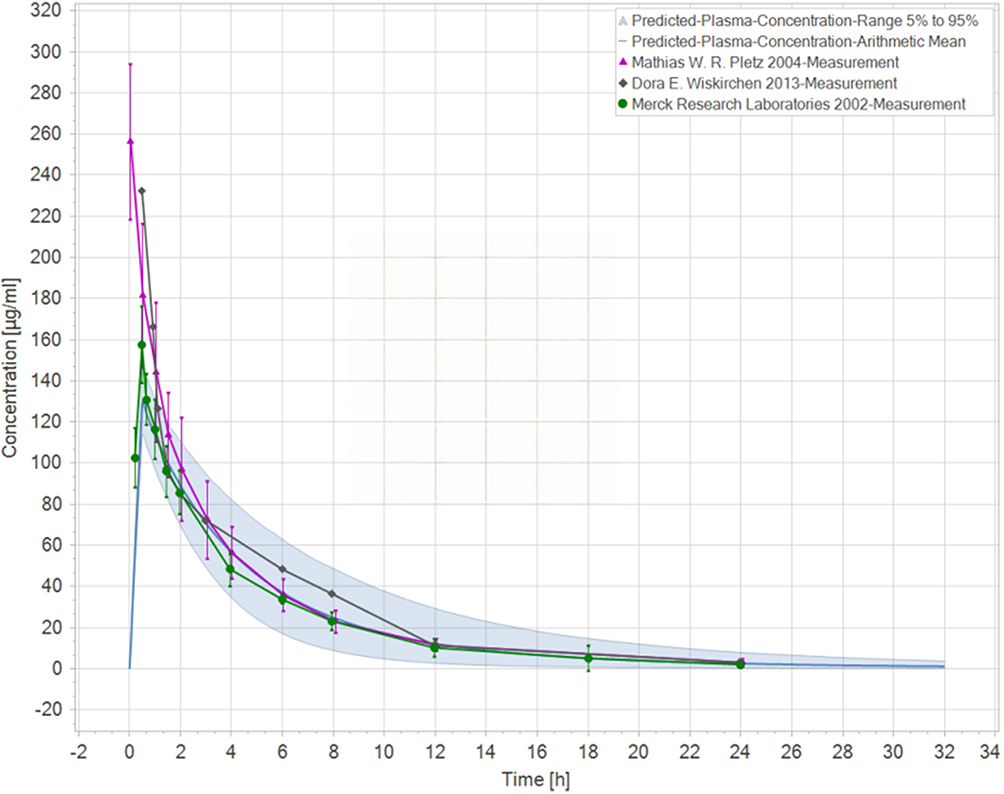 |
Figure 4 Simulated versus observed drug-time curves for a single intravenous injection of 1 g ertapenem in healthy adults. Solid blue lines represent simulated mean total concentrations; shaded areas represent the 5th–95th percentile range; symbols represent observed data from published studies (see legend for details). |
PBPK Modeling in Older People
To simulate the pharmacokinetics of a single 1 g intravenous dose of ertapenem (administered over 30 min) in healthy older adults, a plasma protein scale factor of 1.80 was applied based on the published data regarding age-related changes in protein binding. The resulting PBPK model simulated both the total and unbound plasma concentration–time profiles, which were compared with the observed clinical data from healthy older individuals (Figure 5). The predicted mean pharmacokinetic parameters for total and unbound ertapenem were within 0.5- to 2-fold of the corresponding observed values (Table 7), satisfying the commonly accepted criterion for PBPK model performance. These results support the reliability of the model in predicting ertapenem pharmacokinetics in healthy older adults.
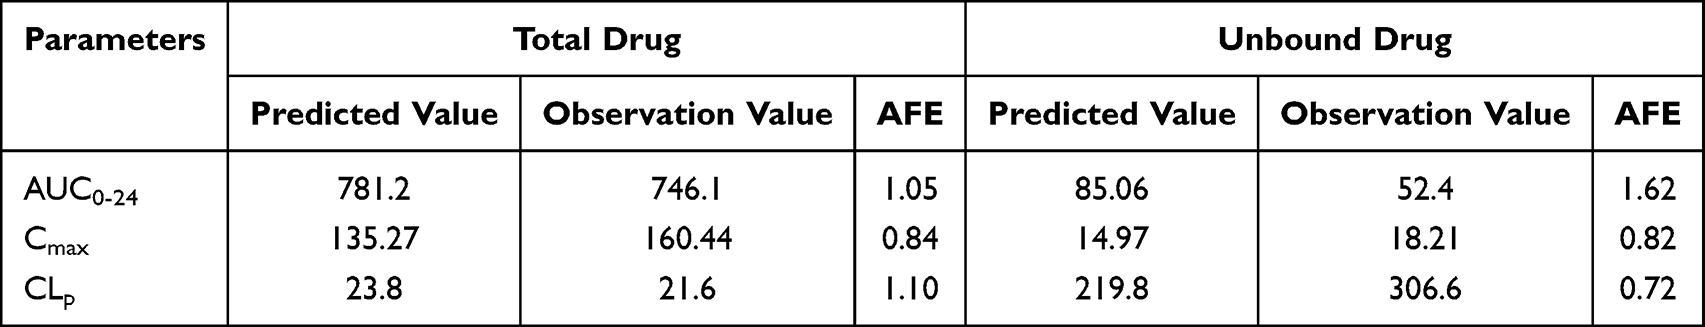 |
Table 7 Model Predicted and Observed Values for Healthy Older Adults |
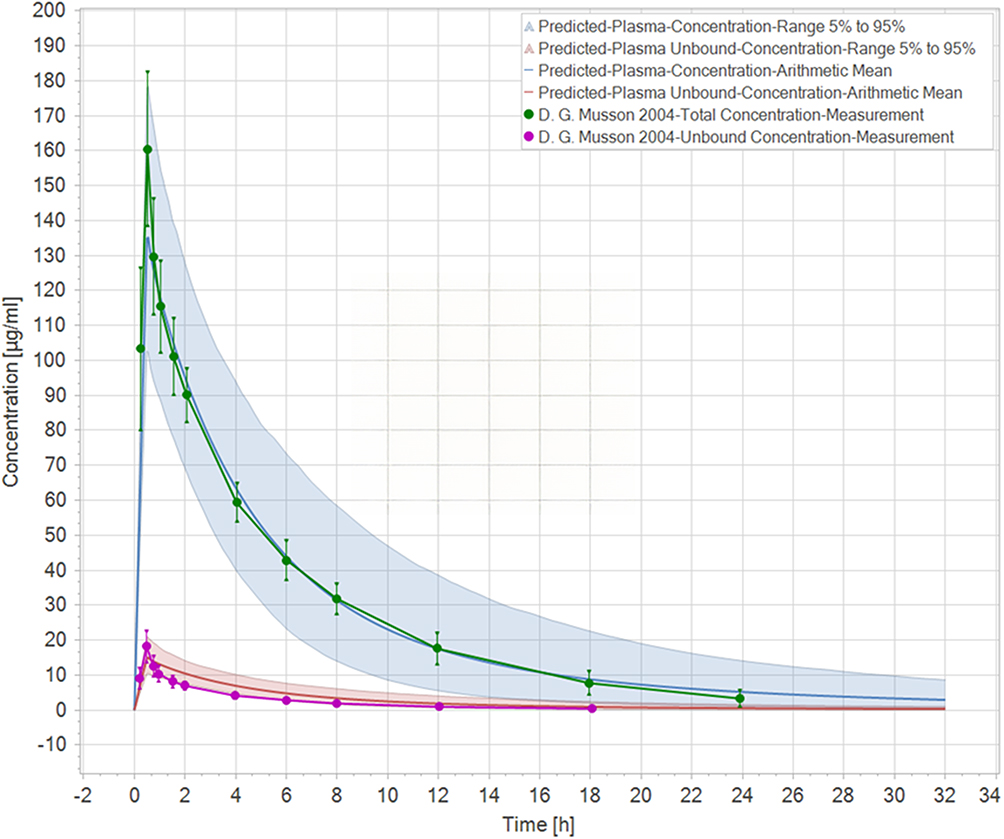 |
Figure 5 Simulated and observed drug-time profiles of a single intravenous injection of 1 g of ertapenem in healthy older adults. Solid blue lines represent simulated mean total concentrations; solid red lines represent simulated mean unbound concentrations; shaded areas represent the 5th–95th percentile range; symbols represent observed data from published studies (see legend for details). |
PBPK Simulation in Hypoalbuminemia Older Patients
To simulate the pharmacokinetics of a single 1 g intravenous dose of ertapenem (administered over 30 min) in older hypoalbuminemia individuals, a plasma protein scale factor of 5.50 was applied. As no pharmacokinetic studies specifically targeting hypoalbuminemia patients are available, data from a published study involving critically ill older patients were used for the model fitting.
Figure 6 presents the simulated plasma concentration–time profiles for total and unbound ertapenem, alongside the observed clinical data from these critically ill older populations. The predicted mean pharmacokinetic parameters were within 0.5- to 2-fold of the observed values (Table 8), indicating that the model reliably predicted total and unbound ertapenem concentrations in older patients with hypoalbuminemia.
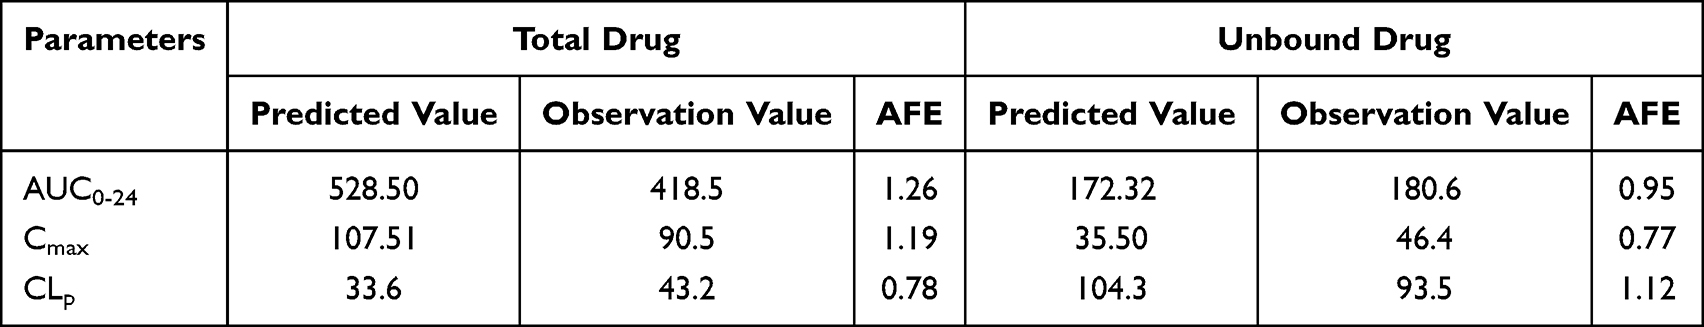 |
Table 8 Model Predicted and Observed Values for Older Adults with Hypoproteinemia |
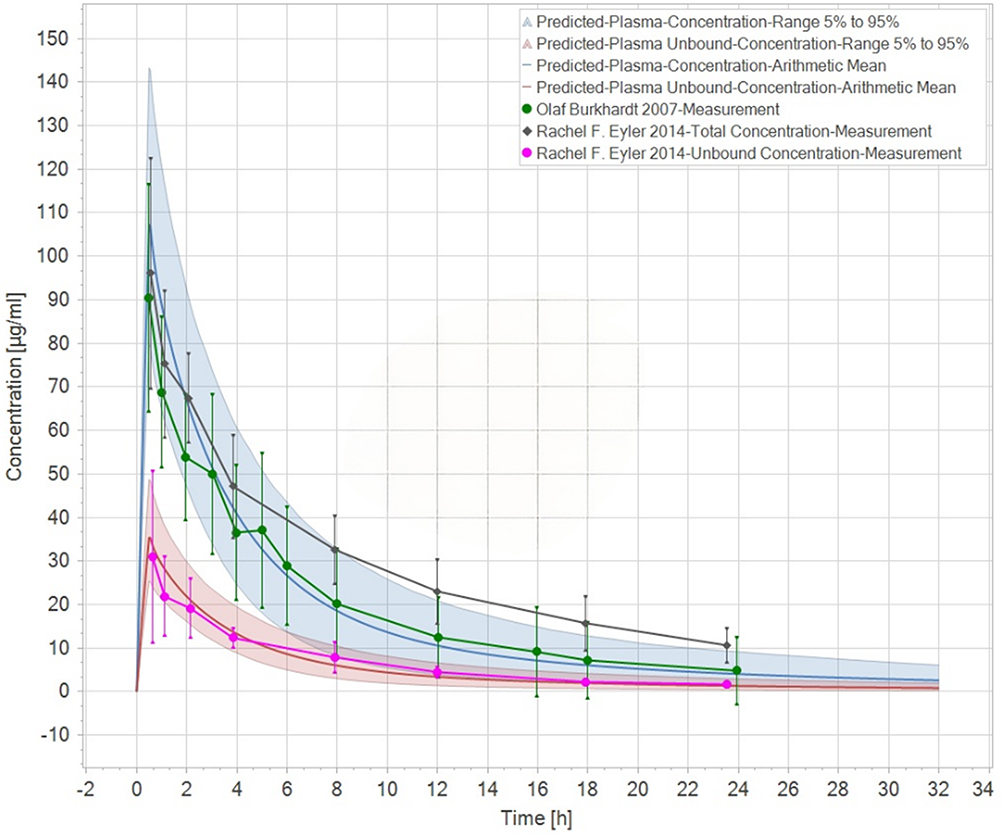 |
Figure 6 Simulated versus observed drug-time curves for a single intravenous dose of 1 g ertapenem in older adults with hypoalbuminemia. Solid blue lines represent simulated mean total concentrations; solid red lines represent simulated mean unbound concentrations; shaded areas represent the 5th–95th percentile range; symbols represent observed data from published studies (see legend for details). |
To further evaluate the model performance, individual PBPK models were constructed on a one-to-one basis for each screened patient. These models were used to predict the ertapenem plasma concentrations at the actual blood sampling time points. The predicted values were compared with the observed concentrations of the analytes. As shown in Table 9, the predicted and observed values demonstrated good agreement, further supporting the predictive accuracy and reliability of the model in older hypoalbuminemia patients.
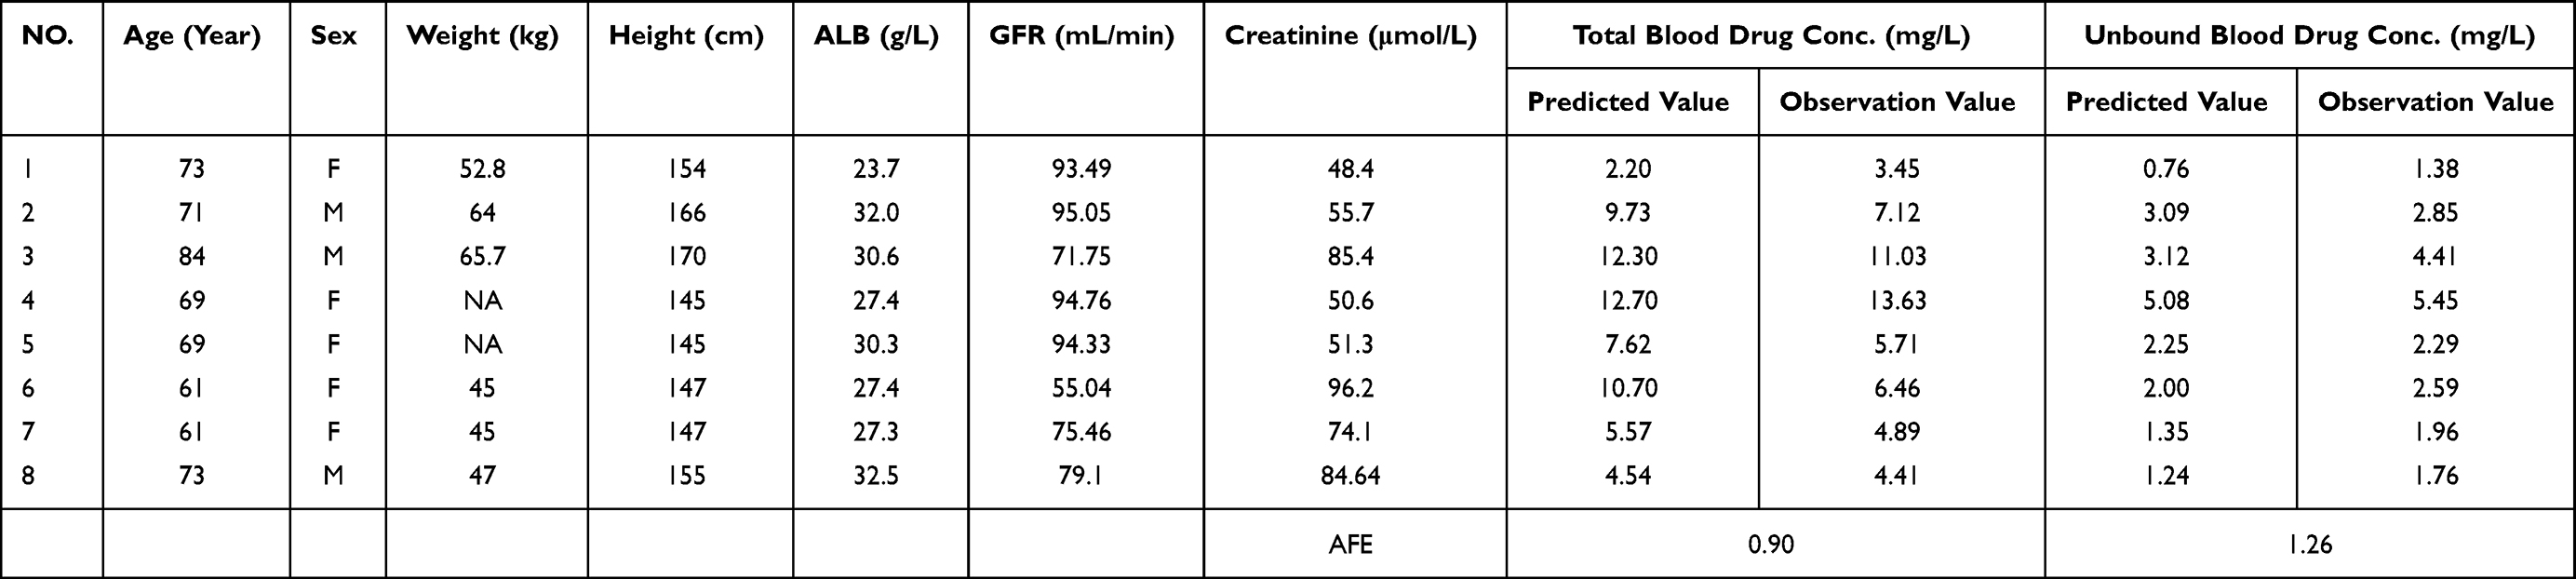 |
Table 9 Individual Patient Model Predicted and Observed Values |
Dose Simulation
These models were used to simulate plasma drug concentrations under different dosing regimens and to assess the attainment of effective unbound plasma concentrations. Figure 7 presents the simulated unbound plasma concentration–time profiles (mean ± standard deviation) over a 7-day treatment course for the three dosing regimens, based on 1000 virtual subjects per group. The probability of achieving the pharmacodynamic endpoint at steady state (following the final dose) is presented in Table 10.
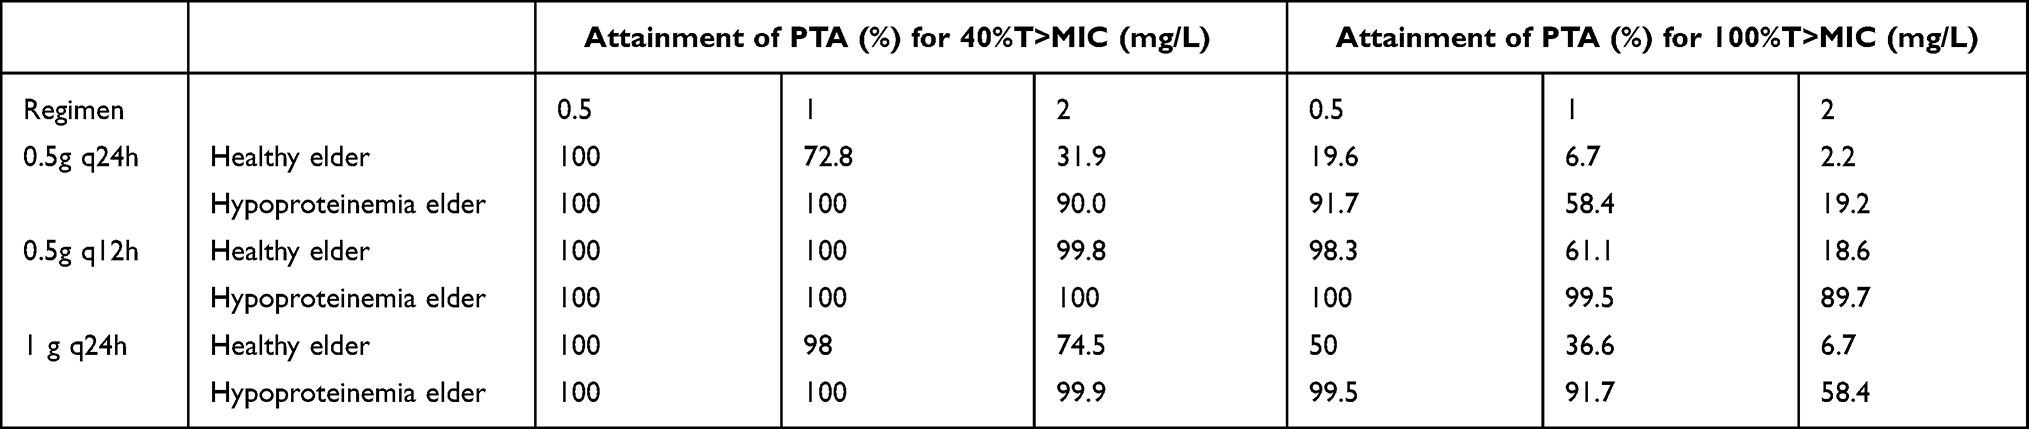 |
Table 10 Simulated Unbound Concentration Compliance Rates (40%T>MIC) |
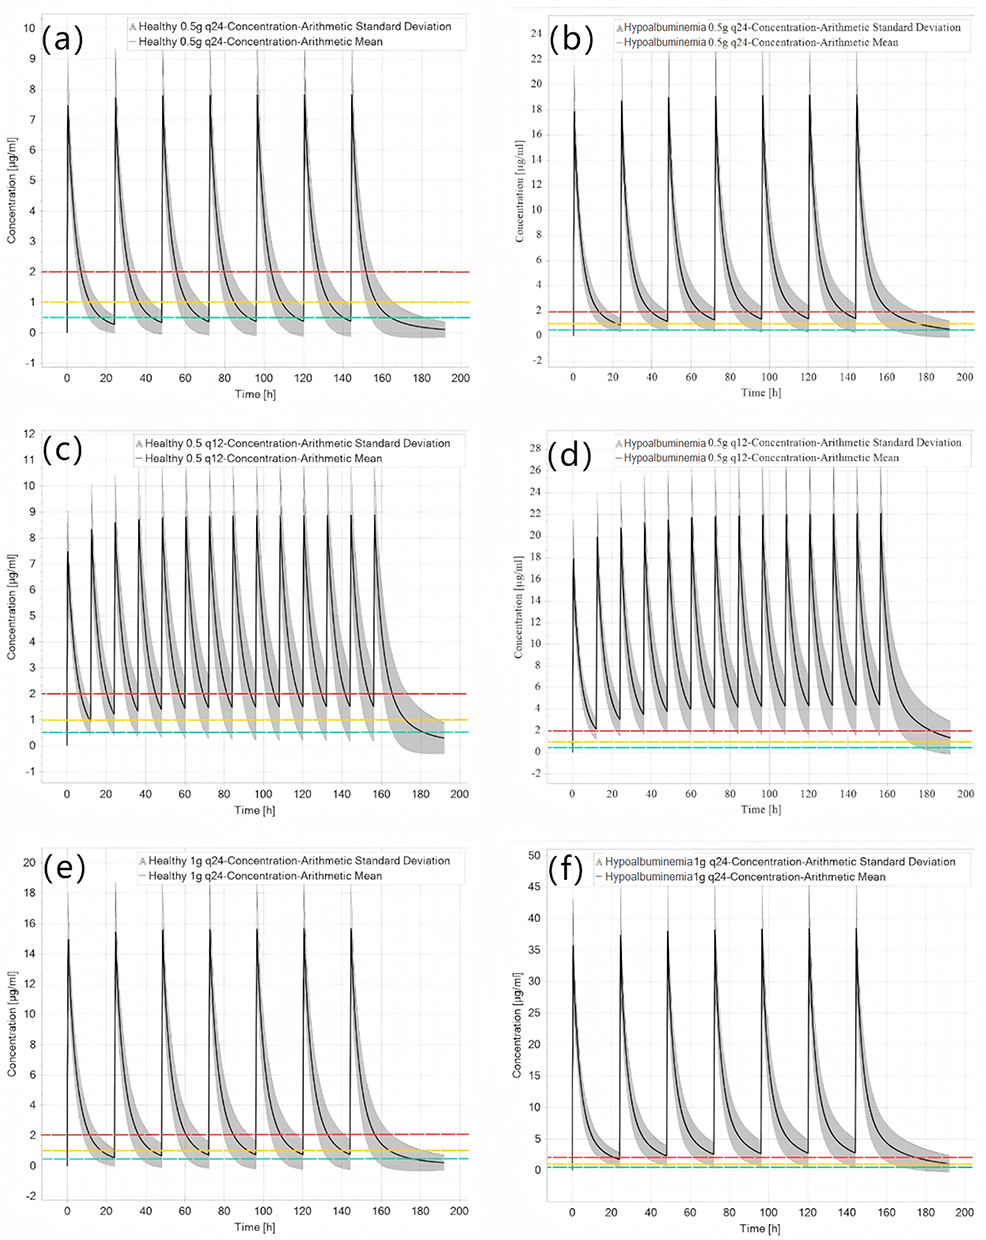 |
Figure 7 Simulated ertapenem (ERT) concentration–time profiles in healthy and hypoalbuminemia elderly groups under different 7-day continuous intravenous infusion regimens. (a, c, and e) represent simulations in healthy elderly subjects; (b, d and f) represent simulations in hypoalbuminemia elderly subjects. (a and b): 0.5 g q24h regimen; (c and d): 0.5 g q12h regimen; (e and f): 1 g q24h regimen. Solid lines represent the simulated mean concentrations; shaded areas represent the 5th–95th percentile range. The red, yellow, and green wavy lines represent minimum inhibitory concentration (MIC) thresholds of 2 mg/L, 1 mg/L, and 0.5 mg/L, respectively. |
Discussion
Analytical Method Development and Validation
A reliable LC-MS/MS method was developed and validated for quantifying total and unbound ertapenem concentrations in human plasma, using protein precipitation for total concentration and hollow-fiber centrifugal ultrafiltration (HFCF-UF) for unbound concentration. The method demonstrated good linearity, accuracy, and precision, with extraction recoveries exceeding 94%. The HFCF-UF technique, which directs centrifugal force parallel to the hollow fibers, effectively avoids concentration polarization and allows efficient separation of unbound drug. Among three fiber materials tested, polysulfone showed the least nonspecific adsorption and was therefore selected. Stability studies showed that ertapenem degraded after 3 months at −20°C but remained stable for up to 1 month under the adopted storage conditions (processed within 4 days at 4°C, stored at −20°C for ≤1 month). These results confirm that the method is suitable for therapeutic drug monitoring and pharmacokinetic studies of ertapenem.
Analysis of Influencing Factors
This study demonstrated that both age and renal function significantly affect ertapenem pharmacokinetics. The total and unbound CDRs were significantly higher in older patients (≥65 years) than in adults, consistent with previous studies that reported increased AUC0–∞ and reduced clearance in older populations. These changes may be attributed to age-related declines in renal function and metabolic capacity.19,27 As ertapenem is primarily eliminated renally, its pharmacokinetic parameters are closely linked to renal function. In the present study, GFR was negatively correlated with ertapenem exposure, highlighting a clear dose–response relationship between the two. These findings support the need for dose adjustment in patients with renal insufficiency.18
Regarding protein binding, although multivariate analysis did not identify albumin as a statistically significant predictor of unbound CDR (P > 0.05), stratified analysis revealed a 1.82-fold increase in unbound ertapenem exposure in patients with hypoalbuminemia (ALB < 35 g/L) compared with those with mildly reduced albumin levels (35–40 g/L). The lack of statistical significance in the multivariate analysis may be attributed to the relatively small sample size (n=39) and the dominant effect of renal function. For total concentration, this effect became statistically significant after the exclusion of outliers (P = 0.022, Table 4), suggesting that albumin plays a role in regulating ertapenem disposition by modulating protein binding.28–30 Notably, 35 of the 36 patients (97.2%) had reduced albumin levels or hypoalbuminemia, emphasizing the clinical relevance of this factor. Although the influence of protein binding warrants validation in larger cohorts, current evidence suggests that albumin levels may serve as a more informative marker than total protein levels for dosing considerations.
PBPK Model-Based Dose Simulation
The unbound fraction (fu) of ertapenem was found to be substantially higher in hypoalbuminemia patients than in healthy volunteers, ranging from 20% to 40% in the former versus 5% to 15% in the latter, consistent with the trends observed in critically ill populations.31 This discrepancy likely results from altered pharmacokinetics and reduced albumin concentrations in hypoalbuminemia, which decrease the number of drug binding sites.29,32–34 These changes contribute to elevated unbound drug levels, potentially necessitating dosage adjustment.
In hypoalbuminemia individuals, the increased proportion of unbound drugs may lead to higher free plasma concentrations and faster clearance,35 potentially compromising the attainment of pharmacodynamic targets. In addition, short-term exposure to elevated unbound levels may increase the risk of adverse effects.
It should be noted that clinical TDM data alone could not directly compare different dosing regimens due to the complex confounding factors (eg, multiple comorbidities and concomitant medications) and the limited sample size of hypoalbuminemia patients. Therefore, PBPK simulation was employed to complement the TDM findings by systematically evaluating alternative dosing strategies after rigorous internal and external validation.
To address these concerns, PBPK modeling was employed to simulate the pharmacodynamic performance of various ertapenem dosing regimens in patients with hypoalbuminemia. The simulations revealed that the conventional 1 g once-daily regimen performed suboptimally in this population: while 91.7% of simulated patients met the target at an MIC of 1 mg/L, coverage dropped to below 60% at an MIC of 2 mg/L. In contrast, the 0.5 g twice-daily regimen resulted in 89.7% of patients maintaining plasma concentrations above 2 mg/L throughout the dosing interval. Furthermore, this regimen yielded lower peak concentrations (Cmax), thereby reducing the potential for concentration-related toxicity.
The model also highlighted the differences in pharmacodynamic target attainment between the protein-binding states. Although the hypoalbuminemia group demonstrated >90% attainment of the 40%fT>MIC threshold across dosing regimens, marked variability was observed under the more stringent 100%fT>MIC target (19.2%–89.6% of the patients). Notably, pharmacodynamic compliance was consistently higher in the hypoalbuminemia group than in the normoalbuminemic group under identical regimens, reinforcing the need for tailored dosing strategies in this population.
The simulation results suggest that elevated unbound ertapenem concentrations occur in older patients with hypoalbuminemia and preserved renal function due to decreased plasma protein binding. Despite accelerated clearance, the resulting free drug levels remained significantly higher than those in older normoalbuminemic patients. These findings support the use of individualized dosing approaches for hypoalbuminemia patients. The once-daily 0.5 g regimen was associated with suboptimal pharmacodynamic target attainment, whereas the twice-daily 0.5 g regimen improved target attainment and reduced peak exposure, supporting increased dosing frequency or prolonged infusion duration as viable strategies to improve treatment efficacy and safety in this population.
This study has several limitations. Most model parameters were derived from the published literature, and pharmacokinetic data specific to patients with hypoalbuminemia remain limited. Model extrapolation relies heavily on data from critically ill older patients, whose complex pathophysiological conditions may introduce bias. Therefore, although the present study provides useful insights, ertapenem dosing regimens for hypoalbuminemia patients should be further validated in large-scale prospective clinical trials.
Conclusion
This study employed a validated LC–MS/MS analytical method to conduct systematic drug concentration monitoring and multivariate analysis of clinical samples from patients receiving ERT. The results confirmed that patient age and renal function are the primary factors influencing both total and free drug exposure, whereas albumin levels showed a significant correlation with the total drug concentration after excluding outliers. By establishing a PBPK model and comparing simulations of three different dosing regimens, this study further demonstrated that drug exposure levels in patients with hypoalbuminemia differ significantly, highlighting the necessity of dose adjustment in this specific population.
Abbreviations
AFE, Average folding error; ALB, Albumin; AUC, Area under the plasma concentration-time curve; CDR, Concentration-dose ratio; CLp, Plasma clearance; Cmax, Maximum blood concentration; Conc., Concentration; CrCl, Creatinine clearance; ERT, Ertapenem; ESI, Electron spray ionization; FA, Formic acid; fu; Free fraction; GFR, Glomerular filtration rate; HEPES, Sodium 4-(2-hydroxyethyl) Piperazine-1-ethanesulfonate; HFCF-UF, Hollow fiber centrifugal ultrafiltration technology; IS, Internal standard; LLOQ, Lower limit of quantification; MeOH, Methyl alcohol; MES, 2-(N-morpholinyl) ethanesulfonic acid; MIC, Minimum inhibitory concentration; MOPS, 3-Morpholinepropanesulfonic acid.
Data Sharing Statement
All data generated or analysed during this study are included in this published article [and its supplementary information files].
Ethics Approval and Consent to Participate
The study protocol was approved by the Ethics Committee of Hebei General Hospital (Approval No. 2024380). Since this study uses blood samples remaining after routine patient testing, an exemption from informed consent was requested. All patient data were anonymized and handled with strict confidentiality to protect patient privacy. This study was conducted in accordance with the principles of the Declaration of Helsinki.
Consent for Publication
All authors agree to the publication of any images, data, and other details included in the article, and have reviewed the content of the article to be published.
Author Contributions
All authors made a significant contribution to the work reported, whether that is in the conception, study design, execution, acquisition of data, analysis and interpretation, or in all these areas; took part in drafting, revising or critically reviewing the article; gave final approval of the version to be published; have agreed on the journal to which the article has been submitted; and agree to be accountable for all aspects of the work.
Funding
Multi-model-guided individualized treatment strategy of ertapenem. Hebei Provincial Medical Research-Enterprise Joint Innovation Special Project 2026, Hebei Provincial Health Commission & Hebei Red Cross Society [LH20250020].
Disclosure
The authors declare that they have no competing interests.
References
1. Gordien JB, Boselli E, Fleureau C, et al. Determination of free ertapenem in plasma and bronchoalveolar lavage by high-performance liquid chromatography with ultraviolet detection. J Chromatogr B. 2006;830(2):218–20. doi:10.1016/j.jchromb.2005.10.037
2. D’Avolio A, Baietto L, De Rosa FG, et al. A simple and fast method for quantification of ertapenem using meropenem as internal standard in human plasma in a clinical setting. Therapeutic Drug Monitor. 2008;30(1):90–94. doi:10.1097/FTD.0b013e31815f4f7e
3. Koal T, Deters M, Resch K, Kaever V. Quantification of the carbapenem antibiotic ertapenem in human plasma by a validated liquid chromatography–mass spectrometry method. Clin Chim Acta. 2006;364(1–2):239–245. doi:10.1016/j.cccn.2005.07.004
4. Briscoe SE, McWhinney BC, Lipman J, Roberts JA, Ungerer JPJ. A method for determining the free (unbound) concentration of ten beta-lactam antibiotics in human plasma using high performance liquid chromatography with ultraviolet detection. J Chromatogr B. 2012;907:178–184. doi:10.1016/j.jchromb.2012.09.016
5. Dong WC, Guo JL, Wu XK, et al. Relationship between the free and total methotrexate plasma concentration in children and application to predict the toxicity of HD-MTX. Front Pharmacol. 2021;12:636975. doi:10.3389/fphar.2021.636975
6. Wang C, Zhou Y, Zhou Y, Ye C. Ertapenem-induced neurotoxicity: a literature review of clinical characteristics and treatment outcomes. IDR. 2023;16:3649–3658. doi:10.2147/IDR.S406852
7. Lee YC, Huang YJ, Hung MC, et al. Risk factors associated with the development of seizures among adult patients treated with ertapenem: a matched case-control study. PLoS One. 2017;12(7):e0182046. doi:10.1371/journal.pone.0182046
8. El Nekidy WS, Elrefaei H, St. John TJL, et al. Ertapenem neurotoxicity in hemodialysis patients—safe and effective dosing is still needed: a retrospective study and literature review. Ann Pharmacother. 2021;55(1):52–58. doi:10.1177/1060028020938059
9. Danés I, Pérez E, Pigrau C, et al. A case series of confusional states and other neurotoxic effects caused by ertapenem. Brit J Clin Pharm. 2021;87(4):2140–2145. doi:10.1111/bcp.14582
10. Campany-Herrero D, Pau-Parra A, González-Moreno P, Vima-Bofarull J, Anguita-Domingo D, Montoro-Ronsano B. Ertapenem blood concentration: a retrospective cohort study to analyse risk of neurotoxicity. Brit J Clin Pharm. 2023;89(9):2843–2850. doi:10.1111/bcp.15782
11. Phinder-Puente ME, Pérez-Nieto OR, Mondragón-Labelle TO, Pérez-Barragán E, Soto Muñoz L, Deloya-Tomas E. Considerations and concerns regarding the use of ertapenem in patients with hypoalbuminemia: is it truly inappropriate? Clinl Infect Dis. 2024;78(2):488–489. doi:10.1093/cid/ciad558
12. Wang H, Ni X, Dong W, Qin W, Xu L, Jiang Y. Accurately quantified plasma free glycine concentration as a biomarker in patients with acute ischemic stroke. Amino Acids. 2023;55(3):385–402. doi:10.1007/s00726-023-03236-x
13. Li J, Shi Q, Jiang Y, Liu Y. Pretreatment of plasma samples by a novel hollow fiber centrifugal ultrafiltration technique for the determination of plasma protein binding of three coumarins using acetone as protein binding releasing agent. J Chromatogr B. 2015;1001:114–123. doi:10.1016/j.jchromb.2015.07.048
14. Ren F, Liu Y, Li S, et al. Therapeutic drug monitoring of free vancomycin concentration in practice: a new analytical technique based on the HFCF–UF sample separation method. Biomed Chromatogr. 2023;37(3):e5559. doi:10.1002/bmc.5559
15. Aw K, Huang R, McMullen E, Piguet V, Croitoru D. Efficacy and safety of carbapenem antibiotics in hidradenitis suppurativa: a systematic review. J Cutan Med Surg. 2024;12034754241295674. doi:10.1177/12034754241295674
16. Schießer S, Hitzenbichler F, Kees MG, et al. Measurement of free plasma concentrations of beta-lactam antibiotics: an applicability study in intensive care unit patients. Therapeutic Drug Monitor. 2021;43(2):264–270. doi:10.1097/FTD.0000000000000827
17. Wiskirchen DE, Housman ST, Quintiliani R, Nicolau DP, Kuti JL. Comparative pharmacokinetics, pharmacodynamics, and tolerability of ertapenem 1 gram/day administered as a rapid 5-minute infusion versus the standard 30-minute infusion in healthy adult volunteers. Pharmacotherapy. 2013;33(3):266–274. doi:10.1002/phar.1197
18. Majumdar AK, Musson DG, Birk KL, et al. Pharmacokinetics of ertapenem in healthy young volunteers. Antimicrob Agents Chemother. 2002;46(11):3506–3511. doi:10.1128/AAC.46.11.3506-3511.2002
19. Pletz MWR, Rau M, Bulitta J, et al. Ertapenem pharmacokinetics and impact on intestinal microflora, in comparison to those of ceftriaxone, after multiple dosing in male and female volunteers. Antimicrob Agents Chemother. 2004;48(10):3765–3772. doi:10.1128/AAC.48.10.3765-3772.2004
20. Brink AJ, Richards GA, Schillack V, Kiem S, Schentag J. Pharmacokinetics of once-daily dosing of ertapenem in critically ill patients with severe sepsis. Int J Antimicrob Agents. 2009;33(5):432–436. doi:10.1016/j.ijantimicag.2008.10.005
21. Burkhardt O, Hafer C, Langhoff A, et al. Pharmacokinetics of ertapenem in critically ill patients with acute renal failure undergoing extended daily dialysis. Nephrol Dial Transplant. 2008;24(1):267–271. doi:10.1093/ndt/gfn472
22. Eyler RF, Vilay AM, Nader AM, et al. Pharmacokinetics of ertapenem in critically ill patients receiving continuous venovenous hemodialysis or hemodiafiltration. Antimicrob Agents Chemother. 2014;58(3):1320–1326. doi:10.1128/AAC.02090-12
23. Liebchen U, Kratzer A, Wicha SG, Kees F, Kloft C, Kees MG. Unbound fraction of ertapenem in intensive care unit patients. J Antimicrob Chemother. 2014;69(11):3108–3111. doi:10.1093/jac/dku226
24. Karatza E, Sinha J, Maglalang PD, Edginton A, Gonzalez D. Physiologically-based pharmacokinetic modeling of total and unbound valproic acid to evaluate dosing in children with and without hypoalbuminemia. Clin Pharmacokinet. 2024;63(10):1435–1448. doi:10.1007/s40262-024-01418-8
25. Baker MA, Schneider EK, X. Huang J, Cooper MA, Li J, Velkov T. The plasma protein binding proteome of ertapenem: a novel compound-centric proteomic approach for elucidating drug–plasma protein binding interactions. ACS Chem Biol. 2016;11(12):3353–3364. doi:10.1021/acschembio.6b00700
26. Zhou J, Sulaiman Z, Llorin RM, et al. Pharmacokinetics of ertapenem in outpatients with complicated urinary tract infections. J Antimicrob Chemother. 2014;69(9):2517–2521. doi:10.1093/jac/dku143
27. Musson DG, Majumdar A, Holland S, et al. Pharmacokinetics of total and unbound ertapenem in healthy elderly subjects. Antimicrob Agents Chemother. 2004;48(2):521–524. doi:10.1128/AAC.48.2.521-524.2004
28. Nix DE, Matthias KR, Ferguson EC. Effect of ertapenem protein binding on killing of bacteria. Antimicrob Agents Chemother. 2004;48(9):3419–3424. doi:10.1128/AAC.48.9.3419-3424.2004
29. Zusman O, Farbman L, Tredler Z, et al. Association between hypoalbuminemia and mortality among subjects treated with ertapenem versus other carbapenems: prospective cohort study. Clin Microbiol Infect. 2015;21(1):54–58. doi:10.1016/j.cmi.2014.08.003
30. Gadallah MI, Ali HRH, Askal HF, Saleh GA. Towards understanding of the interaction of certain carbapenems with protein via combined experimental and theoretical approach. Spectrochimica Acta Part A. 2021;246:119005. doi:10.1016/j.saa.2020.119005
31. Ye L, Ke M, You X, Huang P, Lin C. A physiologically based pharmacokinetic model of ertapenem in pediatric patients with renal impairment. J Pharmaceut Sci. 2020;109(9):2909–2918. doi:10.1016/j.xphs.2020.06.010
32. Ebisch RMF, Meenks SD, Foudraine N, Janssen PKC, Le Noble JLML. Ceftriaxone dosing in a critically ill patient with hypoalbuminemia during continuous venous hemofiltration: emphasis on unbound pharmacokinetics. J Clin Pharm. 2020;60(1):140–142. doi:10.1002/jcph.1503
33. Ulldemolins M, Roberts JA, Rello J, Paterson DL, Lipman J. The effects of hypoalbuminaemia on optimizing antibacterial dosing in critically ill patients. Clin Pharmacokinet. 2011;50(2):99–110. doi:10.2165/11539220-000000000-00000
34. Pérez-Blanco JS, Sáez Fernández EM, Calvo MV, Lanao JM, Martín-Suárez A. Amikacin initial dosage in patients with hypoalbuminaemia: an interactive tool based on a population pharmacokinetic approach. J Antimicrob Chemother. 2020;75(8):2222–2231. doi:10.1093/jac/dkaa158
35. Hayashi Y, Lipman J, Udy AA, et al. β-Lactam therapeutic drug monitoring in the critically ill: optimising drug exposure in patients with fluctuating renal function and hypoalbuminaemia. Int J Antimicrob Agents. 2013;41(2):162–166. doi:10.1016/j.ijantimicag.2012.10.002
 © 2026 The Author(s). This work is published and licensed by Dove Medical Press Limited. The
full terms of this license are available at https://www.dovepress.com/terms
and incorporate the Creative Commons Attribution
- Non Commercial (unported, 4.0) License.
By accessing the work you hereby accept the Terms. Non-commercial uses of the work are permitted
without any further permission from Dove Medical Press Limited, provided the work is properly
attributed. For permission for commercial use of this work, please see paragraphs 4.2 and 5 of our Terms.
© 2026 The Author(s). This work is published and licensed by Dove Medical Press Limited. The
full terms of this license are available at https://www.dovepress.com/terms
and incorporate the Creative Commons Attribution
- Non Commercial (unported, 4.0) License.
By accessing the work you hereby accept the Terms. Non-commercial uses of the work are permitted
without any further permission from Dove Medical Press Limited, provided the work is properly
attributed. For permission for commercial use of this work, please see paragraphs 4.2 and 5 of our Terms.