Back to Journals » Infection and Drug Resistance » Volume 13
Physicochemical Quality Assessment of Antimalarial Medicines: Chloroquine Phosphate and Quinine Sulfate Tablets from Drug Retail Outlets of South-West Ethiopia
Authors Abuye H ![]() , Abraham W, Kebede S
, Abraham W, Kebede S ![]() , Tatiparthi R
, Tatiparthi R ![]() , Suleman S
, Suleman S ![]()
Received 18 October 2019
Accepted for publication 3 February 2020
Published 27 February 2020 Volume 2020:13 Pages 691—701
DOI https://doi.org/10.2147/IDR.S234684
Checked for plagiarism Yes
Review by Single anonymous peer review
Peer reviewer comments 2
Editor who approved publication: Dr Joachim Wink
Habtamu Abuye,1 Woldemichael Abraham,2 Selass Kebede,1 Ramanjireddy Tatiparthi,3,4 Sultan Suleman4,5
1Department of Pharmacy, College of Medicine and Health Sciences, Wachemo University, Hossana, Ethiopia; 2Department of Pharmacy, College of Medicine and Health Sciences, Wolayita Sodo University, Wolayita Sodo, Ethiopia; 3Department of Pharmaceutics, School of Pharmacy, College of Health Sciences, Jimma University, Jimma, Ethiopia; 4Jimma University Laboratory of Drug Quality (JuLaDQ), College of Health Sciences, Jimma University, Jimma, Ethiopia; 5School of Pharmacy, College of Health Sciences, Jimma University, Jimma, Ethiopia
Correspondence: Habtamu Abuye
Department of Pharmacy, College of Medicine and Health Sciences, Wachemo University, Hossana, Ethiopia
Tel +251 913571974
Email [email protected]
Background: Malaria is a complex disease and main community health problem in Africa and the top leading cause of outpatient visits, admissions, and deaths in Ethiopia. Its effective management is possible through early diagnosis and immediate treatment employing antimalarials. The quality of these drugs has to be good enough to attain their intended purpose. However, there are treatment failures resulted from the consumption of falsified and substandard antimalarials. Therefore, the current study was undertaken to evaluate the quality of two commonly used antimalarial drugs [chloroquine phosphate and quinine sulfate tablets] and to determine whether the quality of these drugs was affected by the origin, brand and sample collection sites in South-West Ethiopia.
Methods: Random sampling based on Ethiopian malaria eco-epidemiological strata map, with different levels of medicines outlets, was applied to select sampling sites.
Results: Sixty samples were bought from 43 drug retails (pharmacy, drug store, and drug vendor) in twelve different geographical locations of South-West Ethiopia between June and July 2016. Visual inspection was done for all samples before the lab experiment. A 28.3%, 31.7%, and 6.8% of samples failed to comply with the Pharmacopoeial quality standards for visual inspection, hardness and weight variation tests, respectively. Statistical analysis revealed that origin and geography from which samples were collected significantly affects the active pharmaceutical content of both drugs at P < 0.05 level. Significant variation was observed for chloroquine samples within batches of the same manufacturing and between origins.
Conclusion: This study indicated that all the chloroquine and quinine tablets met the quality specification concerning friability, dissolution and assay. Out-of-specification results for weight variation, hardness and visual inspection tests for the chloroquine tablets are signs of substandard/spurious/falsely labeled/falsified/counterfeit actions that may compromise the quality of these drugs. Besides, within the acceptance limit, the origin of drugs and collection sites have found to determine the quality which raises good manufacturing practice and storage (drug supply chain system) issues to be evaluated.
Keywords: chloroquine, quinine, identification, assay, dissolution, uniformity of weight, hardness, friability, visual inspection
Introduction
Malaria is a complex disease and main community health problem in Africa and the top leading cause of outpatient visits, admissions, and deaths in Ethiopia. Globally, more than three billion peoples were at malaria risk in 2017. It severely affected women and children. In the same year, 203–262 million clinical cases and 435, 000 deaths were recorded.1,2
In Ethiopia, reports showed that 60–70% of malaria infections are caused by P.falciparum, 39–29% is attributed to P.vivax that is the highest proportion in the continent.3 P. malariae and P. ovale are rare and account for <1% of all confirmed malaria cases.4
Effective malaria case management is possible through early diagnosis and immediate treatment.5 Therefore, the quality of antimalarials (AMs) cannot be compromised as they are ingested into the human systems by different routes. But WHO estimated that 1 in 10 medical products in low- and middle-income countries are either substandard or falsified, posing a serious threat to patient safety.6
The term substandard/spurious/falsely labeled/falsified/counterfeit (SSFFC) medicine was introduced by WHO to describe poor-quality drugs. As per the World Health Assembly, Substandard medical products are authorized medical products that fail to meet either their quality standards or their specifications, or both. Unregistered/unlicensed medical products are medical products that have not undergone evaluation and/or approval by the national or regional regulatory authority for the market in which they are marketed/distributed or used, subject to permitted conditions under national or regional regulation and legislation. Falsified medical products are medical products that deliberately/fraudulently misrepresent their identity, composition or source.7
Poor-quality AMs are a severe but less detected public health problem compromising their therapeutic effects.8 Studies showed 67% of 12 AMs circulating the globe today, were SFFC. In 2008, Africa Fighting Malaria (AFM) reported that 35% of AMs sold in six major African cities failed at least one critical quality control test.9 In 2012 a study performed in 21 sub-Saharan countries revealed 35% of AMs failed chemical analysis, and 20% were falsified.10
In Ethiopia, Food, Medicines, Health Care Administration and Control Authority (FMHACA), surveillance on the quality of AMs reported that 34% of the drugs were unregistered and hotspots for illegal drug smuggling were identified.11 According to reports, the weak implementation of pharmaceutical regulations in the country intensifies the problems.12
Besides, pharmaceutical distribution chain evaluations showed a considerable effect on drug quality. Different forms of transportations seen to cause product instability; poor storage conditions lead drugs to degradation and then to toxicity. This made malaria management more challenging. The main challenge of malaria management is treatment failures resulted from the consumption of SF AMs.8,13–15
Currently, although artemisinin-based combination therapies (ACTs) are becoming center for managing malaria,5 chloroquine and quinine formulations are still in use in Ethiopia. WHO’s recommendation for the malaria treatment is not yet endorsed by the Ethiopian Standard treatment guidelines. Hence, chloroquine continued to be in use as the first-line drug for vivax malaria.3
Chloroquine (chemically known as 7-chloro-4-[[4-(diethylamino)-1-methylbutyl]amino]-quinoline phosphate16 is the main drug among the 4-aminoquinoline class) and classified as highly soluble and highly permeable (biopharmaceutical classification system (BCS) class I).17 Due to its characteristics and low resistance level reports, it remains the drug of choice in treating erythrocytic forms of all non-falciparum malaria, and uncomplicated chloroquine-susceptible malaria, hepatic amoebiasis, lupus erythematosus, rheumatoid arthritis, and light-sensitive skin eruptions.5,18
Such wide applications may attract both researchers, and SF medicine producers. Africa focused studies that intended to investigate the quality of chloroquine tablets found in African countries showed that percentage failures in dissolution ranged from 5% to 50%, in ingredient content from 20% to 67%, in disintegration was 20%, in crushing strength was 30%, and friability test was 21%.19–21
Another commonly prescribed drug for malaria in Ethiopia is quinine. Quinine contains in its structure a quinoline nucleus and an amino alcohol side chain. It is chemically known as (8″, 9R)-6ʹ-methoxycinchonan-9-ol sulfate dehydrate.22 Its BSC classification has not yet been agreed upon. Some say it is slightly soluble in water and sparingly soluble in boiling water (BCS class I or III);17 others categorize it as BCS class I or II23 or BCS class II.24 It is indicated for the management of malaria infection incurred by any of the four plasmodium species.18 It is used to manage severe malaria, infants under 5 kg and pregnant women in the first trimester.3
This old and low demand antimalarial medicine did not escape quality problems. In Asia, quinine is among the most falsified antimalarial drugs. A study done in Cambodia showed the dissemination of unknown origin and manufacturer of the drug reached 15.3% and 55.3%, respectively. More than half of the sampled quinine samples contained the wrong active ingredient, 4.7% did not have active ingredient and 1.2% were with incomplete labeling.25 In Africa, there were also similar reports confirming the presence of low active ingredient content and different and non-declared active ingredients containing quinine tablets in the market.26
Therefore, to ensure the circulation of quality, safe and effective chloroquine and quinine tablets with consistent and predictable therapeutically APIs, such quality assessment studies are necessary tools.27 Because they can give an insight into the quality of these products circulated within the distribution chain and consumed and at the same time they may give a clue for therapeutic success/failure of malaria management. They may generate baseline evidence either to develop and endorse optimum specifications and standards, encourage and enforce their application or for preventive, corrective measures to be taken by drug regulatory authorities. With the objective of assessing physicochemical quality parameters of chloroquine phosphate and quinine sulfate tablets circulating in South-West Ethiopia by confirming whether they comply with the Pharmacopoeial specifications and whether origin, collection site and manufacturers have an impact on the tested products quality, this paper was done.
Thus, the objective of the present study was to assess physicochemical quality parameters of chloroquine phosphate and quinine sulfate tablets circulating in South-West Ethiopia by confirming whether they comply with the Pharmacopoeial specifications and whether origin, collection site, and manufacturers have an impact on the tested products quality.
Materials
Collection Site and Sampling Method
Sample collection sites were selected based on the Ethiopian malaria eco-epidemiological strata map.28 From Stable, year-round, transmission class Gambella region (Zone 1, Gambella city) and Epidemic-prone areas in highland class Oromia region (Illubabore Zone, Metu town and Jimma zone, Jimma, Serbo, Dimtu, Assendabo, Sokoru and Yebu towns) and Southern Nation region (Wolayita zone, Wolayita Sodo town; Gamo-Gofa zone, Arba-Minch town; Benchi-Maji zone, Mizan-Teferi town, and Dawro zone, Tercha Town) were included. Simple random sampling technique was applied to select drug outlets in Gambella city, Jimma and Arba-Minch towns. All licensed drug outlets found in the remaining sites were visited for sample purchase and purposive sampling was used when sample quota is minimum.
Collection of Samples
At the time of collection, available brands/batches of chloroquine and quinine tablets with the lc of 250 and 300 mg, respectively, were purchased from drug retails. During purchase, the aim was forwarded to the health worker there at the time and requested to show if s/he had another batch/brand, and then enough samples for physicochemical parameter tests (at least 20 tablets per batch or brand) were taken.29 The experiment was done at Jimma University laboratory of drug quality (JuLaDQ). Summarized information on both products presented in Tables 1 and 2. The products were coded according to JuLaDQ laboratory coding protocol.
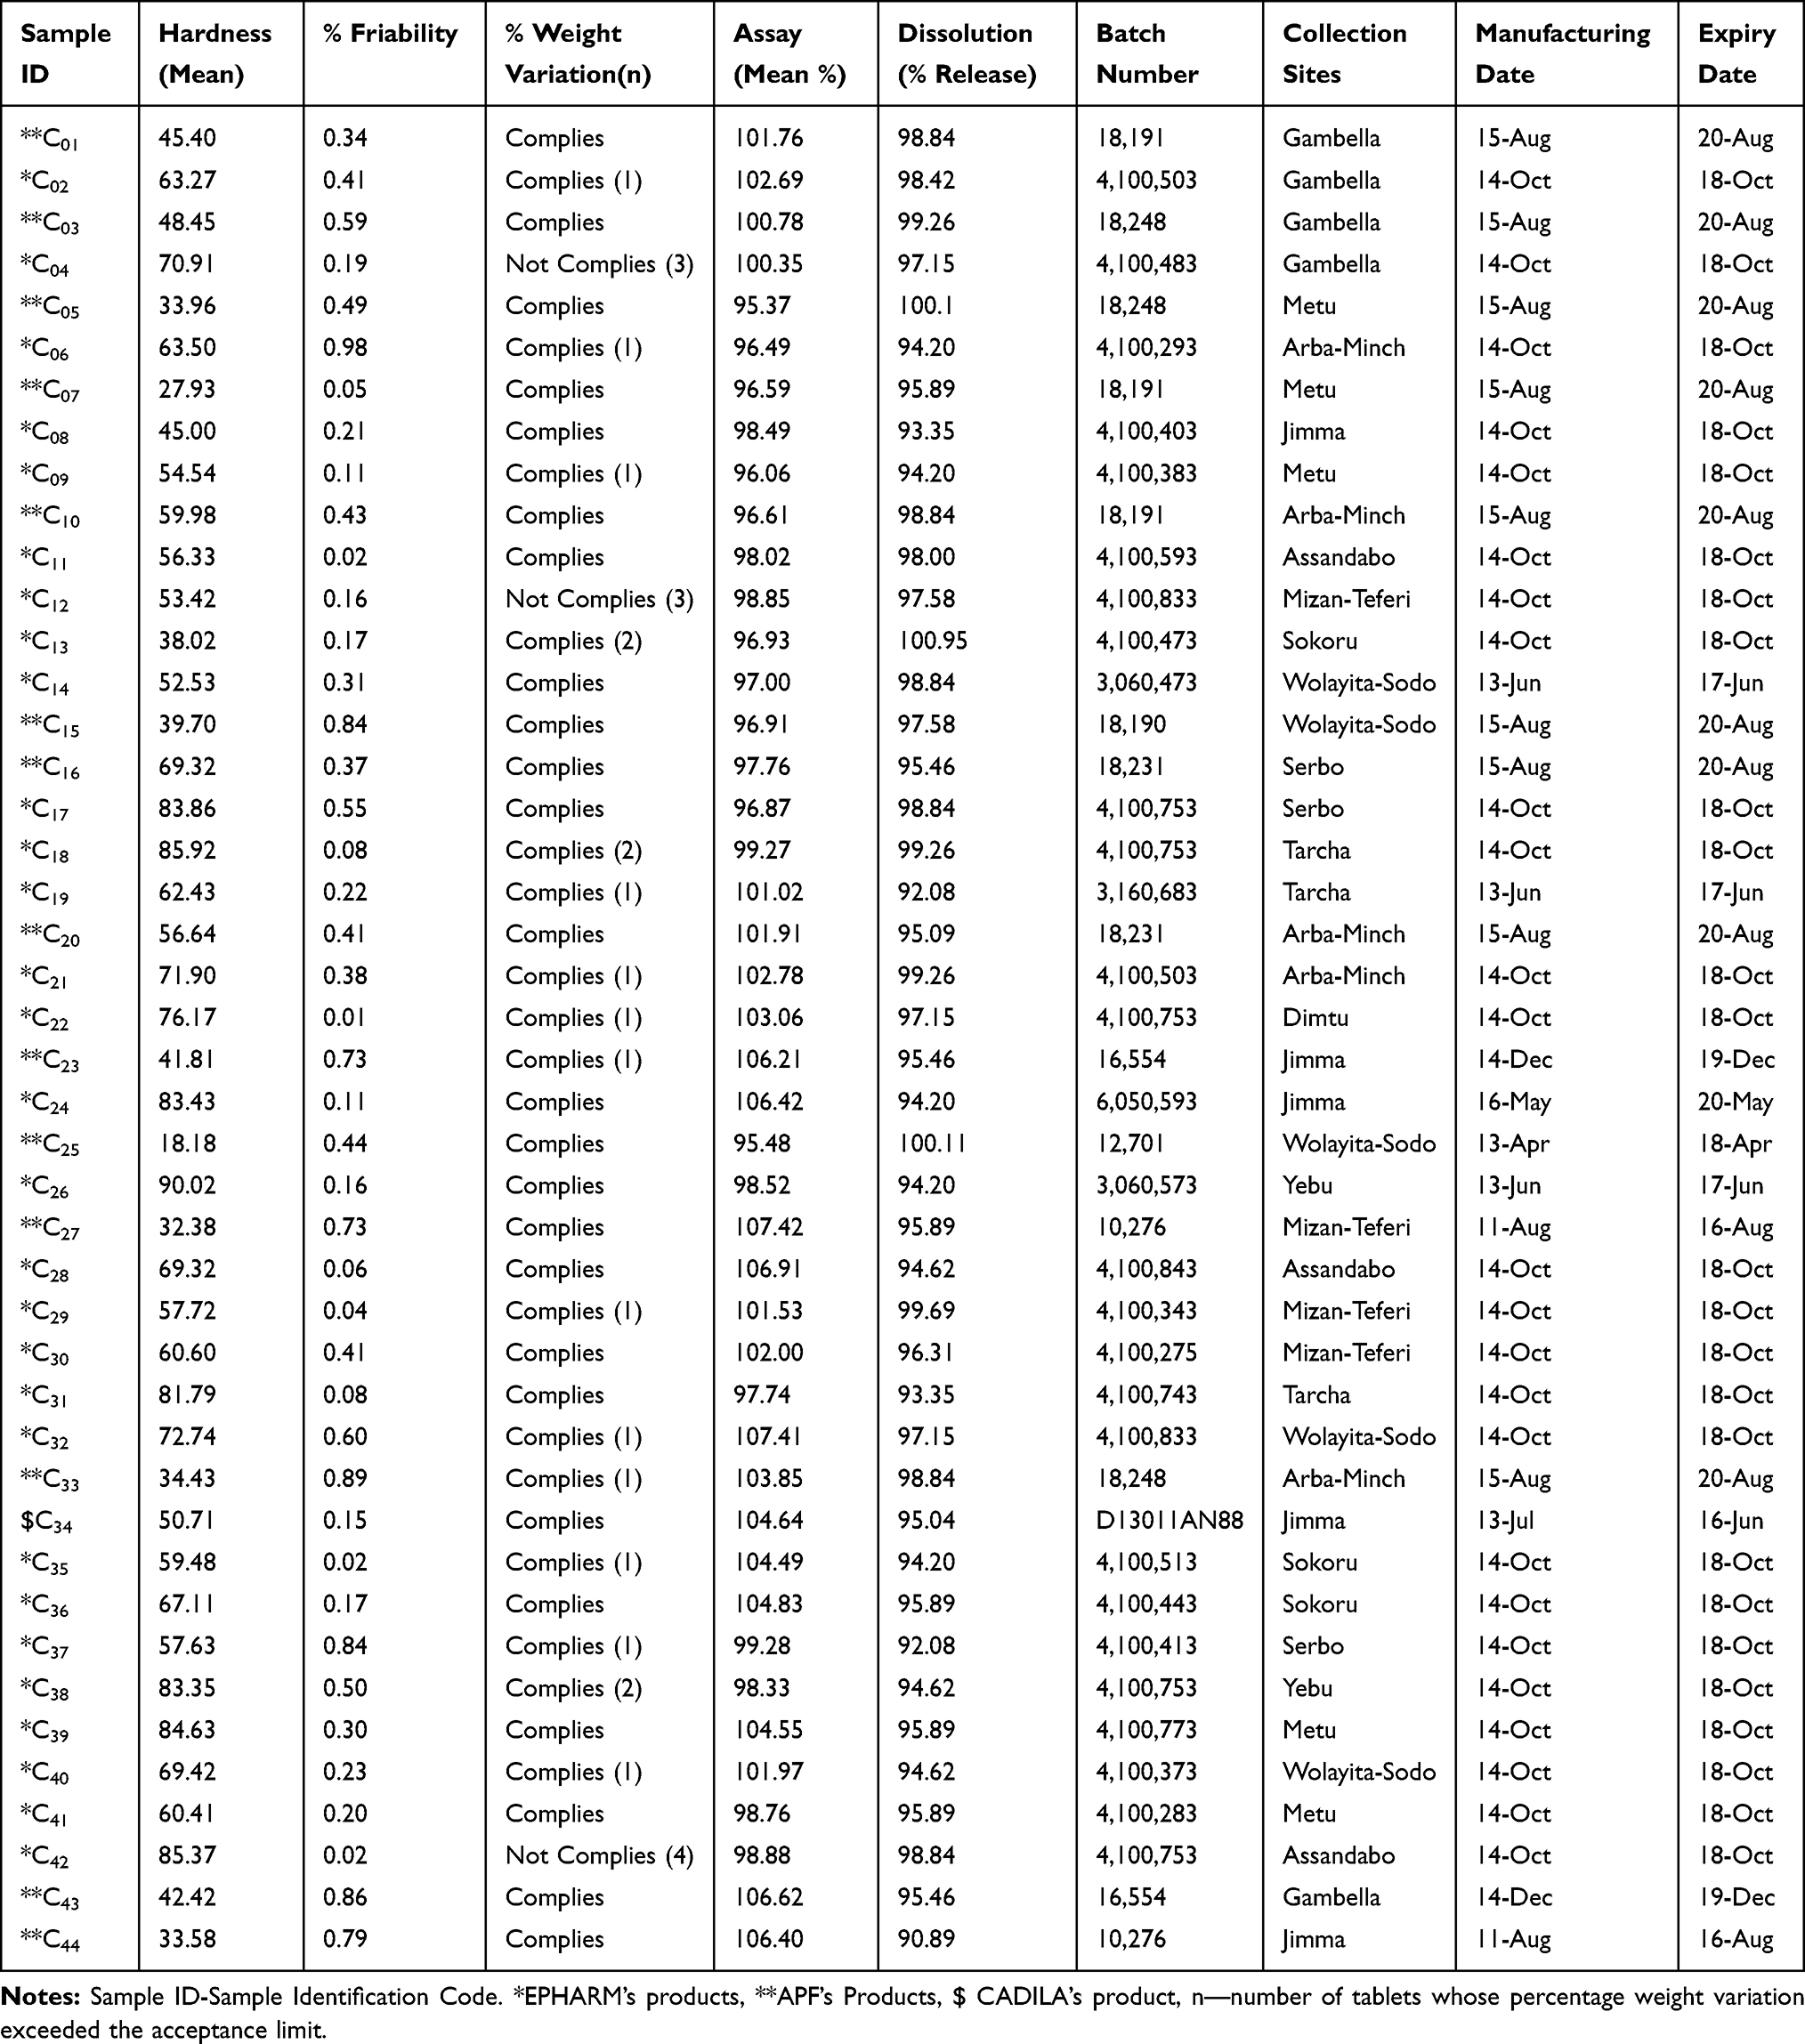 |
Table 1 Summary of Chloroquine Phosphate Tablet Samples Collected and Physicochemical Results |
 |
Table 2 Summary of Quinine Sulphate Tablet Samples Collected and Physicochemical Results |
Instruments
HPLC (Agilent 1260 Series, Darmstadt, Germany), Analytical Balance (Mettler Toledo, Greifensee, Switzerland), RC-6D Dissolution Apparatus (Apparatus 1 and Apparatus 2; Tian Jin Optical Instruments, Tianjin, China), UV–Vis Spectrophotometer (Cecil Instruments, Cambridge, United Kingdom), Hardness Tester (Pharma Test, Hainburg, Germany), Friability Tester (Pharma Test), and Water Purification System (Thermo Scientific, Model-7143, Waltham, MA, USA) were used for the study.
Chemicals and Reagents
Acetonitrile (CARLO ERBA Reagents), methanol (HPLC grade), perchloric acid (Nice Chemical Pvt. Ltd), orthophosphoric acid (Runcorn Cheshire Reagents Chemicals Limited), hydrochloric acid, RA (Fisher Chemicals), methanesulphonic acid, potassium dihydrogen orthophosphate (Techno Pharma Chem), diethylamine, glacial acetic acid (Reagent Chemical Service Ltd), and Ultra-pure water (JuLaDQ) were used for the study, and United States Pharmacopeia (USP) Chloroquine Phosphate and Quinine Sulfate reference standard (RS) were kindly obtained from Cadila Pharmaceuticals Plc (Addis Ababa, Ethiopia) and JuLaDQ.
Methods
USP standard specifications and procedures were employed for the evaluation of the quality of the chloroquine phosphate and quinine sulfate tablets.16,22
The products called poor quality when they fail any single test of the following tests for which they were evaluated.
Hardness Test
Tablet hardness is the essential parameter to measure the breakability and structural integrity of a tablet under conditions of storage, transportation, packaging and handling before usage. From each brand/batch, ten tablets were randomly selected and the force at which each tablet crushed/damaged was recorded.30 The hardness limits for tablets should lie in the 50–100 Newton (N) range.31
Friability
The calibrated analytical balance was used to weigh randomly selected twenty tablets per sample brand/batch before carrying out a friability test.30 The tablets were then placed in the drum of the friability tester and rotated at 100 revolutions for 4 mins. Then, tablets were dedusted and reweighed. As per the USP, the percent loss in weight was calculated as friability as follows: (1)
where W1─initial weight of randomly chosen 20 tablets, W2─after subjecting the tablets to the friabilator for 4 mins at 25 revolutions per minute, the final weight.
As an acceptance criterion, the weight loss should not be more than 1%.
Weight Variation
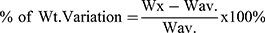
The purpose of this test is to verify the uniformity of each batch which ultimately reflects the drug content uniformity in all the formulation batches.16 The test was performed as per the official procedure. From each chloroquine samples, twenty tablets were randomly selected. Using calibrated an analytical balance, these samples were weighed individually (Wx) and their average weight (Wav.) was determined. Then, the percentage deviation from the mean was calculated using Equation 2 and compare with the USP limits.
(2)
As the general specifications in the USP-2015, the tablet passes the weight variation test if not more than two of the individual weights deviate from the average weight by 5% and none deviated by 10%.16
Content Uniformity
USP monograph recommends content uniformity test for quinine sulfate tablet to be performed using UV–Visible Spectrophotometer instrument.22 It is evaluated for quinine tablets through assaying 10 individual units and then using these 10 individual assay values to calculate an acceptance value.32 The instrument was verified.
Assay of the Active Ingredients
Assay test is a critical quality parameter required to confirm that the labeled amount of drug is available in a given dosage unit. Both drugs were tested as per their USP monograph for the correct amount of APIs.
Chromatographic System
For Chloroquine Phosphate Tablet
HPLC with a 4.6 mm ×15 cm, with a 5-μm packing L1 column that was adjusted in a 224 nm detector was used.16 A mobile phase was prepared by mixing buffer (water, monobasic potassium phosphate, and perchloric acid) and methanol in a 78:22 ratio and degassing it. The flow rate and injection volume used for assay were 1.2 mL/minute and 10 μL, respectively.
Reference Standard Preparation
A 50 mL volumetric flask was used to prepare 7.5 mg chloroquine phosphate RS containing solution. The reagent was the mobile phase. The solution then sonicated for 20 mins. Using a nylon filter of 0.2-µm pore size, 10mL of the solution was allowed to pass, discarding the first 4mL, 2mL of the filtrate was used for analysis.
Preparation of Samples
Twenty tablets per generic product of chloroquine phosphate were weighed and powdered. Nominally 7.5 mg of chloroquine phosphate from the finely powdered tablet was transferred to a 50 mL volumetric flask, and dissolved in and diluted with a volume. The solution then sonicated for 20 mins. Using a nylon filter of 0.2-µm pore size, 10mL of the solution was allowed to pass, discarding the first 4mL, 2mL of the filtrate was used for analysis.
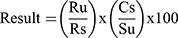
The quantity, in percent of the label claim of chloroquine phosphate in a portion of a tablet taken, was calculated using a formula (it should lie in acceptance range of 93.0–107.0%).
(3)
where Ru─peak response from the sample solution, Rs─peak response from the standard solution, Cs─concentration of chloroquine phosphate RS in standard solution (mg/mL), Cu─ nominal concentration of chloroquine phosphate tablet in sample solution (mg/mL).
For Quinine Sulfate Tablet
HPLC with a 3.9 mm ×25 cm, with a 5-μm packing C18 column that was adjusted in a 235 nm detector was used.22 A mobile phase was prepared by water, acetonitrile, methanesulfonic acid solution and diethylamine solution in the ratio of 86:10:2:2 and degassing it. The flow rate and injection volume used for assay were 1.0 mL/minute and 50 μL, respectively.
Reference Standard Preparation
A 100 mL volumetric flask was used to dissolve 20 mg of quinine sulfate RS. Mobile phase was employed as a reagent for this purpose.
Sample Preparation
Twenty quinine tablets were accurately weighed and powdered. From the powder, 160 mg was transferred to a 100 mL volumetric flask. Adding 80 mL methanol, the mixture was shaken for 30 mins and diluted to the volume. After filtering and discarding the first 10 mL, 3 mL of filtrate was poured into a 50 mL volumetric flask and diluted to the volume using a mobile phase buffer.
The quantity, in percent of the label claim of quinine sulfate and in the proportion of tablets taken was calculated using formula (it should lie in acceptance range of 90.0–110.0%).
(4)
Where: Ru = peak area response of quinine from the sample solution, Rs = peak area response of quinine from the standard solution, Cs = concentration of USP quinine sulfate RS in the standard solution (mg/mL), Cu = nominal concentration of quinine sulfate in the sample solution (mg/mL).
System Suitability Test
The system suitability was checked using some of its parameters. The accuracy of the method was tested by calculating recovery (from a duplicate reference standard solution with a known concentration, the peak response values obtained were used to calculate the experimental concentration) using the regression equation. Repeatability (precision) was evaluated by performing triplicate measurements of the reference standard solutions and calculating the percentage relative standard deviation (% RSD) of their peaks. As seen in Table 3, the system was suitable.
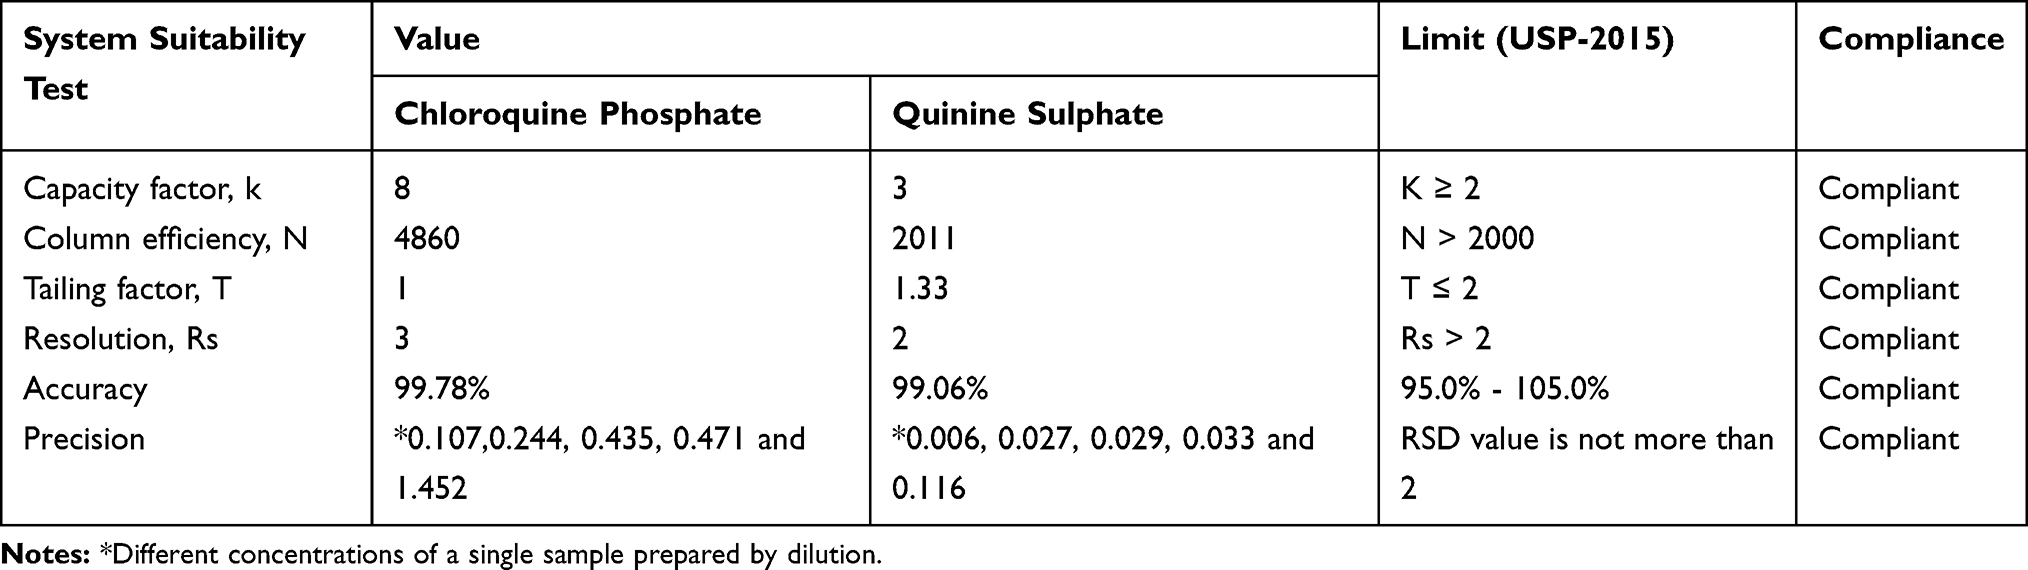 |
Table 3 System Suitability Test Results for Chromatographic Method of Assay of Chloroquine Phosphate and Quinine Sulphate Tablets |
Dissolution
We conduct the dissolution tests for both drug samples based on USP individual monographs. Accordingly, six tablets of each brand/batch/sample of the investigated drugs were randomly taken. The dissolution tester equipped with rotary paddles (USP Apparatus 2 for chloroquine phosphate)16 and basket (USP Apparatus 1 for quinine sulfate)22 operated at 100 revolutions per minute were implemented. The dissolution media like 900 mL water (for chloroquine phosphate) and 900 mL 0.01N HCl (for quinine sulfate) were prepared and maintained at 37°C±0.5°C. For both drugs, 1 ml of dissolved drugs was sampled at 5, 15, 30, 45, and 60 mins and 1 ml of dissolution medium was immediately replaced. Then, these withdrawn samples were suitably diluted with 50 mL by using the same medium and filtered. Finally, the amount dissolved was determined through taking accompanying absorbance readings of diluted filtrates by UV–Vis spectrophotometer at a wavelength of 343 nm for chloroquine phosphate and 248 nm for quinine sulfate. The instrument was verified.
Data Analysis
We employed Statistical Package for Social Sciences software (version 20.0 for windows; SPSS) and Microsoft Excel 2013 programs for statistical inferences of analytical data obtained from the experiment. Therefore, ANOVA at 95% CI was carried out to test the association of quality parameters with manufacturer, origin and sample collection sites.
Results and Discussion
Totally 60 samples were collected from twelve different geographical locations of the South-West region over the period between June and July 2016. Of which 44 samples were chloroquine phosphate tablets that were produced locally and 16 samples were quinine sulfate tablets which were imported (Tables 1 and 2). Collected samples were evaluated for solid oral dosage form in-vitro quality control parameters like identification, assay/content, dissolution, dosage uniformity, hardness, friability tests, visual inspection and organoleptic property checking.
Visual Inspection
Evaluation of quality of pharmaceuticals starts with checking the packaging/labeling and dosage form of the sample.33 According to the WHO checklist, both product visual inspection for a sign of poor-quality improper packaging, labeling, dosage description, product source, and origin were carried out (Table 4).
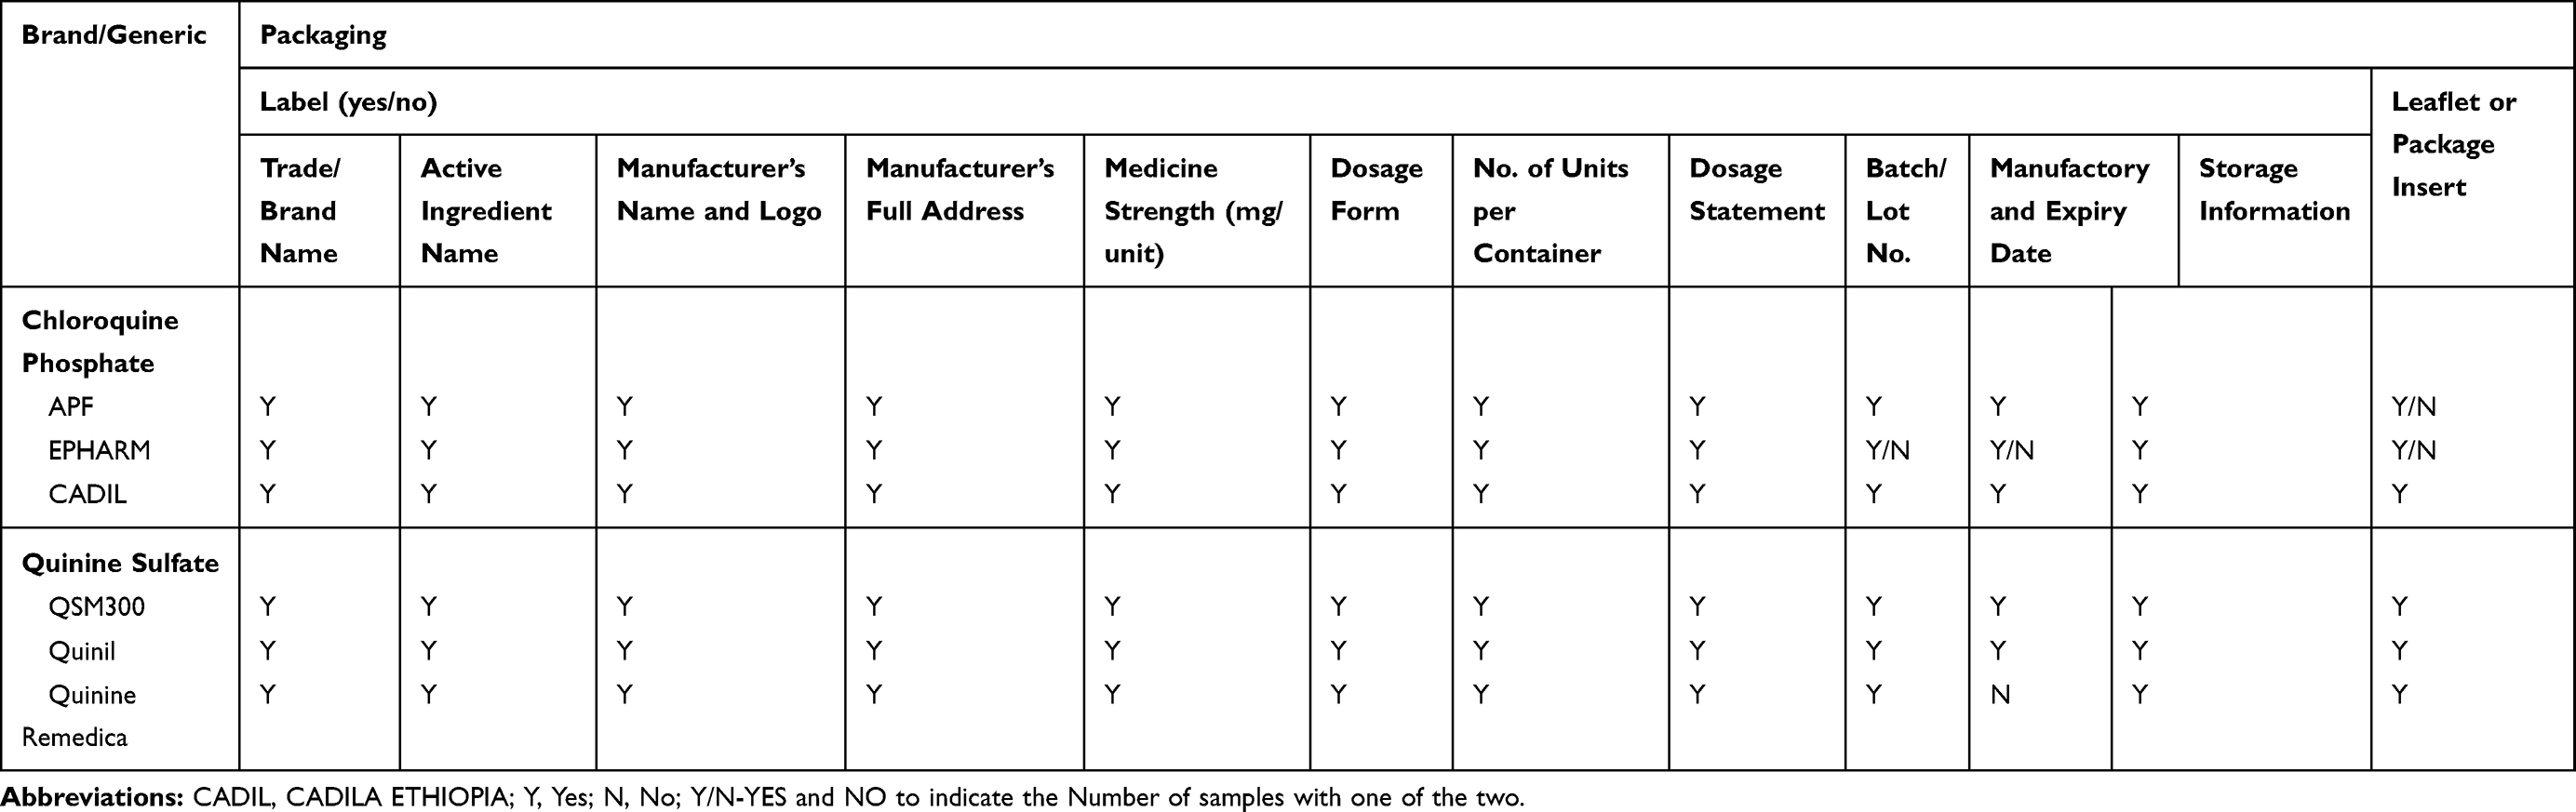 |
Table 4 Packaging and Labeling Information of Samples of Chloroquine Phosphate and Quinine Sulphate Tablets |
On three (3/29) chloroquine phosphate samples of Ethiopian Pharmaceuticals Manufacturing Share Company (EPHARM), printed batch numbers and expiry date on the blister/strips were not legible. Once the strips were pulled out of the secondary package, it was difficult to put them back into their original packaging. One chloroquine tablet blister (product of Addis Pharmaceuticals Factory-APF) collected from Gambella city found to contain no tablets/empty. Leaflets were not found in thirteen chloroquine samples (5 from APF, 8 from EPHARM). Regarding quinine sulfate products, one quinine sample was without manufacturing and expiry dates. The product was purchased from tin. When the collector tried to record the information from the tin, he could not find manufacturing and expiry dates.
Most of the time, packaging multi-unit-of-use dose drugs in a single package pose problems. Because the labeling is imprinted on the complete unit-of-use/strip but not on the individual blistered dosage forms and package inserts may not match the number of strips contained in the package. Some associations are demanding the production of single dose-packed drugs and the mandatory inclusion of a barcode on it.34 Even though production and use of unit-of-use packaging are costly, it promotes safe and efficient use, reduces falsifying chances, lowers unnecessary costs and prevents adverse effects.34
Identification Test
High-performance chromatography (HPLC), for both products, on their monograph, recommends chromatographic peak retention times comparison as an alternative method for identification. The retention times of the investigated products peak correspond to that of standard reference were used to determine their identity. Product main peak retention times were compared with their RS peak chromatogram retention times, and found to be comparable. All investigated products were positive for identification tests (Figure 1).
 |
Figure 1 Chromatograph Peak Retention Times of (A) Chloroquine Phosphate USP Standard Reference (B) Chloroquine Phosphate Sample, in a reserved phase column, RP-18, 150 × 4.6 mm; 5μm packing when 22% (v/v) methanol and 78% (v/v) phosphate buffer solution adjusted to pH of 2.5 used as mobile phase, at flow rate of 1.2 mL/minute; the detection wavelength 224 nm, injection volume 10 µL, and temperature of 25°C. (C) Quinine Sulfate USP Standard Reference (D) Quinine Sulfate Sample in a reserved phase column RP-18, 150 × 43.9 mm; 5μm packing when mixture of water, acetonitrile, methanesulfonic acid solution and diethylamine solution in the ratio of 86:10:2:2 to pH of 2.6 used as a mobile phase, and flow rate 1.0 mL/minute, the detection wavelength 235 nm, injection volume 50 µL, and temperature of 25°C on Agilent 1260 HPLC. |
Hardness Test
It was indicated that chloroquine tablets of APF required the lowest crushing force compared to EPHARM samples (see Table 1). Most (11/14) APF products were soft; they were broken when less than minimum limit breaking force (50 N) applied and there was no hard tablet. From EPHARM chloroquine, (2/44) needed less than the lower breaking force limit. The quinine of Remedica used maximum force to be deformed. None of the investigated quinine sulfates were fractured under lower breaking limit, six samples were hard enough to resist the recommended force. Hence, from the total 60 samples, only 68.33% was found to fall within the acceptance limit for the oral tablet hardness test. Such variation may occur due to the adoption and practicing of different production methods (even though the products are generic – the same production technique has to be adopted). Before rejecting so-called soft and hard samples, their disintegration has to be checked. We did friability and dissolution tests for all samples and got an insignificant effect at the proposed level of confidence.
Friability Test
All investigated samples for weight loss complies USP monograph requirements. Therefore, chloroquine phosphates and quinine sulfate tablets circulating South-West Ethiopia had good strength and can tolerate the shocks during transportation and handling. According to USP, the percentage of friability should be not more than 1.0%.30
Weight Variation
The 6.8% of chloroquine phosphate tablet samples failed to meet the USP acceptance criteria for weight uniformity. As per the USP the weight variation limit for the tablet which is weighting 134 and 300 mg is 7.5%. The remaining samples which passed the official weight variation test were analyzed for the similarity for weight between batches and among origin. Thus, statistical analysis revealed the presence of a significant difference in weight of all the batches of chloroquine tablets sampled at P<0.05 level. The RDS for randomly selected twenty tablets weighed per batch for each generic product varied from 1.25% to 4.15%. The variation between tablets concerning weight must be reduced to a minimum.
Analyzed chloroquine phosphate tablets were generic, which means the different manufacturers used the same active ingredients and/or excipients and formula to manufacture the products. However, they may use varying proportions of the same kind of excipient or there may be variations in Good Manufacturing Practices (GMP), which possibly contribute to the weight variations. The GMP influences especially processing and manufacturing variables that have a direct or indirect effect on the weight of the tablets and responsible for the weight variations.
Content Uniformity
Content uniformity is measured to ensure the uniformity in the amount of APIs among dosage units. The percentage of contents of different brands of quinine sulfate tablets assayed using the content uniformity method. All tested samples complied with the USP acceptance criteria for the parameter.
Assay of Active Ingredients
The results of the drug assay of all chloroquine phosphate and quinine sulfate tablet samples showed that the amount of APIs available in all these drug substances was within their acceptance limit (Tables 1 and 2). The APIs contained in samples C24 and C32 were in the higher limit. Whether the APIs content difference exists within the batch and/or brand and collection site was checked statistically. One-way ANOVA with 95% CI was applied and API content means difference was significant for chloroquine phosphate tablets. But for quinine sulfate tablets, such variations observed within batches only.
Since assay is one of the detrimental drug quality attributes, great care has to be taken in cGMP application and follow-up and adjusting the drug distribution system of the country.
Dissolution Test
A verified method was used for the dissolution test. Because the dissolution test is a critical in-vitro quality control test for solid dosage forms often performed to obtain valuable information about the API release capabilities of a finished pharmaceutical product (FPP), its in-vivo performance as well as batch-to-batch consistency and possible manufacturing deviations.35 The single point dissolutions were performed. As per USP specification, both drug products have to release not less than 75% labeled amount within 45 mins in their respective dissolution media. From the tested samples, none had USP S1 specifications compliance problems. All passed the tests.
At the 95% CI (P<0.05) level, the dissolution profile variation between brand and batches was not significant. Geography, as well, did not affect the drug-releasing character of both tablet samples.
Conclusion
This work showed the circulation of relatively good quality chloroquine and quinine tablets in the South-West Ethiopia market which complied with minimum standards for major quality attributes. However, defects in packaging and labeling are signs of fraudulent actions that may compromise the quality of these drugs. In addition, within the acceptance limit, the origin of drugs and collection sites has found to determine the quality of both drug products. The regulatory authorities need to develop a follow-up measure for appropriate good manufacturing practice application and a system to ensure storage (drug supply chain system) conditions.
Acknowledgments
We thank Jimma University JuLaDQ for providing us both RSs and all necessary facilities for the research. We are also like to show our gratitude to the Cadila Pharmaceuticals (Ethiopia) for the kind gift of chloroquine RS. We appreciate Abebe Kebede, Elias Kadi, Feyera Lejissa, Habtamu Acho, Henok Teshome, Kenu Adane, Markos Duguma, Melaku Umuro, Mitiku Abuye, Niguse Abebaw, Solomon Hambisa, Tamirat Beyene, Tamrat Tesfaye, Tariku Abebe, Teketel Ermiyas, Tesfaye Mohammod, and Yemer Mekonnen, for their valuable efforts on this work.
Disclosure
The authors declare that they have no competing interests in this work.
References
1. World Health Organization. World malaria report 2018; 2018. Available from: https://www.who.int/malaria/publications/world-malaria-report-2018/en/.
2. Bloland PB Drug resistance in malaria. WHO_CDS_CSR_DRS. World Heal Organ. 2001;1. Available from: https://www.who.int/csr/resources/publications/drugresist/malaria.pdf.
3. Federal Democratic Republic of Ethiopia Ministry of Health. National Malaria Guidelines.
4. Federal Democratic Republic of Ethiopia Ministry of Health. National Five-Year Strategic Plan for Malaria Prevention and Control in Ethiopia, 2011–2015; 2010.
5. World Health Organization. Guideline for the Treatment of Malaria.
6. World Health Organization. WHO Global Surveillance and Monitoring System for Substandard and Falsified Medical Products. Geneva; 2017. Available from: http://www.who.int/medicines/regulation/ssffc/publications/GSMS_Report.pdf?ua=1.
7. World Health Assembly. WHO Member State Mechanism on Substandard/Spurious/Falsely-Labelled/Falsified/Counterfeit (SSFFC) Medical Products. Geneva; 2015. Available from: https://www.who.int/medicines/regulation/ssffc/A70_23-en1.pdf?ua=1%0Ahttp://www.who.int/medicines/regulation/ssffc/A70_23-en1.pdf?ua=1.
8. Kaur H, Green MD, Hostetler DM, Fernández FM, Newton PN. Antimalarial drug quality: methods to detect suspect drugs, review. Therapy. 2010;7(1):49–57. doi:10.2217/thy.09.84
9. Bate R, Coticelli P, Tren R, Attaran A, Awadalla P. Antimalarial drug quality in the most severely malarious parts of Africa - a six country study. PLoS One. 2008;3(5):3–5. doi:10.1371/journal.pone.0002132
10. Nayyar GML, Breman JG, Newton PN, Herrington J. Poor-quality antimalarial drugs in southeast Asia and sub-Saharan Africa. Lancet Infect Dis. 2012;12(6):488–496. doi:10.1016/S1473-3099(12)70064-6
11. The President’s Malaria Initiative. Countering Unregistered and Illegal Antimalarial Drugs in Ethiopia; 2014:1–2.
12. Suleman S, Woliyi A, Woldemichael K, et al. Pharmaceutical regulatory framework in Ethiopia: a critical evaluation of its legal basis and implementation. Ethiop J Health Sci. 2016;26(3):259–276. doi:10.4314/ejhs.v26i3.9
13. Alfadl AA, Abdoon S, Elamin M, Elnabi NG. Quality of antimalarial drugs in Sudan: results of post-marketing surveillance. Sudan J Public Heal. 2006;1:
14. Institute of Medicine. Countering the problem of falsified and substandard drugs. Washington, DC: The National Academies Press; 2013:55–238.
15. Karunamoorthi K. The counterfeit anti-malarial is a crime against humanity: a systematic review of the scientific evidence. Malar J. 2014;13(209):1–13. doi:10.1186/1475-2875-13-209
16. The United States Pharmacopeia USP 38/NF 33 Convention Inc. Rockville MD Official Monograph. Chloroquine Phosphate. 2015:2771–2772
17. Lindenberg M, Kopp S, Dressman JB. Classification of orally administered drugs on the World Health Organization model list of essential medicines according to the biopharmaceutics classification system. Eur J Pharm Biopharm. 2004;58(2):265–278. doi:10.1016/j.ejpb.2004.03.001
18. Rang HP, Ritter JM, Flower RJ, Henderson G. Antirheumatoid drugs, antiprotozoal drugs. In: Churchill WS, editor. Rang and Dale’s Pharmacology. Vol. 327,
19. Al-kamarany MA, Al-mekhlafi HM, Al-adhroey AH. Quality of chloroquine tablets available in Africa. Pathog Glob Health. 2011;105(6):447–453. doi:10.1179/1364859411Y.0000000030
20. Ofonaike JO, Enato EF, Okhamafe AO. A study of the pharmaceutical quality of chloroquine and paracetamol products sold in a major Nigerian “ market”. Afr J Health Sci. 2007;14(3):164–170.
21. Samali A, Mohammed MI, Ibrahim MB, Gamaniel KS. Quality status of brands of chloroquine tablet dosage form from Northern part of Nigeria. J Chem Pharm Res. 2014;6(11):75–79.
22. The United States Pharmacopeia USP 35/NF 30 Convention Inc. Quinine Sulfate, Vol. c. Rockville, MD; 2012:4508–4509
23. Strauch S, Dressman JB, Shah VP, Kopp S, Polli JE, Barends DM. Biowaiver monographs for immediate-release solid oral dosage forms: quinine sulfate. J Pharm Sci. 2012;101(2):499–508. doi:10.1002/jps
24. Britz C. The Discriminatory Ability of Analytical Quality Control Test Methods: a Comparison of Test Results from Different International Monographs of Quinine Sulfate Tablets C Britz B [Sc (Hons) Pharmacology Dissertation submitted in partial fulfillment of t]. 2013.
25. Lon CT, Tsuyuoka R, Phanouvong S, et al. Counterfeit and substandard antimalarial drugs in Cambodia. Trans R Soc Trop Med Hyg. 2006;100:1019–1024. doi:10.1016/j.trstmh.2006.01.003
26. Onwujekwe O, Kaur H, Dike N, et al. Quality of anti-malarial drugs provided by public and private healthcare providers in South-East Nigeria. Malar J. 2009;8(1):1–9. doi:10.1186/1475-2875-8-22
27. Levi LEO, Walker GC. Quality control of pharmaceuticals. Can Med Assoc J. 1964;91(15):781–785.
28. President’s Malaria Initiative. Ethiopia Malaria Operational Plan FY 2014; 2014.
29. Phanouvong S, Blum N, Smine A. Guidelines for Sampling of Antimalarial Drug Samples In the USP DQI Antimalarial Drug Quality Monitoring Project in Mekong Sub-region Countries; 2004, October.
30. The United States Pharmacopeia USP 35/NF 30 Convention Inc. Tablet Friability. USA; 2012.
31. The Pharmaceutics and Compounding Laboratory. UNC Eshelman School of Pharmacy. Evaluation of Tablets; 2019.
32. The United States Pharmacopeial Convention. Uniformity of Dosage Units; 2011:4–6.
33. World Health Organization. Survey of the Quality of Selected Antimalarial Medicines Circulating in Six Countries of Sub-Saharan Africa. 2011:73–83
34. Amann S, P B, S V, R F. Request for the Production of Single Dose-Packed drugs; 2010.
35. Kale KN, Gupta KR. Development and validation of dissolution test method for aliskiren in tablet by Hplc. World Journal of Pharmacy and Pharmaceutical Sciences. 2015;4(10):2034–2049.
 © 2020 The Author(s). This work is published and licensed by Dove Medical Press Limited. The
full terms of this license are available at https://www.dovepress.com/terms
and incorporate the Creative Commons Attribution
- Non Commercial (unported, 3.0) License.
By accessing the work you hereby accept the Terms. Non-commercial uses of the work are permitted
without any further permission from Dove Medical Press Limited, provided the work is properly
attributed. For permission for commercial use of this work, please see paragraphs 4.2 and 5 of our Terms.
© 2020 The Author(s). This work is published and licensed by Dove Medical Press Limited. The
full terms of this license are available at https://www.dovepress.com/terms
and incorporate the Creative Commons Attribution
- Non Commercial (unported, 3.0) License.
By accessing the work you hereby accept the Terms. Non-commercial uses of the work are permitted
without any further permission from Dove Medical Press Limited, provided the work is properly
attributed. For permission for commercial use of this work, please see paragraphs 4.2 and 5 of our Terms.