Back to Journals » Medical Devices: Evidence and Research » Volume 11
Physician preference items: what factors matter to surgeons? Does the vendor matter?
Authors Burns LR ![]() , Housman MG, Booth RE, Koenig AM
, Housman MG, Booth RE, Koenig AM
Received 14 September 2017
Accepted for publication 16 November 2017
Published 11 January 2018 Volume 2018:11 Pages 39—49
DOI https://doi.org/10.2147/MDER.S151647
Checked for plagiarism Yes
Review by Single anonymous peer review
Peer reviewer comments 2
Editor who approved publication: Dr Scott Fraser
Video abstract presented by Lawton R Burns.
Views: 178
Lawton R Burns,1 Michael G Housman,2 Robert E Booth,3 Aaron M Koenig4
1Department of Health Care Management, The Wharton School, University of Pennsylvania, Philadelphia, PA, 2Singularity University, Moffett Field, CA, 33B Orthopaedics, Langhorne, PA, 4Harvard Medical School, Massachusetts General Hospital, Wang Ambulatory Care Center, Boston, MA, USA
Background: The USA devotes roughly $200 billion (6%) of annual national health expenditures to medical devices. A substantial proportion of this spending occurs during orthopedic (eg, hip and knee) arthroplasties – two high-volume hospital procedures. The implants used in these procedures are commonly known as physician preference items (PPIs), reflecting the physician’s choice of implant and vendor used. The foundations for this preference are not entirely clear. This study examines what implant and vendor characteristics, as evaluated by orthopedic surgeons, are associated with their preference. It also examines other factors (eg, financial relationships and vendor tenure) that may contribute to implant preference.
Methods: We surveyed all practicing orthopedic surgeons performing 12 or more implant procedures annually in the Commonwealth of Pennsylvania. The survey identified each surgeon’s preferred hip/knee vendor as well as the factors that surgeons state they use in selecting that primary vendor. We compared the surgeons’ evaluation of multiple characteristics of implants and vendors using analysis of variance techniques, controlling for surgeon characteristics, hospital characteristics, and surgeon–vendor ties that might influence these evaluations.
Results: Physician’s preference is heavily influenced by technology/implant factors and sales/service factors. Other considerations such as vendor reputation, financial relationships with the vendor, and implant cost seem less important. These findings hold regardless of implant type (hip vs knee) and specific vendor.
Conclusion: Our results suggest that there is a great deal of consistency in the factors that surgeons state they use to evaluate PPIs such as hip and knee implants. The findings offer an empirically derived definition of PPIs that is consistent with the product and nonproduct strategies pursued by medical device companies. PPIs are products that surgeons rate favorably on the twin dimensions of technology and sales/service.
Keywords: physician’s preference, surgeons, orthopedics, hip implants, PPIs
Introduction
Physicians are the primary decision makers regarding which technologies to use in patient treatment. The growing sophistication of these technologies and the intensity with which they are used are commonly identified as a major portion of hospital expenses and a major driver of rising health care costs. Thus, physician-level decisions on products and product vendors represent “ground-zero” in efforts to contain costs.
For a nontrivial portion of medical-surgical supplies used in patient treatment, physicians have traditionally exerted some preference for (and some active control over) the product to buy and the vendor to purchase it from. This control is exerted through the hospital’s purchasing process and the materials manager. Such supplies are labeled as physician preference items (PPIs). In recent years, hospitals have begun to exercise some influence here as well by imposing caps on vendor payments, restricting access to vendors using formularies, and collaborating with physicians in gainsharing programs.
Aside from a handful of industry-sponsored surveys, little is known about the factors associated with physician’s preference (ie, what it is that physicians prefer in a product and its vendor). Part of the problem is that there has been little conceptual or empirical effort to define PPIs. Moreover, little is known whether vendors with higher market shares outperform their competitors on these product/vendor dimensions or whether market share is based on other considerations.
This research begins with a conceptual model of the factors associated with the physician’s choice that may define physician’s preference. It then presents survey data from orthopedic surgeons in one state to assess this conceptual model and identify the factors that surgeons say they use in selecting a given product or vendor. Finally, it compares the surgeon’s evaluations of the major implant vendors to detect any possible differentiation along the factors that drive the surgeon’s choice.
Twin pillars of medical device sector
The medical device sector, like the other technological sectors in the health care industry, rests on the following two pillars: the invention of new technology and assuring its adoption by clinician customers.1 The twin pillars can be more simply labeled as product innovation and commercialization or product development and market development. The former entails the development of new technology, innovative technological features that increase its functionality and ease of use, the ability of these technologies and features to meet unmet clinical needs, research and development activities, clinical trials of new products and data that convey their technological advantage, development of intellectual property, and management of the regulatory and reimbursement processes. The latter entails product launch, sales force efforts to support the launch and promote subsequent adoption (eg, by informing physicians about new device products to treat new patients indicated for such products by the clinical trials), product training and feedback, and cultivation of relationships with key opinion leaders and physician customers.
The medical device trade literature commonly acknowledges the importance of these two capabilities in the success of new devices across many product categories.2,3 Vendor corporate documents and analyst reports similarly acknowledge the twin pillars by their frequent reference to their company’s dual focus on “product” and “nonproduct” strategies.4 The different products marketed by multiproduct vendors (eg, vascular intervention and cardiac rhythm management) share similarities in their key success factors (identified earlier).
These two strategies target physicians (rather than patients) as the core customer. Surveys indicate that the vast majority of patients do not have a brand preference and leave the decision on implant choice to their physician. Vendors pursue the twin strategies to attract physician customers, and physicians respond to those strategies in the form of product/vendor preference.
In general, physicians treating patients in need of such products gravitate toward companies that 1) continually develop a pipeline of new technologies that 2) contain new product components and features (eg, ease of implantation, functionality, reliability, and product life) that 3) meet the unmet clinical needs of their patients with 4) demonstrated therapeutic efficacy and that (5) receive prompt regulatory clearance and payer reimbursement and 6) are supported by sales and service offerings that (7) target the physician as the key customer and thus 8) maintain the physician’s loyalty to the company’s representatives and broad line of differentiated products, which is enhanced by 9) the manufacturer’s reputation and brand image which 10) thereby help to support premium pricing. The top vendors compete on these dimensions.
Physician’s preference
The product and nonproduct strategies of medical device firms suggest that physician’s preference may similarly rest on the dimensions of product innovation and sales/service. Researchers have noted that physicians not only have specific brand preferences for device product lines, instrumentation, and supplies but also desire high levels of service.5,6 Similarly, a recent government report describes PPIs as products that physicians “have high confidence in terms of their value to patient care and reliability, after promotion by device makers.”7
The existence of physician’s preference should not be surprising. Workers in many skilled occupations, as well as athletes in many professional sports (golf and baseball), are known to have favorite tools (and vendors who supply them). Some observers claim that clinical input has probably been the most important influence over product choice for decades.8 When hospitals recruit specialists to their medical staffs, they are also recruiting the vendors who make the products those specialists favor and utilize, as well as the sales representatives who may assist the surgeon with the procedure in the operating room (OR). Often these preferences are formed early on in the surgeon’s career following medical school training, such as in residency and fellowship programs.9
Importance of PPIs
USA expenditures on medical devices represent 6% of national health expenditures, or roughly $200 billion in 2015.10,11 Musculoskeletal procedures (eg, knee and hip arthroplasties) that utilize implants constitute a large share (24%) of OR procedures and have exhibited extremely high growth rates (93 and 40%, respectively, between 2001 and 2011).12 Total joint arthroplasties are considered one of the most successful surgical interventions of the past century, reaching over 800,000 patients by 2013.13 There is thus great interest in understanding (and perhaps influencing) physician’s preference among implants and other PPIs, which comprise anywhere from 40 to 60% of a hospital’s total expenditures on supplies.14 Moreover, the physician’s choice of a given PPI may not be closely tied to the product’s cost, which can thwart hospital cost containment efforts.
Physician’s preference and influence over product choice affect the prices that hospitals pay, in part by reducing the latter’s ability to standardize on a small number of vendors and obtain bulk pricing (exchange high volume for lower unit cost). Rising health care costs, technological innovations introduced during the 1990s and early 2000s (eg, bare metal and drug-eluting stents, pacemakers, and implantable cardioverter defibrillators), the emergence of nationally organized group purchasing organizations (GPOs), the advent of bundled payment, and growing attention to the hospital supply chain have highlighted these issues regarding PPIs.
Definition of PPIs
Surprisingly, despite the attention paid to PPIs, there is little empirical research on what physician’s preference actually rests on. There are a host of definitions, however:
Montgomery and Schneller14 defined PPIs as those for which physicians have strong preferences and make the choice in hospital purchasing – typically not based on cost but rather on personal experience with the device and relationships with the vendor’s sales representative.
Wilson et al15 defined them as products with which physicians have familiarity and loyalty, often built on relationships based on product development, training, continuing medical education, and service.
Premier, a national purchasing group, suggests that working relationships between physicians and vendors in developing and testing new products help to turn clinicians into vendor advocates.29
Lerner et al16 defined PPIs as implantable medical devices that “surgeons choose, hospitals purchase, patients receive, and the public pays for”.
Robinson17 and DeJohn8 defined them as “high-cost and high-quality devices to distinguish them from more humble supplies purchased via bulk discounts”.8,17
McIlhargey,18 finally, defined PPIs more broadly as products that physicians believe will ultimately produce a higher quality of life for their patients, require specialized training on the part of the surgeon, and frequently represent some kind of liability risk associated with their use and expected outcomes.
As is evident from the review of the literature, the definition of PPIs may be “as broad as the number of physicians in this country”.18 It may also be broadly characteristic of supplies in many clinical areas beyond musculoskeletal (eg, orthopedics) and circulatory (cardiovascular) to encompass general surgical instruments and even more mundane items such as needles and syringes.9,19
PPIs are further defined by the physician’s role in product choice. Several industry studies have confirmed the central role of physicians (vis-à-vis materials managers, OR managers, and hospital administrators) in product selection.20–23 The choice among technologically advanced and evolving products is made by the surgeon, in consultation with the patient, but the order is placed by the materials manager and the purchase is made by the hospital or ambulatory surgery center. The complex nature of these PPIs, the division of labor in medical device selection vs ordering vs purchase, and the close relationship between the vendor and the physician may help to explain the large variation in medical device costs that is not explained by case volume or hospital characteristics.24 This explains the recent policy and research interest in PPI price transparency, physician–hospital collaboration in new product selection and vendor bargaining, implant formularies, case-based pricing, technology assessment committees, and other efforts to control implant costs.25–27
Which factors are more important than others in physician’s preference? A prior survey of hip and knee surgeons reported quality (clinical results), cost, and improved material technology as the three main reasons for changing implant brands, followed by ease of use as a distant fourth.28 Premier reported the following top five factors influencing the hospital’s purchasing behavior of PPIs: clinical outcomes, cost, physician’s past experience and familiarity, the hospital’s value analysis process, and the physician’s preference.29,30
By contrast, industry studies suggest that the decision is not driven by the PPI’s cost but rather by product technology and service considerations.21–24 The former include longevity, instrumentation, ease of use, product innovation, and manufacturer reputation; the latter include the sales representatives, training programs, and existing relationships with other surgeons in the practice.31 Industry surveys reveal that more than two-thirds of orthopedic surgeons have worked with their sales representative for >5 years.31 These factors are not necessarily tied to product cost but rather to personal experience with the product, assessment of a patient’s interests, and relationships with the sales representative. Surveys suggest that physicians believe the consulting and proctoring contracts with vendors are important for the development and delivery of safe and effective products and surgical techniques, even though only a small minority of surveyed orthopedic surgeons (6%) had such contracts.31
Dimensions of physician’s preference
This study identifies factors that surgeons state they use in their choice of orthopedic implant and vendor. They cover the product’s technological features (eg, scientific evidence, length of follow-up in scientific studies, patient outcomes, longevity, design and ease of implantation, and design and ease of instrumentation), sales and service features (eg, implant training program, willingness to listen to suggestions about product improvement, the sales representative’s availability and follow-up, the sales representative’s tenure, and continuing education), and other features such as vendor and product reputation, product cost, and consulting arrangements. Some factors may apply across implants, while others may be implant specific. The article then analyzes 1) which factors are more or less important to physicians, 2) whether the factors vary in importance across two types of implants (hip versus knee), 3) whether the factors important to physicians vary across implant vendors, and 4) whether physician ratings differ across vendors.
More generally, the article seeks to help hospitals with medical device decision making by comparing five major vendors of hip and knee implants on multiple dimensions of product performance, service, and quality. We rely on evaluations from practicing orthopedic surgeons in one state. Surgeon evaluations reported here are based on long-term clinical experience but are not meant to represent clinical studies. Our data also reflect what surgeons state they use in implant and vendor selections and not the actual implant choices for particular patients.
Materials and methods
Questionnaire design
The data presented here are taken from a survey of orthopedic surgeons in the Commonwealth of Pennsylvania. We developed the survey in consultation with high-volume orthopedists, executives of several orthopedic implant vendors, and materials managers at several hospitals. An earlier version of the survey was pilot tested with 25 orthopedic surgeons at a hospital in another state specializing in orthopedic implants. Results from this survey were used to refine the survey instrument prior to the state-wide survey implementation.
The survey first solicited background information from the surgeons regarding their primary vendor for hip and knee implants, the other implant vendors they used, the proportion of their practice devoted to arthroplasty vs spine vs trauma, the number of years in practice, whether they completed an arthroplasty fellowship, whether they used the primary vendor during their residency/fellowship, their involvement in teaching and research functions, and their economic relationships with the vendor (consulting fees and honoraria for talks). The second part of the survey asked surgeons to rate the factors that influenced their decision to use an implant product or vendor using Likert-type scales (ranging from 1 “strongly disagree” to 5 “strongly agree”). Some items asked surgeons to separately evaluate the knee from the hip implant they used most frequently. These survey items mapped onto our conceptual model of product preference across the following four domains.
Domains of physician’s preference
Technology/implant
- Scientific evidence of better outcomes
- Length of follow-up in scientific studies
- Outcomes in surgeon’s patients
- Device design and ease of implantation
- Instrument design and ease of use
- Implant longevity in patient
- Product reputation
- Ease of switching to another vendor’s product
Sales and service
- Vendor’s implant training program
- Availability and likeability of the sales representative
- Follow-up, thoroughness, and knowledge of the sales representative
- Stability and tenure of the sales representative
- Ability of sales representative to augment OR staffing
- Ability of sales representative to improve case quality or OR efficiency
- Education-focused seminars/events funded by vendor
- Information available to patients on the Internet
- Experience with senior surgeon mentors during orthopedics training
- Product/vendor used during orthopedics training
Implant vendor
- Vendor’s willingness to listen to surgeon’s suggestions for improving existing products
- Product innovations introduced by vendor
- Vendor reputation
- Vendor’s willingness to create specialized products to meet surgeon’s needs
- Another vendor makes a similar implant that performs the same function
Cost/financial considerations
- Cost of implant
- Willingness of insurers to adequately reimburse surgeon and hospital
- Consulting arrangements with vendor
The study also measured the surgeon’s hip and knee implant volumes at each hospital where they performed arthroplasty procedures. These data were taken from the discharge database maintained by (and available for purchase from) the Pennsylvania Health Care Cost Containment Council (www.PHC4.org). This database has previously been utilized by researchers to study volume–outcome relationships in arthroplasty procedures.32 Commonwealth of Pennsylvania publications of these same data reveal that the vast majority of surgeons (301/316 or 95%) performing 30 or more hip or knee replacements a year perform both procedures.33 These data also allowed us to identify the surgeon’s primary hospital and its characteristics (bed size, surgical volume, teaching status, ownership, and hospital system membership), as well as measure the number of hospitals at which the surgeon performed implant procedures and the percentage of implants performed at the primary facility.
Questionnaire administration
The PHC4 discharge database yielded a large, initial population of surgeons (N=2,421) linked to a hip or knee implant procedure in Pennsylvania hospitals. This number dwarfs the number of surgeons performing 30 or more procedures reported in the PCH4’s own publications, suggesting that there is some “noise” in the database’s surgeon identifier. The vast majority of surgeons in the state database (N=1,869) performed less than one procedure per month on average; of these, the vast majority performed only one (N=1,188) or two (N=349) per year. We excluded the low-volume surgeons (defined as <12 annual total procedures) from our sample and the survey administration because they were less likely to be active orthopedic surgeons and to have sufficient familiarity with the implant vendor and its products. This yielded a total of 552 surgeons, a number that seems reasonable given that it lies between the total number of orthopedists identified by the Commonwealth of Pennsylvania who performed knee and hip replacements in 2002 (N=488) and 2013 (N=619), thereby further justifying our exclusion decision.33,34 We excluded an additional 60 surgeons for whom we did not have full names or could not locate mailing addresses. Following these exclusions, we had a final sample of 492 orthopedists to whom we sent the survey. After two mailings, we received responses from 201 surgeons, representing a response rate of 40.85%.
Analysis of survey nonresponse
We used the PHC4 discharge database to compare responders and nonresponders on a number of practice characteristics that might affect their evaluations of vendors. These included the number of hospitals that surgeons utilized, their implant procedure volumes for hips and knees, the share of their total hip and knee implant volume at the primary hospital, and the share of the hospital’s total implant volume accounted for by that surgeon. Student’s t-test (appropriate for continuous variables) revealed that most of these differences were significant or marginally significant. Compared to the nonresponders, the responders utilized significantly fewer hospitals (1.6 vs 1.8, P<0.07) and had higher hip implant volumes (34.7 vs 27.5 procedures, P<0.10), significantly higher knee volumes (66.4 vs 53.2 procedures, P<0.05), higher shares of their implant volume at the primary hospital (20.7 vs 18.7%, P<0.25), and significantly higher shares of the hospital’s total implant volume (17.2 vs 14.1%, P<0.02). Since these variables are likely to influence the results, we statistically controlled the differential response. We estimated a logistic regression model to predict survey response using the surgeon’s utilization and volume characteristics, computed the inverse mills ratio to measure the odds of survey nonresponse, and then used it as an additional covariate in the results. We also weighted the data to conform to known population distributions to estimate population means.35,36
As an additional test of nonresponse bias, we conducted a wave analysis to compare the responders to the first and second administrations of the survey.37,38 There were no significant differences across all survey items.
Statistical analysis
Our analysis first sought to identify the factors that surgeons rate most highly in their choice of implant or vendor. For this portion of the analysis, we present the univariate statistics from the survey for items pertaining to each of the factors. We then sought to determine whether there was any differentiation across two implant types (hip vs knee) and five implant vendors on these factors. For this latter analysis, we used bivariate statistics displaying the means for each factor across the five major vendors and, then, tested for significant differences by vendor using analysis of variance (ANOVA). Surgeon respondents who used another vendor for their hip and knee implants were excluded due to small sample sizes. Because performance evaluations are likely to be influenced by a variety of factors, we computed the least-square means across vendors controlling the following: the surgeon’s hip/knee implant volume; the proportion of practice devoted to spine/arthroplasty/trauma; the number of years in practice; completion of an arthroplasty fellowship (1= yes); use of the same vendor during residency/fellowship (1= yes); number of hospitals used; proportion of implant procedures at primary hospital; engagement in three extracurricular activities including teaching fellows/residents, writing journal publications, and speaking at extramural meetings (1= yes); presence of two different economic ties with implant manufacturers including consulting fees and honoraria for talks (1= yes); and the survey nonresponse correction term. We also included characteristics of the surgeon’s primary hospital, including academic medical center (yes =1), ownership (for profit =1 and public =1; nonprofit is excluded contrast), size (factor scale combining bed size and surgical volume), and membership in hospital system (1= yes).
We conducted two additional analyses to summarize differences in factors promoting vendor choice. We calculated the Tukey–Kramer pair-wise differences-of-means that contrast each vendor with every other vendor on each factor. We also used the least-square means to rank order the vendors on each performance measure to determine whether there were any clearly preferred implant vendors or any association with vendor market shares. The large number of respondents afforded a sizeable number of orthopedists using three of the five vendors (and a reasonably large number using the other two) to assure the vendor-specific means are reasonably normal. In all of the bivariate analyses, we were more concerned with vendor rankings on the performance measures than the effects of the background variables; hence, we did not rely here on more sophisticated modeling approaches to untangle their effects.
Ethics
This study was reviewed by the University of Pennsylvania Office of Regulatory Affairs and exempted from IRB Review (category 2, minimal risk). Informed consent was obtained via a cover letter requesting participation and voluntary survey completion.
Results
Univariate statistics
Table 1 presents the univariate statistics from all of the measures. The average orthopedist performed 101 implant procedures, devoted ~41% of their practice to arthroplasty, had been in practice over 17 years, and concentrated ~90% of their implant procedures at one hospital. Orthopedists typically used more than one hip implant vendor (mean =1.48) and one knee implant vendor (mean =1.35) but concentrated well over 90% of their implant purchases with one vendor. Only 12% had economic ties with implant vendors, and only 13% used the vendor during their residency/fellowship.
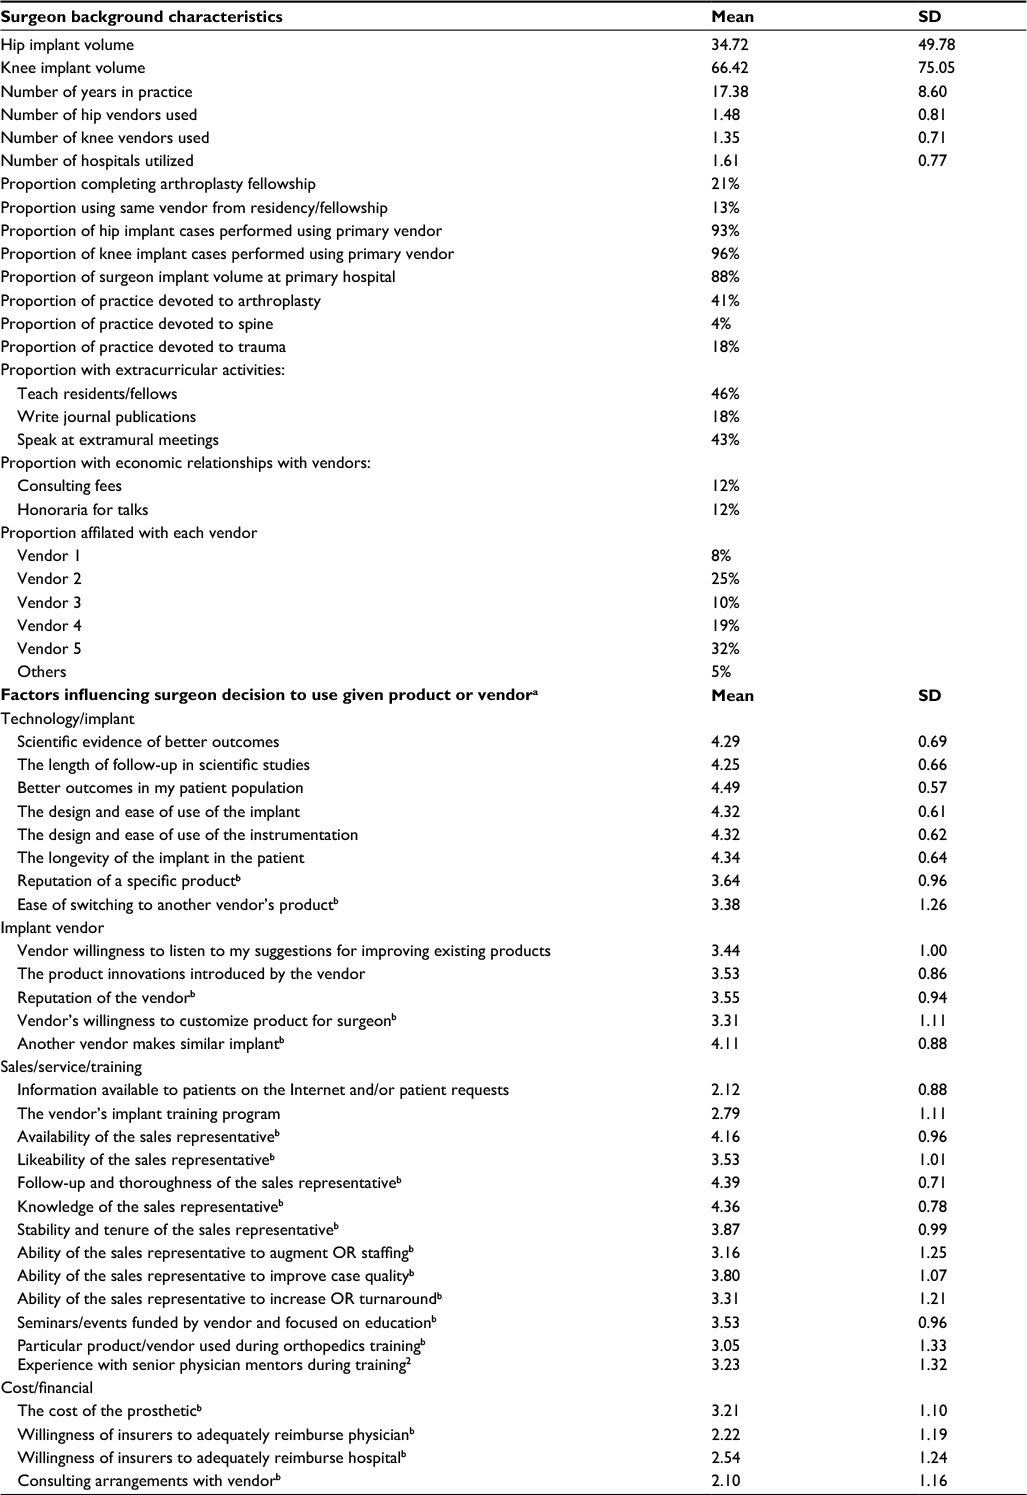 | Table 1 Univariate statistics (N=201) Notes: aLikert items: 5= strongly agree that factor influences decision and 1= strongly disagree that factor influences decision. bRatings of importance for hip implant. |
With regard to the factors that, according to surgeons, influenced their choice of vendor, those that pertain to the technology appear more important. These included (in order) better outcomes for patients (mean of 4.49 out of 5.00), longevity of implant (4.34), design and ease of both implant (4.32) and instrumentation (4.32), scientific evidence of better outcomes (4.29), length of follow-up in scientific studies (4.25), and to a lesser extent, product reputation (3.64). The other set of factors that appeared quite important included one vendor characteristic – the absence of another vendor making a similar implant (4.11) – and the following three sales/service characteristics: the sales representative’s follow-up and thoroughness (4.39), knowledge (4.36), and availability (4.16). However, the important role played by the sales representative in fostering physician’s preference was not global. The sales representative’s role in the OR was of intermediate importance – in terms of improving case quality (3.80), increasing OR efficiency and turnaround (3.31), and augmenting OR staffing (3.16) – as was their stability (3.87) and likeability (3.53).
Similarly, according to surgeon respondents, most factors tied to the implant vendor were of intermediate importance: vendor reputation (3.55), product innovations introduced by vendor (3.53), vendor-funded educational seminars (3.53), vendor willingness to listen to surgeon’s suggestions for product improvements (3.44), and vendor willingness to create specialized products to meet the surgeon’s needs (3.31).
Compared to these items, other factors were much less important, including experience with surgeon mentors during residency training (3.23), exposure to the implant/vendor during training (3.05), implant cost (3.21), the vendor’s implant training program (2.79), hospital reimbursement (2.54), surgeon reimbursement (2.22), patient information (2.12), and consulting arrangements (2.10). The low importance of consulting arrangements may reflect the low percentage of surgeons (12%) with such arrangements among our sample. This percentage may be slightly higher than the national average. Data reveal that only 4% of orthopedists received industry payments in 2007;39,40 data from the Open Payments Program database revealed that only 402 orthopedists performing adult reconstructive procedures received industry payments during the latter part of 2013.41
Bivariate results: factors driving implant/vendor choice, by implant type
Surgeons ranked the importance of several factors across the four domains of product preference (technology/implant, vendor, sales/service, and cost/financial considerations) separately for hip and knee implants. The ratings were virtually identical. There were no significant differences for any item. For the sake of parsimony, these results are not presented here (available from lead author).
Bivariate results: factors driving implant/vendor choice, by vendor
Table 2 presents the unadjusted means for the factors associated with the surgeon’s choice of vendor for hip implants, broken out by specific vendor (identity masked). There are few significant differences across vendors (P<0.05); thus, we present data on only a subset of the items across the four domains. Table 3 compares the means across vendors, adjusted for all of the background variables included in a least-squares regression. There are no significant differences across vendors. Moreover, the ranks are not associated with vendor market shares.
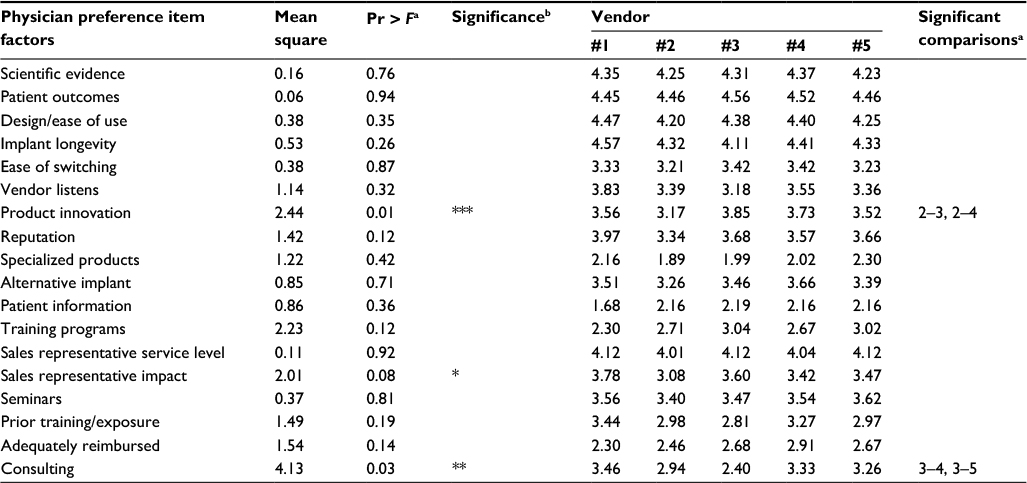 | Table 2 Unadjusted means Notes: aTest of null hypothesis of no differences among vendors on physician preference item. bTukey–Kramer pair-wise comparison significance: *P<0.10; **P<0.05; ***P<0.01. |
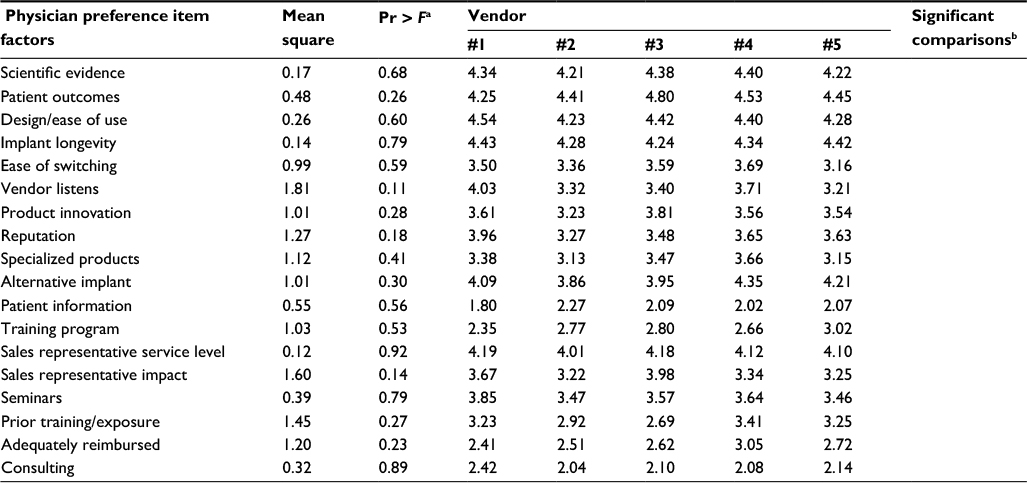 | Table 3 Adjusted least-square means Notes: aTest among vendors on physician preference item. bTukey–Kramer pair-wise comparison significance: P<0.10; P<0.05; P<0.01. |
Discussion
Key findings
Our results suggest that orthopedic implants represent PPIs on several dimensions. Consistent with vendor strategy, these dimensions encompass both the technology/implant and sales/service. Factors relating to the technology are rated most important; some factors relating to sales/service are also highly rated but not uniformly so. Factors that relate to the vendor and the implant’s cost/financial considerations are rated lower in importance. This is not to say that these other factors are not important but only that they are relatively less important as evaluated by surgeons.
Specifically, the most important technological considerations associated with physician’s preference encompass patient outcomes and implant longevity, scientific evidence, and the design and ease of both the implant and its instrumentation. The most important sales/service considerations encompass the sales representative’s follow-up, thoroughness, knowledge, and availability. These findings thus suggest that PPIs are products that help the surgeon with his/her professional role as the patient’s agent.
The importance of these factors does not seem to vary by type of implant (hip versus knee). This finding is not that surprising, given that the orthopedic surgeons studied here perform both hip and knee procedures, utilize both types of implants, and procure them from the same vendor. It is also possible that our questionnaire design which asked orthopedic surgeons to rate both implants introduced some response set bias in the ratings.
There is not a great deal of variation in the importance assigned to these factors across vendors, as reported by orthopedic surgeons. This finding is consistent across the four domains of technology, vendor, sales/service, and cost/financial considerations. There are also no significant differences in how the vendors were rated on these factors. One or two vendors appeared to have higher average ratings than the others, but the differences separating them are not statistically significant. Vendor implants are thus viewed more as similar than differentiated products by surgeons. This suggests that “quality” may not be the decisive issue in defining PPIs; all vendors seem to make quality products. Surgeons nevertheless have decided preferences for a particular vendor, expressed in terms of primacy of use and long-term loyalty. This is also what makes hip and knee implants PPIs. Our findings suggest that such preferences may not be based solely on perceived differences between vendors’ products and services, but perhaps on habit, familiarity, and accumulation of user (practice) efficiencies over time.
Limitations of the findings
This study suffers from several limitations. First, we rely on survey responses rather than empirical analyses of surgeon product selection for particular patients. Thus, we do not measure actual implant performance or longevity, but rather surgeon perceptions of why they use that implant. Second, we do not analyze specific types of implants or components or make comparisons between similar implant types. Thus, we do not control for the surgeon’s choice of specific product lines and lack information on the number of surgeons using specific lines. We also do not know whether the implant products evaluated here by surgeons were approved by the US Food and Drug Administration through the premarket approval or 510(k) route,42 or had clinical data available. Third, we do not conduct head-to-head comparisons of the ratings of different implants or vendors by the same surgeon.
Fourth, the study relies heavily on responses to one survey, from which we glean many of the variables. Thus, there is the possibility of common methods bias, which can inflate the association among variables.43 Fifth, there is the possibility of social desirability bias, which might lead surgeons to underreport the prevalence and impact of their financial ties with vendors. However, both national data and other studies reveal that relatively few surgeons have such economic ties with vendors, which is consistent with the low levels reported here. Social desirability bias might lead surgeons to rank insurer willingness to adequately reimburse them low; however, surgeons rate both physician and hospital reimbursement low. Social desirability bias might also lead surgeons to rank clinical outcomes more highly relative to relationships with sales representatives; however, several measures of the sales representative are indeed just as highly ranked here.
Sixth, the data are taken from surgeons in only one state and may not be generalizable to the rest of the country. We make no claim here that Pennsylvania orthopedists resemble their counterparts elsewhere, although we know of no reason why Commonwealth of Pennsylvania physicians would have different views on implant/vendor preference. Seventh, we lack data on several important variables that might influence the surgeons’ evaluations reported here: implant/vendor prices, the possible existence of hospital contracts with the vendor, and the surgeon’s involvement in hospital negotiations (and pricing decisions) with the vendor. Eighth, surgeons’ ratings of implants and vendors across the four domains may change over time, depending on vendor and hospital strategies or changes in surgeons’ practices (eg, employment). Finally, our results are based on survey data from 201 surgeons, which may limit our ability to discern differences in evaluations across vendors.
There are also several strengths of the study. The investigators followed a rigorous process to develop the questionnaire based on the academic literature on medical products companies and input from several orthopedists regarding the domains that might be salient in product choice: technology/implant, vendor, sales/service, and cost/financial considerations. The survey was first pilot tested in an orthopedic specialty hospital and then administered to the population of active orthopedic surgeons in one state who had significant experience performing hip and knee implants. The data reported here reflect what surgeons state is important in their selection of an implant or vendor and not what hospital managers believe is important. The research controlled nonresponse bias and utilized supplemental data to control surgeon volume. Finally, the study encompassed both hip and knee implants, finding similar patterns for each.
Conclusion
PPIs may not be totally idiosyncratic across surgeons. There is a great deal of commonality in surgeons’ ratings of orthopedic products across implant types and vendors. Such consistency suggests that physician’s preference may have some underlying dimensions related to the technology’s patient benefits and features and the sales/service effort associated with marketing it; that is, the twin pillars in vendor strategy are reflected in two primary domains of physician’s preference for the vendor’s products. Future research should investigate whether the findings reported here hold over time and other products.
Disclosure
REB is a consultant for Zimmer Biomet for which he receives royalties and speaking honoraria. The authors report no other conflicts of interest in this work.
References
Burns LR, Lawrence D, Sammut S. Healthcare innovation across sectors: convergences and divergences. In: Burns LR, editor. The Business of Healthcare Innovation. (Chap. 8). Cambridge, UK: Cambridge University Press; 2012:515–563. | ||
Cassak D. Abbott Vascular: the now-ready-for-prime time player. In Vivo. 2004;22(5):25–29. | ||
Cassak D. Building billion-dollar businesses: an interview with Robert Croce. In Vivo. 2005;23:27–36. | ||
Keusch L, Lin K. Healthcare: Medical Devices – Annual Cardiac Rhythm Management Survey. New York, NY: Goldman Sachs; 2001. | ||
Schneller E, Smeltzer L. Strategic Management of the Health Care Supply Chain. San Francisco: Jossey-Bass; 2006. | ||
Burns LR. The Health Care Value Chain. San Francisco: Jossey-Bass; 2002. | ||
Government Accountability Office. Medicare: Lack of Price Transparency May Hamper Hospitals’ Ability to Be Prudent Purchasers of Implantable Medical Devices. GAO-12-126. Washington, DC: GAO; 2012. Available from: http://www.gao.gov/assets/590/587688.pdf. Accessed December 10, 2017. | ||
DeJohn P. The last frontier: saving on M.D. preference items. Hosp Mater Manag. 2005;30(1):9–11. | ||
ECRI Institute. Wasting Millions By Making Purchases Based Solely on Physician Preference? Not in My Hospital!. Plymouth Meeting, PA: ECRI Institute; 2009. | ||
Donahoe G, King G. Estimates of Medical Device Spending in the United States. Washington, DC: Advamed; 2012. Available from: https://www.mcguirewoods.com/news-resources/publications/mwc/advamed-medical-device-spending.pdf. Accessed December 20, 2017. | ||
Statista [webpage on the Internet]. Medical devices expenditure as a share of total U.S. health expenditures from 1989 to 2013. The Statistics Portal. 2017. Available from: https://www.statista.com/statistics/498842/medical-devices-expenditure-as-share-of-us-health/. Accessed on August 24, 2017. | ||
Weiss A, Elixhauser A. Trends in Operating Room Procedures in U.S. Hospitals, 2001-2011. Statistical Brief #171. Washington, DC: Agency for Healthcare Research and Quality; 2014. | ||
Belatti D, Pugely A, Phisitkul P, Amendola A, Callaghan J. Total joint arthroplasty: trends in Medicare reimbursement and implant prices. J Arthroplasty. 2014;29:1539–1544. | ||
Montgomery K, Schneller E. Hospitals’ strategies for orchestrating selection of physician preference items. Milbank Q. 2007;85(2):307–335. | ||
Wilson N, Schneller E, Montgomery K, Bozic K. Hip and knee implants: current trends and policy considerations. Health Aff (Millwood). 2008;27(6):1587–1598. | ||
Lerner J, Fox D, Nelson T, Reiss J. The consequence of secret prices: the politics of physician preference items. Health Aff (Millwood). 2008;27(6):1560–1565. | ||
Robinson JC. Value-based purchasing for medical devices. Health Aff (Millwood). 2008;27(6):1523–1531. | ||
McIlhargey B [webpage on the Internet]. Contracting for physician-preference items. J Healthc Contract. 2017. Available from: http://www.jhconline.com/contracting-for-physician-preference-items.html. Accessed August 31, 2017. | ||
Burns LR, Lee A, Bradlow E, Antonacci A. Surgeon evaluation of suture and endo-mechanical products. J Surg Res. 2007;141:220–233. | ||
Hsu M, Wise F. Orthopedics: Unique Market Dynamics Drive Steady Growth. New York: Bear Stearns; 2004. | ||
Scannell J, Bedell L. Orthopaedics: Company Pricing Power Rests with Sticky Surgeons. Summary of Quantitative Switching Survey. New York, NY: Sanford Bernstein & Co; 2008. | ||
Scannell J, Bedell L. Orthopaedics: Surgeon Switching, Loyalty, and Patterns of Product Use. Part 1of Detailed Survey Results. New York, NY: Sanford Bernstein & Co; 2008. | ||
Scannell J, Bedell L. Orthopaedics: Future of Surgeon Switching and Ortho Pricing Power. Part 2 of Detailed Survey Results. New York, NY: Sanford Bernstein & Co; 2008. | ||
Nudell BM. BMET, SYK and ZMH: Price Transparency is a Major Threat. Downgrading BMET; Lower ZMH Target to $62 and SYK to $44. New York: Sanford Bernstein and Co; 2006. | ||
Pauly MV, Burns LR. Price transparency for medical devices. Health Aff (Millwood). 2008;27(6):1544–1553. | ||
Olson S, Obremskey W, Bozic K. Healthcare technology: physician collaboration in reducing the surgical cost. Clin Orthop Relat Res. 2013;471:1854–1864. | ||
Grennan M, Swanson A. Transparency and Negotiated Prices: The Value of Information in Hospital-Supplier Bargaining. Working Paper. Philadelphia: Wharton School; 2016. | ||
Sharkey P, Sethuraman V, Hozack W, Rothman R, Stiehl J. Factors influencing choice of implants in total hip arthroplasty and total knee arthroplasty. J Arthroplasty. 1999;14(3):281–287. | ||
Premier [webpage on the Internet]. Physician preference: balancing cost and quality. Economic Outlook. 2001. Available from: https://issuu.com/premiercs/docs/public_eo_sept_2011_final_web. Accessed August 24, 2017. | ||
Siddel K. Hospitals losing on physician preference items. OR Manager. 2012;28(1):1–2. | ||
Miksic M, Reicin G, Yik A, Roman D. Hospital Supplies & Medical Technology: 2005 Orthopaedic Survey. New York: Morgan Stanley; 2005. | ||
Singh J, Kwoh CK, Boudreau R, Lee G-C, Ibrahim S. Hospital volume and surgical outcomes after elective hip/knee arthroplasty: a risk-adjusted analysis of a large regional database. Arthritis Rheum. 2011;63(8):2531–2539. | ||
Pennsylvania Health Care Cost Containment Commission. Total Hip and Knee Replacements. Harrisburg, PA: PHC4; 2005. | ||
Pennsylvania Health Care Cost Containment Commission. Knee and Hip Replacements: 2013 Data. Harrisburg, PA: PHC4; 2015. | ||
Kalton G. Compensating for Missing Data. Ann Arbor, MI: Institute for Social Research; 1983. | ||
Tomaskovic-Devey D, Leiter J, Thompson S. Organizational survey nonresponse. Adm Sci Q. 1994;39(4):439–457. | ||
Hikmet N, Chen SK. An investigation into low mail survey responses of information technology users in health care organizations. Intl J Med Inform. 2003;72:29–34. | ||
Rogelberg SG, Stanton JM. Understanding and dealing with organizational survey nonresponse. Organ Res Methods. 2007;10(2):195–209. | ||
Hockenberry J, Weigel P, Auerbach A, Cram P. Financial payments by orthopedic device makers to orthopedic surgeons. Arch Intern Med. 2011;171(19):1759–1765. | ||
Steinbrook R. Industry payments to physicians: lessons from orthopedic surgery. Arch Intern Med. 2011;171(19):1765–1766. | ||
Lopez J, Ahmed R, Bae S, et al. A new culture of transparency: industry payments to orthopedic surgeons. Orthopedics. 2016;39(6):1058–1062. | ||
FDA. 510(k) Clearances. Silver Spring, MD: US Food and Drug Administration. Available from: http://www.fda.gov/MedicalDevices/ProductsandMedicalProcedures/DeviceApprovalsandClearances/510kClearances/. Accessed December 10, 2017. | ||
Meade AW, Watson AM, Kroustalis CM. Assessing common methods bias in organizational research. Paper presented at: 22nd Annual Meeting of the Society for Industrial and Organizational Psychology. New York: 2007. |
 © 2018 The Author(s). This work is published and licensed by Dove Medical Press Limited. The
full terms of this license are available at https://www.dovepress.com/terms
and incorporate the Creative Commons Attribution
- Non Commercial (unported, 3.0) License.
By accessing the work you hereby accept the Terms. Non-commercial uses of the work are permitted
without any further permission from Dove Medical Press Limited, provided the work is properly
attributed. For permission for commercial use of this work, please see paragraphs 4.2 and 5 of our Terms.
© 2018 The Author(s). This work is published and licensed by Dove Medical Press Limited. The
full terms of this license are available at https://www.dovepress.com/terms
and incorporate the Creative Commons Attribution
- Non Commercial (unported, 3.0) License.
By accessing the work you hereby accept the Terms. Non-commercial uses of the work are permitted
without any further permission from Dove Medical Press Limited, provided the work is properly
attributed. For permission for commercial use of this work, please see paragraphs 4.2 and 5 of our Terms.