Back to Journals » Diabetes, Metabolic Syndrome and Obesity » Volume 12
Physical activity increases the resistin concentration in hemodialyzed patients without metabolic syndrome
Authors Hornik B ![]() , Duława J
, Duława J ![]() , Szewieczek J
, Szewieczek J ![]() , Durmała J
, Durmała J ![]()
Received 6 September 2018
Accepted for publication 2 November 2018
Published 18 December 2018 Volume 2019:12 Pages 43—57
DOI https://doi.org/10.2147/DMSO.S186674
Checked for plagiarism Yes
Review by Single anonymous peer review
Peer reviewer comments 3
Editor who approved publication: Dr Konstantinos Tziomalos
Beata Hornik,1 Jan Duława,2 Jan Szewieczek,3 Jacek Durmała4
1Department of Internal Nursing, School of Health Sciences in Katowice, Medical University of Silesia, Katowice, Poland; 2Department of Internal Medicine and Metabolic Diseases, School of Health Sciences in Katowice, Medical University of Silesia, Katowice, Poland; 3Department of Geriatrics, School of Health Sciences in Katowice, Medical University of Silesia, Katowice, Poland; 4Department of Rehabilitation, School of Health Sciences in Katowice, Medical University of Silesia, Katowice, Poland
Background: Resistin (RES) concentration increases in end-stage renal disease patients. However, there have been no studies defining the role of physical activity in RES concentrations in hemodialyzed (HD) patients. This study was aimed to determine metabolic and inflammatory effects, including RES, of 4-week supervised rehabilitation program in HD patients, with or without metabolic syndrome (MS).
Methods: The study was completed by 28 patients aged 56.9±13.3 years (x̅ ± SD) who were HD for 50.6±73.4 months, and 30 controls aged 61.5±8.3 years with normal renal function. Both the groups were divided into two subgroups with respect to MS. Individualized supervised rehabilitation program based on physiotherapy, including exercises, was provided to each subject for 4 weeks. Baseline and post-intervention complete blood count, glycated hemoglobin (HbA1c) and levels of serum RES, leptin, adiponectin, cystatin C, erythropoietin, high sensitivity C-reactive protein (hs-CRP), tumor necrosis factor alpha (TNF-α), interleukin-6, transforming growth factor- β1, plasminogen activator inhibitor-1 homocysteine, insulin, albumin, parathyroid hormone (PTH), and phosphorus were measured.
Results: Compared to controls, HD patients showed higher baseline leucocytes count and higher serum concentrations of RES, leptin, cystatin C, hs-CRP, TNF-α, homocysteine, phosphorus, PTH while hemoglobin, glucose, and albumin concentrations. A positive correlation between serum albumin and RES concentrations was observed in HD patients. Post-intervention RES increase was observed in HD patients without MS (post-intervention 34.22±8.89 vs baseline 30.16±11.04 ng/mL; P=0.046) while no change was observed in patients with MS and in the control group.
Conclusion: MS modifies a RES response to the rehabilitation program in HD patients.
Keywords: metabolic syndrome, hemodialysis, resistin, physical activity, cytokines
Introduction
Discovered in 2001, resistin (RES) is a cysteine-rich protein of molecular weight 12.5 kDa and structurally similar to cytokines.1,2 RES is an adipokine, in mice it is mainly expressed by adipocytes. Its major sources in humans are monocytes and macrophages.2–4 In uremic patients, serum RES concentrations are elevated as compared to individuals with normal renal function.5 It has not been concluded whether higher RES concentration is secondary to reduced renal clearance or reflects chronic inflammation.6–8 Hemodialysis does not eliminate RES as expected for its molecular size.2 RES is an independent biomarker associated with all-cause and cardiovascular mortality in senile patients, hypertensive individuals, and at early stages of chronic kidney disease.9,10 The correlation between RES concentration and metabolic indicators in individuals with normal renal function remains unexplained.11 Despite its name, the effect of this adipokine on the development of insulin resistance in humans has never been explicitly demonstrated.12,13 There have also been some contradictory reports on the relation of RES with obesity, insulin resistance, and type 2 diabetes.4,14–16 Like uremia, obesity is a chronic inflammatory condition. Although low shares of human RES originate from fat cells, its concentration correlates with the body mass and responds to weight changes.17,18
In hemodialyzed (HD) patients, the serum RES concentration is increased, but it does not correlate with insulin resistance,19 and hemodialysis improves insulin sensitivity and decreased insulin clearance.20–22 In healthy subjects, the association between RES and inflammatory markers has been confirmed.23 Similarly, in HD patients, a relationship between RES and concentrations of high sensitivity C-reactive protein (hs-CRP), interleukin-6 (IL-6), tumor necrosis factor alpha (TNF-α), and the number of leucocytes has been observed.24,25
Regular physical exercise reduces mortality and morbidity of many diseases and demonstrates a cardio-protective effect.26 However, what seems most important is the anti-inflammatory effect of regular physical exercise caused, among others, by the secretion of anti-inflammatory cytokines by the muscles.26–28 Exercise training intervention in individuals with normal renal function reduces RES, leptin, IL-6, and homocysteine (Hcy) concentrations especially in the overweight or obese population.23
Despite numerous reports indicating the anti-inflammatory effect of physical exercise in chronic conditions,26,29,30 including early stage of chronic kidney disease (CKD),27 the relationship between regular exercise and inflammation indices in HD patients remains unclear.31
The effect of enhanced physical activity on reduced RES concentrations in healthy individuals has been well documented.32 However, no studies have been conducted to define the role of physical activity in RES concentrations in HD patients.
Metabolic syndrome (MS) is a recognized and proven risk factor for cardiovascular disease.33 Uremia itself is a very strong cardiovascular risk factor, and one wonders whether the presence of MS adds to increasing the risk. It is possible that the MS interferes with physiologically observed responses to physical activity program. The phenomenon of reverse epidemiology occurs in uremic patients.34,35 Higher body mass index (BMI) correlates with lower all-cause and cardiovascular mortality.33 We hypothesized that the response of HD patients to exercise training intervention may vary depending on the presence or absence of the MS.
The aim of the study was to investigate a metabolic and inflammatory response, with a special focus on RES, to the 4-week supervised rehabilitation program including individualized aerobic exercises in end-stage renal disease patients treated with hemodialysis, with or without MS.
Subjects and methods
This prospective interventional study comprised 28 consecutive patients of a dialysis center (study group HD), aged 56.9±13.3 years ( ± SD; in the range from 25 to 75 years), 57% women, who were treated with hemodialysis for 50.6±73.4 months (in the range from 5 to 272 months) and fulfilled the criteria for participation and completed the program. These subjects were recruited at the dialysis center in Katowice, Poland. A control group (C) comprised 30 consecutive patients of the rehabilitation day ward, aged 61.5±8.3 years ( ± SD; in the range from 37 to 76 years), 50% women, who fulfilled the criteria for participation and completed the program. These subjects were recruited at the Department of Rehabilitation at University Hospital (No. 7 SUM, Upper Silesian Medical Center, Katowice, Poland; Figure 1).
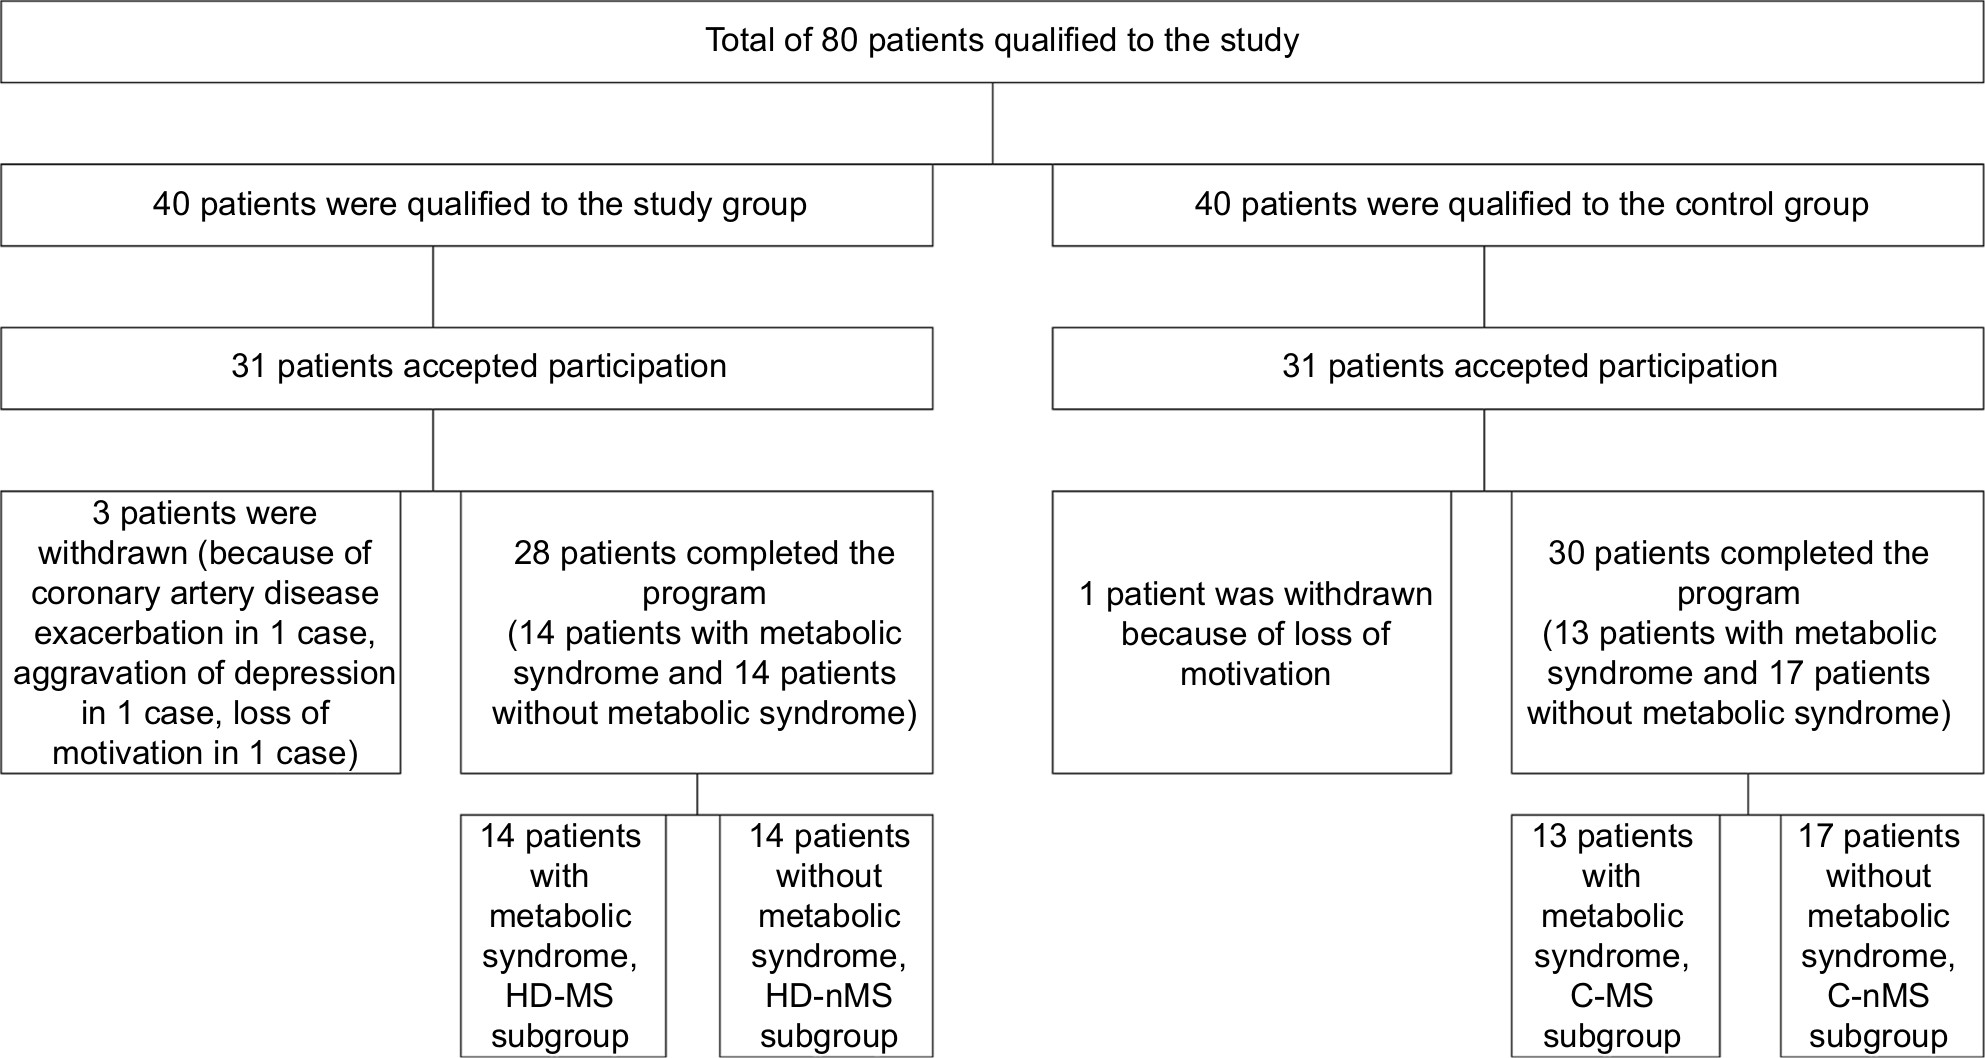 | Figure 1 Recruitment of patients to the study. Abbreviations: C, control group; HD, hemodialyzed; MS, metabolic syndrome; nMS, non-metabolic syndrome. |
Written informed consent was obtained from each subject after the aim of the study, protocol, and risks were presented and explained.
Inclusion criteria involved: age >18 years, end-stage renal failure with the hemodialysis treatment duration >3 months (for the study group) or normal kidney function (assessed by eGFR, general urinalysis, 24-hours albumin excretion, and renal ultrasound results) – for the control group, capacity to perform low-level intensity exercise, and written informed consent for participation in the study.
Exclusion criteria included: a systemic rheumatic disease, cancer, conditions preventing/inability to perform low-level intensity exercise (New York Heart Association class IV heart failure, advanced mobility disorders), history of clinically overt infection during past 3 months, immunosuppressive therapy, and pregnancy (Figure 1).
All subjects were further divided according to the MS. Diagnosis of MS was based on the presence of at least three out of five distinct, clinically relevant cardio-metabolic risk factors for the European population, that is, waist circumference, WC: female ≥80 cm, male ≥94 cm; fasting triglyceride concentration, TG ≥150 mg/dL or treatment of hypertriglyceridemia; fasting high-density lipoprotein cholesterol: female <50 mg/dL, male <40 mg/dL or use of concentration-increasing drugs; systolic blood pressure, sSBP ≥130 mmHg or diastolic blood pressure, DBP ≥85 mmHg or use of antihypertensive drugs; fasting serum glucose concentration ≥100 mg/dL or use of medication for hyperglycemia, according to the International Diabetes Federation, National Heart, Lung, and Blood Institute, and American Heart Association.36
Fourteen patients of the study group met criteria of MS (HD-MS subgroup) while 14 others did not (HD-non-MS [nMS] subgroup). Also, 13 individuals of the control group met these criteria (C-MS subgroup) while 17 subjects did not (C-nMS subgroup).
The study was approved by the Bioethical Committee of the Medical University of Silesia in Katowice (resolution no. KNW/0022/KB1/44/II/06/14/17) and was carried out according to the Declaration of Helsinki regarding human studies.
Measurements
The patients were evaluated for their body weight, height, BMI and waist circumference, Charlson comorbidity index (CCI) and cardiopulmonary exercise testing (CPET). CPET is an exercise test with analysis of breathing gases. Ventilation and gas exchange were measured breath-by-breath with an automated metabolic measurement system (ZAN 680). The CPET was performed on a treadmill ergometer (TM425). Before each test, the device was calibrated with standard calibration gases. The heart rate, SBP, and DBP at rest, the end of each stage, peak exercise, and during recovery were assessed.
Fasting blood samples (at least 12 hours after the last meal) were taken between 6:00 and 7:00 am on the post-dialysis day before initiation of the program and on the day next to the completion of the of the 4-week physical activity program. Post-dialysis day refers to another day without hemodialysis.
Laboratory tests included blood hemoglobin concentration, leucocytes and lymphocytes count, and HbA1c percentage, as well as hs-CRP, albumin, glucose, insulin, creatinine, PTH, sodium, potassium, and phosphorous serum concentrations. Homeostasis Model Assessment (HOMA), according to the formula: fasting state glycaemia (mmol/L) × fasting insulin (µIU/mL)/22.5, was used to quantify insulin resistance. We derived eGFR from serum creatinine using the Chronic Kidney Disease Epidemiology Collaboration equation.37
Kt/V (natural logarithm of the ratio of urea concentrations before and after dialysis) was used to quantify the adequacy of dialysis.
Serum samples were collected at −80°C for cytokine and hormonal tests. Serum concentrations of RES, adiponectin, cystatin C, erythropoietin, TNF-α, IL-6, transforming growth factor beta 1 (TGF-β1), and plasminogen activator inhibitor-1 (PAI-1) were assessed with the use of ELISA tests, leptin – radio-immuno-assay test and Hcy – with the use of the lumino-immuno-assay test.
Rehabilitation program
Initial rehabilitation assessment including anamnesis, physical and anthropometric examination, and functional capacity assessment was performed in each subject. Treadmill stress test according to the modified Bruce protocol with continuous gas analysis was used to assess ventilatory anaerobic threshold (VAT). The anaerobic threshold (VAT) was estimated using the V-slope method.38 Cardiac rehabilitation exercise programs were used as the base of rehabilitation program. Individualized supervised rehabilitation program based on physiotherapy was provided to each subject for 4 weeks, 6 days a week, 2 hours a day. A regular physical activity program was also carried out on dialysis days. Hemodialysis sessions were conducted in the afternoon hours.
This program included 20–40 minute (25±10 minutes) of aerobic endurance training (AET) – walking, treadmill walking, forward and back walking, and cycling on stationary ergometers. Intensity of exercise in patients after CPET was about 10% below VAT. Every time, the intensity of exercise was closed to VAT. In patients without CPET (15.5%), the intensity of AET was closed between 40% and 60% of heart rate reserve. During all sessions of AET the rating of perceived exertion based on Borg 6–20 scale was below 13.39 This exercise was complemented with isometric exercises, free active exercises, balance and coordination exercises, active breathing exercises, exercises in part or full unloading, manual therapy, medical massage, relaxation exercises, transcutaneous electrical nerve stimulation, laser therapy, ultrasound and light therapy, and magnetic field therapy. All participants accomplished at least 90% of the prescribed training sessions.
Statistics
Statistical analysis was carried out by using Statistica 13.1 (Stat Soft, Inc., Tulsa, OK, USA). Results are presented as mean and standard deviation (± SD) or as medians. The Student’s paired t-test or the Wilcoxon test was used to compare the variables before and after rehabilitation program. The Student’s independent t-test was used to compare HD group and C group. Mann–Whitney U test was applied for non-parametric variables. Relationships between variables were determined with the Spearman rank correlation test. The level of significance was set at P<0.05.
Ethics statement
The results of scientific studies are anonymized and will be stored as such in an electronic form in a structured Statistica format on the premises of the facility conducting the study. The data will be stored for a period of 15 years. If requested, it can be made available in an anonymized form to the publisher within the scope of the presented work. Personal data related to this research are kept on the premises of the medical facility where the studies have been conducted. The data are subject to provisions on data protection in accordance with the law (Patients’ Rights and Patients’ Rights Ombudsman Article 26 section 4).
Results
Comparison of HD group and C group
The most prevalent causes of end-stage renal failure were: glomerulonephritis (25.1%), diabetic renal disease (21.4%), and hypertensive nephropathy (21.4%). The mean CCI in the HD and C groups were 4.5±3.6 and 1.03±0.61, respectively (P<0.001). The vascular access was through an arterio-venous (AV) fistula in 24 patients (85.6%) or through AV graft or dialysis catheter. Bicarbonate dialysis sessions lasted 4–4.5 hours and was performed 3–5 times a week using of high-flux dialysis machines. The dialysis fluid flow rate was 500 mL/min and blood flow 250–350 mL/min. Dialysis adequacy index (Kt/V) was 1.41±0.23. HD and C groups were demographically and anthropometrically comparable, showing no significant differences in age, sex, and BMI. HD group compared to C group showed significantly higher serum concentrations of creatinine, potassium RES, leptin, cystatin C, hs-CRP, TNF-α, Hcy, WBC, phosphorus, and PTH. Individuals with normal renal function had higher hemoglobin, glucose, and albumin concentration (Table 1).
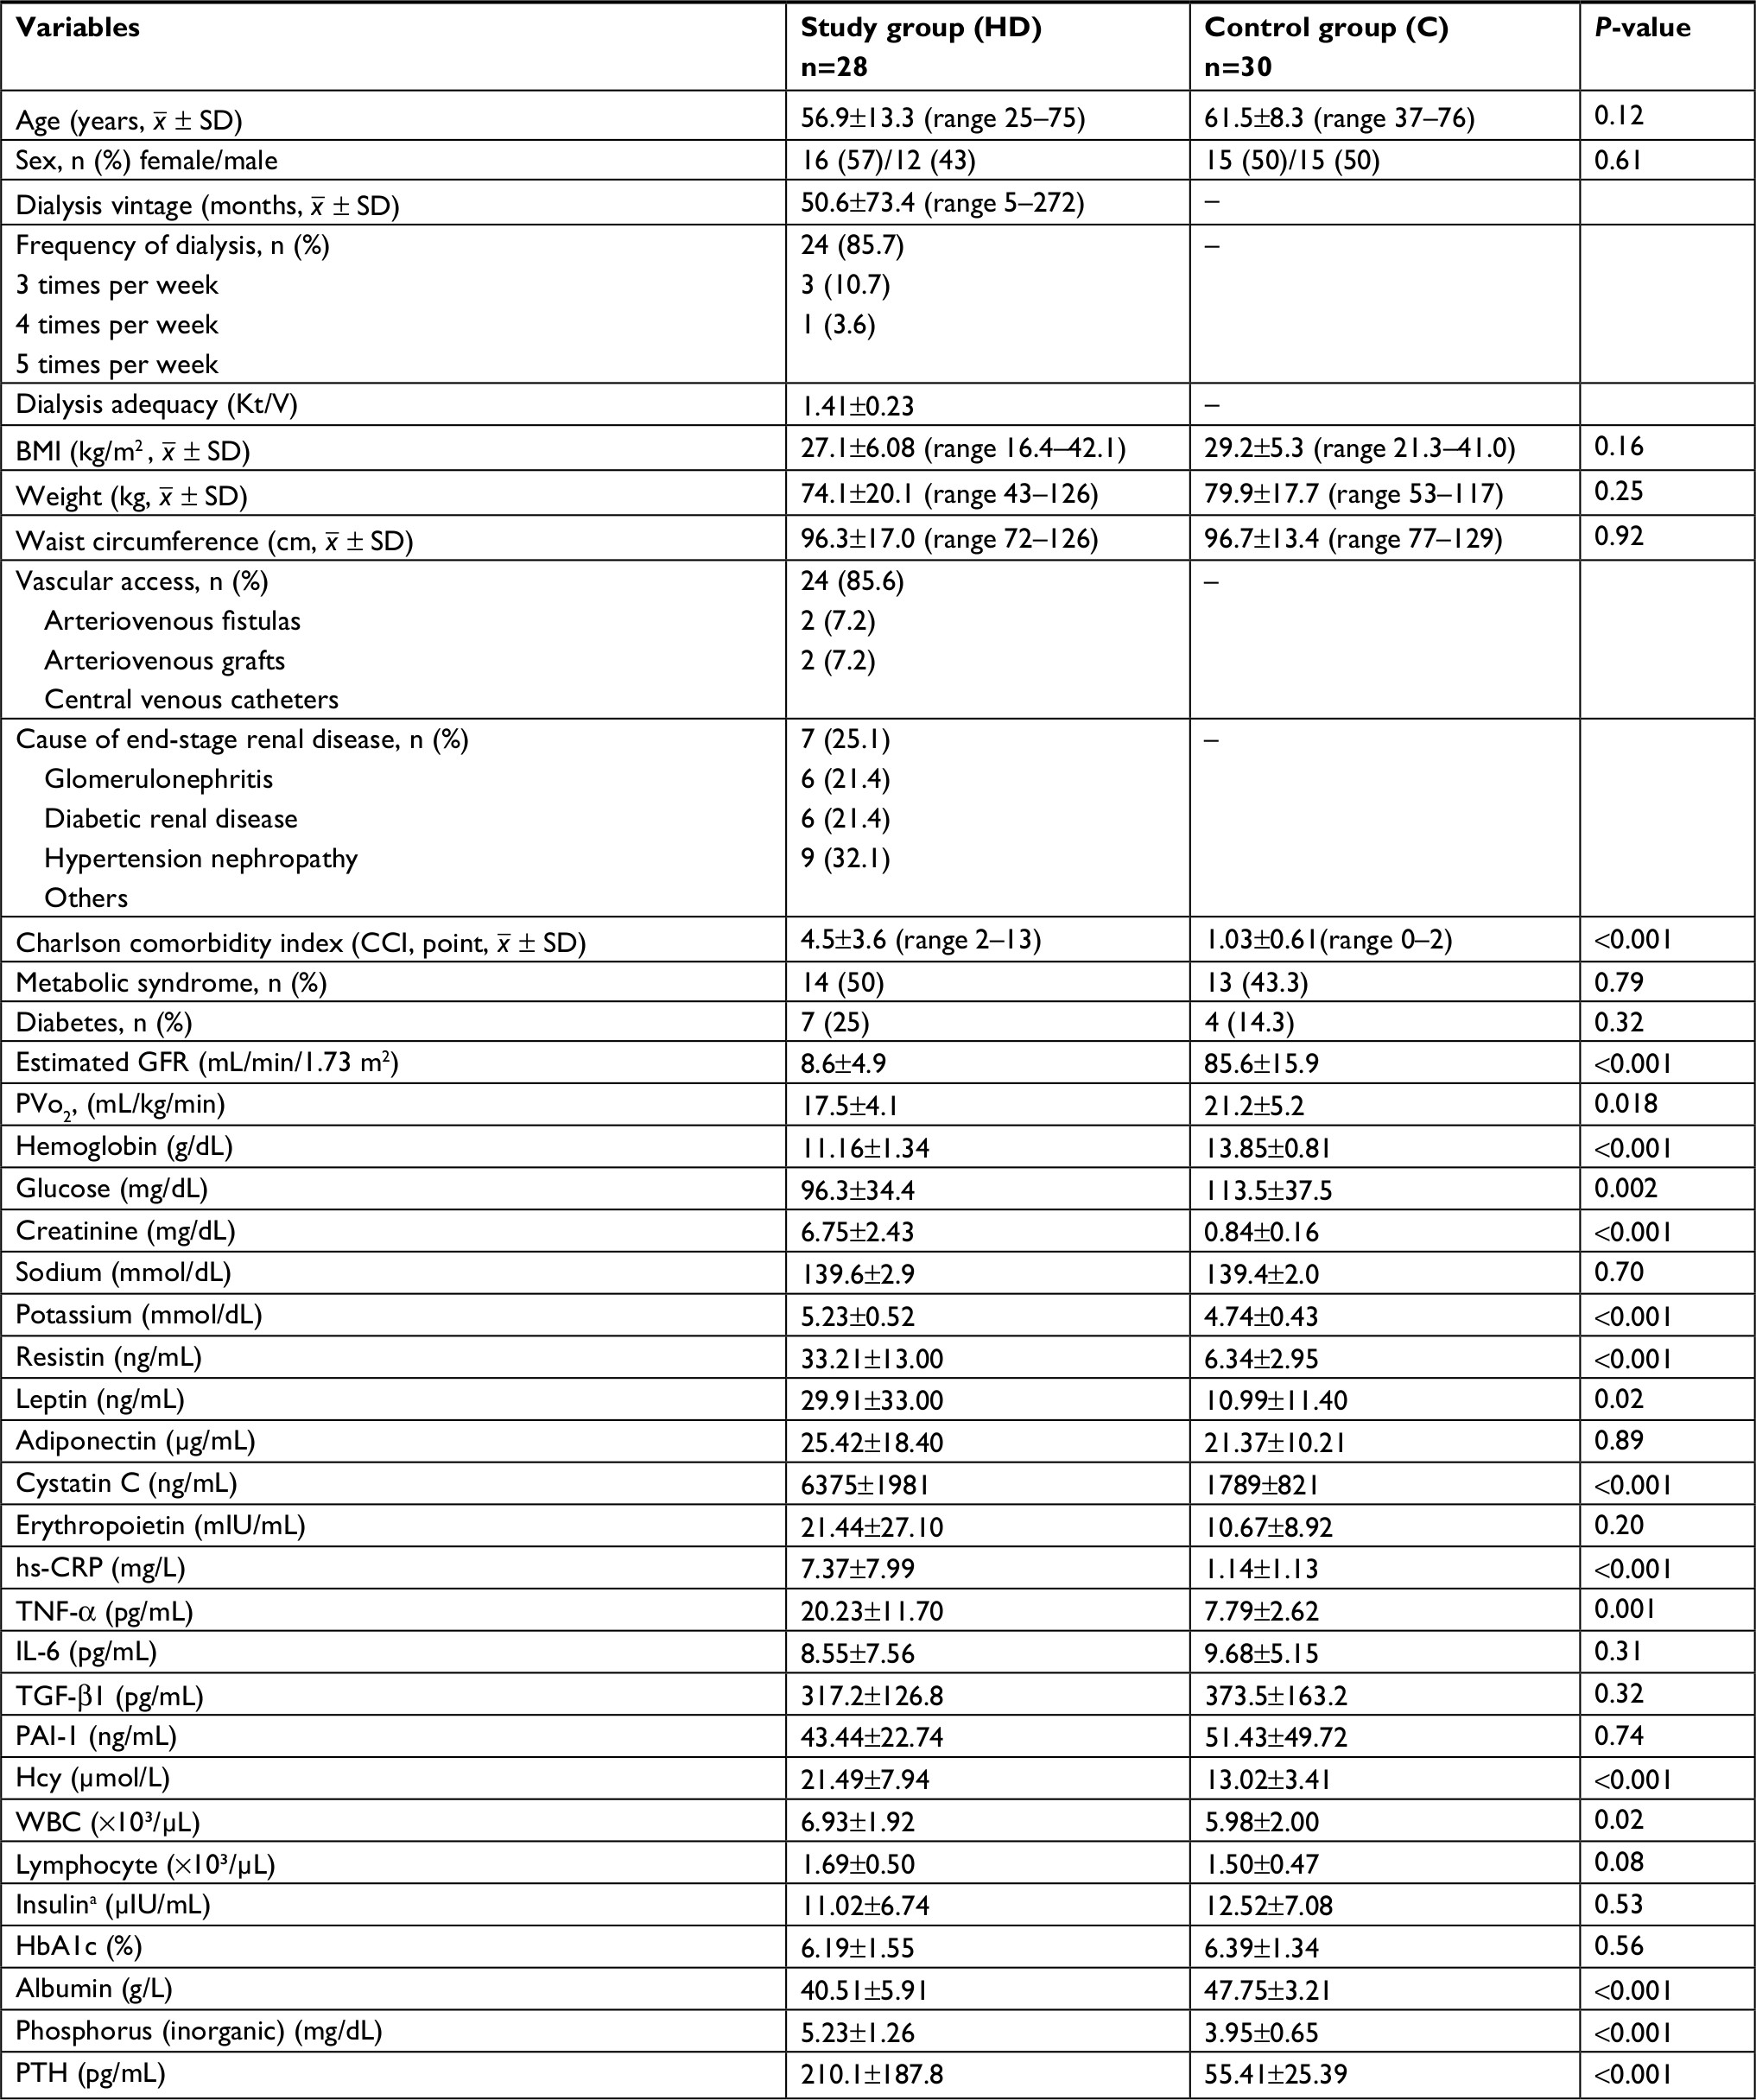 | Table 1 Baseline characteristics of the patients participating in the study (n=58) Note: Results are mean ± SD or percentage; significant at P-value <0.05; asix patients treated with insulin were excluded. Abbreviations: BMI, body mass index; GFR, glomerular filtration rate; HbA1c, glycated hemoglobin; Hcy, homocysteine; IL-6, interleukin-6; PAI-1, plasminogen activator inhibitor-1; PTH, parathyroid hormone; PVo2, peak oxygen uptake; TGF-β1, transforming growth factor beta 1; TNF-α, tumor necrosis factor alpha; WBC, white blood cell; hs-CRP, high-sensitivity C-reactive protein. |
Comparison of HD-MS subgroup and HD-nMS subgroup
HD-MS patients showed significantly higher serum leptin, PAI-1, and phosphorus compared to HD-nMS subgroup (40.23±31.99 vs 19.60±31.78 ng/mL; P=0.01 and 52.24±24.14 vs 34.63±18.01 ng/mL; P=0.04 and 5.55±1.00 vs 4.92±1.45 mg/dL; P=0.049, respectively). HD-MS subgroup to HD-nMS subgroup showed significantly higher HbA1c (6.19±1.55% vs 4.97%±0.80%; P=0.01). Other study parameters did not differ significantly between the subgroups with and without the MS (Table 2).
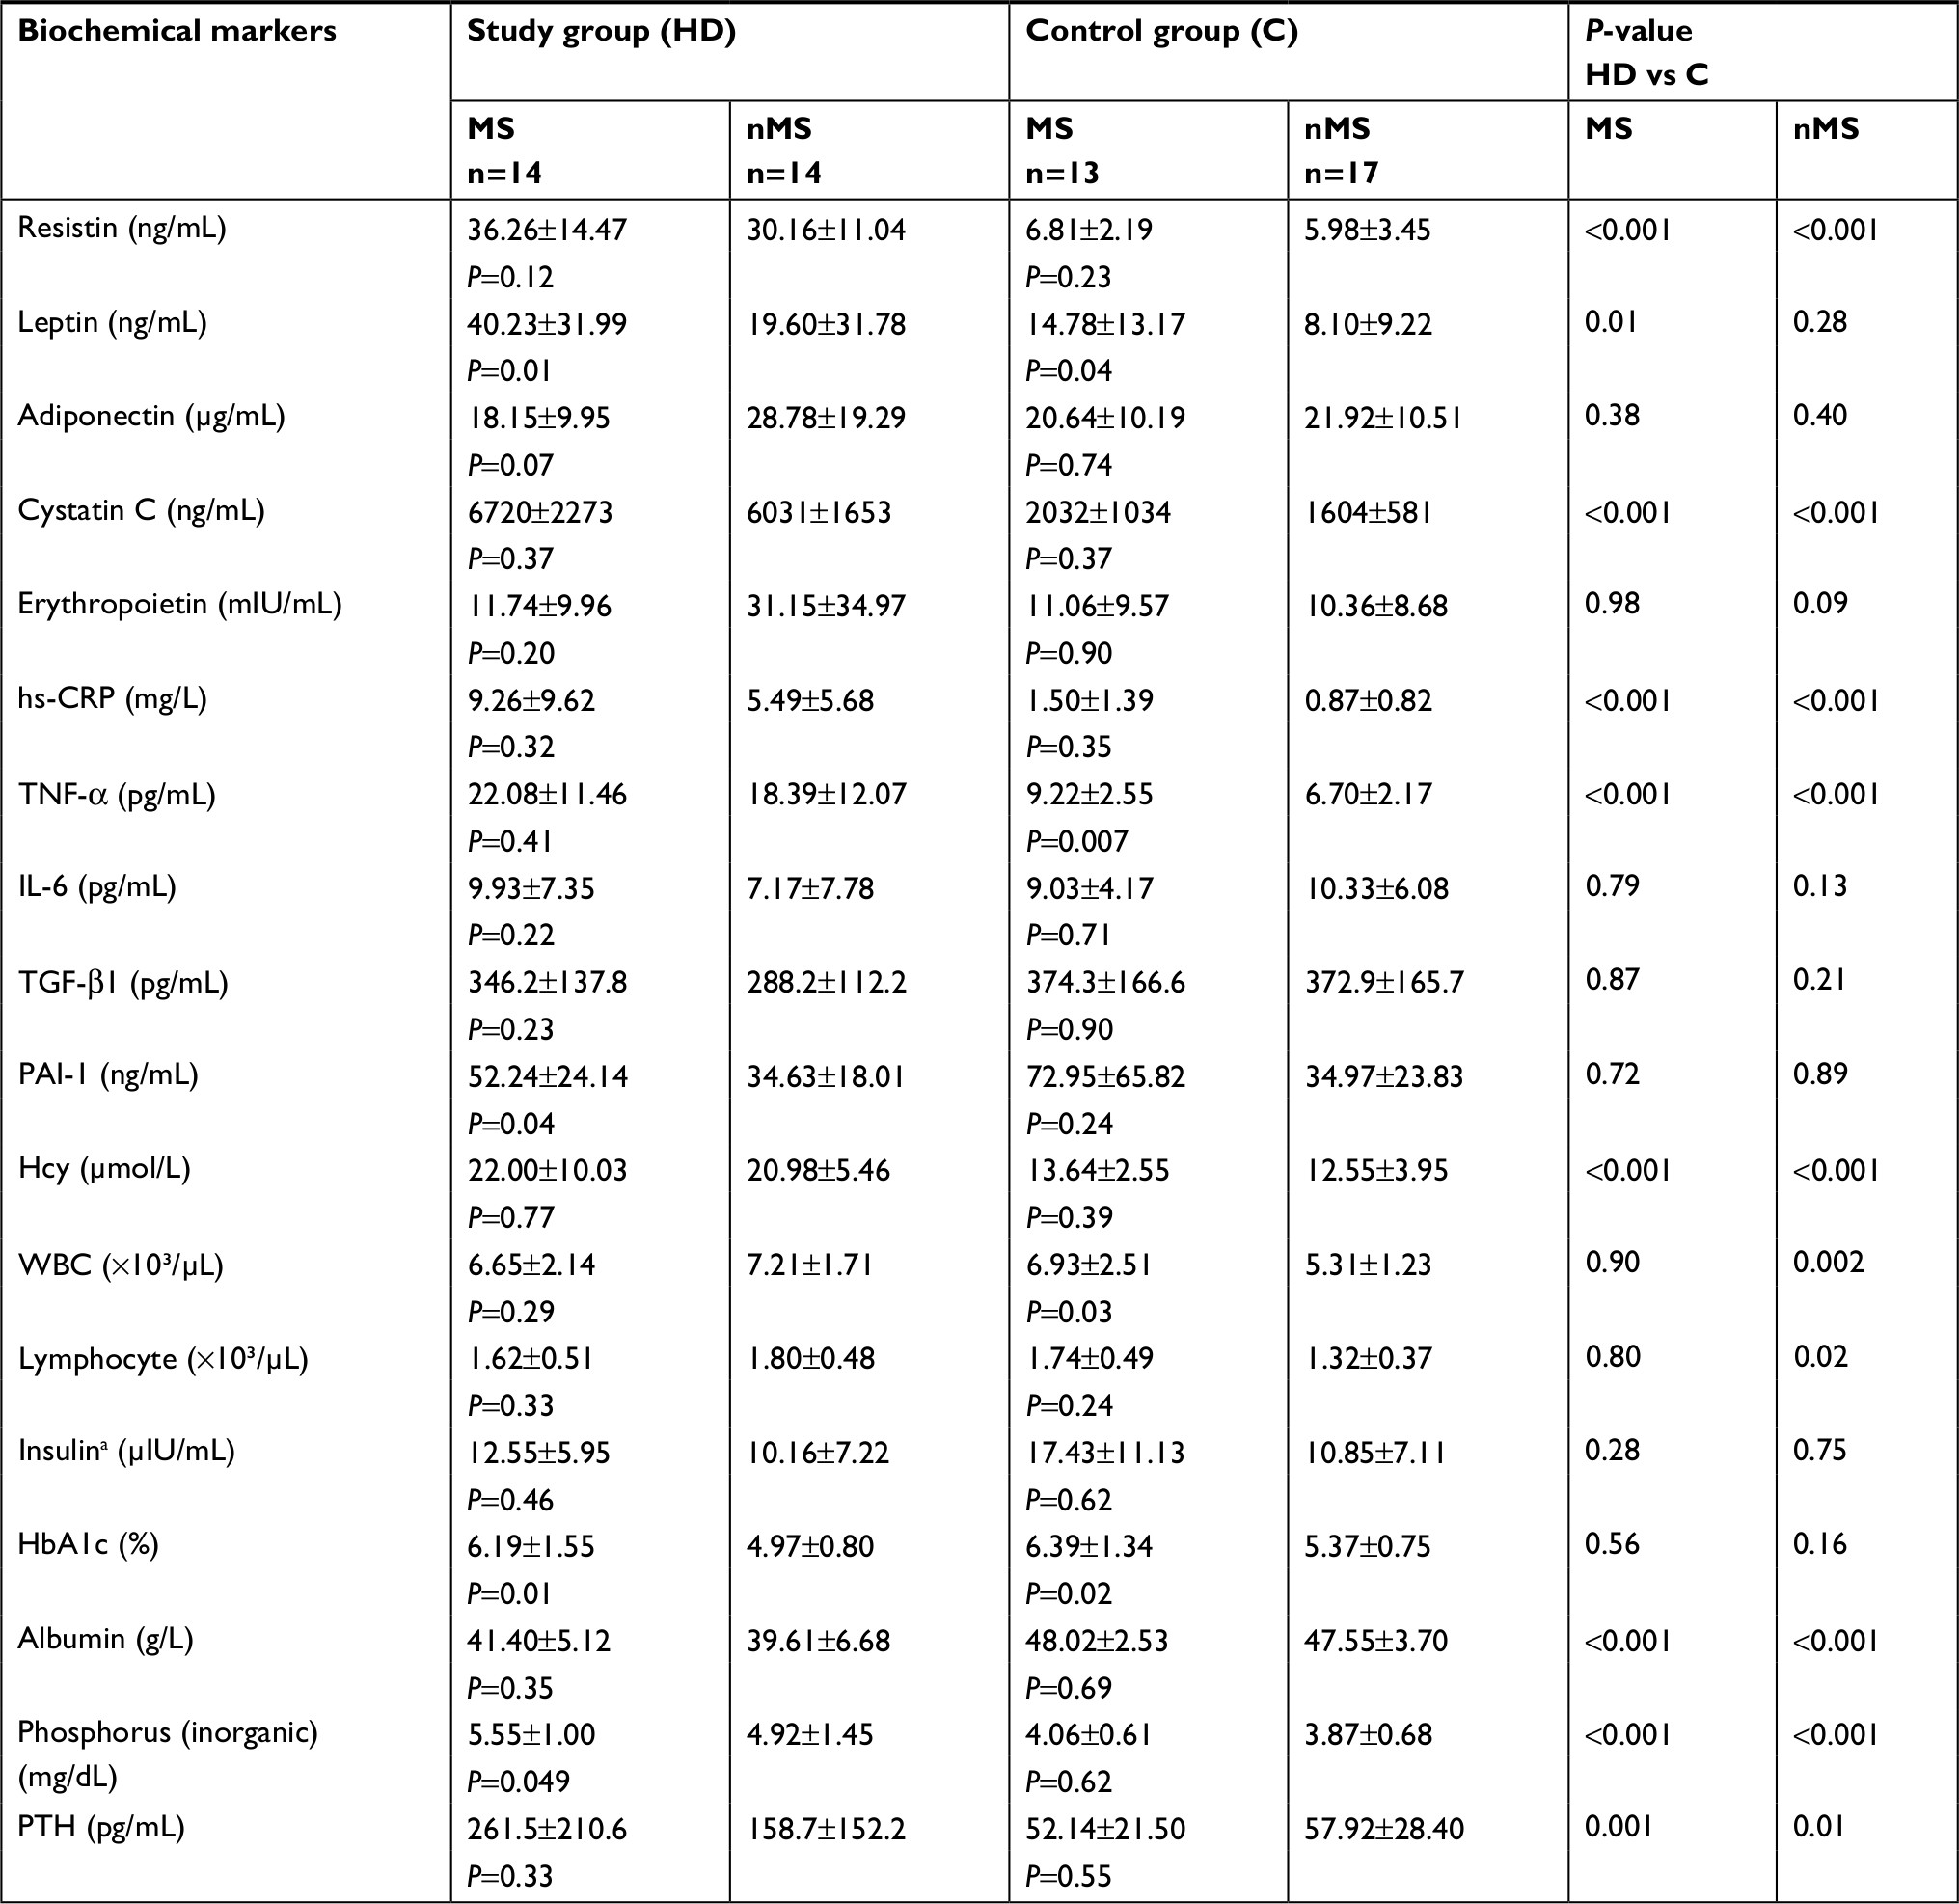 | Table 2 Baseline comparison the biochemical markers in the study group (HD) and control group (C) with the metabolic syndrome (MS) and without the metabolic syndrome (nMS) Note: Results are mean ± SD; significant at P-value <0.05; asix patients treated with insulin were excluded. Abbreviations: HbA1c, glycated hemoglobin; Hcy, homocysteine; IL-6, interleukin-6; nMS, non-metabolic syndrome; PAI-1, plasminogen activator inhibitor-1; PTH, parathyroid hormone; TGF-β1, transforming growth factor beta 1; TNF-α, tumor necrosis factor alpha; WBC, white blood cell; hs-CRP, high-sensitivity C-reactive protein. |
Comparison of C-MS subgroup and C-nMS subgroup
C-MS participants had higher leptin and TNF-α concentrations also number of leucocytes than the C-nMS subgroup (14.78±13.17 vs 8.10±9.22 ng/mL; P=0.04, 9.22±2.55 vs 6.70±2.17 pg/mL; P=0.007, 6.93±2.51 vs 5.31±1.23×10³/µL; P=0.03, respectively). C-MS subgroup compared to C-nMS subgroup showed significantly higher HbA1c (6.39±1.34% vs 5.37±0.75%; P=0.02). Other study parameters did not differ significantly between the subgroups with and without the MS (Table 2).
Comparison of HD group and C group with and without the MS
HD-MS subgroup, compared to C-MS subgroup, showed significantly higher serum concentrations of RES (36.26±14.47 vs 6.81±2.19 ng/mL; P<0.001), cystatin C (6,720±2,273 vs 2,032±1,034 ng/mL; P<0.001), hs-CRP (9.26±9.62 vs 1.50±1.39 mg/L; P<0.001), TNF-α (22.08±11.46 vs 9.22±2.55 pg/mL; P<0.001), Hcy (22.00±10.03 vs 13.64±2.55 µmol/L; P=0.001), phosphorus (5.55±1.00 vs 4.06±0.61 mg/dL; P<0.001), PTH (261.5±210.6 vs 52.14±21.50 pg/mL; P=0.001). Similar differences were demonstrated between HD-nMS patients and C-nMS subgroup, that is, elevated RES (30.16±11.04 vs 5.98±3.45 ng/mL; P<0.001), cystatin C (6031±1,653 vs 1,604±581 ng/mL; P<0.001), hs-CRP (5.49±5.68 vs 0.87±0.82 mg/L; P<0.001), TNF-α (18.39±12.07 vs 6.70±2.17 pg/mL; P<0.001), Hcy (20.98±5.46 vs 12.55±3.95; P<0.001), phosphorus (4.92±1.45 vs 3.87±0.68 mg/dL; P<0.001), PTH (158.7±152.2 vs 57.92±28.40 pg/mL; P=0.01). Serum leptin concentration was significantly higher in HD-MS patients compared to C-MS subgroup (40.23±31.99 vs 14.78±13.17 ng/mL; P=0.01) while no significant differences were found between HD-nMS vs C-nMS. Total white cell and lymphocyte counts were significantly higher in HD-nMS patients compared to C-nMS subgroup (7.21±1.71 vs 5.31±1.23×10³/µL; P=0.002 and 1.80±0.48 vs 1.32±0.37×10³/µL; P=0.02, respectively). Irrespective of the presence or absence of the MS, serum albumin concentrations were lower in HD group compared to group C (41.40±5.12 vs 48.02±2.53 g/L; P<0.001 and 39.61±6.68 vs 47.55±3.70 g/L; P<0.001, respectively). Other study parameters did not differ significantly between dialyzed patients and individuals with normal renal function (Table 2).
Effect of rehabilitation program on the study parameters
As compared to pre-exercise levels, elevation of serum RES was observed in HD-nMS patients at the day next to the program completion (30.16±11.04 vs 34.22±8.89 ng/mL; P=0.046) while no change was observed in HD-MS patients. Serum RES remained unchanged in the C-nMS subgroup while non-significant reduction (6.81±2.19 vs 6.26±1.91 ng/mL; P=0.07) in C-MS individuals was observed. Non-significant reduction of cystatin C concentrations (6,720±2,273 vs 5,780±2,054 ng/mL; P=0.098) and elevation of insulin concentrations (12.55±5.95 vs 18.10±8.88 µIU/mL; P=0.049) in HD-MS patients was observed (Table 3).
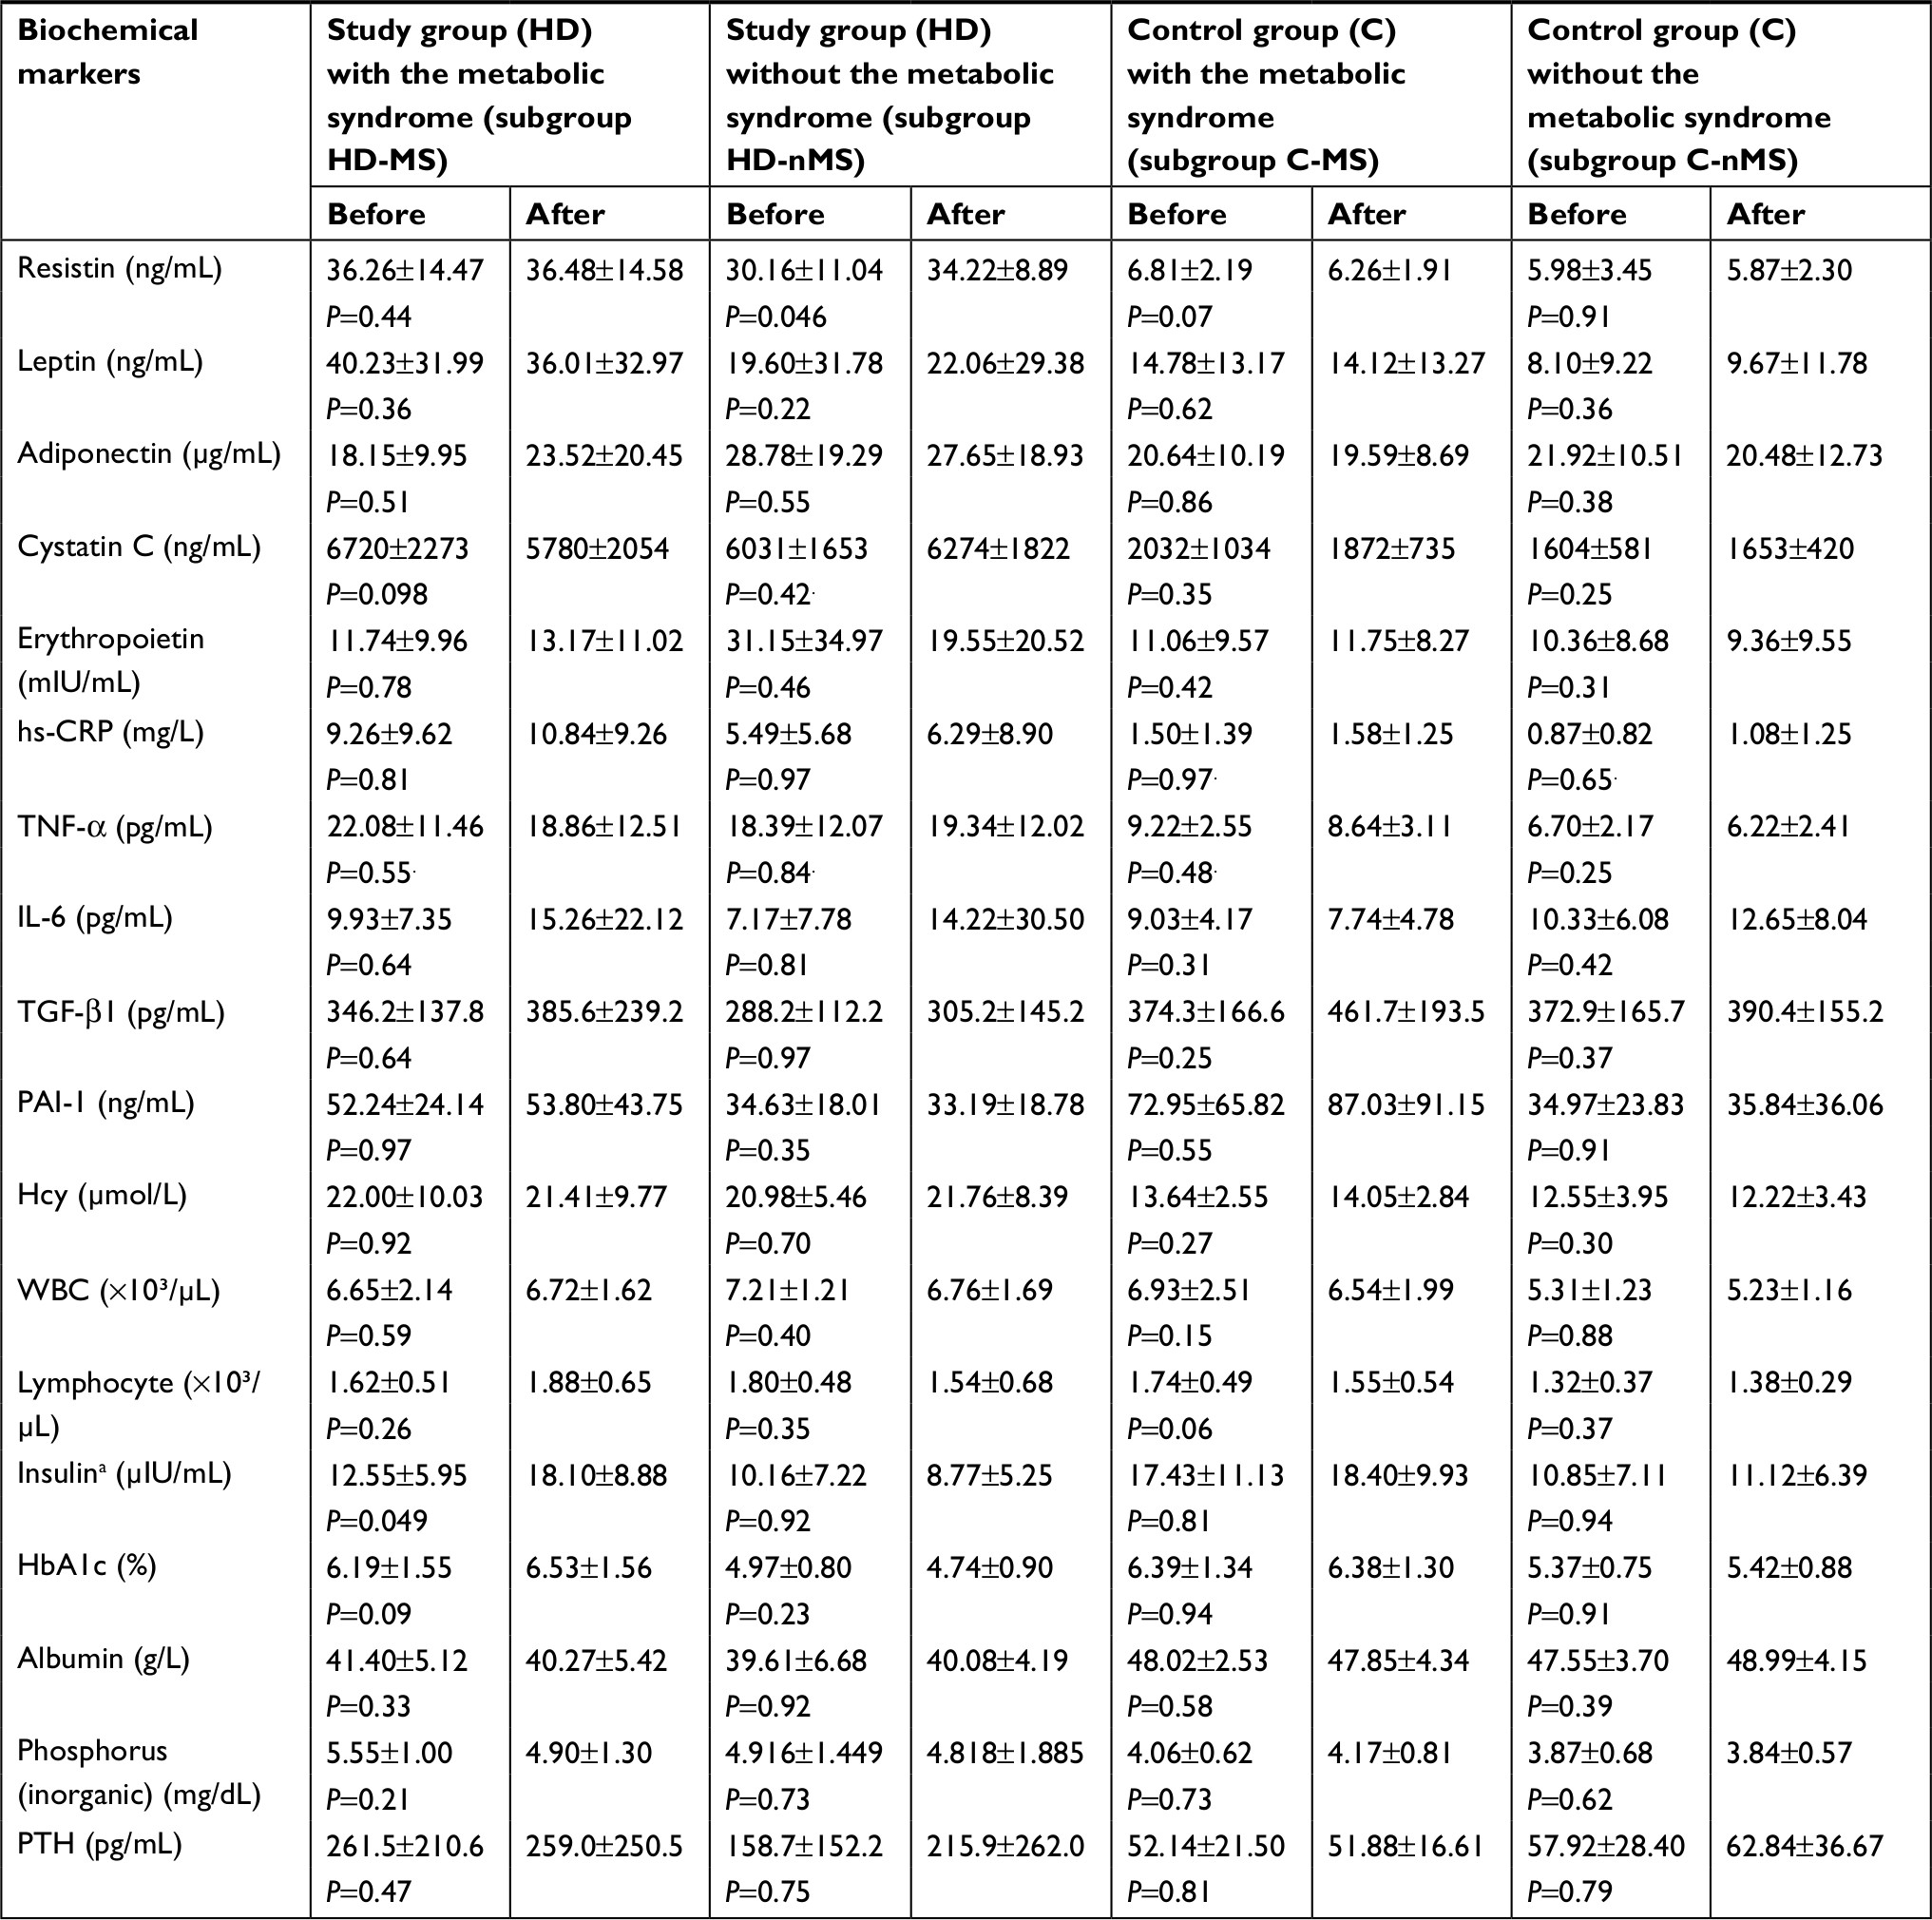 | Table 3 Comparison of the biochemical markers before and after the rehabilitation program Note: Results are mean ± SD; significant at P-value <0.05; asix patients treated with insulin were excluded. Abbreviations: HbA1c, glycated hemoglobin; Hcy, homocysteine; IL-6, interleukin-6; nMS, non-metabolic syndrome; PAI-1, plasminogen activator inhibitor-1; PTH, parathyroid hormone; TGF-β1, transforming growth factor beta 1; TNF-α, tumor necrosis factor alpha; WBC, white blood cell; hs-CRP, high-sensitivity C-reactive protein. |
Post-intervention changes in the concentrations of other cytokines and hormones in the HD and C groups did not reach the level of statistical significance.
RES correlations
Correlation between RES and albumin concentrations
HD group showed correlation between serum albumin and RES concentrations. Pre-exercise correlation was statistically significant in HD-MS patients (R=0.58; P=0.03) and non-significant in HD-nMS patients (R=0.49; P=0.07). Following the 4-week program of regular physical exercise, the correlation in HD-MS patients was no longer statistically significant (R=0.26; P=0.37) while the correlation between RES and albumin became significant in HD-nMS patients (R=0.69; P=0.007). Group C demonstrated no correlation between serum albumin and RES concentrations, regardless of the presence or absence of the MS (Figures 2 and 3).
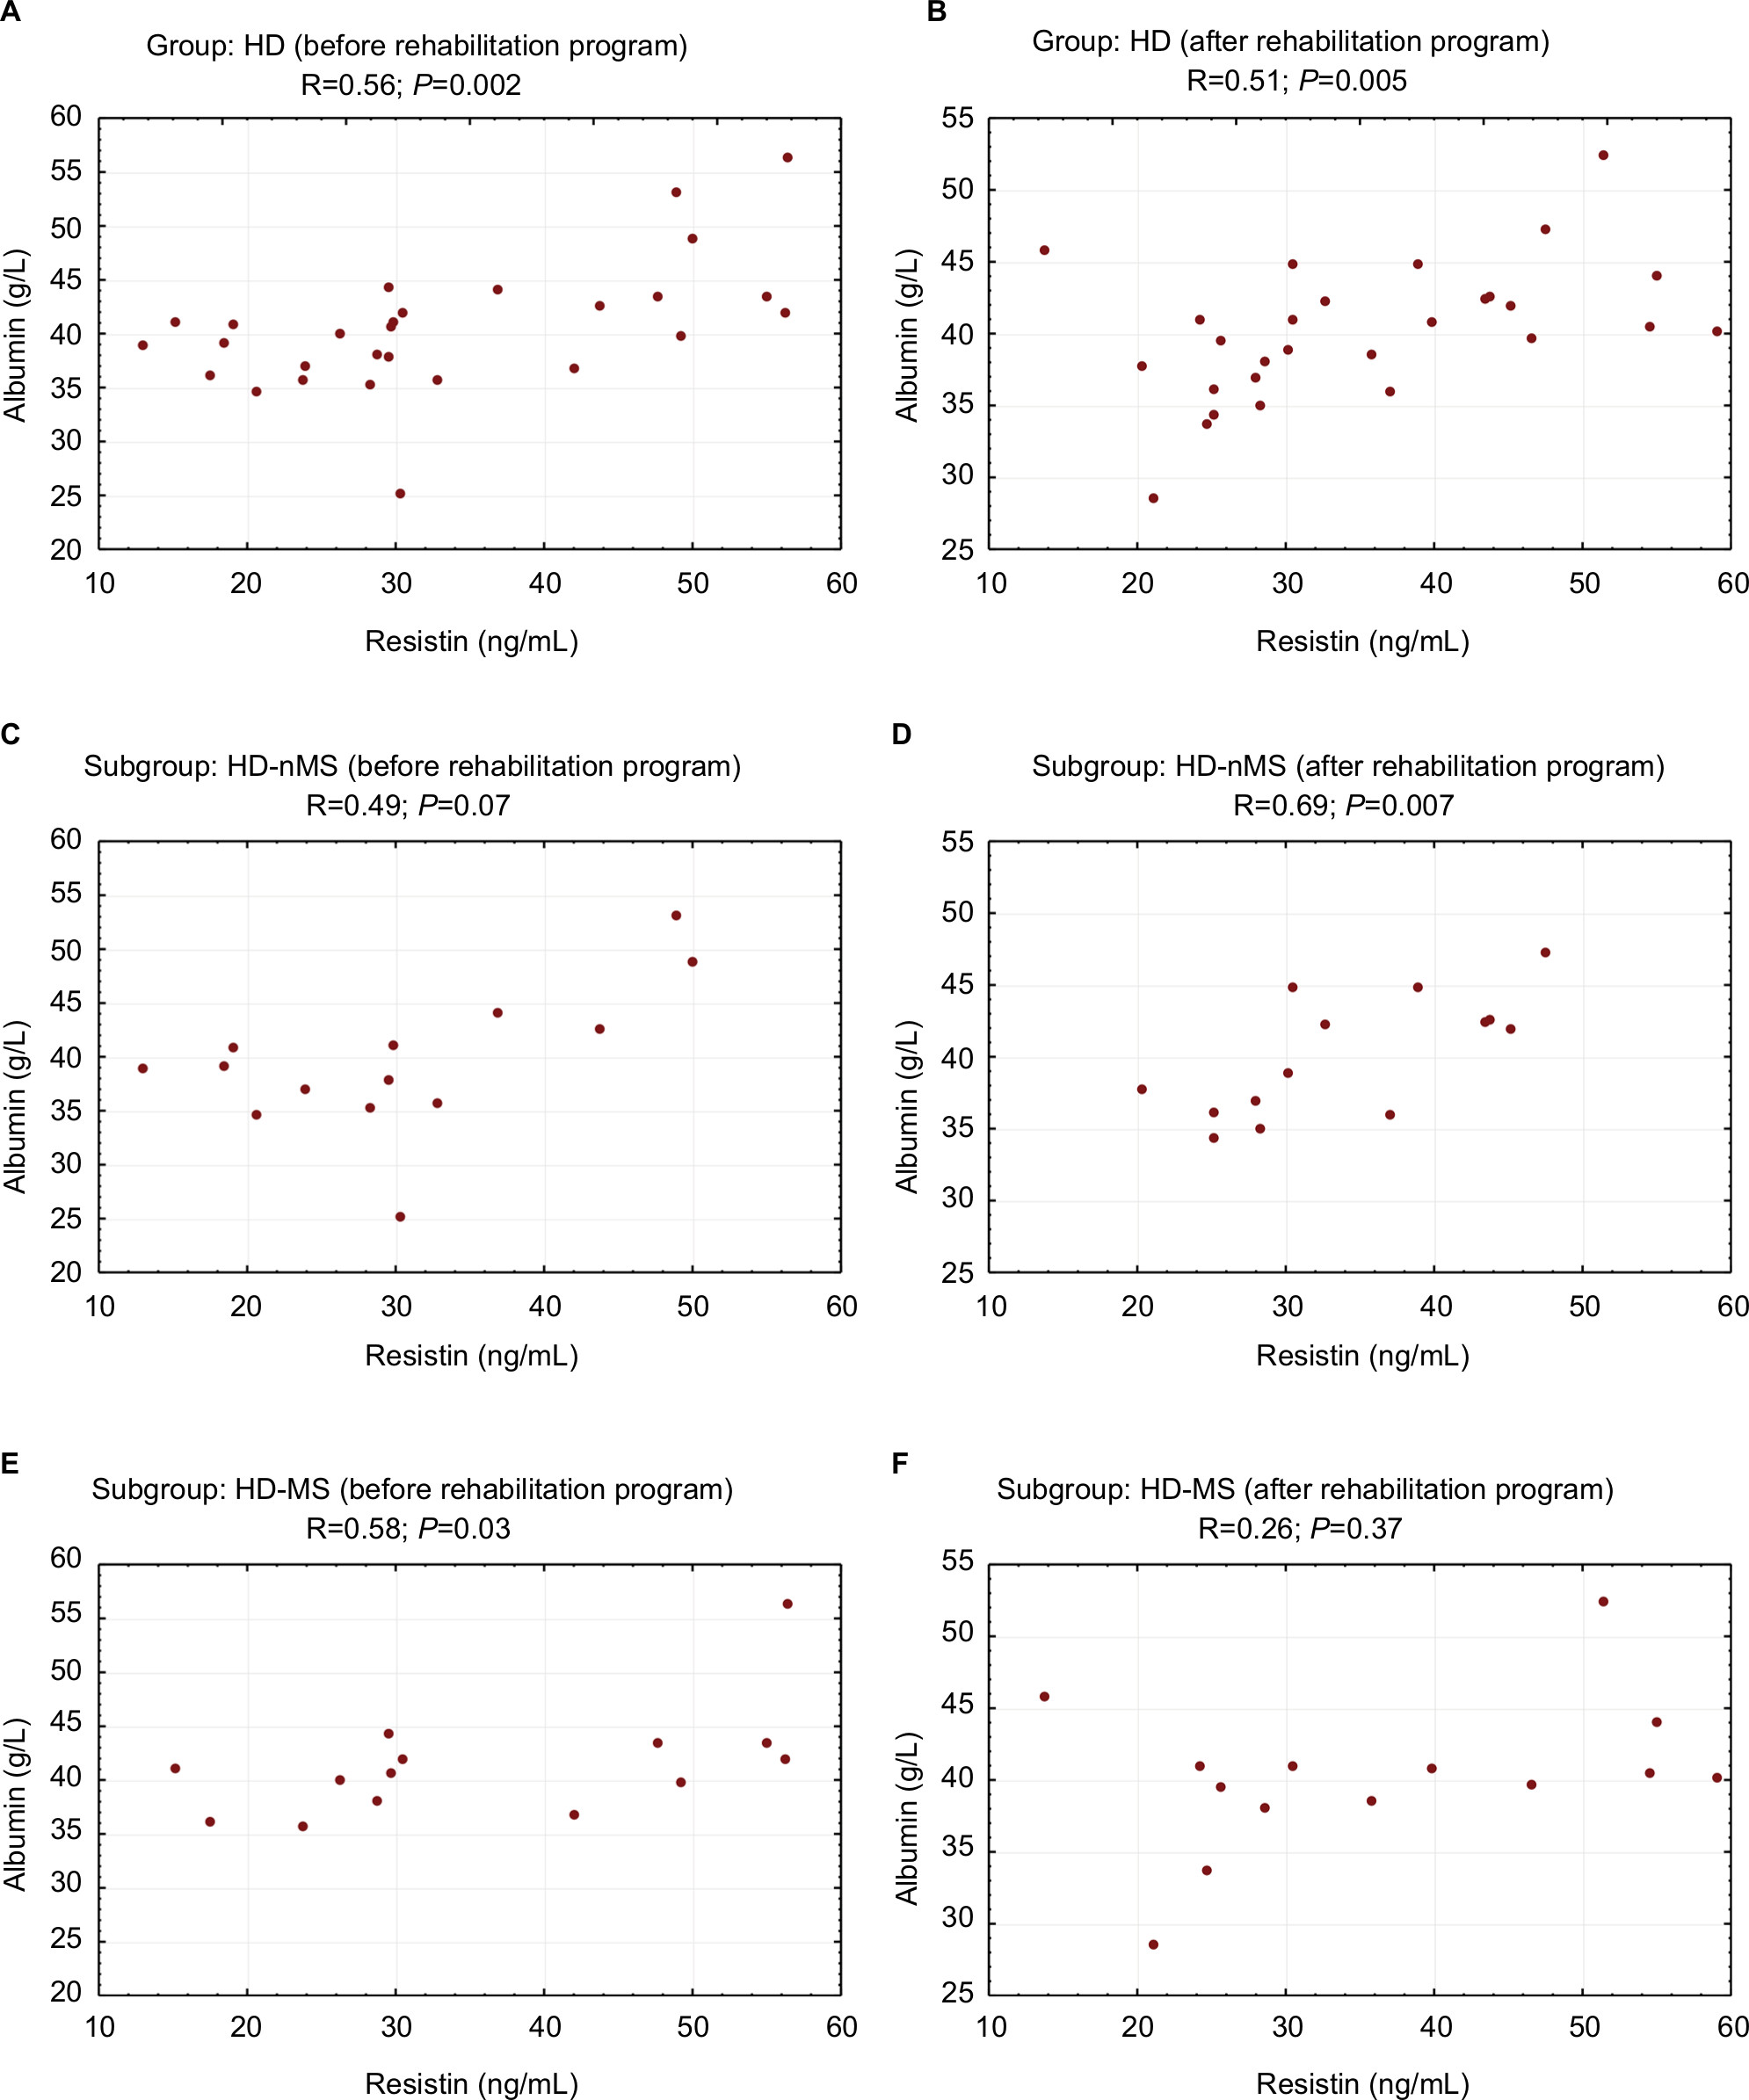 | Figure 2 Correlation between resistin and albumin concentrations before and after the rehabilitation program (study group). Notes: (A) Dialyzed patients before rehabilitation program, (B) dialyzed patients after rehabilitation program, (C) dialyzed patients without the metabolic syndrome before rehabilitation program, (D) dialyzed patients without the metabolic syndrome after rehabilitation program, (E) dialyzed patients with the metabolic syndrome before rehabilitation program, and (F) dialyzed patients with the metabolic syndrome after rehabilitation program. Abbreviations: HD, hemodialyzed; MS, metabolic syndrome; nMS, non-metabolic syndrome. |
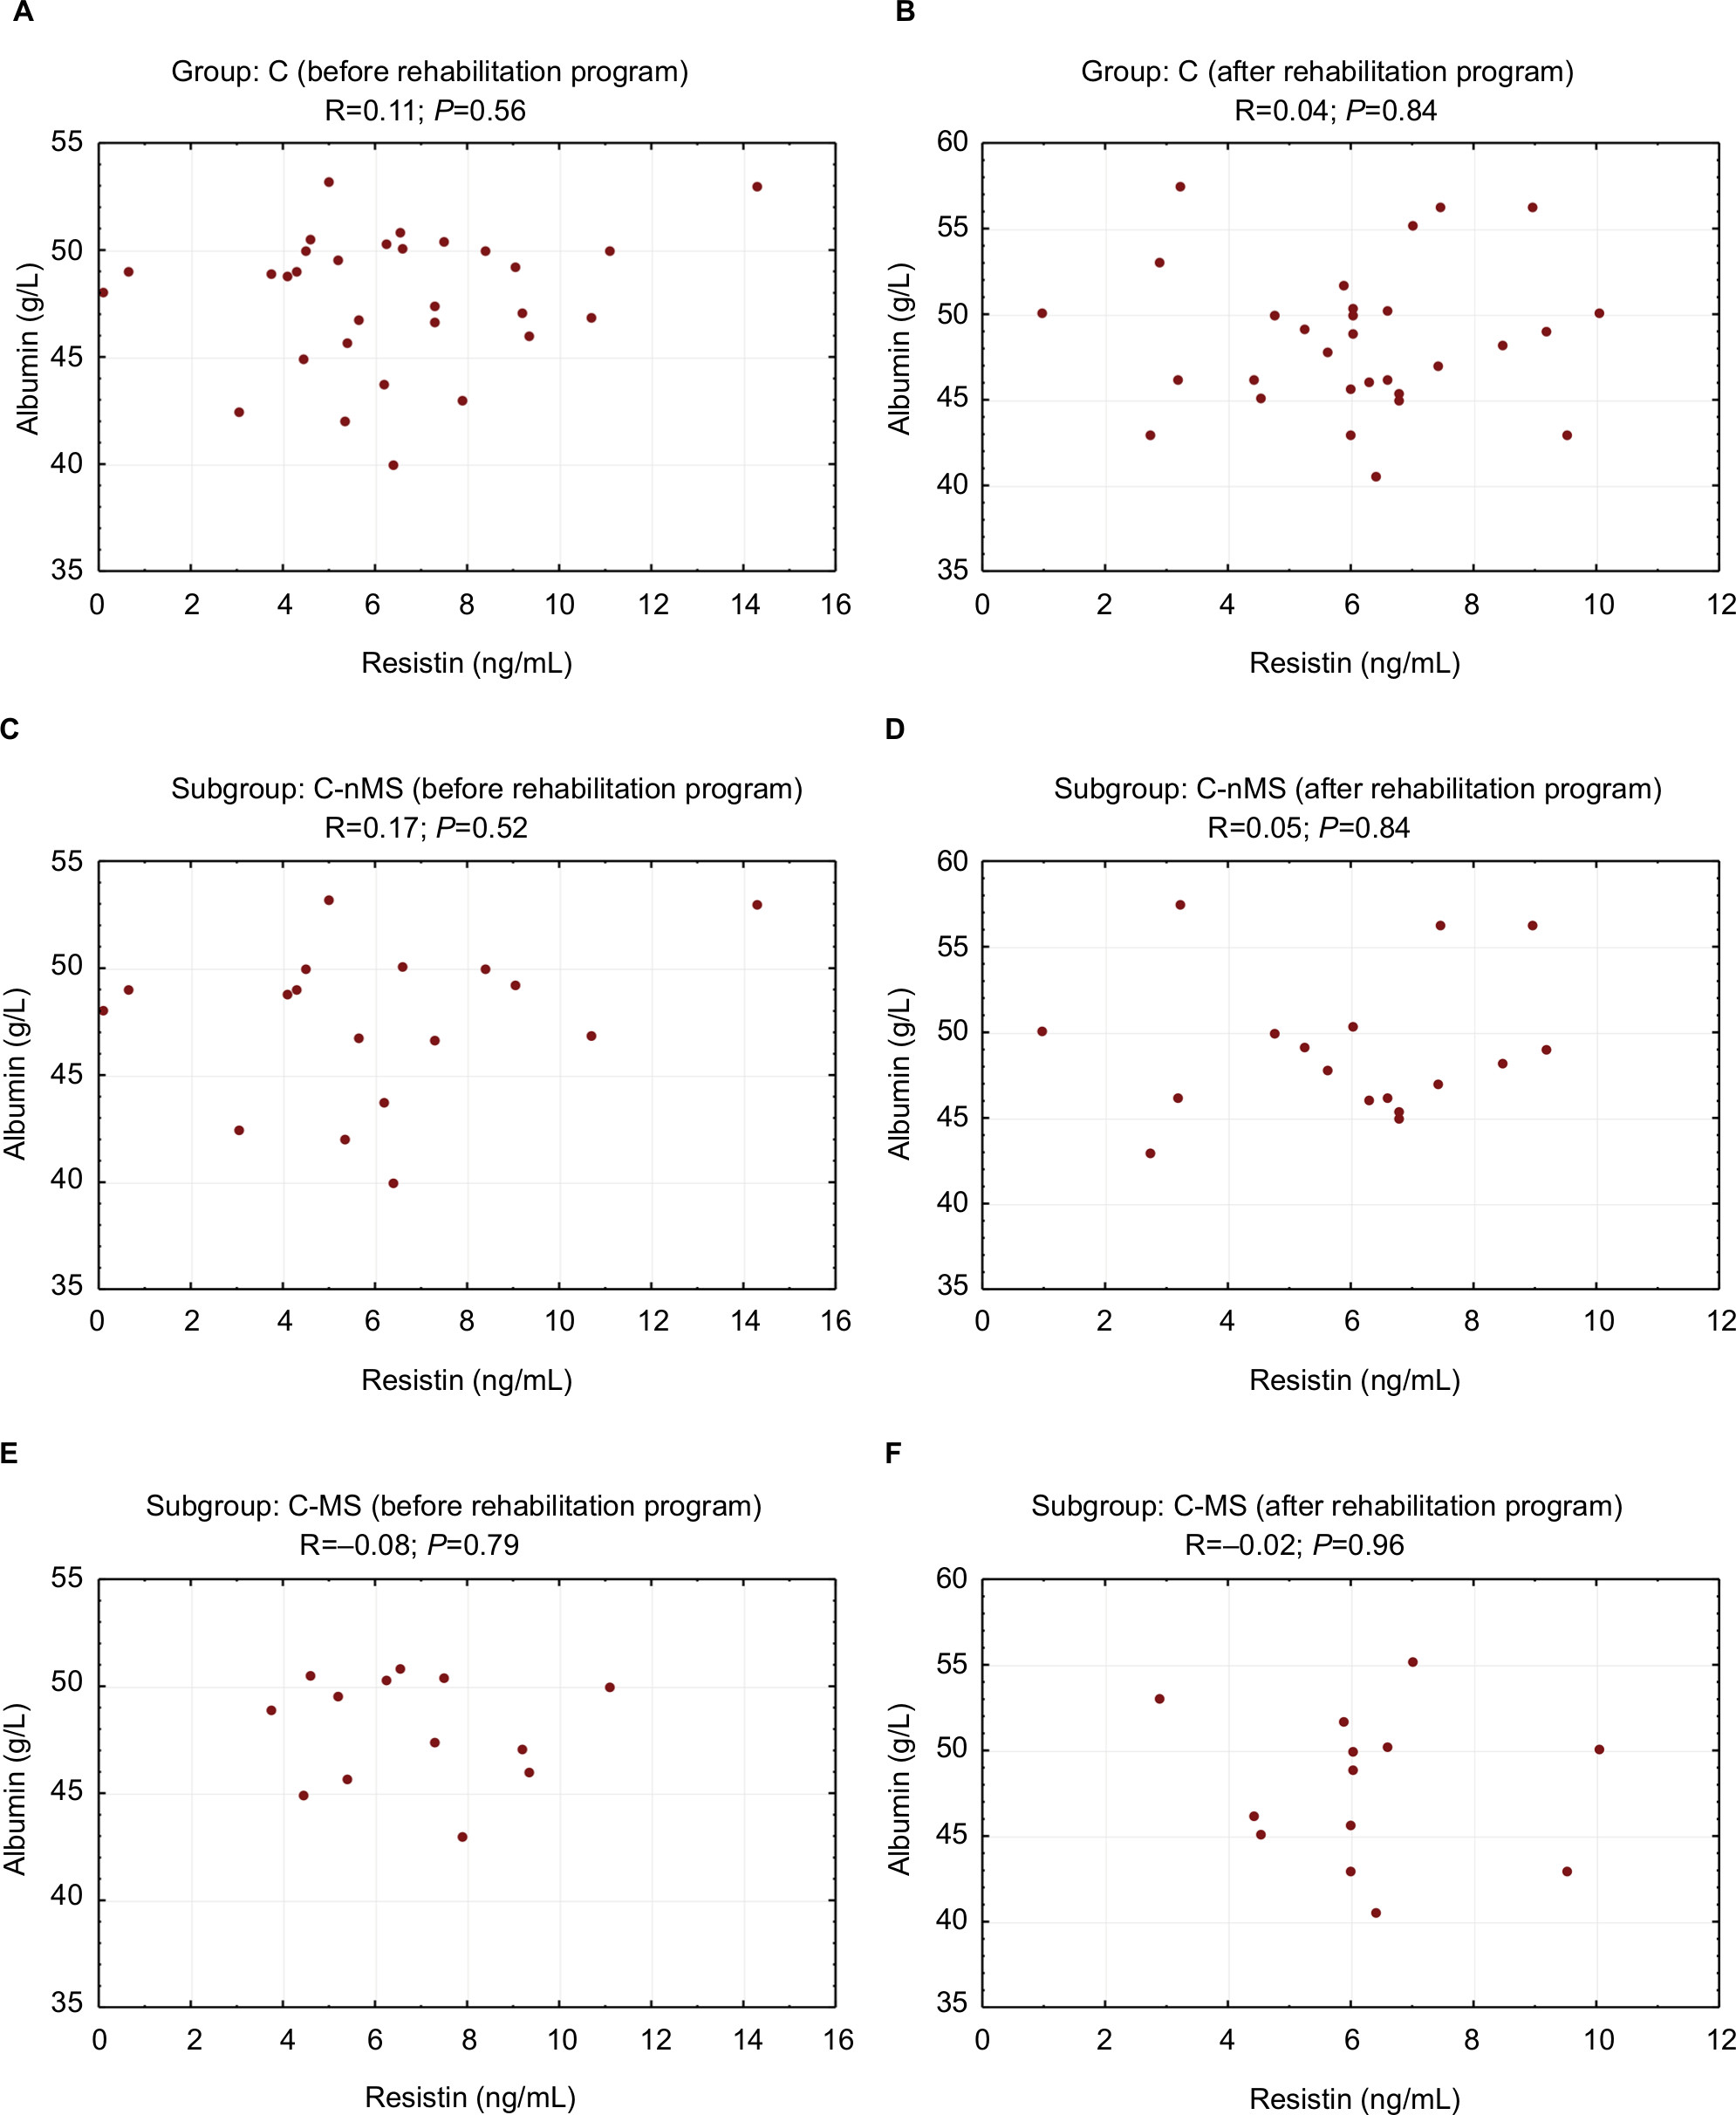 | Figure 3 Correlation between resistin and albumin concentrations before and after the rehabilitation program (control group). Notes: (A) individuals with normal renal function before rehabilitation program, (B) individuals with normal renal function after rehabilitation program, (C) individuals with normal renal function without the metabolic syndrome before rehabilitation program, (D) individuals with normal renal function without the metabolic syndrome after rehabilitation program, (E) individuals with normal renal function and the metabolic syndrome before rehabilitation program, (F) individuals with normal renal function and the metabolic syndrome after rehabilitation program. Abbreviations: C, control group; MS, metabolic syndrome; nMS, non-metabolic syndrome. |
Correlation between RES and insulin concentrations and HOMA-IR
Before the program, HD-nMS patients showed a significant negative correlation between RES and insulin concentrations (R=−0.66; P=0.01) as well as between RES and HOMA-IR (R=−0.68; P=0.007). After the completion of the rehabilitation program, no significant correlations were noted between RES and insulin or HOMA-IR in HD-nMS patients (Table 4).
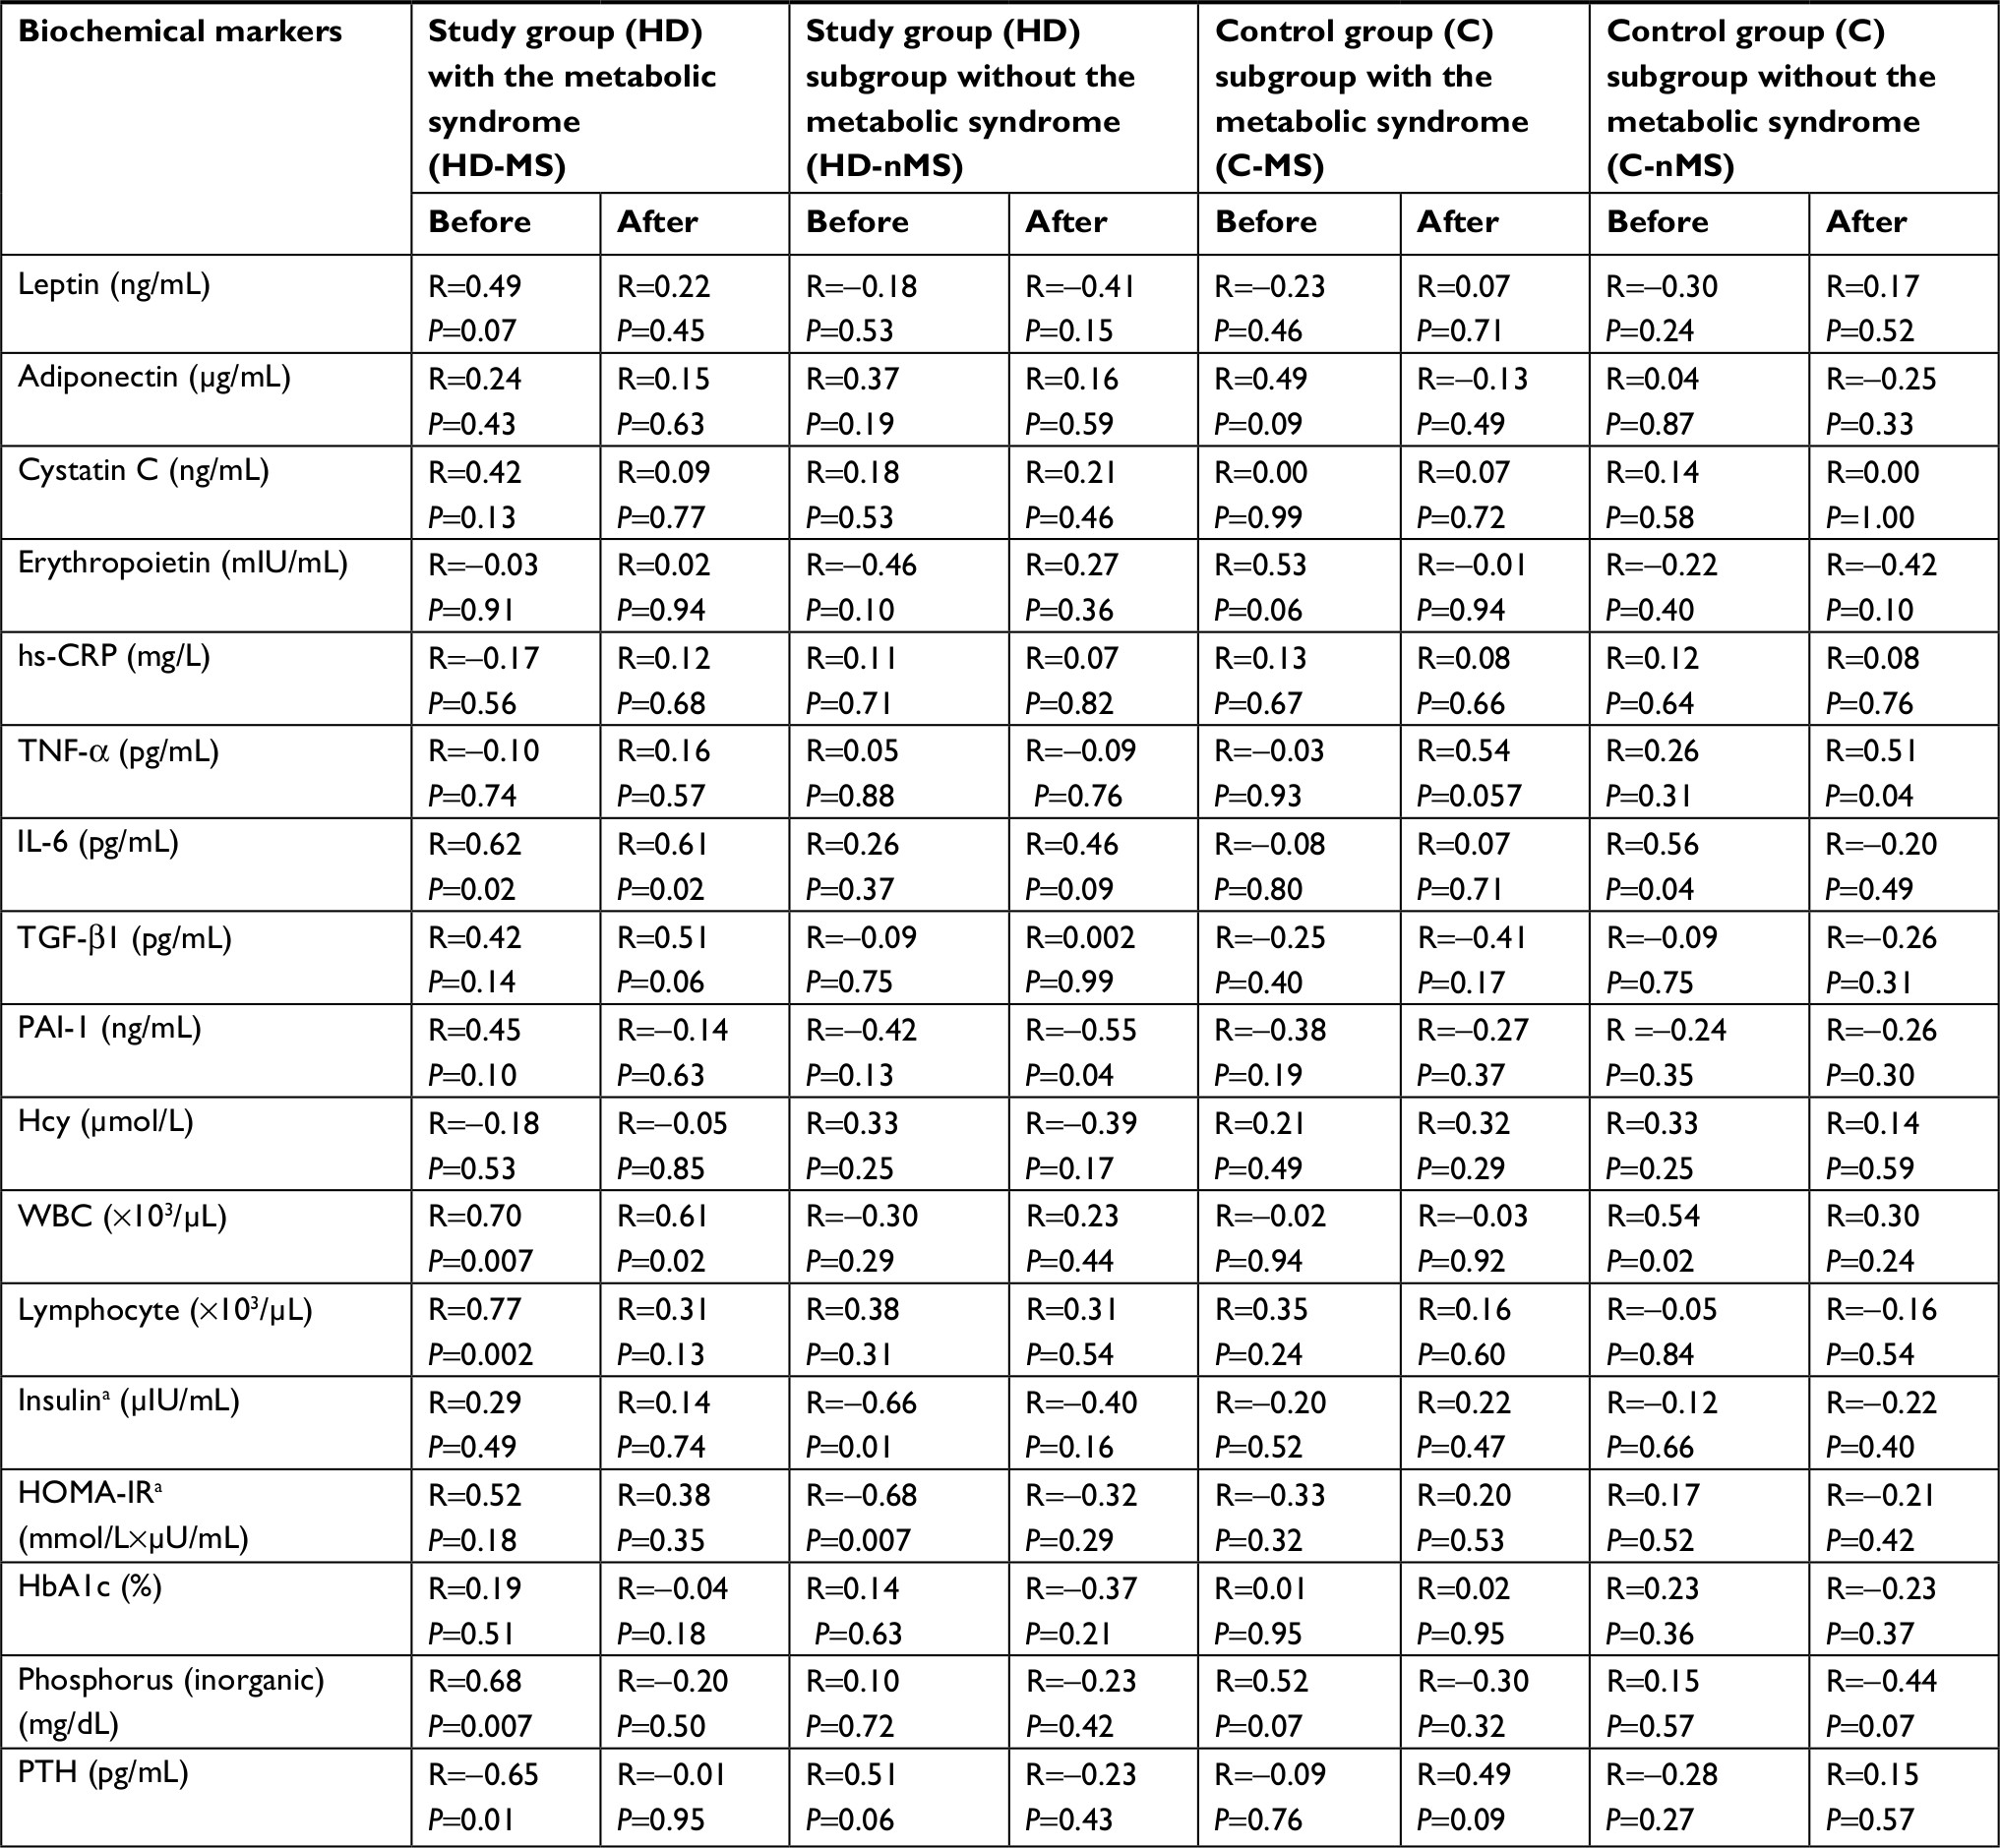 | Table 4 Correlation between serum resistin and biochemical markers before and after the rehabilitation program Note: R, Spearman’s rank correlation coefficient, significant at P-value <0.05; asix patients treated with insulin were excluded. Abbreviations: HOMA-IR, Homoeostatic model assessment index ([plasma glucose level, mmol/L × plasma insulin level, µIU/mL]/22.5); HbA1c, glycated hemoglobin; Hcy, homocysteine; IL-6, Interleukin-6; nMS, non-metabolic syndrome; PAI-1, plasminogen activator inhibitor-1; PTH, parathyroid hormone; TGF-β1, transforming growth factor beta 1; TNF-α, tumor necrosis factor alpha; WBC, white blood cell; hs-CRP, high-sensitivity C-reactive protein. |
No significant pre- or post-rehabilitation program correlations were found in HD-MS patients and group C.
Other correlations
In HD-MS, the pre-rehabilitation program positive correlation between RES and leptin concentrations was non-significant (R=0.49; P=0.07) while the correlation between RES and IL-6 was significant (R=0.62; P=0.02). The same group also showed significant positive correlations between RES and the leukocyte (R=0.70; P=0.007) and lymphocyte (R=0.77; P=0.002) counts as well as between RES and phosphorous concentration (R=0.68; P=0.007) (Table 4).
Following the rehabilitation program, HD-MS patients still showed a positive and significant correlation between RES and IL-6 concentrations (R=0.61; P=0.02) and the leukocyte count (R=0.61; P=0.02) while correlation between RES and the lymphocyte count and phosphorous was no longer significant.
No significant correlations were observed between these parameters in HD-nMS.
Negative correlation between RES and PTH concentrations was observed in HD-MS patients before the exercise program (R=−0.65; P=0.01). No such correlation was revealed following the completion of the program.
HD-nMS patients showed negative significant correlation between RES and PAI-1 concentrations after physical exercise program (R=−0.55; P=0.04). No correlation between serum RES and these parameters was observed before and after physical exercise in HD-MS subgroup.
C-nMS participants showed a positive pre-rehabilitation program correlation between serum RES and the leukocyte count (R=0.54; P=0.02) as well as between RES and IL-6 (R=0.56; P=0.04). In the C-nMS subgroup, a positive correlation was observed between RES and TNF-α concentrations (R=0.51; P=0.04) post-rehabilitation program. Other correlations were not significant.
Discussion
This study is the first one to evaluate the influence of a supervised rehabilitation program on a range of serum hormones and cytokines including RES in HD patients with respect to the diagnosis of MS. Our results confirm previous observations2,6,7 that uremic patients have elevated concentrations of this adipokine. The MS had no significant impact on RES concentrations in individuals with normal renal function and those with renal failure. However, we found an unexpected RES increase in dialyzed patients without the MS following 4-week rehabilitation program, contrary to dialyzed patients with MS and to the control group. Apart from the fact that it needs confirmation in further studies and that it could be a result of a pre-analytical or laboratory error, a possible explanation of this observation would be expected. It has been demonstrated that contracting muscles increase the production of IL-6 and, in consequence, its concentration in the serum.40,41 On the other hand, it was observed that IL-6 can stimulate the secretion of RES.42 In our study, we observed a non-significant IL-6 concentrations increase after physical exercise in HD-MS patients and HD-nMS patients and we also observed significant correlations between IL-6 and RES (only in patients with the MS). In patients without the MS, there is only a tendency for such correlation after physical exercise program. Therefore, it cannot be excluded that the observed RES increase immediately after completion of the rehabilitation program was associated with the influence of IL-6 on RES production in patients with diminished clearance of these cytokines which are poorly removed during hemodialysis. Unfortunately, we were unable to determine a delayed effect of the rehabilitation program on the RES concentration. RES elevation following the rehabilitation program in dialyzed patients may not be considered explicit unfavorable due to the phenomenon of reverse epidemiology in the dialyzed patients. A hypothesis suggesting a favorable change might be supported by a positive correlation between RES and albumin concentrations and negative correlation between concentrations of RES and plasminogen activator (PAI-1). Albumin concentration is an important index of nutritional status, a negative inflammatory marker, and one of the major negative predictors of mortality in dialyzed patients. Hence, it might suggest that changes in RES concentrations parallel to albumin concentration change reflect beneficial metabolic effect. However, this assumption is contrary to observations of Kaynar et al43 who demonstrated positive correlation between the degree of protein-energy malnutrition and RES and adiponectin concentrations. On the other hand, a hypothesis suggesting beneficial effect of serum RES elevation in HD-nMS patients seems to be supported by a negative correlation between concentrations of this cytokine and PAI-1 which is a well-defined cardiovascular risk factor.44 The correlations specified above allow no explicit definition of a cause–effect relationship between the study parameters as they merely indicate the existence of some relationship. A suggestion that RES elevation might have beneficial effects has been rejected by other authors32 who demonstrated a decrease in serum RES in individuals with normal renal function after exercise training intervention. The present study failed to confirm such relationship which might have been caused by a small study sample. The physiological and pathophysiological roles of RES remain unclear. Numerous authors have emphasized its association with the inflammatory condition.45–47 However, only few studies demonstrated a direct relationship between RES concentrations and clinical manifestations of inflammation. Some reports indicate that both high and low RES concentrations were predictors of frequent hospitalization. There are some reports indicating that low RES concentrations are associated with the need for more frequent hospitalization of HD patients. Thus, this relationship may not be linear but U-shaped.48 Spoto et al observed that the effect of RES on cardiovascular risk was modified by adiponectin concentration.49 Studies of the role of RES have also shown that old age and serum concentration of this adipokine exceeding 127.4 ng/mL were independent risk factors for death in HD patients.50 Also some studies suggest a beneficial effect of RES in individuals with normal renal function. It was observed that serum RES concentrations were significantly lower in neonates with intrauterine infection compared to healthy neonates (17.8 vs 27 ng/mL). The differences did not depend on sex, type of delivery, or general condition of a neonate after birth.51 Other studies showed a negative correlation between RES concentration and BNP and NT-proBNP concentrations.52 Most probably, there are multiple mechanisms underlying RES synthesis and effects.
Our findings allow no explicit conclusions and should be considered with caution. We are unable to determine the clinical significance of the study. Further research with a larger research sample is needed. This is the first study on the impact of exercise training intervention on RES concentration in HD patients.
None of the previous publications reported significant reduction of proinflammatory cytokines, for example, CRP, IL-6, TNF-α, after physical activity programs27,31,53 in HD patients. We also did not observe such a relationship although cystatin C reduction in HD-MS patients approached statistical significance. We believe this is the first one comprising an inpatient rehabilitation program, where exercise was taken daily under specialist supervision. Physical effort was meticulously controlled and all the participants completed 90%–100% of the individually tailored physical exercise program. So far, investigations of physical effort of HD patients concerned exercise taken twice or three times a week for 15–60 minutes during first 2 hours of hemodialysis session,54–57 ambulatory rehabilitation programs,56 or exercises done by the patient at home.57–60 Observation period usually wasted 1 to 24 months54,57,61,62 or longer.63,64 Previous studies of the effect of physical effort in HD patients focused on effort tolerance, ability to walk, muscular strength, quality of life, quality of sleep, and the restless feet syndrome.65–67 Only few contributions addressed the question of the effect of physical activity on cardiovascular risk47,68,69 and dialysis efficiency70 in HD patients. Compared to individuals with normal renal function, our study showed RES elevation as well as higher concentrations of cystatin C, hs-CRP, TNF-α, homocystein, and PTH. These results are supported by other authors, suggesting that elevated RES, cystatin C, hs-CRP, and TNF-α concentrations in HD patients are most probably the consequence of inflammatory condition and reduced elimination of cytokines due to renal failure.71 The MS was associated with significantly higher leptin concentrations. In HD patients with the MS, higher leptin concentrations were associated with impaired renal function. In HD patients without the MS, renal function did not seem to have a marked effect on leptin concentrations.
Another unexpected observation was an increase of insulin concentration (12.55±5.95 vs 18.10±8.88 µIU/mL; P=0.049) after the rehabilitation program in HD patients with MS. Initially insulin concentrations were higher in control group compared to dialyzed patients. Therefore, exercise training intervention could increase synthesis and release of insulin. Also, one might speculate that higher insulin levels was due to decreased insulin clearance in end stage renal disease.72 On the other hand, it is known73 that excessive physical exercise may lead to counter-regulatory hyperglycemia. It is possible that despite being careful, the exercises applied in HD patients with the MS were too strenuous for them. In the present study, higher RES concentrations were not associated with insulin resistance. A negative correlation between RES and insulin concentrations as well as HOMA-IR index in the subgroup of HD patients without the MS prior to the rehabilitation program was observed. However, results of other studies do not allow unequivocal definition of the relationship between RES and insulin resistance. No correlation between RES concentrations and insulin resistance was observed in non-obese patients on peritoneal dialysis.74 On the other hand, in an extensive Finnish cross-sectional health examination survey, RES turned out to be an independent predictor of the MS and correlated with insulin resistance.75 The MS in our HD patients and individuals with normal renal function was associated with higher leptin concentrations. Other authors confirmed this observation.45 PAI-1 concentration was higher in HD patients with the MS compared to HD patients without the MS, while individuals with normal renal function and the MS showed a significant increase in TNF-α concentrations compared to individuals with normal renal function without the MS.
Strength and limitations
There are several limitations of this study. First, it comprised a relatively small number of participants what was a result of a complex method. Second, the observation period was relatively short. However, the authors’ focus was to evaluate the effect of daily physical exercise performed by inpatient under close supervision. The third limitation stems from the fact that our study only comprised patients of a single dialysis center, which however facilitated the elimination of confounding factors associated with different standards and procedures.
Strength of our study was the daily scheme of individually tailored exercises, in inpatient conditions ensuring permanent supervision by an interdisciplinary team that resulted in very high compliance. So far, such a scheme has never been undertaken in HD patients. Another advantage was that all measurements and laboratory tests were performed using the same methods and by the same research team.
The added value of this study was an implementation of the regular physical activity habit in our patients.
Conclusion
A metabolic and inflammatory response for the 4-week supervised rehabilitation program is changed in end-stage renal disease HD patients as compared to controls with normal renal function. MS modifies a RES response to the rehabilitation program in HD patients. An increase of RES concentration in HD patients without the MS immediately after completion of the rehabilitation program needs further exploration.
Acknowledgments
We wish to acknowledge and thank all physiotherapists, physicians, nurses, and participants for their assistance and contribution to this study. This project was supported by National Science Center, Poland (Project NN 404273740) and by the Medical University of Silesia in Katowice grant to statutory work (contract KNW-1-121/N/7/Z).
Disclosure
The funding body played no role in the formulation of the design, methods, subject recruitment, data collection, analysis, or preparation of this paper. The results presented in this paper have not been published previously in whole or part. The authors report no conflicts of interest in this work.
References
Kim KH, Lee K, Moon YS, Sul HS. A cysteine-rich adipose tissue-specific secretory factor inhibits adipocyte differentiation. J Biol Chem. 2001;276(14):11252–11256. | ||
Karbowska A, Boratyńska M, Resistin KM. A pathogenic factor or a biomarker of metabolic disorders and inflammation? Postepy Hig Med Dosw. 2009;63:485–491. | ||
Pang SS, Le YY, Yy L. Role of resistin in inflammation and inflammation-related diseases. Cell Mol Immunol. 2006;3(1):29–34. | ||
Menzaghi C, Bacci S, Salvemini L, et al. Serum resistin, cardiovascular disease and all-cause mortality in patients with type 2 diabetes. PLoS One. 2014;8(6):e64729. | ||
Dan S, Aditya P, Banerjee P, Bal C, Roy H, Banerjee I. Effect of chronic kidney disease on serum resistin level. Niger J Clin Pract. 2014;17(6):735–738. | ||
Malyszko J, Malyszko JS, Kozminski P, Pawlak K, Mysliwiec M. Elevated resistin is related to inflammation and residual renal function in haemodialysed patients. Nephrology. 2007;12(3):246–253. | ||
Kawamura R, Doi Y, Osawa H, et al. Circulating resistin is increased with decreasing renal function in a general Japanese population: the Hisayama Study. Nephrol Dial Transplant. 2010;25(10):3236–3240. | ||
Moreno LO, Salvemini L, Mendonca C, et al. Serum resistin and glomerular filtration rate in patients with type 2 diabetes. PLoS One. 2015;10(3):e0119529. | ||
Marouga A, Dalamaga M, Kastania AN, et al. Circulating resistin is a significant predictor of mortality independently from cardiovascular comorbidities in elderly, non-diabetic subjects with chronic kidney disease. Biomarkers. 2016;21(1):73–79. | ||
Fontana A, Spadaro S, Copetti M, et al. Association between resistin levels and all-cause and cardiovascular mortality: a new study and a systematic review and meta-analysis. PLoS One. 2015;10(3):e0120419. | ||
Bajnok L, Seres I, Varga Z, et al. Relationship of serum resistin level to traits of metabolic syndrome and serum paraoxonase 1 activity in a population with a broad range of body mass index. Exp Clin Endocrinol Diabetes. 2008;116(10):592–599. | ||
Bo S, Gambino R, Pagani A, et al. Relationships between human serum resistin, inflammatory markers and insulin resistance. Int J Obes. 2005;29(11):1315–1320. | ||
Janowska J, Zahorska-Markiewicz B, Olszanecka-Glinianowicz M. Relationship between serum resistin concentration and proinflammatory cytokines in obese women with impaired and normal glucose tolerance. Metabolism. 2006;55(11):1495–1499. | ||
Lim S, Koo BK, Cho SW, et al. Association of adiponectin and resistin with cardiovascular events in Korean patients with type 2 diabetes: the Korean atherosclerosis study (KAS): a 42-month prospective study. Atherosclerosis. 2008;196(1):398–404. | ||
Niu XH, Li L, Li JY, Song Q, Jin MM, Liu JX. Serum resistin positively correlates with serum lipids, but not with insulin resistance, in first-degree relatives of type-2 diabetes patients: an observational study in China. Medicine. 2017;96(16):e6622. | ||
Singh AK, Tiwari S, Gupta A, et al. Association of resistin with insulin resistance and factors of metabolic syndrome in north Indians. Indian J Clin Biochem. 2015;30(3):255–262. | ||
Schwartz DR, Lazar MA. Human Resistin: Found in Translation From Mouse to Man. Trends in endocrinology and metabolism. Trends Endocrinol Metab. 2011;22(7):259–265. | ||
Montazerifar F, Bolouri A, Paghalea RS, Mahani MK, Karajibani M. Obesity, serum resistin and leptin levels linked to coronary artery disease. Arq Bras Cardiol. 2016;107(4):348–353. | ||
Axelsson J, Bergsten A, Qureshi AR, et al. Elevated resistin levels in chronic kidney disease are associated with decreased glomerular filtration rate and inflammation, but not with insulin resistance. Kidney Int. 2006;69(3):596–604. | ||
Kobayashi S, Maejima S, Ikeda T, Nagase M. Impact of dialysis therapy on insulin resistance in end-stage renal disease: comparison of haemodialysis and continuous ambulatory peritoneal dialysis. Nephrol Dial Transplant. 2000;15(1):65–70. | ||
Sudha MJ, Salam HS, Viveka S, Udupa AL. Assessment of changes in insulin requirement in patients of type 2 diabetes mellitus on maintenance hemodialysis. J Nat Sci Biol Med. 2017;8(1):64–68. | ||
Nashar K, Egan BM. Relationship between chronic kidney disease and metabolic syndrome: current perspectives. Diabetes Metab Syndr Obes. 2014;7(7):421–435. | ||
Gondim OS, de Camargo VT, Gutierrez FA, et al. Benefits of regular exercise on inflammatory and cardiovascular risk markers in normal weight, overweight and obese adults. PLoS One. 2015;10(10): e0140596. | ||
Cohen G, Ilic D, Raupachova J, Hörl WH. Resistin inhibits essential functions of polymorphonuclear leukocytes. J Immunol. 2008;181(6):3761–3768. | ||
O’Sullivan TF, Smith AC, Watson EL. Satellite cell function, intramuscular inflammation and exercise in chronic kidney disease. Clin Kidney J. 2018;72. | ||
Gleeson M, Bishop NC, Stensel DJ, Lindley MR, Mastana SS, Nimmo MA. The anti-inflammatory effects of exercise: mechanisms and implications for the prevention and treatment of disease. Nat Rev Immunol. 2011;11(9):607–615. | ||
Viana JL, Kosmadakis GC, Watson EL, et al. Evidence for anti-inflammatory effects of exercise in CKD. J Am Soc Nephrol. 2014;25(9):2121–2130. | ||
Dungey M, Hull KL, Smith AC, Burton JO, Bishop NC. Inflammatory factors and exercise in chronic kidney disease. Int J Endocrinol. 2013;2013(2):1–12. | ||
Pedersen BK, Saltin B. Exercise as medicine - evidence for prescribing exercise as therapy in 26 different chronic diseases. Scand J Med Sci Sports. 2015;25(Suppl 3):1–72. | ||
Beavers KM, Brinkley TE, Nicklas BJ. Effect of exercise training on chronic inflammation. Clin Chim Acta. 2010;411(11–12):785–793. | ||
Dungey M, Young HML, Churchward DR, Burton JO, Smith AC, Bishop NC. Regular exercise during haemodialysis promotes an anti-inflammatory leucocyte profile. Clin Kidney J. 2017;10(6):813–821. | ||
Marcelino-Rodríguez I, Almeida Gonzalez D, Alemán-Sánchez JJ, et al. Inverse association of resistin with physical activity in the general population. PLoS One. 2017;12(8):e0182493. | ||
Małgorzewicz S, Aleksandrowicz-Wrona E, Owczarzak A, Debska-Slizień A, Rutkowski B, Łysiak-Szydłowska W. Adipokines and nutritional status for patients on maintenance hemodialysis. J Ren Nutr. 2010;20(5):303–308. | ||
Kalantar-Zadeh K, Abbott KC, Salahudeen AK, Kilpatrick RD, Horwich TB. Survival advantages of obesity in dialysis patients. Am J Clin Nutr. 2005;81(3):543–554. | ||
Kalantar-Zadeh K, Kilpatrick RD, Mcallister CJ, Greenland S, Kopple JD. Reverse epidemiology of hypertension and cardiovascular death in the hemodialysis population: the 58th annual fall conference and scientific sessions. Hypertension. 2005;45(4):811–817. | ||
Alberti KG, Eckel RH, Grundy SM, et al. Harmonizing the metabolic syndrome: a joint interim statement of the International Diabetes Federation Task Force on Epidemiology and Prevention; National Heart, Lung, and Blood Institute; American Heart Association; World Heart Federation; International Atherosclerosis Society; and International Association for the Study of Obesity. Circulation. 2009;120(16):1640–1645. | ||
Levey AS, Stevens LA, Schmid CH, et al. A new equation to estimate glomerular filtration rate. Ann Intern Med. 2009;150(9):604–612. | ||
Albouaini K, Egred M, Alahmar A, Wright DJ. Cardiopulmonary exercise testing and its application. Heart. 2007;93(10):1285–1292. | ||
Borg GA. Psychophysical bases of perceived exertion. Med Sci Sports Exerc. 1982;14(5):377–381. | ||
Febbraio MA, Hiscock N, Sacchetti M, Fischer CP, Pedersen BK. Interleukin-6 is a novel factor mediating glucose homeostasis during skeletal muscle contraction. Diabetes. 2004;53(7):1643–1648. | ||
Ihalainen J, Walker S, Paulsen G, et al. Acute leukocyte, cytokine and adipocytokine responses to maximal and hypertrophic resistance exercise bouts. Eur J Appl Physiol. 2014;114(12):2607–2616. | ||
Bokarewa M, Nagaev I, Dahlberg L, Smith U, Tarkowski A. Resistin, an adipokine with potent proinflammatory properties. J Immunol. 2005;174(9):5789–5795. | ||
Kaynar K, Kural BV, Ulusoy S, et al. Is there any interaction of resistin and adiponectin levels with protein-energy wasting among patients with chronic kidney disease. Hemodial Int. 2014;18(1):153–162. | ||
Arikan H, Koc M, Tuglular S, Ozener C, Akoglu E. Elevated plasma levels of PAI-1 predict cardiovascular events and cardiovascular mortality in prevalent peritoneal dialysis patients. Ren Fail. 2009;31(6):438–445. | ||
Saluk J, Bansal V, Hoppensteadt D, Syed D, Abro S, Fareed J. Prevalence of metabolic syndrome in patients with end stage renal disease and relevance of biomarkers. Int Angiol. 2016;35(1):47–56. | ||
Sweigert PJ, Bansal VK, Hoppensteadt DA, Saluk JL, Syed DA, Fareed J. Inflammatory and metabolic syndrome biomarker analysis of vascular outcomes in end-stage renal disease. Int J Angiol. 2017;26(1):043–048. | ||
Lehrke M, Reilly MP, Millington SC, Iqbal N, Rader DJ, Lazar MA. An inflammatory cascade leading to hyperresistinemia in humans. PLoS Med. 2004;1(2):e45. | ||
Chung W, Jung ES, Shin D, et al. Low resistin level is associated with poor hospitalization-free survival in hemodialysis patients. J Korean Med Sci. 2012;27(4):377–381. | ||
Spoto B, Mattace-Raso F, Sijbrands E, et al. Resistin and all-cause and cardiovascular mortality: effect modification by adiponectin in end-stage kidney disease patients. Nephrol Dial Transplant. 2013;28(Suppl 4):iv181–iv187. | ||
Chi PJ, Liou HH, Hsu BG, Tasi JP. Relationship between resistin and mortality in maintenance hemodialysis patients. Clin Nephrol. 2016;86(9):125–131. | ||
Stojewska M, Wnęko-Masłoń B, Nawrat A. Serum resistin concentration in full-term newborns with intrautherine infections. Stężenie rezystyny w surowicy noworodków donoszonych, z zakażeniami wewnątrzmacicznymi. Polish Journal of Paediatrics. 2016;91:325–331. | ||
Liu W, Jiang L, Chen J, et al. Association of adipokines with blood pressure, arterial elasticity and cardiac markers in dialysis patients: cross-sectional analysis of baseline data from a cohort study. Nutr Metab. 2017;14:34. | ||
Gołębiowski T, Kusztal M, Weyde W, et al. A program of physical rehabilitation during hemodialysis sessions improves the fitness of dialysis patients. Kidney Blood Press Res. 2012;35(4):290–296. | ||
Giannaki CD, Hadjigeorgiou GM, Karatzaferi C, et al. A single-blind randomized controlled trial to evaluate the effect of 6 months of progressive aerobic exercise training in patients with uraemic restless legs syndrome. Nephrol Dial Transplant. 2013;28(11):2834–2840. | ||
Liao MT, Liu WC, Lin FH, et al. Intradialytic aerobic cycling exercise alleviates inflammation and improves endothelial progenitor cell count and bone density in hemodialysis patients. Medicine. 2016;95(27):e4134. | ||
Young HML, March DS, Graham-Brown MPM, et al. Effects of intradialytic cycling exercise on exercise capacity, quality of life, physical function and cardiovascular measures in adult haemodialysis patients: a systematic review and meta-analysis. Nephrol Dial Transplant. 2018;33(8):1436–1445. | ||
Bohm C, Stewart K, Onyskie-Marcus J, Esliger D, Kriellaars D, Rigatto C. Effects of intradialytic cycling compared with pedometry on physical function in chronic outpatient hemodialysis: a prospective randomized trial. Nephrol Dial Transplant. 2014;29(10):1947–1955. | ||
Manfredini F, Mallamaci F, D’Arrigo G, et al. Exercise in patients on dialysis: a multicenter, randomized clinical trial. J Am Soc Nephrol. 2017;28(4):1259–1268. | ||
Tao X, Chow SK, Wong FK. A nurse-led case management program on home exercise training for hemodialysis patients: a randomized controlled trial. Int J Nurs Stud. 2015;52(6):1029–1041. | ||
Matsuzawa R, Hoshi K, Yoneki K, et al. Exercise training in elderly people undergoing hemodialysis: a systematic review and meta-analysis. Kidney Int Rep. 2017;2(6):1096–1110. | ||
Konstantinidou E, Koukouvou G, Kouidi E, Deligiannis A, Tourkantonis A. Exercise training in patients with end-stage renal disease on hemodialysis: comparison of three rehabilitation programs. J Rehabil Med. 2002;34(1):40–45. | ||
Chen JL, Godfrey S, Ng TT, et al. Effect of intra-dialytic, low-intensity strength training on functional capacity in adult haemodialysis patients: a randomized pilot trial. Nephrol Dial Transplant. 2010;25(6):1936–1943. | ||
Anding K, Bär T, Trojniak-Hennig J, et al. A structured exercise programme during haemodialysis for patients with chronic kidney disease: clinical benefit and long-term adherence. BMJ Open. 2015;5(8): e008709. | ||
Kouidi E, Grekas D, Deligiannis A, Tourkantonis A. Outcomes of long-term exercise training in dialysis patients: comparison of two training programs. Clin Nephrol. 2004;61(Suppl 1):31–38. | ||
Esteve Simo V, Junqué Jiménez A, Moreno Guzmán F, et al. Benefits of a low intensity exercise programme during haemodialysis sessions in elderly patients. Nefrologia. 2015;35(4):385–394. | ||
Heiwe S, Jacobson SH. Exercise training in adults with CKD: a systematic review and meta-analysis. Am J Kidney Dis. 2014;64(3):383–393. | ||
Bennett PN, Fraser S, Barnard R, et al. Effects of an intradialytic resistance training programme on physical function: a prospective stepped-wedge randomized controlled trial. Nephrol Dial Transplant. 2016;31(8):1302–1309. | ||
Miller BW, Cress CL, Johnson ME, Nichols DH, Schnitzler MA. Exercise during hemodialysis decreases the use of antihypertensive medications. Am J Kidney Dis. 2002;39(4):828–833. | ||
Frih B, Jaafar H, Mkacher W, Ben Salah Z, Hammami M, Frih A. The effect of interdialytic combined resistance and aerobic exercise training on health related outcomes in chronic hemodialysis patients: the Tunisian randomized controlled study. Front Physiol. 2017;8:288. | ||
Kirkman DL, Roberts LD, Kelm M, Wagner J, Jibani MM, Macdonald JH. Interaction between intradialytic exercise and hemodialysis adequacy. Am J Nephrol. 2013;38(6):475–482. | ||
Akagun T, Caliskan Y, Yazici H, et al. Elevated resistin levels are associated with inflammation in hemodialysis patients with failed renal allografts. Int J Artif Organs. 2014;37(5):358–363. | ||
Guthoff M, Wagner R, Vosseler D, et al. Impact of end-stage renal disease on glucose metabolism-a matched cohort analysis. Nephrol Dial Transplant. 2017;32(4):670–676. | ||
Kjaer M, Hollenbeck CB, Frey-Hewitt B, Galbo H, Haskell W, Reaven GM. Glucoregulation and hormonal responses to maximal exercise in non-insulin-dependent diabetes. J Appl Physiol. 1990;68(5):2067–2074. | ||
Yoo DE, Lee MJ, Oh HJ, et al. Low circulating adiponectin levels are associated with insulin resistance in non-obese peritoneal dialysis patients. Endocr J. 2012;59(8):685–695. | ||
Malo E, Ukkola O, Jokela M, et al. Resistin is an indicator of the metabolic syndrome according to five different definitions in the Finnish Health 2000 survey. Metab Syndr Relat Disord. 2011;9(3):203–210. |
 © 2018 The Author(s). This work is published and licensed by Dove Medical Press Limited. The
full terms of this license are available at https://www.dovepress.com/terms
and incorporate the Creative Commons Attribution
- Non Commercial (unported, 3.0) License.
By accessing the work you hereby accept the Terms. Non-commercial uses of the work are permitted
without any further permission from Dove Medical Press Limited, provided the work is properly
attributed. For permission for commercial use of this work, please see paragraphs 4.2 and 5 of our Terms.
© 2018 The Author(s). This work is published and licensed by Dove Medical Press Limited. The
full terms of this license are available at https://www.dovepress.com/terms
and incorporate the Creative Commons Attribution
- Non Commercial (unported, 3.0) License.
By accessing the work you hereby accept the Terms. Non-commercial uses of the work are permitted
without any further permission from Dove Medical Press Limited, provided the work is properly
attributed. For permission for commercial use of this work, please see paragraphs 4.2 and 5 of our Terms.