Back to Journals » International Journal of Nanomedicine » Volume 10 » Issue 1
Photothermal cancer therapy using graphitic carbon–coated magnetic particles prepared by one-pot synthesis
Authors Lee H, Sanetuntikul J, Choi ES, Lee B, Kim J ![]() , Kim E
, Kim E ![]() , Shanmugam S
, Shanmugam S
Received 23 August 2014
Accepted for publication 9 November 2014
Published 30 December 2014 Volume 2015:10(1) Pages 271—282
DOI https://doi.org/10.2147/IJN.S73128
Checked for plagiarism Yes
Review by Single anonymous peer review
Peer reviewer comments 5
Editor who approved publication: Dr Thomas Webster
Hyo-Jeong Lee,1 Jakkid Sanetuntikul,2 Eun-Sook Choi,1 Bo Ram Lee,1 Jung-Hee Kim,1 Eunjoo Kim,1 Sangaraju Shanmugam2
1Nano and Bio Research Division, 2Department of Energy Systems Engineering, Daegu Gyeongbuk Institute of Science and Technology, Daegu, Republic of Korea
Abstract: We describe here a simple synthetic strategy for the fabrication of carbon-coated Fe3O4 (Fe3O4@C) particles using a single-component precursor, iron (III) diethylenetriaminepentaacetic acid complex. Physicochemical analyses revealed that the core of the synthesized particles consists of ferromagnetic Fe3O4 material ranging several hundred nanometers, embedded in nitrogen-doped graphitic carbon with a thickness of ~120 nm. Because of their photothermal activity (absorption of near-infrared [NIR] light), the Fe3O4@C particles have been investigated for photothermal therapeutic applications. An example of one such application would be the use of Fe3O4@C particles in human adenocarcinoma A549 cells by means of NIR-triggered cell death. In this system, the Fe3O4@C can rapidly generate heat, causing >98% cell death within 10 minutes under 808 nm NIR laser irradiation (2.3 W cm-2). These Fe3O4@C particles provided a superior photothermal therapeutic effect by intratumoral delivery and NIR irradiation of tumor xenografts. These results demonstrate that one-pot synthesis of carbon-coated magnetic particles could provide promising materials for future clinical applications and encourage further investigation of this simple method.
Keywords: graphitic carbon–encapsulated magnetic nanoparticles, iron oxide, one-pot synthesis, photothermal cancer therapy
Introduction
Photothermal therapy (PTT), a particle-based cancer therapy that uses various PTT agents, has recently been garnering much attention due its high selectivity, minimal invasiveness, and significant efficacy while exhibiting fewer side effects than chemotherapy or radiotherapy.1,2 PTT agents can be activated to generate heat by means of near-infrared (NIR) light (700–1,000 nm) irradiation, leading to the destruction of cancer cells.3 PTT agents including gold- and carbon-based nanoparticles such as carbon nanotubes (CNTs) and grapheme have been investigated.4–6
Although CNT and graphene sheets have been investigated for their applicability in photothermal cancer treatment, their use presents several difficulties that need to be overcome in order to obtain significant theragnostic results. These include the controlled production and purification, intrinsically low solubility, and dispersibility with respect to the electronic type, length, and diameter of these sheets.7–9
Recent developments in the synthesis and bioconjugation strategies have enabled the preparation of graphitic carbon (GC)–coated metal crystals, eg, by the encapsulation of magnetic particles with GC to offer more controlled size and shape.10,11 GC-encapsulated magnetic nanoparticles are found to have intrinsic photosensitization properties due to the highly oriented pyrolytic graphite from the surface of these core-shell structures.12 Based on these results, several studies have explored the functionality of PTT by GC-encapsulated magnetic nanoparticles.13,14
Due to the nature of GC, these nanocomposites have unique physicochemical properties such as high electrical and thermal conductivity and strong mechanical strength. The strategies for synthesizing combined composites of magnetic particles encapsulated with GC often involve complicated preparation processes.15 To date, several methods have been used for the synthesis of GC-encapsulated magnetic metal nanoparticles, including chemical vapor deposition,16 arc discharge,17 spray pyrolysis,18 plasma methods,19 and one-pot synthesis in closed cells.20
One-pot synthesis is one such strategy that has been developed to generate new classes of metal crystals in carbonaceous matter. Furthermore, using this strategy, the introduction of carbon layer coating on the surface of the presynthesized iron nanoparticles can be avoided.20–22
Herein, we report a facile and simple approach for the synthesis of GC-coated iron oxide particles using a single-precursor, iron (III) diethylenetriaminepentaacetic acid. The core of the prepared particles was found to be magnetite (Fe3O4), while the surface layer was identified to be a nitrogen-doped graphitic structure. Furthermore, we evaluated the particles’ therapeutic effect on tumor xenografts. The results suggest potential biomedical applications of these particles.
Materials and methods
Synthesis of Fe3O4@C nanoparticles
Nitrogen-doped carbon–coated Fe3O4 (Fe3O4@C) particles were synthesized using iron (III) diethylenetriaminepentaacetic acid as a single precursor. Synthesis was carried out using a closed vessel cell made of stainless steel Swagelok parts (a 3/4″-union part was plugged on both sides with standard caps). The precursor (0.7 g) was introduced into the cell at room temperature under nitrogen atmosphere; the filled cell was closed tightly with the remaining plug and placed at the center of a quartz tube.23 The closed cell (Swagelok) was heated to 700°C at a rate of 10°C/minute for 1 hour. The reaction took place under the precursor pressure. At the end of the reaction, the closed cell was gradually cooled to room temperature and opened. The cell with 0.472 g of black powder was obtained. The total yield of the product material was 67% (relative to the starting material).
Particle characterization
The microstructures and lattice fringe of the sample were analyzed using a field-emission transmission electron microscope (TEM, HF-3300; Hitachi, Tokyo, Japan) at an acceleration voltage of 300 kV. Elemental mapping using the TEM images was performed by means of energy-dispersive X-ray spectroscopy (EDS, QUANTAX 200; Bruker, Billerica, MA, USA). For TEM analysis, samples were ultrasonically dispersed in ethanol, and then a drop of particle suspended in ethanol was deposited on an amorphous carbon film copper grid and the grid was dried in air. The hydrodynamic size and zeta potential of the particles dispersed in deionized water were determined by dynamic light scattering (ZetaSizer NanoZS; Malvern Instrument, Malvern, UK).
The sample crystal structure was investigated by powder X-ray diffraction (Empyrean; Panalytical, Almelo, the Netherlands) using Cu K-alpha radiation at a generator voltage of 40 kV and a tube current of 30 mA. The carbon structure was analyzed by Raman spectroscopy (Nicolet Almega XR; Fisher Scientific, Pittsburgh, PA, USA). An ultraviolet (UV)/visual/NIR spectrometer with diffuse reflectance mode (Cary 5000; Agilent Technology) was used to investigate the visible light absorption of the samples under a wavelength of 400–1,400 nm. Before sample measurement, the UV-visible spectrometer was calibrated with BaSO4. The magnetic properties of the powder samples were analyzed using a superconducting quantum interference device (SQUID) (MPMS-7; Quantum Design, San Diego, CA, USA). The saturation magnetization and coercivity field values were obtained from the hysteresis loops measured up to a field of 15 kOe at 300 K. The amounts of nitrogen and carbon within the samples were accurately determined using an elemental analyzer (vario MICRO cube; Elementar Analysensysteme GmbH, Hanau, Germany).
Cell culture
Human lung adenocarcinoma A549 (ATCC® CCL-185™) cells were grown in F-12K media (HyClone, Logan, UT, USA) supplemented with 10% fetal bovine serum. Mouse liver AML12 (ATCC® CRL-2254™) cells were grown in 1:1 mixture of Dulbecco’s Modified Eagle’s Medium (HyClone) and Ham’s F-12 media (HyClone) supplemented with 10% fetal bovine serum. Cells were maintained at 37°C, 5% CO2 in a humidified incubator, and the culture medium was changed every second day.
Particle preparation for in vitro and in vivo tests
Fe3O4@C particles were dispersed in phosphate-buffered saline (PBS) solution and used at the intended concentrations. Prior to their use, the samples were dispersed in an ultrasonic bath (Model 1200; Branson, Danbury, CT, USA) for 5 minutes.
Cytotoxicity test
The cytotoxicity of Fe3O4@C particles was measured using 3-(4,5-dimethylthiazol-2-yl)-5-(3-carboxymethoxyphenyl)-2-(4-sulfophenyl)-2H-tetrazolium (MTS) assay using a CellTiter 96 kit (Promega, Madison, WI, USA) on A549 and AML12 cells. Cells were seeded at a density of 5×10³ cells per well in a 96-well plate with medium (100 μL) and incubated for 24 hours to allow them to adhere to the surface of the plate. Aliquots containing various concentrations of Fe3O4@C particles were added to each well, and the cells were incubated for an additional 48 hours. Prior to the addition of MTS reagent (20 μL) to the fresh culture media, Fe3O4@C solution was removed from the culture to prevent any interference in the absorbance measurement. Following incubation at 37°C for 3 hours, the absorbance was detected at 490 nm using a microplate reader (Multiskan; Thermo Scientific, Waltham, MA, USA). Cytotoxicity was expressed as the percentage of cell viability with respect to the control cells that had been treated with the vehicle of the particles only.
Analysis of Fe concentration in A549 cells
To measure the cellular iron concentration in a time-dependent manner, A549 cells were seeded in 35 mm culture dishes (2×10⁵ cells per dish) with 2 mL of culture media for 24 hours and exposed to Fe3O4@C (100 μg mL−1) for 1 hour, 2 hours, 4 hours, 8 hours, and 24 hours. The cells were washed thoroughly with PBS three times and detached from the culture plate using 0.25% trypsin–ethylenediaminetetraacetic acid (EDTA) solution (Life Technology, Carsbad, CA, USA). The cell number was counted with a hemocytometer, and 2 mL of digestion solution (nitric acid:perchloric acid, V:V=4:1) was added to the cell pellet of 5×10⁵ cells. Iron content was determined by inductively coupled plasma (ICP) atomic emission spectroscopy (iCAP Q; Thermo Scientific).
Fe3O4@C cellular distribution analysis
To determine the cellular distribution of Fe3O4@C, A549 cells were grown on 100 mm culture dishes to produce an 80%–90% confluent monolayer. Fe3O4@C were added to each cell culture dish (50 μg mL−1) and incubated for an additional 24 hours. The cells were harvested, rinsed three times with PBS, and fixed with 2.5% glutaraldehyde in PBS. The samples were postfixed in 1% osmium tetroxide in PBS, rinsed, dehydrated in graded ethanol, and embedded in Epon (Polyscience, Warrington, PA, USA). Prior to observation with bio-TEM (Tecani™ G2 Spirit; Fei Company, Hillsboro, OR, USA), thin (70 nm) sections were cut and stained with methanolic uranyl acetate and lead citrate.
The photothermal effects on A549 cells
A549 cells (5×10⁵ cells) were seeded in 100 mm cell culture dishes and cultured for 48 hours. Following an additional 2-hour incubation with Fe3O4@C particles (100 μg mL−1), the cell medium was removed from the culture dishes; cells were washed three times with PBS and detached by adding 0.25% trypsin–EDTA solution (Invitrogen, Carsbad, CA, USA). A control sample with exposure to the vehicle solution was also prepared. Tubes containing 1×10⁵ cells from each culture dish together with culture media (0.3 mL) were stored on ice until irradiation. The cells were irradiated for 10 minutes with an 808 nm laser (Focuslight; Xian, China) at power of 2.3 W cm−2 (laser area, 0.8 cm2). The temperature was measured at 1-minute intervals using a fluoro-optic thermometer fiber probe. After heating, cells were replated in a 96-well culture plate. Another set of cells from the same sample group, without photothermal irradiation, was also plated as a viability control. Following 24 hours of incubation at 37°C, cell viability was determined using an MTS assay.
In vivo PTT for tumor xenografts
Animals were purchased from Central Lab. Animal Inc. (Seoul, Korea). The Animal Care and Use Committee of Daegu Gyeongbuk Institute of Science and Technology (Daegu, Korea) approved all animal protocols. The A549 cells were injected into the subcutaneous tissue of the hind limb of a BALB/c nude mouse (100 μL in PBS, 1×10⁷ cells per mouse). When the tumor size reached a mean volume of ~300 mm3, the mice were randomly divided into four groups, with three mice in each group. Two groups of mice were injected with Fe3O4@C particles at a dose of 5 mg kg−1 (nearly 100 μg to each animal) at the tumor site. The mice were anesthetized with Zoletil (40 mg kg−1) and Rompun (5 mg kg−1) solution before each Fe3O4@C administration. One of the two groups was treated with NIR radiation from the 808 nm laser (2.3 W cm−2, 10 minutes), 0.8 cm2 beam at 30-minute postinjection. The other group was not irradiated. The two control groups were injected with PBS; one group was irradiated by NIR and the other group was not. The NIR-induced temperature rise in the tumor xenograft area was recorded using an infrared thermographic camera (FLIR). Tumor volumes were measured in two dimensions after 1 week using a Vernier caliper, and their volume was calculated as V=0.5×W×L2 (where W is the smallest diameter of the tumor and L is the largest diameter of the tumor). After sacrifice, the iron concentrations in kidney, liver, lung, heart, and tumor tissues were measured by ICP mass spectrometry (ICP-MS; iCAP Q, Thermo Scientific). In order to analyze histological changes in tumor tissue, tissues were fixed in paraffin solution and cut into slices (8 μm thickness), and these were mounted on glass slides. Hematoxylin–eosin staining of tumor tissue was performed as described previously.24 To identify the localization of the iron particles in the tissue, iron staining in the tissue section was performed using the Accustain iron staining kit (Sigma-Aldrich, St Louis, MO, USA).
To investigate the localization and clearance of Fe3O4@C at normal tissues after entrance into the blood circulation, we analyzed the particle concentration in liver and kidney at 1 hour, 2 hours, 4 hours, 8 hours, and 24 hours followed by an intravenous injection of the particles. BALB/c nude mice (n=3) were anesthetized with Zoletil and Rompun solution before intravenous Fe3O4@C administration (5 mg kg−1). After sacrifice, the iron concentrations in kidney and liver were measured by ICP-MS.
Statistical analysis
All data were expressed as mean ± standard deviation and analyzed using a Student’s t-test. P-values were calculated using Sigma plot (version 12.3; Systat Software, Inc., San Jose, CA, USA).
Results and discussion
Physicochemical properties of the particles
Particle morphology was characterized by field-emission TEM. TEM imaging showed that the particles have a spherical morphology with an average size of 629±105 nm (n=20). The micrograph in Figure 1A shows that the Fe3O4 particles (dark shapes) are coated by carbon layers (bright surface layer). The carbon coating thickness was found to be approximately ~120 nm. Their number average was 854±29 nm in diameter, and zeta potential was in the range of approximately -19.9 to -16.5 in dynamic light scattering analysis (Figure 1B). The intensity-average histogram is shown in Figure S1(A). The hydrodynamic size (Z-average) was determined as 2.6 μm with 0.7 polydispersive index. When the dynamic light scattering analysis was performed without dispersion process by sonication, the hydrodynamic size was determined as 4.8 μm, composed of two peaks of particles, 4.9 μm (90%) and 700 nm (10%) in diameter (Figure S1B).
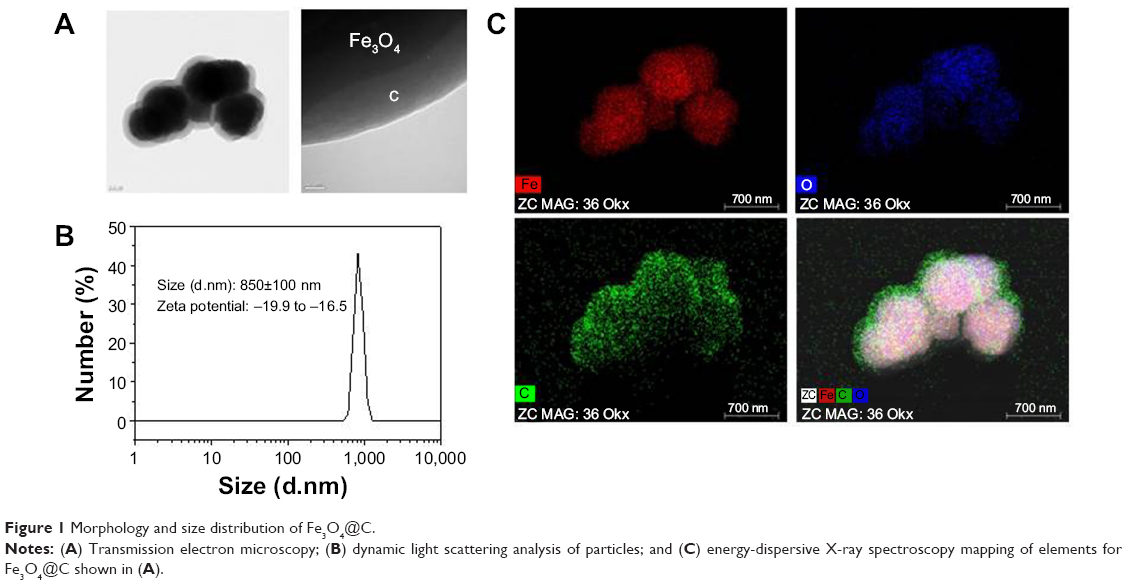 | Figure 1 Morphology and size distribution of Fe3O4@C. |
Figure 1C shows the EDS mapping of the particles’ elements, ie, the distribution of iron (Fe), oxygen (O2), and carbon (C) elements in the particles. The mixed-element map provides elemental information for the core and shell regions. Iron and oxygen are distributed in the core region, and carbon is a surface layer element. This result coincides with the TEM image of the particles that was used for EDS analysis.
Figure 2A shows the X-ray diffraction patterns of the Fe3O4@C. The X-ray diffraction patterns can be indexed with the cubic structures of magnetite (space group Fd-3m [227]).25 The nature of the carbon present in the sample was identified by means of Raman spectroscopy. Figure 2B depicts two broad peaks centered on 1,594 cm−1 and a disordered D peak at 1,350 cm−1, providing evidence for a graphitic shell. The peak at 1,594 cm−1 corresponds to an E2g mode of graphite, which is due to the sp2-bonded carbon atoms in a two-dimensional hexagonal graphitic layer.26 Figure 2C shows the UV/visual/NIR absorption properties of the Fe3O4@C particles in the range of 400–1,400 nm. The UV/visual/NIR spectra of the particles exhibited broad absorption extending over the NIR region. Using Beer–Lambert’s law (A=-logI/I0=εcl, where A is the absorbance; I is the transmitted radiation; I0 is the intensity of the incident radiation; ε is the extinction coefficient, c is the concentration of Fe3O4@C; and l is the path length), the extinction coefficient at 808 nm is estimated to be 0.9 mL mg−1 cm−1. To determine whether the prepared magnetite particles could be used to induce hyperthermia, their magnetic properties were investigated using SQUID at 300 K. The result of room temperature, field-dependent magnetization measurements of the magnetite particles obtained using Fe3O4@C particles is shown in Figure 2D. Their saturated magnetization (Ms) values were 51 emu g−1 at 15 kOe. The coercivity (Hc) values of Fe3O4@C particles were found to be 132 Oe. A very small hysteresis loop was identified in these particles, indicating that Fe3O4@C exhibit ferromagnetic behavior. The saturated magnetization value is lower than that of bulk magnetite (92 emu g−1) and higher than the values reported for nanoparticles synthesized by decomposition of organometallic complexes.27 The lower Ms values can be attributed to the presence of nonmagnetic carbon components in the samples. The obtained coercivity values are lower than the values for bulk magnetite (200–300 Oe) and comparable with that of magnetite nanoparticles.
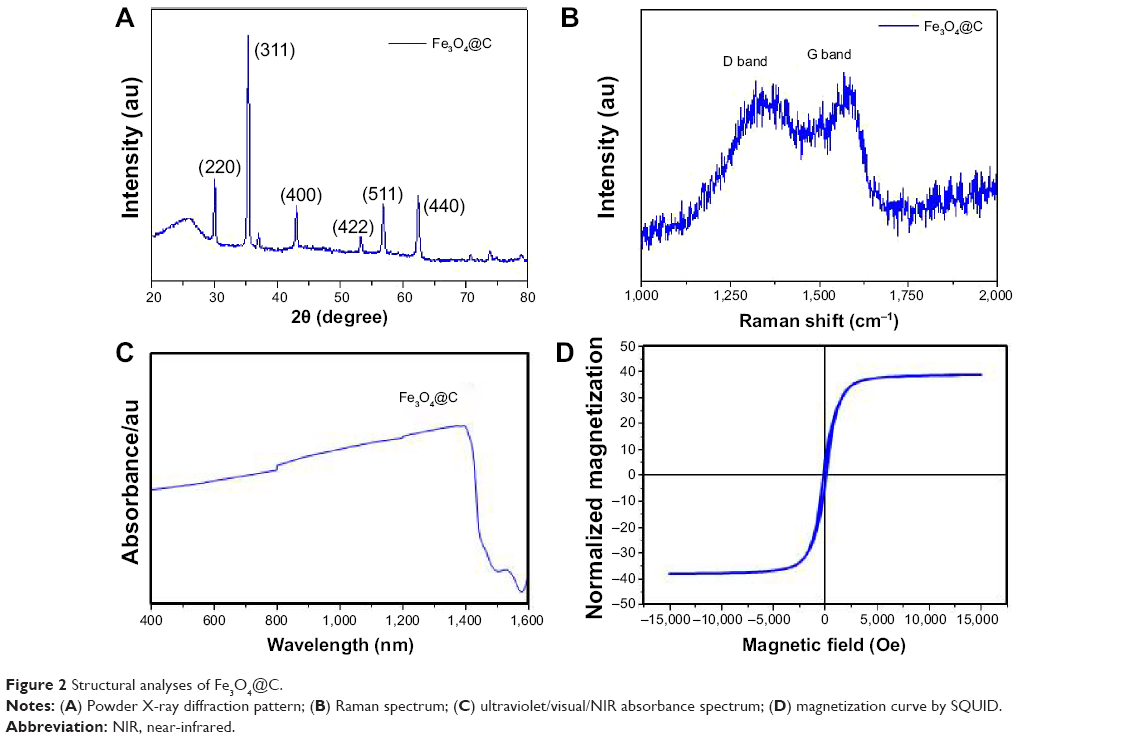 | Figure 2 Structural analyses of Fe3O4@C. |
Table 1 shows the result of elemental analysis for carbon and nitrogen. The content of nitrogen was 6.41% and N/C ratio was 0.146. This result shows that the surface layer would be a nitrogen-doped GC. Taking all the results into consideration, the structural analysis shows that Fe3O4@C particles synthesized in this study have magnetite core and nitrogen-doped GC shell structure.
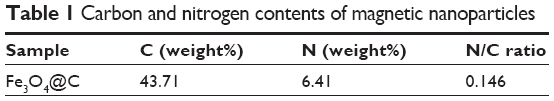 | Table 1 Carbon and nitrogen contents of magnetic nanoparticles |
Cytotoxicity and cellular uptake of Fe3O4@C
We examined the biocompatibility of the magnetic particles in human adenocarcinoma (A549) cells and normal mouse liver (AML12) cells. The MTS assay showed no significant reduction in cell viability following 48 hours of incubation with Fe3O4@C particles at concentrations of 25 μg mL−1, 50 μg mL−1, and 100 μg mL−1, and the viability was assessed to be nearly 100% of the control cell sample (Figure 3A). This result indicates that Fe3O4@C are biocompatible for A549 cells at concentrations as high as 100 μg mL−1. In addition, the MTS assay for AML12 cells also showed no significant reduction in cell viability at concentrations of 50 μg mL−1 and 100 μg mL−1, and the viability at 200 μg mL−1 was assessed to be decreased slightly (92% of the control cell sample) (Figure S2).
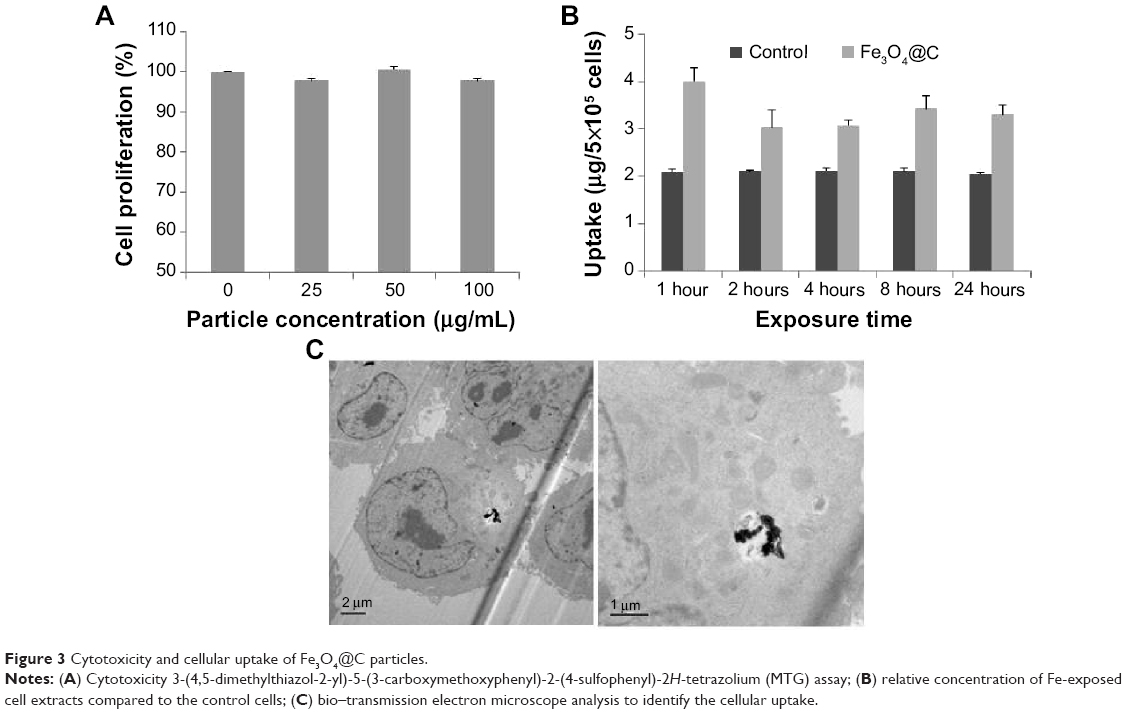 | Figure 3 Cytotoxicity and cellular uptake of Fe3O4@C particles. |
To determine the extent of cellular uptake, the A549 cells were treated with Fe3O4@C (100 μg mL−1) and incubated for 1 hour, 2 hours, 4 hours, 8 hours, and 24 hours, respectively. The cellular concentration of Fe was measured by ICP atomic emission spectroscopy following digestion of cells with a mixture of nitric and perchloric acids (Figure 3B). The intracellular concentration of Fe was higher in Fe3O4@C-exposed cells than in the controls, which could explain the basis of the cellular iron uptake of A549 cells after 1 hour. This result was supported by the image from bio-TEM analysis, in which particles could be clearly observed inside the cells (Figure 3C). There was little difference in uptake from 1 hour to 24 hours. The result was interpreted as the uptake reached its maximum level at 1 hour. The bio-TEM image could support the rapid saturation of the particles in cells, which showed that a small amount of the particles was distributed in the cells at 24 hours (Figure 3C).
In Figure 3C, particles are not localized in a membrane-bound vesicle, likely because the particles enter the cytoplasm directly. According to Raffa et al28 who provided a rational view of various internalization mechanisms for CNTs, CNT aggregates ≥1 μm in length are internalized by phagocytosis, supramolecular structures are internalized by endocytosis, and sub-micron CNTs that do not form supramolecules can be internalized by diffusion. Recent reports on particle translocation also supported the mechanism of passive diffusion of particles into the cell membranes.29,30 In this study, Fe3O4@C particles were observed in aggregation but not in vesicular formation; thus, they would be internalized by an energy-independent diffusion process. Further study is needed to confirm the hypothesis that the graphitic surface of the particles could cause passive diffusion of the particles into cells.
Photothermal activity of Fe3O4@C
We analyzed the photothermal activity of Fe3O4@C particles. A549 cells were incubated for 2 hours with Fe3O4@C (100 μg mL−1) and irradiated with an 808 nm laser for 10 minutes at a power of 2.3 W cm−2. Under irradiation, the temperature of the samples rapidly increased and reached 40°C (control samples) and 48°C (Fe3O4@C-exposed cells), respectively (Figure 4A). During irradiation, the temperature of cells treated with Fe3O4@C was consistently 6.5°C±2.3°C higher than that of the control cells. This result was attributed to the presence of Fe3O4@C GC on the surface. The viability of A549 cells exposed to Fe3O4@C, followed by an irradiation with 808 nm laser showed 1.8%±1.3% viability compared to the cells without NIR irradiation, while control cells irradiated with NIR showed 94.0%±13.6% viability compared to the cells without NIR irradiation (Figure 4B). This result demonstrates that Fe3O4@C particles are efficient heat inducers and can cause specific cytotoxicity by NIR irradiation. Thus, the increase in temperature of Fe3O4@C-exposed cells induced by NIR irradiation was high enough to cause >98% death of cancer cells compared to the cells without NIR irradiation.
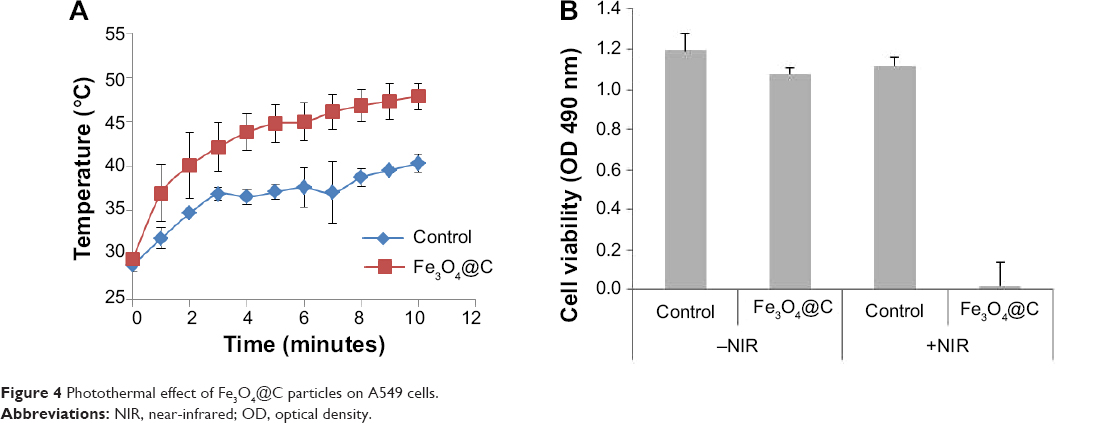 | Figure 4 Photothermal effect of Fe3O4@C particles on A549 cells. |
PTT in mice
We investigated whether the heat-inducing ability of carbon-coated particles prepared by this reported one-pot synthesis is also effective for in vivo PTT. BALB/c nude mice bearing A549 tumor xenografts were prepared by injection of 1×10⁷ cells into the subcutaneous tissue of the hind limb. When the tumor volume reached ~300 mm2, Fe3O4@C particles (5 mg kg−1) were introduced in the tumor mass locally. The control and treatment groups were divided into (+NIR) and (-NIR) subgroups, and only the (+NIR) groups were irradiated by an 808 nm laser at a power of 2.3 W cm−2 for 10 minutes. The mice were sacrificed after 1 week with no additional treatment. Figure 5A shows representative images of the mice after Fe3O4@C particles administration followed by NIR irradiation. When irradiated by NIR, tumor size was dramatically reduced. The temperature of the outside tissue of the tumor xenograft increased to 49.4°C±3.9°C during NIR irradiation for 10 minutes in the treatment group (Figure 5B). In the control group, the temperature reached 41.1°C±0.98°C during NIR irradiation for the same period of time. The NIR irradiation temperature change was reflected in the total tumor volume of each group. The volume of tumors excised from mice in the (+NIR) group was smaller than before the treatment, and the change was significant (P<0.001) (Figure 5C).
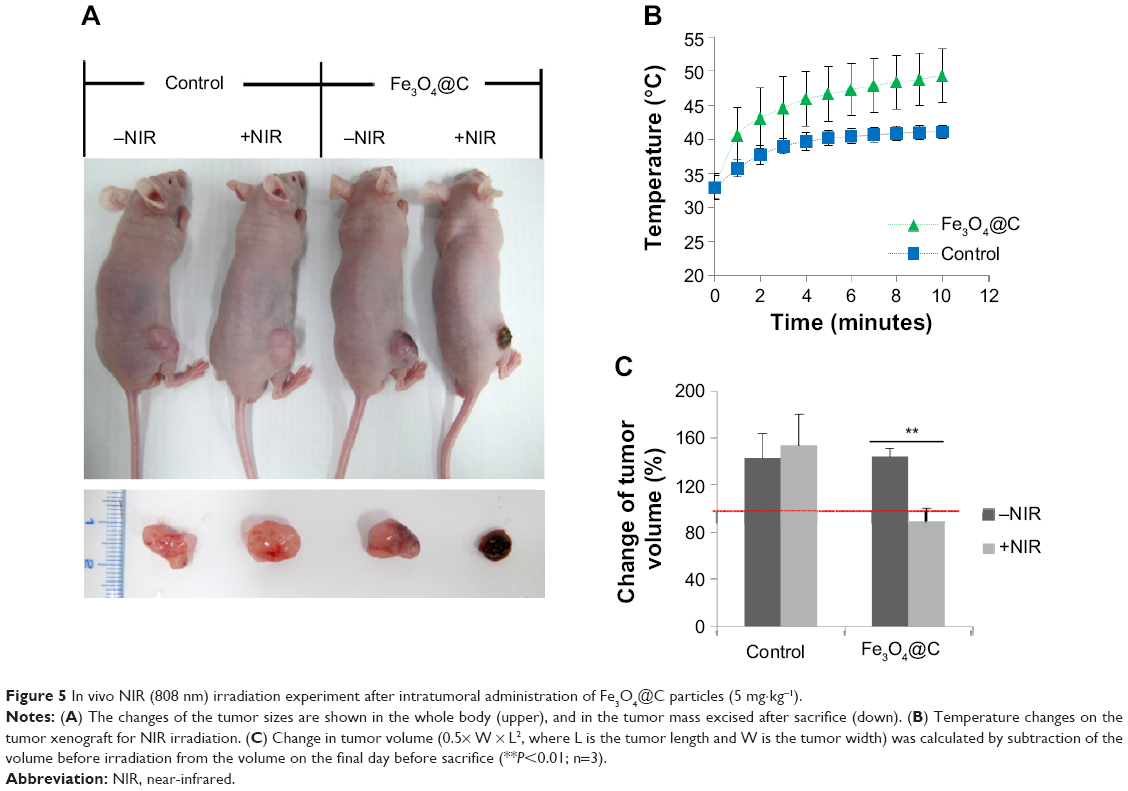 | Figure 5 In vivo NIR (808 nm) irradiation experiment after intratumoral administration of Fe3O4@C particles (5 mg·kg−1). |
Because it was evident that when combined with NIR irradiation Fe3O4@C particles could induce heat in the tumor tissue, histological analysis was performed to confirm the therapeutic effect of these particles. Figure 6 shows apoptotic cell death. Condensed nucleus was widely observed following NIR irradiation in the tumor tissue of the treatment group, and active proliferation of tumor cells was observed for the rest of the groups. This result supported the significant decrease in tumor weight when exposed to Fe3O4@C particles, following NIR treatment as a photothermal agent. In PTT, the mechanisms of cancer cell death have been reported to apparently involve oxidative stress and mitochondrial membrane depolarization resulting in simultaneous apoptosis and necrosis, supported by caspase activation, fragmentation of DNA, and change of cell membrane permeability, etc.31,32 In histological analysis of normal tissues for the (+NIR) group, no obvious effect was observed in the heart, lung, kidney, or liver tissues (Figure S3).
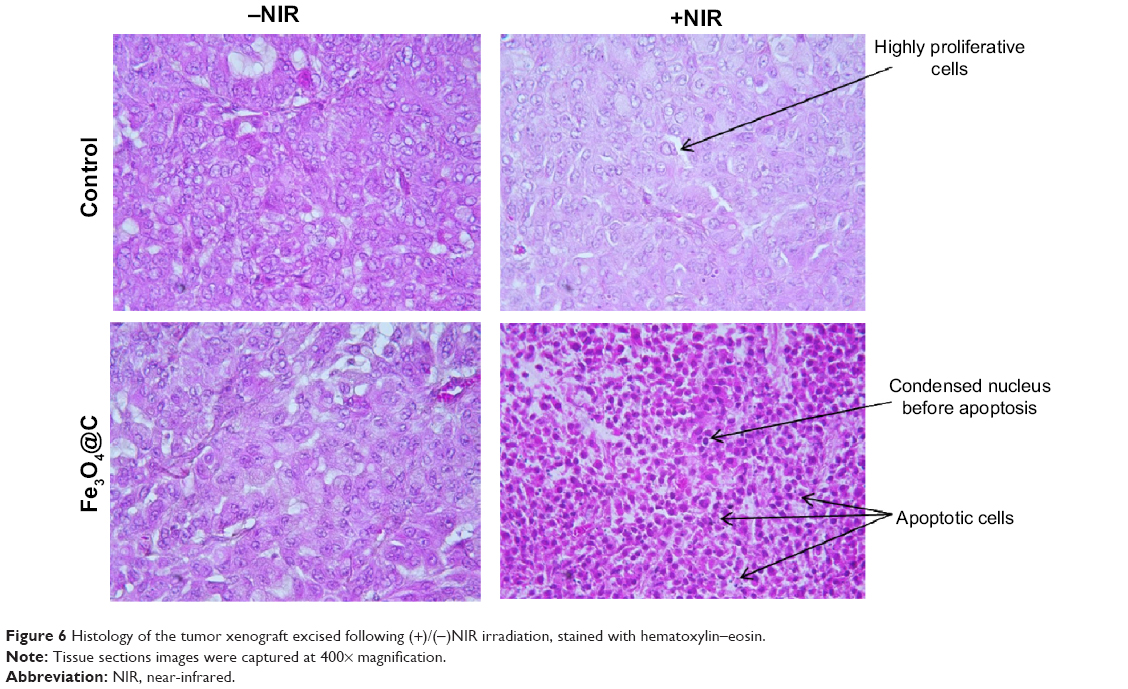 | Figure 6 Histology of the tumor xenograft excised following (+)/(-)NIR irradiation, stained with hematoxylin–eosin. |
To confirm that these therapeutic effects are influenced by the particle distribution, the iron concentration in tumor tissue was measured using ICP-MS (Figure 7A). The tumor xenograft iron concentration from mice injected with Fe3O4@C particles was 1.5-fold higher on average than in the control mice, and the difference was significant (P<0.05). The particles tissue distribution was confirmed by iron-specific staining of a tissue slide. Figure 7B shows that particles were distributed in the tumor tissue, but iron was not detected in the other tissues (data not shown). As a result, Fe3O4@C showed a sufficient activity as a heat inducer so they could be used for tumor xenograft in vivo PTT.
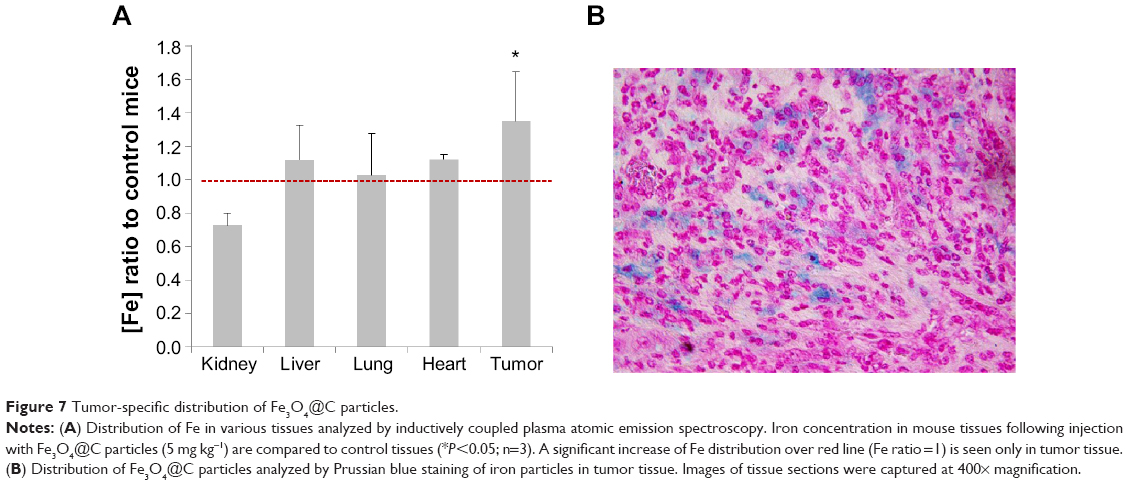 | Figure 7 Tumor-specific distribution of Fe3O4@C particles. |
The fate of the particles administered by intratumoral injection was expected to be a target of phagocytosis, and clearance from the body would happen after the entrance of the particles into blood circulation. To give an insight into localization or clearance of Fe3O4@C in normal tissues during blood circulation, we analyzed the particle concentration in liver and kidney for 1 hour, 2 hours, 4 hours, 8 hours, and 24 hours followed by intravenous injection of the particles. As shown in Figure S4, the particles were not significantly accumulated in liver tissue at 24 hours, and the increment at 8 hours in kidney returned to background level at 24 hours.
The power of NIR irradiation and the amount of particles injected at the tumor site was similar to the cases of graphene and CNTs.33–36
Because the therapeutic effect was visible after a single dose of NIR radiation, the Fe3O4@C prepared in this study have large potential for clinical applications. Based on a recent study that showed localized therapy to be an effective option for the treatment of inoperable tumors and for prevention of local tumor recurrence,37 the Fe3O4@C particles tested in this study show great potential for PTT via local administration. Furthermore, the use of such particles proves advantageous in relation to the therapy cost–benefit aspect and sample preparation complexity.
Conclusion
In this study, GC-encapsulated Fe3O4@C particles were prepared using a single precursor and their physicochemical properties were evaluated. The overheating effects of Fe3O4@C core-shell particles under NIR irradiation were investigated, and the resultant thermoablation was assessed in vitro. The particles rapidly generated heat that caused >98% cell death within 10 minutes of NIR laser irradiation. These results imply that the modality was successfully achieved by one-pot synthesis.
Photothermal therapeutic effects were clearly observed by intratumoral delivery of Fe3O4@C particles into a tumor mass and showed high potential for tumor therapy. In this study, significant reduction of xenograft tissue was observed after 1 week, by localization of the particles in the tumor tissue followed by NIR irradiation once. In conclusion, the GC-coated magnetic particles with potential for cancer treatment were successfully prepared by this one-pot synthesis, which could provide promising materials for future clinical applications.
Acknowledgments
This study was supported in part by the Ministry of Science, ICT and Future Planning of the Republic of Korea (Daegu Gyeongbuk Institute of Science and Technology Basic Research Fund 14-NB-01). This work was also partially supported by the Daegu Gyeongbuk Institute of Science and Technology R&D Programs (14-BD-01). We thank Korea Basic Science Institute for providing assistance in the use of the Bio-TEM and the Ultra microtome. We also thank Daegu Gyeongbuk Institute of Science and Technology Center for Core Research Facilities for providing assistance in the use of the field-emission TEM and EDS.
Disclosure
The authors report no conflicts of interest in this work.
References
Tang S, Chen M, Zheng N. Sub-10-nm Pd nanosheets with renal clearance for efficient near-infrared photothermal cancer therapy. Small. 2014;10:3139–3144. | ||
Liu J, Han J, Kang Z, et al. In vivo near-infrared photothermal therapy and computed tomography imaging of cancer cells using novel tungsten-based theranostic probe. Nanoscale. 2014;6:5770–5776. | ||
Yang K, Zhang S, Zhang G, Sun X, Lee ST, Liu Z. Graphene in mice: ultrahigh in vivo tumor uptake and efficient photothermal therapy. Nano Lett. 2010;10:3318–3323. | ||
Yi XM, Wang FL, Qin WJ, Yang XJ, Yuan JL. Near-infrared fluorescent probes in cancer imaging and therapy: an emerging field. Int J Nanomed. 2014;9:1347–1365. | ||
Yang K, Hu L, Ma X, et al. Multimodal imaging guided photothermal therapy using functionalized graphene nanosheets anchored with magnetic nanoparticles. Adv Mater. 2012;24:1868–1872. | ||
Li JL, Tang B, Yuan B, Sun L, Wang XG. A review of optical imaging and therapy using nanosized graphene and graphene oxide. Biomaterials. 2013;34:9519–9534. | ||
Akhavan O, Meidanchi A, Ghaderid E, Khoei S. Zinc ferrite spinel-graphene in magneto-photothermal therapy of cancer. J Mater Chem B. 2014;2:3306–3314. | ||
Song J, Kim S, Yoon S, Cho D, Jeong Y. Enhanced spinnability of carbon nanotube fibers by surfactant addition. Fiber Polym. 2014;15:762–766. | ||
Fan Z, Wang J, Wang Z, et al. One-pot synthesis of graphene/hydroxyapatite nanorod composite for tissue engineering. Carbon N Y. 2014;66:407–416. | ||
Sinclair R, Li H, Madsen S, Dai H. HREM analysis of graphite-encapsulated metallic nanoparticles for possible medical applications. Ultramicroscopy. 2013;134:167–174. | ||
Zhao M, Song H. Synthesis of carbon-encapsulated iron carbide/iron nanoparticles from phenolic-formaldehyde resin and ferric nitrate. Mater Chem Phys. 2010;124:861–864. | ||
Masotti A, Caporali A. Preparation of magnetic carbon nanotubes (Mag-CNTs) for biomedical and biotechnological applications. Int J Mol Sci. 2013;14:24619–24642. | ||
Seo WS, Lee JH, Sun X, et al. FeCo/graphitic-shell nanocrystals as advanced magnetic-resonance-imaging and near-infrared agents. Nat Mater. 2006;5:971–976. | ||
Song X, Gong H, Yin S, et al. Ultra-small iron oxide doped polypyrrole nanoparticles for in vivo multimodal imaging guided photothermal therapy. Adv Funct Mater. 2014;24:1194–1201. | ||
Tsoufis T, Douvalis AP, Lekka CE, Trikalitis PN, Bakas T, Gournis D. Controlled preparation of carbon nanotube-iron oxide nanoparticle hybrid materials by a modified wet impregnation method. J Nanopart Res. 2013;15:1924–1941. | ||
Tristão JC, Oliveira AAS, Ardisson JD, Dias A, Lago RM. Facile preparation of carbon coated magnetic Fe3O4 particles by a combined reduction/CVD process. Mater Res Bull. 2011;46:748–754. | ||
Qiu J, Li Y, Wang Y, Zhao Z, Zhou Y, Wang Y. Synthesis of carbon encapsulated nickel nanocrystals by arc-discharge of coal based carbon in water. Fuel. 2004;83:615–617. | ||
Yu F, Wang JN, Sheng ZM, Su LF. Synthesis of carbon encapsulated magnetic nanoparticles by spray pyrolysis of iron carbonyl and ethanol. Carbon N Y. 2005;43:3018–3021. | ||
Abdullaeva Z, Omurzak E, Iwamoto C, et al. Onion-like carbon-encapsulated Co, Ni, and Fe magnetic nanoparticles with low cytotoxicity synthesized by a pulsed plasma in a liquid. Carbon N Y. 2012;50:1776–1785. | ||
Zhao N, Wu S, He C, et al. One-pot synthesis of uniform Fe3O4 nanocrystals encapsulated in interconnected carbon nanospheres for superior lithium storage capability. Carbon N Y. 2013;57:130–138. | ||
Lee DH, Seo SD, Lee GH, Hong HS, Kim DW. One-pot synthesis of Fe3O4/Fe/MWCNT nanocomposites via electrical wire pulse for Li ion battery electrodes. J Alloys Compd. 2014;606:204–247. | ||
Zhu J, Wei S, Gu H, et al. One-pot synthesis of magnetic graphene nanocomposites decorated with Core@Double-shell nanoparticles for fast chromium removal. Environ Sci Technol. 2012;46:977–985. | ||
Shanmugam S, Gabashvili A, Jacob S, Yu JC, Gedanken A. Synthesis and characterization of TiO2@C core-shell composite nanoparticles and evaluation of their photocatalytic activities. Chem Mater. 2006;18:2275–2282. | ||
Mayta H, Talley A, Gilman RH, et al. Differentiating Taenia solium and Taenia saginata infections by simple hematoxylin-eosin staining and PCR-restriction enzyme analysis. J Clin Microbiol. 2000;38:133–137. | ||
Hua Q, Huang W. Chemical etching induced shape change of magnetite microcrystals. J Mater Chem. 2008;18:4286–4290. | ||
Tuinstra F, Koenig JL. Raman spectrum of graphite. J Chem Phys. 1970;53:1126–1130. | ||
Roca AG, Morales MP, O’Grady K, Sema CJ. Structural and magnetic properties of uniform magnetite nanoparticles prepared by high temperature decomposition of organic precursors. Nanotechnology. 2006;17:2783–2788. | ||
Raffa V, Ciofani G, Vittorio O, Riggio C, Cuschieri A. The ways of endocytosis. Nanomedicine. 2010;5:89–97. | ||
Li Y, Yuan H, von dem Bussche A, et al. Graphene microsheets enter cells through spontaneous membrane penetration at edge asperities and corner sites. Proc Natl Acad Sci U S A. 2013;110:12295–12300. | ||
Lacerda L, Russier J, Pastorin G, et al. Translocation mechanisms of chemically functionalised carbon nanotubes across plasma membranes. Biomaterials. 2012;33:3334–3343. | ||
Markovic ZM, Harhaji-Trajkovic LM, Todorovic-Markovic BM, et al. In vitro comparison of the photothermal anticancer activity of graphene nanoparticles and carbon nanotubes. Biomaterials. 2011;32:1121–1129. | ||
Zhou J, Wang X, Du L, et al. Effect of hyperthermia on the apoptosis and proliferation of CaSki cells. Mol Med Rep. 2011;4:187–191. | ||
Shanmugam V, Selvakumar S, Yeh CS. Near-infrared light-responsive nanomaterials in cancer therapeutics. Chem Society Rev. 2014;43:6254–6287. | ||
Ding X, Singh R, Burke A, et al. Development of iron-containing multiwalled carbon nanotubes for MR-guided laser-induced thermotherapy. Nanomedicine. 2011;6:1341–1352. | ||
Sahu A, Choi WL, Lee JH, Tae G. Graphene oxide mediated delivery of methylene blue for combined photodynamic and photothermal therapy. Biomaterials. 2013;34:6239–6248. | ||
Wang LS, Chuang MC, Ho JA. Nanotheranostics – a review of recent publications. Int J Nanomed. 2012;7:4679–4695. | ||
Wolinsky JB, Colson YL, Grinstaff MW. Local drug delivery strategies for cancer treatment: gels, nanoparticles, polymeric films, rods, and wafers. J Control Release. 2012;159:14–26. |
Supplementary materials
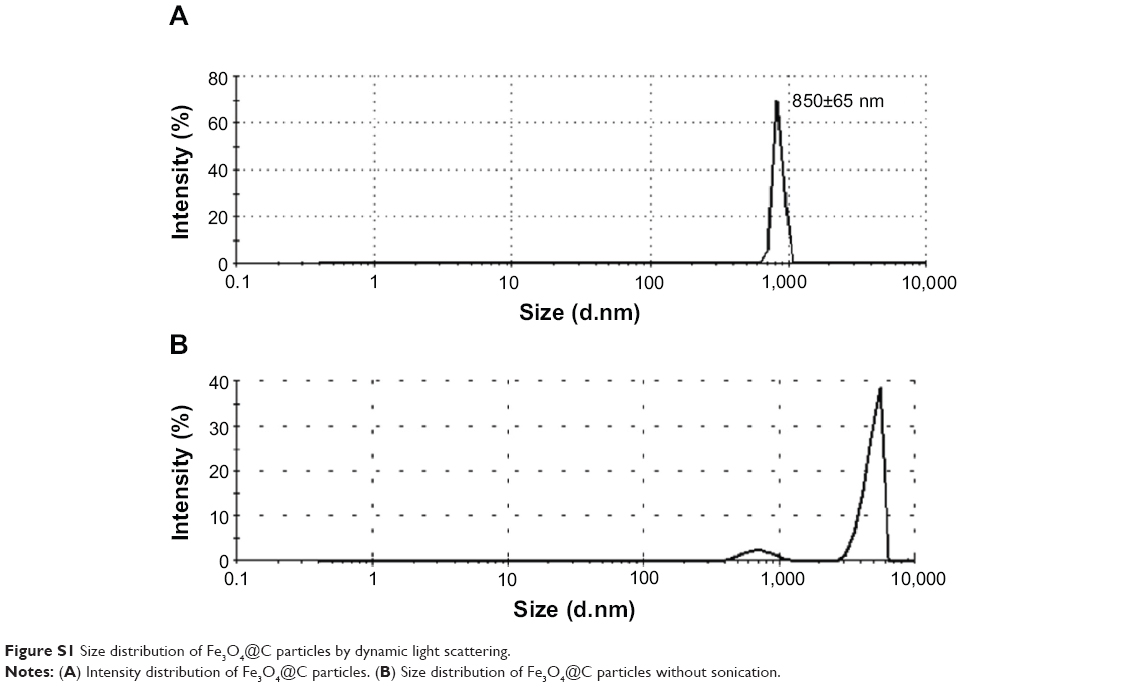 | Figure S1 Size distribution of Fe3O4@C particles by dynamic light scattering. |
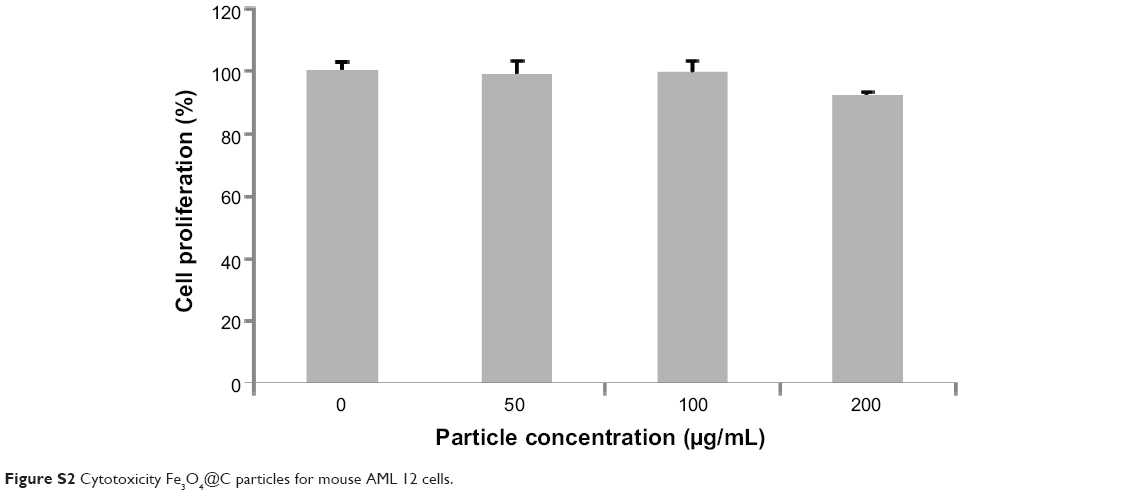 | Figure S2 Cytotoxicity Fe3O4@C particles for mouse AML 12 cells. |
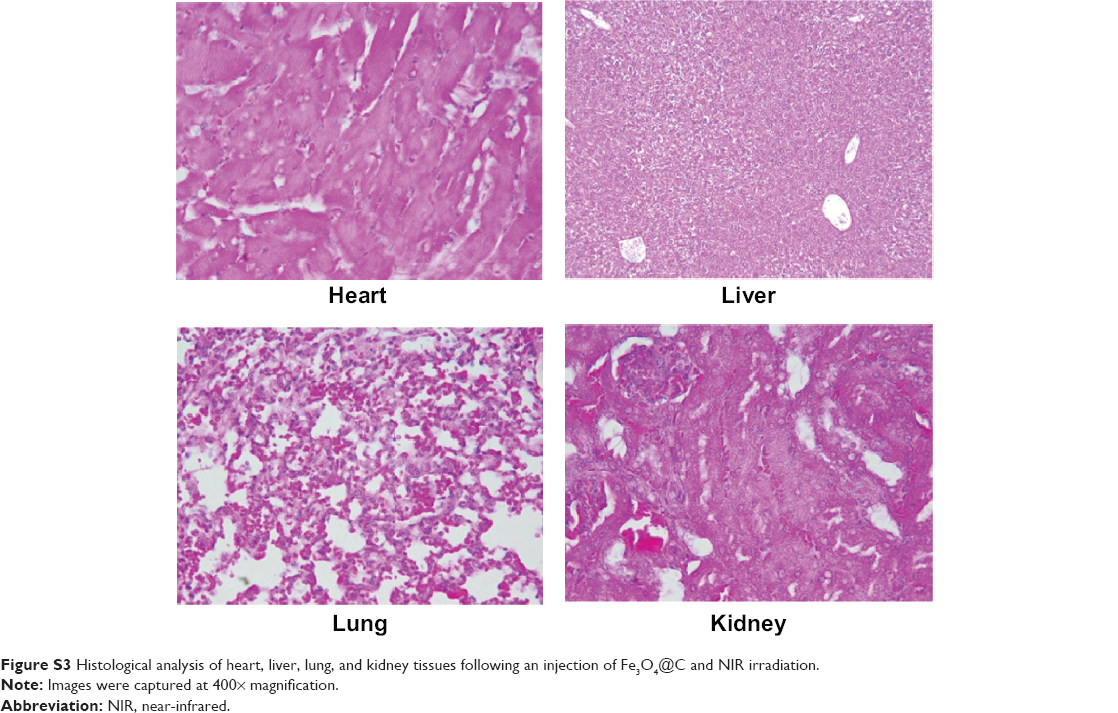 | Figure S3 Histological analysis of heart, liver, lung, and kidney tissues following an injection of Fe3O4@C and NIR irradiation. |
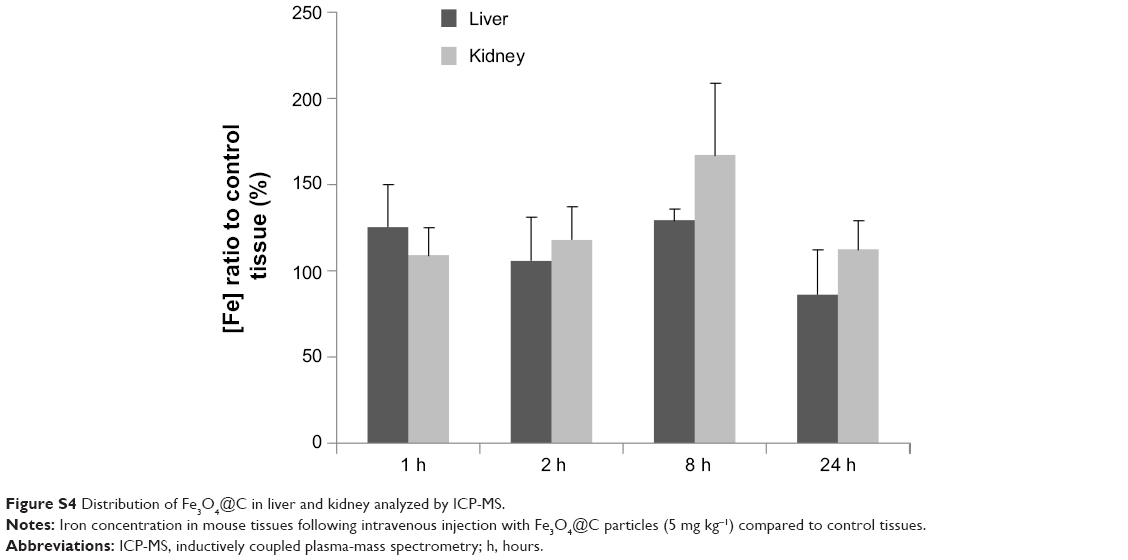 | Figure S4 Distribution of Fe3O4@C in liver and kidney analyzed by ICP-MS. |
 © 2014 The Author(s). This work is published and licensed by Dove Medical Press Limited. The
full terms of this license are available at https://www.dovepress.com/terms
and incorporate the Creative Commons Attribution
- Non Commercial (unported, 3.0) License.
By accessing the work you hereby accept the Terms. Non-commercial uses of the work are permitted
without any further permission from Dove Medical Press Limited, provided the work is properly
attributed. For permission for commercial use of this work, please see paragraphs 4.2 and 5 of our Terms.
© 2014 The Author(s). This work is published and licensed by Dove Medical Press Limited. The
full terms of this license are available at https://www.dovepress.com/terms
and incorporate the Creative Commons Attribution
- Non Commercial (unported, 3.0) License.
By accessing the work you hereby accept the Terms. Non-commercial uses of the work are permitted
without any further permission from Dove Medical Press Limited, provided the work is properly
attributed. For permission for commercial use of this work, please see paragraphs 4.2 and 5 of our Terms.