Back to Journals » Drug Design, Development and Therapy » Volume 11
Phloretin exerts hypoglycemic effect in streptozotocin-induced diabetic rats and improves insulin resistance in vitro
Authors Shen X, Zhou N, Mi L, Hu Z, Wang L, Liu X, Zhang S
Received 8 November 2016
Accepted for publication 7 December 2016
Published 7 February 2017 Volume 2017:11 Pages 313—324
DOI https://doi.org/10.2147/DDDT.S127010
Checked for plagiarism Yes
Review by Single anonymous peer review
Peer reviewer comments 2
Editor who approved publication: Dr Qiongyu Guo
Xin Shen,1,* Nan Zhou,1,* Le Mi,1 Zishuo Hu,2 Libin Wang,1 Xueying Liu,1 Shengyong Zhang1
1Department of Medicinal Chemistry, School of Pharmacy, 2Student Brigade, The Fourth Military Medical University, Xi’an, Shaanxi, People’s Republic of China
*These authors contributed equally to this work
Abstract: The present study investigated the possible antiobesity and hypoglycemic effects of phloretin (Ph). In an attempt to discover the hypoglycemic effect and potential mechanism of Ph, we used the streptozotocin-induced diabetic rats and (L6) myotubes. Daily oral treatment with Ph for 4 weeks significantly (P<0.05) reduced postprandial blood glucose and improved islet injury and lipid metabolism. Glucose consumption and glucose tolerance were improved by Ph via GOD–POD method. Western blot results revealed that the expression of Akt, PI3K, IRS-1, and GLUT4 were upregulated in skeletal muscle of T2D rats and in L6 myotubes by Ph. The immunofluorescence studies confirmed that Ph improved the translocation of GLUT4 in L6 myotubes. Ph exerted hypoglycemic effects in vivo and in vitro, hence it may play an important role in the management of diabetes.
Keywords: phloretin, diabetes, insulin sensitivity, blood glucose consumption, skeletal muscle
Introduction
Natural products isolated from fruit extracts have been associated with many positive health benefits,1 such as being anticancer,2–4 antioxidant,5,6 anti-inflammatory,7 and antiobesity.8 More recently, much attention has been paid to flavonoids, a group of phenolic compounds, which have been shown to reduce the risk of major chronic diseases, such as obesity and diabetes.9 Phloretin (2′,4′,6′-trihydroxy-3-(4-hydroxyphenyl)-propiophenone, Ph, Figure 1), a dihydrochalcone, which is the main component of the chalcone class of flavonoids, exists in apples,10 pears, and strawberries.11 It has been confirmed that Ph exerts widely biological effects, including antioxidant, antitumor, and anti-inflammatory properties, and alleviates vascular endothelial dysfunction and liver injury.4,12–14
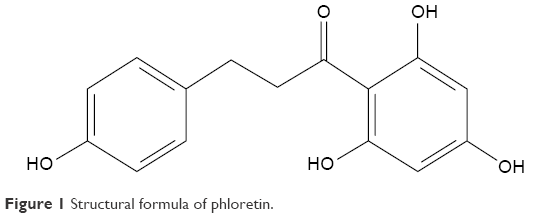 | Figure 1 Structural formula of phloretin. |
Diabetes, in particular type 2 diabetes, is one of the major worldwide health problems.15 Each year more and more people live with this condition, which can result in life-changing complications. The International Diabetes Federation estimated that 415 million adults would have diabetes in 2015; also, there were 318 million adults with impaired glucose tolerance, which puts them at high risk of developing the disease in the future.16
Diabetes is a kind of metabolic disorder caused by various etiologies; type 2 diabetes (T2D) is mainly due to the decrease of insulin secretion and the defects with insulin resistance (IR) of the target tissues, such as liver, skeletal muscle, and adipose tissue.17 Insulin mainly regulates blood glucose by PI3K/Akt (phosphoinositide-3-kinase/protein kinase B) signaling pathway.18 When blood glucose increases in animals or human beings, insulin produced by beta cells passes into the bloodstream. Insulin can bind to insulin receptor (IR) and activate IR tyrosine kinase, which activates IR substrate (IRS). Subsequently, the activated IRS recruits and activates the phosphatidylinositol 3-kinase (PI3K) and protein kinase B (also known as Akt), leading to glucose transportation, glucagon synthesis, and inhibiting gluconeogenesis in the liver and skeletal muscle.19–21 Moreover, the activated PI3K/Akt signaling pathway promotes glucose transport 4 (GLUT4) protein translocated to the cell membrane, facilitating the uptake of glucose into the cells.22
However, the potential effects of muscle insulin sensitivity associated with Ph remains unknown. Therefore, this study was designed to establish a T2D model by feeding rats with a high-sugar and high-fat diet in combination with a small dose of streptozotocin (STZ) injection, then explored the antihyperglycemic effect of Ph on T2D rats and the relationship with PI3K/Akt signaling pathway. The molecular mechanisms of the insulin sensitivity action of Ph in cultured skeletal muscle cells as an insulin-responsive model were also evaluated, the results of which are promising for new targets and drugs for clinical treatment of T2D.
Materials and methods
Chemicals and materials
Ph (LOT Number XC20140403, purity >99%) was purchased from Xi’an Plants of Grass Technology Co. Ltd. (Shannxi, People’s Republic of China). Metformin hydrochloride, 6-[4-(2-piperidin-1-ylethoxy)phenyl]-3-pyridin-4-ylpyrazolo[1,5-a]pyrimidine (CAS Number: 866405-64-3, purity >99%) was purchased from Sigma-Aldrich Inc. (St Louis, MO, USA). STZ was purchased from Sigma-Aldrich Inc. A blood glucose meter and blood glucose test strips were obtained from Johnson & Johnson, Co. (New Brunswick, NJ, USA). All other chemicals were of the highest grade available commercially.
Animals and treatment
All the studies on animals were carried out in accordance with the Guidelines for the Care and Use of Laboratory Animals. The experimental protocol (20150701) involving animals was reviewed and approved by the Institutional Animal Care and Use Committee of the Fourth Military Medical University. Ninety 8-week-old, healthy, specific pathogen-free, male Sprague Dawley (SD) rats weighing 160±15 g were supplied by the Experimental Animal Center of Fourth Military Medical University (Xi’an, People’s Republic of China). All rats were housed in internally flawless animal rooms with constant temperature (23°C±2°C) and humidity (55%±10%). The room was kept in a 12 h light/dark cycle and the rats had unrestricted food and water. After feeding for 3 days,23 they were randomly divided into three groups: 1) Con group (n=15): fed with normal diet and received 0.5% (w/v) CMC-Na as control (after STZ injection); 2) ConPh group (n=15): fed with normal diet and received 100 mg/kg Ph (after STZ injection); 3) vehicle group (n=60): fed with high-fat and high-sugar diet (contained 10% lard, 20% sucrose, 0.25% bilesalt, and 1% cholesterol, HFS diet) for 8 weeks.24 After that, the vehicle rats were starved overnight and then injected once intraperitoneally (ip) with 30 mg/kg of STZ (freshly dissolved in sodium citrate buffer, pH =4.0, prepared on ice and protected from light) to induce diabetes. Seventy-two hours after injection, the vehicle rats with blood glucose level ≥11.1 mmol/L were considered as T2D rats and used in future experiments.25,26 Then the T2D rats were divided into four groups randomly: 1) TD group (n=15) received 0.5% (w/v) CMC-Na as vehicle; 2) Pre group (n=15) received 100 mg/kg Ph (dissolved in 0.5% [w/v] CMC-Na, 4 weeks before STZ injection); 3) Ph group (n=15) received 100 mg/kg Ph (after STZ injection); 4) Tr group (n=15) received 250 mg/kg metformin (dissolved in 0.5% [w/v] CMC-Na, after STZ injection). The concentration of Ph was determined by preexperiments. Each group was fed through gastric gavage for 4 weeks to verify the hypoglycemic effect of Ph. Body weight, food consumption, and postprandial blood glucose (PBG) were monitored every week. The whole experiment was summarized in the flow chart (Figure 2).
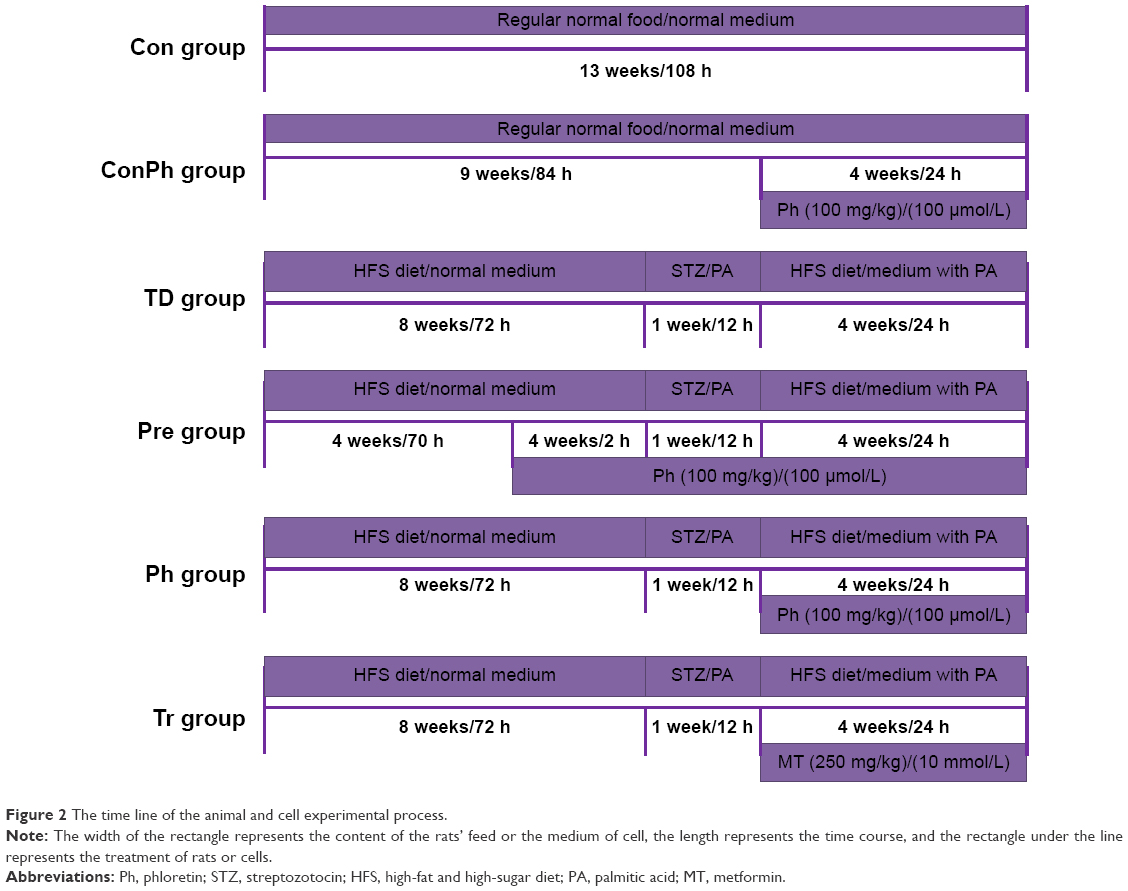 | Figure 2 The time line of the animal and cell experimental process. |
At the end of Ph administration, blood samples were collected for separating serum after a 12 h fast. Then all rats were killed, and organs and tissues frozen and prepared for testing. Part of the pancreas was fixed with 4% paraformaldehyde, embedded in paraffin, and sequentially sectioned. After hematoxylin/eosin (HE) staining, a section of each block was observed at a magnification of 400.27
Oral glucose tolerance test
At the end of 12 weeks, all rats were made to fast for 12 h before the test. They were given 2 g/kg 50% glucose solution by gavage. Then, blood samples were collected from the tail vein at 0, 15, 30, 60, 90, and 120 min after glucose loading for measurement using the blood glucose meter. The areas under the curve (AUC) values for glucose were calculated using the trapezoidal method.28
Serum analyses
PBG in each group was monitored by blood glucose meter. Fasting serum levels of free fatty acids (FFAs), triacylglycerol (TG), total cholesterol (TC), and low-density lipoprotein (LDL) in each group were detected using corresponding commercial kits (Biosino, Beijing, People’s Republic of China). Fasting serum insulin levels were measured by commercial radioimmunoassay kit (Huaying, Beijing, People’s Republic of China) performed in duplicate. The HOMA of insulin resistance index (HOMA-IR) was used to assess insulin resistance.29
Cell culture
The myoblast cell line (L6) was obtained from Chinese Academy of Sciences and maintained at 37°C, 95% O2, and 5% CO2 in low-glucose DMEM supplemented with 10% FBS serum and antibiotics. Myoblasts were subcultured onto six-well plates, grown to 80%–90% confluence, and then differentiated into myotubes by altering media to contain 2% equine serum.30 L6 skeletal muscle cells were considered to be L6 myotubes after 96 h of differentiation in differentiation medium.31
The cells were also divided into six groups for different treatments (Figure 2). Palmitic acid (Sigma) was dissolved in 0.1 mol/L of NaOH at 70°C, and then mixed with 20% (w/v) bovine serum albumin (BSA, low FFA, Sigma). The mixtures were kept in water bath at 55°C for 1 h, then filtered after cooling to be the stock of 10 mM of PA/20% BSA, and stored at −20°C.32 Cells were preincubated in the presence or absence of Ph in the dosage of 100 μmol/L for 2 h, and then stimulated with or without 0.4 mM of PA for 12 h.
Cell viability assay
L6 myotubes were incubated with DMSO or test compounds for 36 h. PBS-buffered 3-(4,5-dimethylthiazol-2-yl)-2,5-diphenyltetrazolium bromide (MTT) (10 μL, 5 mg/mL) solution was added to each well and the plates were incubated at 37°C for another 4 h. Then the medium was discarded and the formazan blue that formed in the cells was dissolved in DMSO. The optical density was measured using a microplate spectrophotometer (Bio Tek, Winooski, VT, USA) at 570 nm.
Glucose consumption assay
L6 myotubes were cultured in 96-well culture plates. When experiments were conducted, the differentiation culture medium was replaced by DMEM supplemented with 0.25% (w/v) BSA containing DMSO (Con), 0.4 mM of PA (IR), Ph 1, 50, 100, and 200 μmol/L (Ph1, Ph2, Ph3, Ph4), and 10 mmol/L metformin (Tr). The glucose concentration in the medium was determined by the glucose oxidase and peroxidase (GOD-POD) method after 24 h of treatment.33 The glucose concentration of the wells with cells was subtracted from the glucose concentration of the blank wells to obtain the amount of glucose consumption.
Western blot analysis
Western blot analysis was performed as previously described.34 Skeletal muscle tissue homogenates or total cells were lysed in RIPA lysis buffer (pH 8.0, 50 mmol/L Tris, 150 mmol/L NaCl, 0.02% sodium azide, 0.1% SDS, 1% NP-40, 0.5% sodium deoxycholate, 1 mmol/L EDTA) and soon supplemented with a phenylmethanesulfonyl fluoride (1 mmol/L; Sigma), protease, and phosphatase inhibitor cocktail (100×; Thermo Fisher Scientific, Waltham, MA, USA). Equal amounts of protein samples were separated by 10% (v/v) sodium dodecyl sulfate-polyacrylamide gel electrophoresis (SDS-PAGE) and transferred onto a polyvinylidene difluoride (PVDF) membrane. After washing, the membranes were incubated overnight at 4°C with one of the following primary antibodies: rabbit polyclonal antibodies against Akt, P-Akt (Thr308), GLUT4, PI3K (p85), and IRS-1 (1:1,000; Abcam, Cambridge, UK), and Actin (1:1,000; CMCTAG, San Diego, CA, USA). After further washing, the membranes were incubated for 1 h with corresponding horseradish peroxidase-conjugated secondary antibodies (anti-rabbit IgG or anti-mouse IgG, 1:10,000; ComWin Biotech Co., Ltd., Beijing, People’s Republic of China). Immunoreactive bands were visualized using an enhanced chemiluminescent substrate (Thermo Fisher Scientific, Rockford, IL, USA) with a GE ImageQuant LAS 4000 mini (GE healthcare, Waukesha, WI, USA). The intensity of protein bands was quantitated using a Gel Doc XR System (Bio-Rad, Hercules, CA, USA).
Confocal laser scanning fluorescence microscopy assay
L6 myotubes were grown on glass cover lips. After the treatment, the cells were washed with PBS (Shenggong, Shanghai, People’s Republic of China), fixed for 30 min at room temperature with 4% (w/v) paraformaldehyde (Boster, Wuhan, People’s Republic of China), permeabilized with 1% (v/v) TritonX-100 in PBS for 10 min at room temperature, and then blocked with goat serum for 1 h.35 After washing, the cells were incubated overnight with anti-GLUT4 antibody (1:100) in goat serum and then incubated for 1 h with fluorescein isothiocyanate-conjugated secondary antibody (goat anti-rabbit IgG, Cy3 Conjugated, 1:100, ComWin Biotech Co.). The cover slips were mounted on glass slides with antifade mounting media (Invitrogen, Carlsbad, CA, USA), and images were collected using an Olympus Confocal Microscope model FV1000 at 800×600 pixel resolution with a 60× objective lens (Carl Zeiss, Oberkochen, Germany). No fluorescence crossover was observed between the channels, and images were collected separately using the appropriate laser excitation wavelength and then merged.36
Statistical analysis
Values are expressed as mean ± SE. Two-way Analysis of Variance (ANOVA) was used to test homogeneity for variance and Tukey’s test was applied to test the significance of differences between multiple groups. Values of P<0.05 were considered statistically significant.
Results
Ph improved glucose and lipid metabolism in rats with STZ-induced diabetes
At the beginning of the experiment, the PBG was not significantly different in all groups. After the high-fat and high-sugar diet for 56 days, the rats were injected STZ intraperitoneally and the PBG of the rats had an obvious rise, except the Pre group. The Ph treatment resulted in a decrease of PBG over the same period (Figure 3A). Correspondingly, at the end of experiment, the PBG was clearly reduced by Ph treatment (Figure 3B). Ph administration resulted in a significant reduction of serum FFA, TG, TC, and LDL levels (Figure 3C–F). Hyperinsulinemia and insulin resistance also significantly improved after Ph treatment compared with the corresponding TD rats (Figure 3G and H). As a positive control, metformin achieved similar improvements in glucose, lipid, and insulin metabolism (Figure 3).
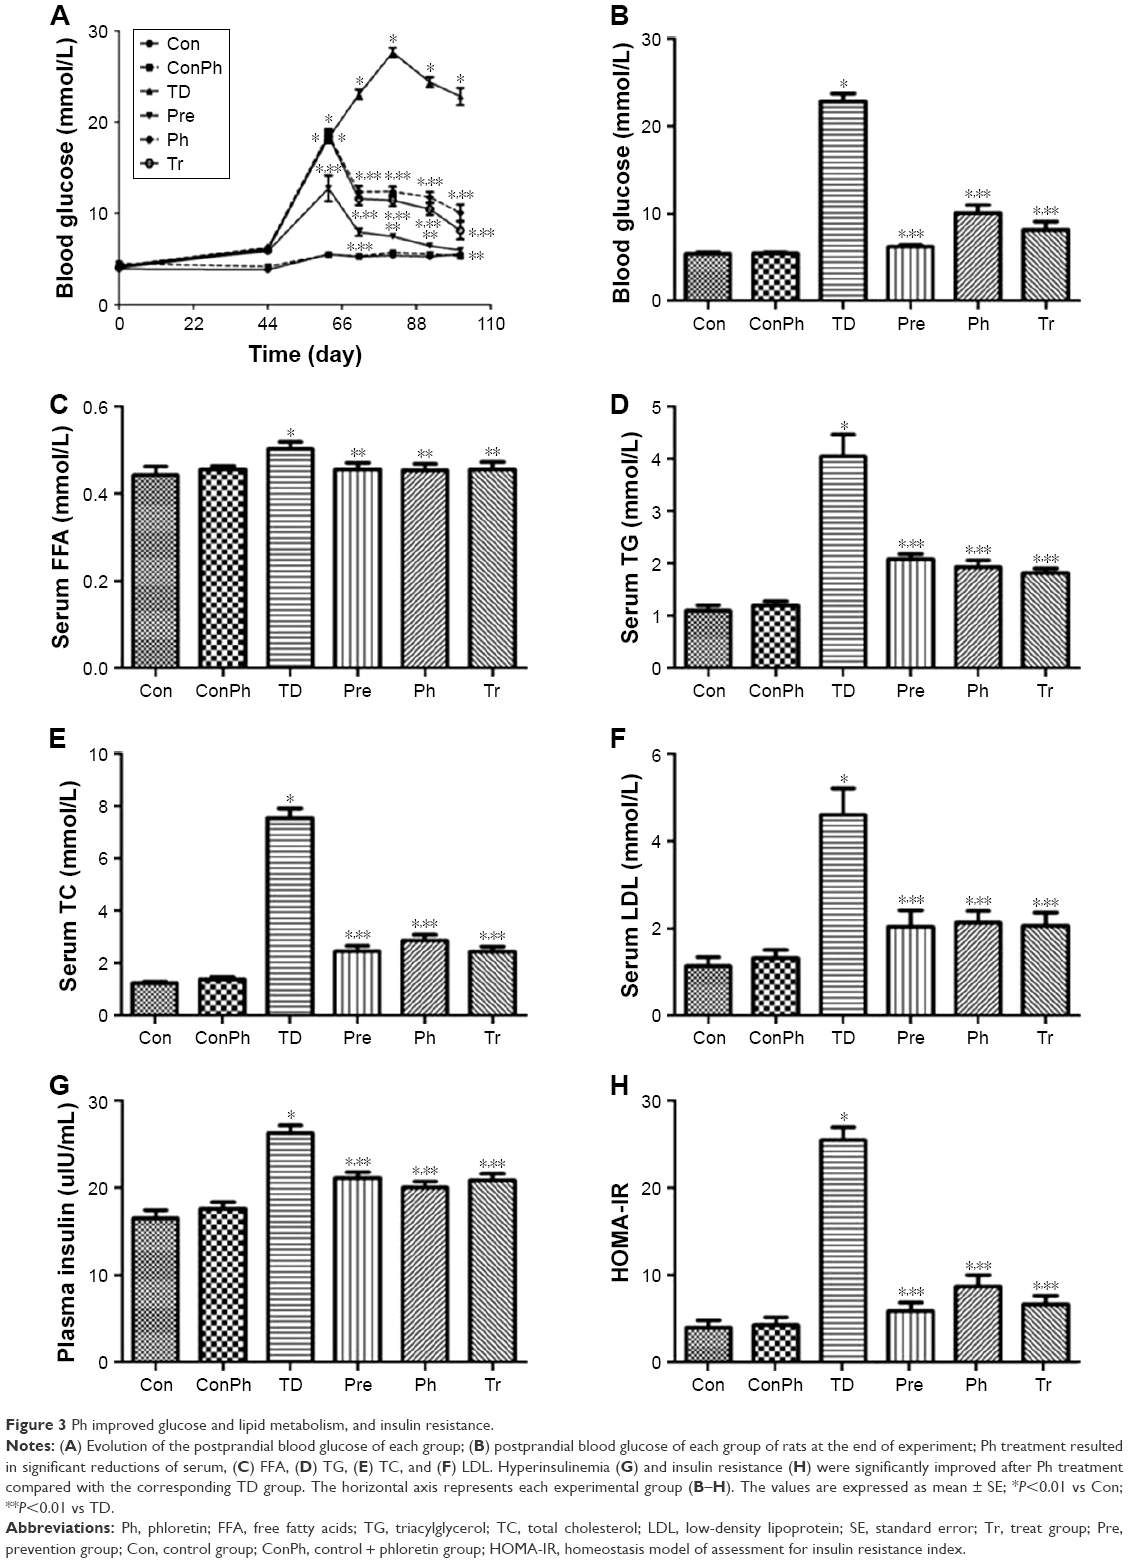 | Figure 3 Ph improved glucose and lipid metabolism, and insulin resistance. |
Effect of Ph on OGTT
At the end of the experiment, the OGTT results showed that the blood glucose of the TD group increased rapidly and remained at a high level compared with the Con group, whereas the blood glucose of the Pre, Ph, and Tr groups declined rapidly after the 30-min peak (Figure 4A). Compared with the TD group, the glucose AUC in the Pre, Ph, and Tr groups showed a significant decrease of 31.7%, 20.0%, and 29.9%, respectively (Figure 4B).
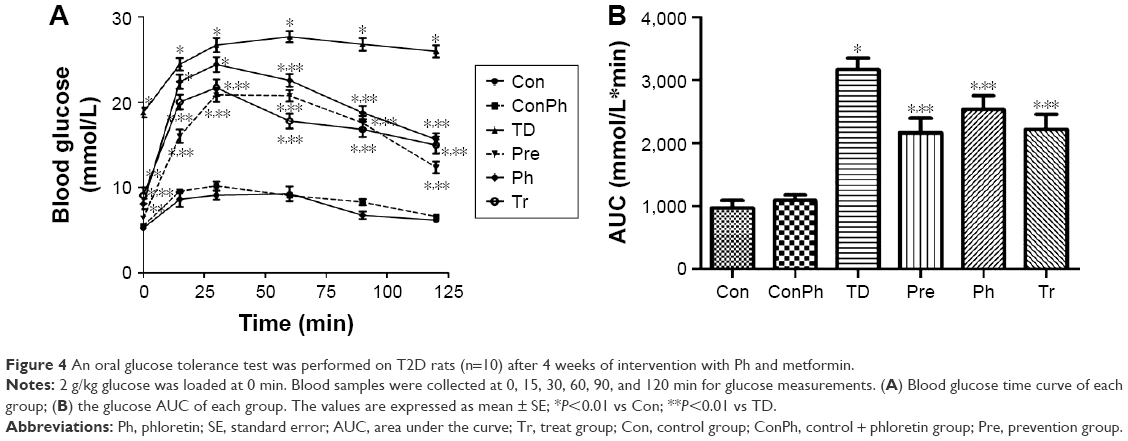 | Figure 4 An oral glucose tolerance test was performed on T2D rats (n=10) after 4 weeks of intervention with Ph and metformin. |
Ph improved islet injury in T2D rats
HE staining showed that pancreatic islets were regularly round or elliptical and had clear boundaries in the Con group. There was no change between the Con and ConPh groups. Compared with the Con rats, the number of islets in the TD group was obviously lower; meanwhile the islets were atrophied and had no clear boundaries. However, Ph and metformin treatments markedly improved the pathologic damage, especially in the Pre group (Figure 5).
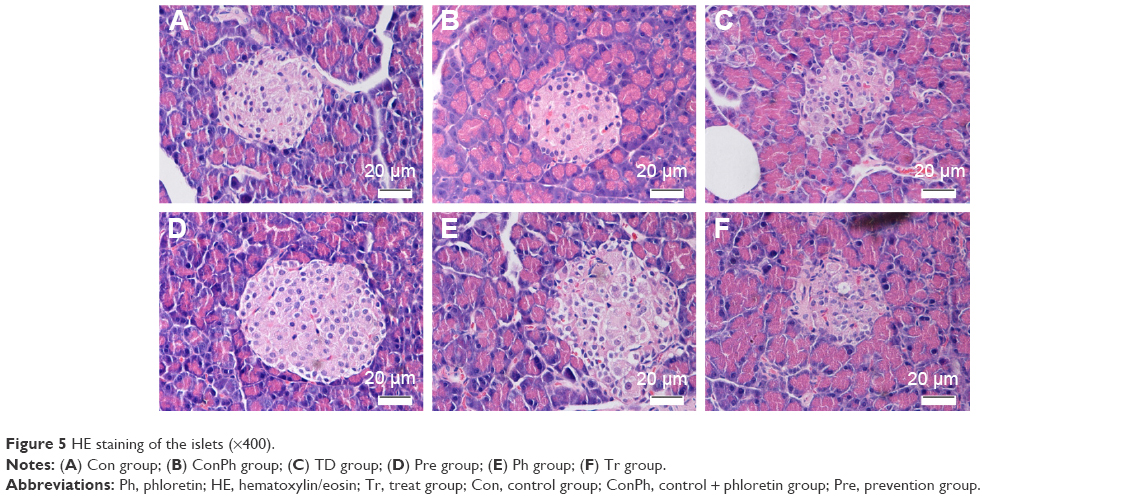 | Figure 5 HE staining of the islets (×400). |
Ph improved glucose metabolism and had no cytotoxicity in vitro
To examine whether Ph exerts toxic effects in L6 myotubes, MTT assays were conducted. The MTT data suggested that Ph had no cytotoxicity in our experimental system, as it did not influence cell viability at concentrations ranging from 1 to 100 μmol/L. Interestingly, 200 μmol/L Ph showed the promotion of cell proliferation (Figure 6A). To investigate the mechanisms of Ph action, we examined glucose consumption in L6 myotubes. Compared with the Con group, the glucose consumption was obviously lower in the IR group. However, Ph treatment increased the reduction of glucose consumption caused by PA in a dose-dependent manner, ranging from 1 to 100 μmol/L. The glucose consumption of 200 μmol/L Ph was significantly higher, considering its proliferation effect. As a positive control, metformin (10 mmol/L) also caused a clear increase in glucose consumption (Figure 6B). According to the above assays, we chose 100 μmol/L Ph for the Pre and Ph groups for the next experiments. Pre, Ph, and Tr all could increase the reduction of glucose consumption caused by PA in a time-dependent manner, especially in the Pre group (Figure 6C). After 24 h of different treatments, the results were the same as above and there was no difference between ConPh and Con groups (Figure 6D).
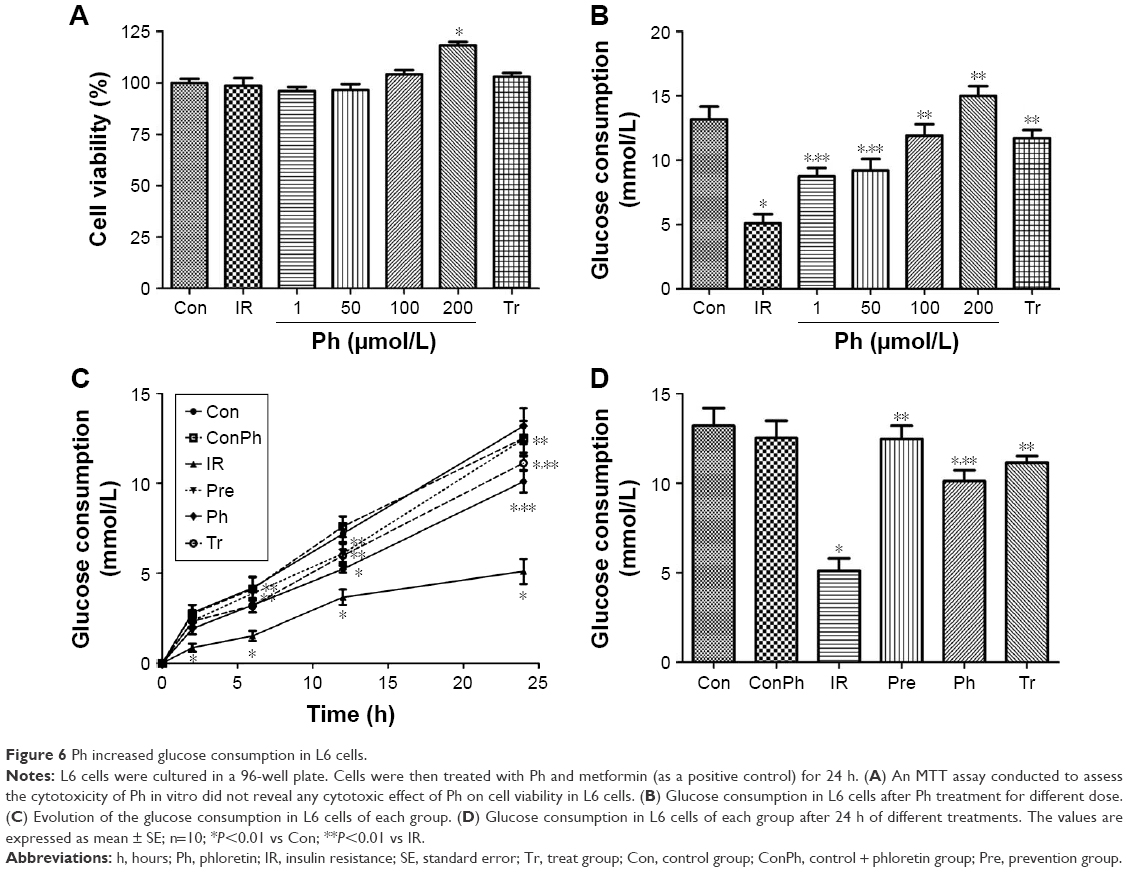 | Figure 6 Ph increased glucose consumption in L6 cells. |
Evaluation of the antidiabetic mechanisms of Ph in vivo and in vitro
To investigate the mechanism of Ph action on diabetes and insulin sensitivity, we next assessed the effects of Ph on the expression of certain proteins that are known to play a critical role in diabetes. As shown in Figure 7A–D, the expression of P-Akt, PI3K, IRS-1, and GLUT4 were upregulated in the skeletal muscle of T2D rats, which declined in the TD group. The same results were also observed in L6 myotubes (Figure 7E–H).
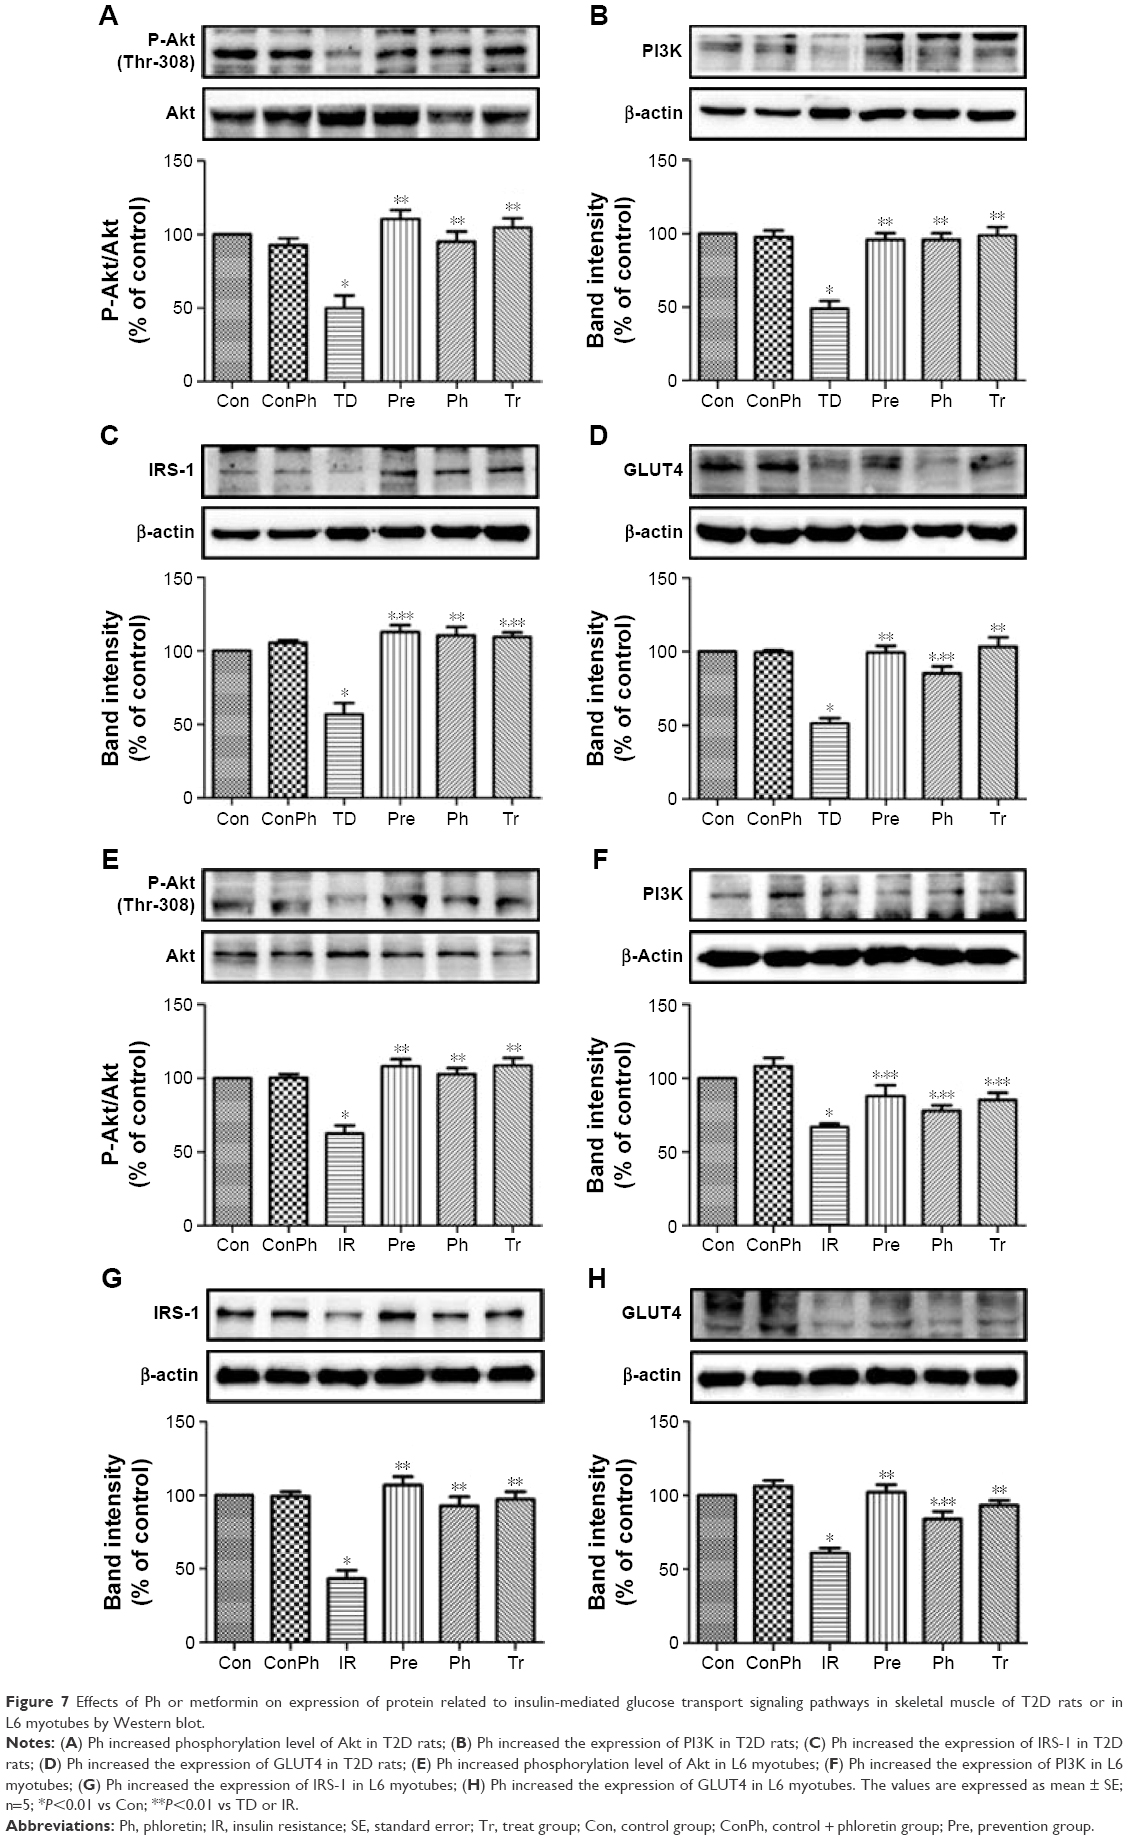 | Figure 7 Effects of Ph or metformin on expression of protein related to insulin-mediated glucose transport signaling pathways in skeletal muscle of T2D rats or in L6 myotubes by Western blot. |
Effect of Ph on GLUT4 expression and translocation
To determine whether Ph stimulates muscle glucose consumption through GlUT4, we used immunofluorescence staining. L6 myotubes were stained for GLUT4 with Cy3 (red) and nuclei were stained with Hoechst 33342 (blue). There was no difference in the expression of GLUT4 between Con and ConPh groups. Compared with the Con group, the expression in the IR group was lower. However, Ph and metformin treatments markedly upregulated this decreased expression (Figure 8). The most important discovery is that Ph promoted the translocation of GLUT4. As shown in the figure, GLUT4 was more distributed in the cell membrane in the Pre and Ph groups.
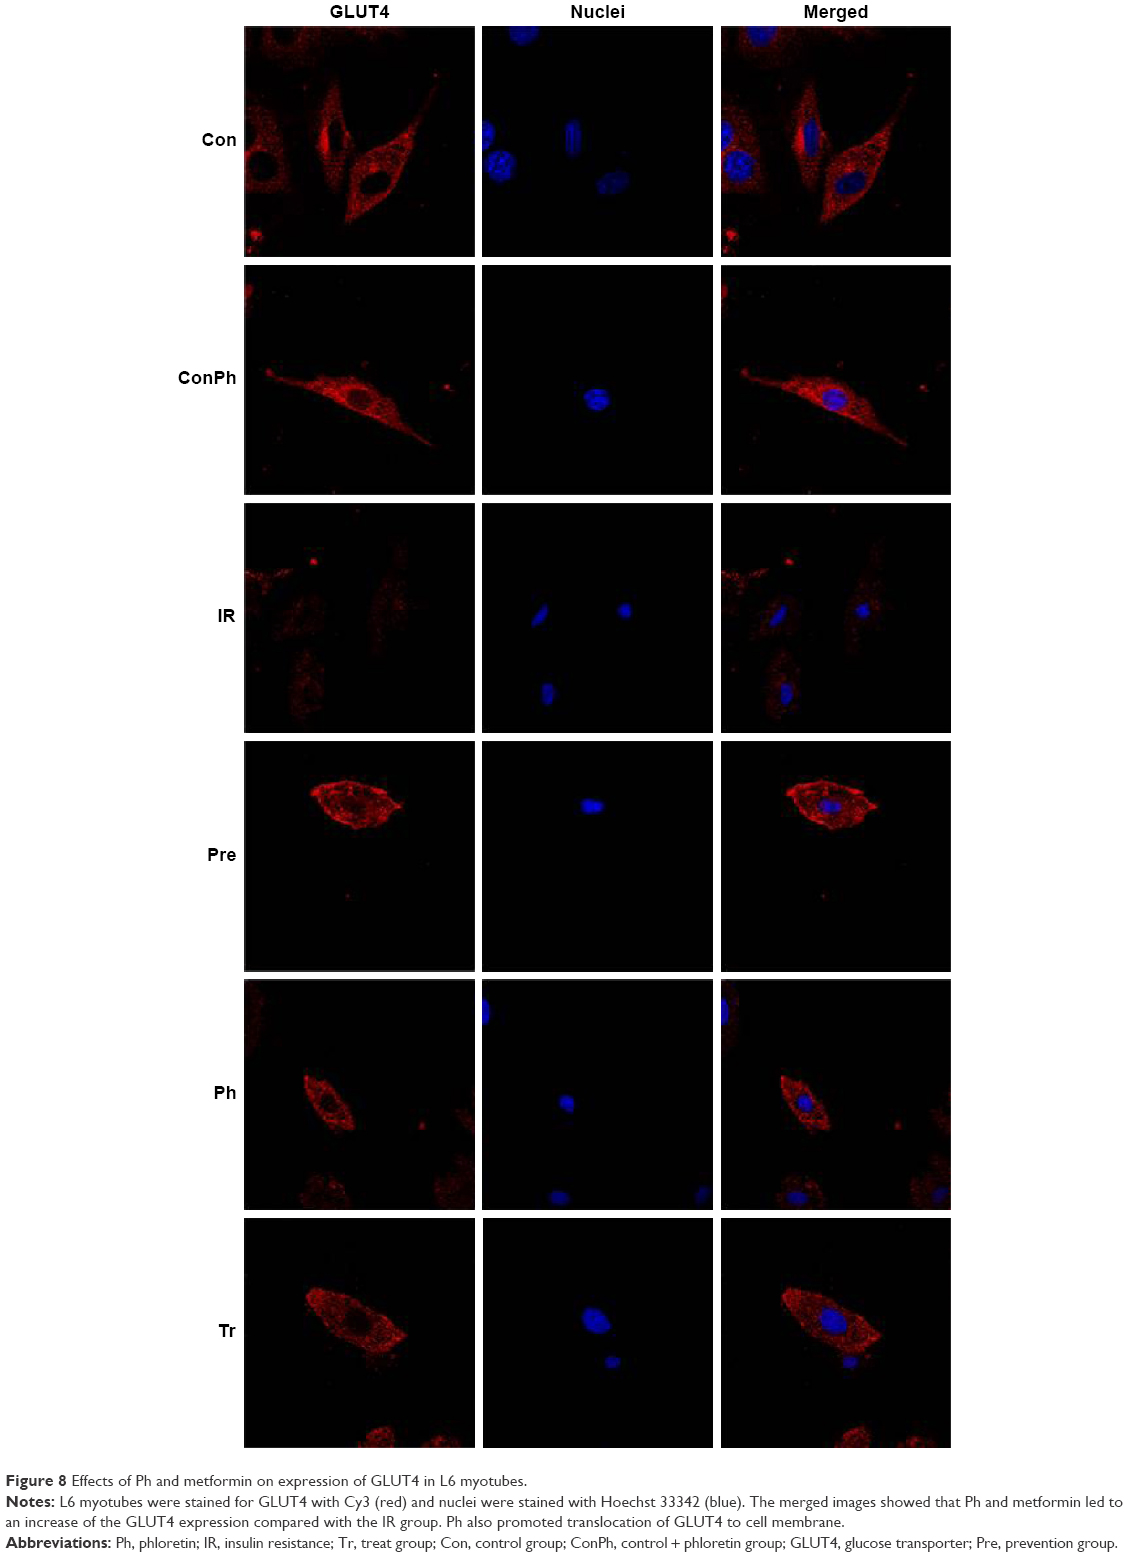 | Figure 8 Effects of Ph and metformin on expression of GLUT4 in L6 myotubes. |
Discussion
Diabetes is one of the most common and serious metabolic diseases of present times. In T2D, also known as noninsulin-dependent diabetes mellitus, the pancreas usually produces enough insulin, but for unknown reasons the body cannot use the insulin effectively, a condition called insulin resistance.37 The chronic disorders related to diabetes apart from hyperglycemia and hyperlipidemia are cardiovascular complications, nephropathy, and retinal damage.38
To model T2D we used the high-fat and high-sugar fed, low-dose STZ-treated rat model. High-fat and high-sugar diet induces insulin resistance in rats.39 STZ selectively impairs pancreatic cells and causes insulin secretion deficiency, which causes dysfunctional glucose disposal and enhanced glucose output, leading to increased blood glucose levels. Long-term hyperglycemia caused by deteriorating insulin receptor kinase activity accelerates the impairment of insulin sensitivity.40 The diabetes in these rats is analogous to the development of human T2D when the decline in hyperinsulinemia is not able to compensate for insulin resistance and results in the development of hyperglycemia.41 In this study, SD rats were fed with high-fat and high-sugar diet for 8 weeks, and then, STZ (30 mg/kg) was intraperitoneally injected to induce diabetes. The experiment lasted 13 weeks. At the end of the study, PBG, FFA, TC, TG, LDL, and insulin levels in diabetic models significantly increased, which suggests the success of the high-glucose and high-lipid diabetic model. However, the underlying mechanisms remain to be clarified and the appropriate cell model was selected to improve that.
The target tissues of insulin are liver, skeletal muscle, and adipose tissue. The L6 was isolated from primary cultures of rat thigh muscles, as they are able to maintain many morphologic and metabolic characteristics of skeletal muscles.42 These cells represent a good, sensitive tool for myotoxicity testing and glucose consumption in skeletal muscle. In this study, L6 myotubes were induced to insulin resistance by PA and the effect of glucose consumption was investigated.
GLUT4 is an insulin-regulated glucose transporter found primarily in adipose, skeletal, or cardiac tissues.43,44 Insulin induces translocation of GLUT4 from intracellular vesicles to the plasma membrane, which permits the facilitated diffusion of circulating glucose down its concentration gradient into muscle cells leading to a rapid increase in the uptake of glucose.45 These alterations lead to the increase of glucose consumption and the decline of blood glucose. Accumulating evidence indicates that either expression deregulation or functional impairment of GLUT4 can cause insulin resistance. Because of its crucial role, GLUT4 has been considered a potential therapeutic target for T2D. IRS-1 is the insulin receptor substrate protein and is mainly located in the hepatic and adipose tissue, which is sensitive to insulin.46 IRS-1 can associate with IR as the key intermediate in the PI3K/Akt signaling pathway.47 The blocking of phosphorylation of IRS-1 can reduce IRS-1-associated PI3K and Akt activity. The activated form of Akt, P-Akt was reduced. Then, the inhibition of PI3K/Akt would suppress the translocation and activity of GLUT4 and ultimately decrease insulin-stimulated glucose transport activity.48
In this experiment, after treatment with Ph for 4 weeks, Ph reduced PBG and improved islet injury in T2D rats. In addition, Ph improved lipid metabolism, such as serum FFA, TG, TC, LDL, and insulin levels. In L6 myotubes, insulin resistance was ameliorated by the treatment of Ph for 24 h. Ph improved the glucose tolerance by OGTT in T2D rats, which is the control of PBG. In animal experiments, we found that the Pre group showed good improvement of glucose and lipid metabolism, which means that Ph might have a preventive effect on diabetes, with the same result shown in the cell experiments. In terms of mechanisms, we found that Ph could increase the glucose uptake and glucose consumption in L6 myotubes by GLUT4, as well as the PI3K/Akt pathway.
It is intriguing to compare the metabolic effects of Ph with other insulin-sensitizing agents such as metformin. Based on the data presented here, Ph and metformin share a number of beneficial features, such as the improvement of blood glucose, serum lipid metabolism, and insulin resistance. However, in this study, we did not observe that metformin led to the translocation of GLUT4, while Ph did that. These results suggest that Ph may have a different action mechanism from that of metformin when used to treat glucose disorders in T2D rats.
Conclusion
We conclude that Ph improves glucose consumption and glucose tolerance, at least in part, via stimulation of GLUT4 translocation and expression. We also present evidence for the first time that Ph has a certain preventive effect on diabetes and displays beneficial effects in the treatment of glucose and lipid metabolism. Nevertheless, further mechanistic studies will need to be performed in order to understand how Ph affects PI3K/Akt signaling pathways, and metabolic disorders in T2D rats. It will be of future interest to clarify whether Ph also prevents diabetes in other animal models or humans, and whether Ph affects other metabolism-related signaling pathways.
Acknowledgments
This work was supported by the National Major Scientific and Technological Special Project for “Significant New Drugs Development” (Grant No 2011ZX09401-308-23) and the National Natural Science Foundation of China (Grant No 81603313).
Author contributions
All authors contributed toward data analysis, drafting, and critically revising the paper and agree to be accountable for all aspects of the work.
Disclosure
The authors report no conflicts of interest in this work.
References
Kao PY, Green E, Pereira C, et al. Inhibition of toxic IAPP amyloid by extracts of common fruits. J Funct Foods. 2015;12:450–457. | ||
Vahedi Larijani L, Ghasemi M, AbedianKenari S, Naghshvar F. Evaluating the effect of four extracts of avocado fruit on esophageal squamous carcinoma and colon adenocarcinoma cell lines in comparison with peripheral blood mononuclear cells. Acta Med Iran. 2014;52(3):201–205. | ||
Landa P, Skalova L, Bousova I, et al. In vitro anti-proliferative and anti-inflammatory activity of leaf and fruit extracts from Vaccinium bracteatum Thunb. Pak J Pharm Sci. 2014;27(1):103–106. | ||
Lin ST, Tu SH, Yang PS, et al. Apple polyphenol phloretin inhibits colorectal cancer cell growth via inhibition of the type 2 glucose transporter and activation of p53-mediated signaling. J Agric Food Chem. 2016;64(36):6826–6837. | ||
Yang J, Liu X, Zhang X, Jin Q, Li J. Phenolic profiles, antioxidant activities, and neuroprotective properties of mulberry (Morus atropurpurea Roxb.) fruit extracts from different ripening stages. J Food Sci. 2016;81(10):C2439–C2446. | ||
Infante J, Rosalen PL, Lazarini JG, Franchin M, Alencar SM. Antioxidant and anti-inflammatory activities of unexplored brazilian native fruits. PLoS One. 2016;11(4):e0152974. | ||
Huang HL, Liu CT, Chou MC, Ko CH, Wang CK. Noni (Morinda citrifolia L.) fruit extracts improve colon microflora and exert anti-inflammatory activities in caco-2 cells. J Med Food. 2015;18(6):663–676. | ||
Jia S, Gao Z, Yan S, et al. Anti-obesity and hypoglycemic effects of Poncirus trifoliata L. Extracts in high-fat diet C57BL/6 mice. Molecules. 2016;21(4):453. | ||
Hassan M, El Yazidi C, Landrier JF, Lairon D, Margotat A, Amiot MJ. Phloretin enhances adipocyte differentiation and adiponectin expression in 3T3-L1 cells. Biochem Biophys Res Commun. 2007;361(1):208–213. | ||
Lee KW, Kim YJ, Kim DO, Lee HJ, Lee CY. Major phenolics in apple and their contribution to the total antioxidant capacity. J Agric Food Chem. 2003;51(22):6516–6520. | ||
Hilt P, Schieber A, Yildirim C, et al. Detection of phloridzin in strawberries (Fragaria x ananassa Duch.) by HPLC-PDA-MS/MS and NMR spectroscopy. J Agric Food Chem. 2003;51(10):2896–2899. | ||
Ren D, Liu Y, Zhao Y, Yang X. Hepatotoxicity and endothelial dysfunction induced by high choline diet and the protective effects of phloretin in mice. Food Chem Toxicol. 2016;94:203–212. | ||
Vasantha Rupasinghe HP, Yasmin A. Inhibition of oxidation of aqueous emulsions of omega-3 fatty acids and fish oil by phloretin and phloridzin. Molecules. 2010;15(1):251–257. | ||
Shu G, Lu NS, Zhu XT, et al. Phloretin promotes adipocyte differentiation in vitro and improves glucose homeostasis in vivo. J Nutr Biochem. 2014;25(12):1296–1308. | ||
Manzano M, Giron MD, Vilchez JD, et al. Apple polyphenol extract improves insulin sensitivity in vitro and in vivo in animal models of insulin resistance. Nutr Metab (Lond). 2016;13:32. | ||
Rahelic D. [7th edition of Idf diabetes atlas – call for immediate action]. Lijec Vjesn. 2016;138(1–2):57–58. Croatian. | ||
Whiting DR, Guariguata L, Weil C, Shaw J. IDF diabetes atlas: global estimates of the prevalence of diabetes for 2011 and 2030. Diabetes Res Clin Pract. 2011;94(3):311–321. | ||
Dai B, Wu QX, Zeng CX, et al. The effect of Liuwei Dihuang decoction on PI3K/Akt signaling pathway in liver of type 2 diabetes mellitus (T2DM) rats with insulin resistance. J Ethnopharmacol. 2016;192:382–389. | ||
Meng R, Zhu D, Bi Y, Yang D, Wang Y. Erythropoietin inhibits gluconeogenesis and inflammation in the liver and improves glucose intolerance in high-fat diet-fed mice. PLoS One. 2013;8(1):e53557. | ||
Taniguchi CM, Emanuelli B, Kahn CR. Critical nodes in signalling pathways: insights into insulin action. Nat Rev Mol Cell Biol. 2006;7(2):85–96. | ||
Saltiel AR, Pessin JE. Insulin signaling pathways in time and space. Trends Cell Biol. 2002;12(2):65–71. | ||
Korkmaz-Icoz S, Al Said S, Radovits T, et al. Oral treatment with a zinc complex of acetylsalicylic acid prevents diabetic cardiomyopathy in a rat model of type-2 diabetes: activation of the Akt pathway. Cardiovasc Diabetol. 2016;15:75. | ||
Peng L, Li J, Xu Y, et al. The protective effect of beraprost sodium on diabetic nephropathy by inhibiting inflammation and p38 MAPK signaling pathway in high-fat diet/streptozotocin-induced diabetic rats. Int J Endocrinol. 2016;2016:1690474. | ||
Gao YF, Zhang MN, Wang TX, Wu TC, Ai RD, Zhang ZS. Hypoglycemic effect of D-chiro-inositol in type 2 diabetes mellitus rats through the PI3K/Akt signaling pathway. Mol Cell Endocrinol. 2016;433:26–34. | ||
Srinivasan K, Viswanad B, Asrat L, Kaul CL, Ramarao P. Combination of high-fat diet-fed and low-dose streptozotocin-treated rat: a model for type 2 diabetes and pharmacological screening. Pharmacol Res. 2005;52(4):313–320. | ||
Wu D, Wen W, Qi CL, et al. Ameliorative effect of berberine on renal damage in rats with diabetes induced by high-fat diet and streptozotocin. Phytomedicine. 2012;19(8–9):712–718. | ||
Ju C, Yue W, Yang Z, et al. Antidiabetic effect and mechanism of chitooligosaccharides. Biol Pharm Bull. 2010;33(9):1511–1516. | ||
Jin S, Chang C, Zhang L, Liu Y, Huang X, Chen Z. Chlorogenic acid improves late diabetes through adiponectin receptor signaling pathways in db/db mice. PLoS One. 2015;10(4):e0120842. | ||
Matthews DR, Hosker JP, Rudenski AS, Naylor BA, Treacher DF, Turner RC. Homeostasis model assessment: insulin resistance and beta-cell function from fasting plasma glucose and insulin concentrations in man. Diabetologia. 1985;28(7):412–419. | ||
Allerton TD, Primeaux SD. QRFP-26 enhances insulin’s effects on glucose uptake in rat skeletal muscle cells. Peptides. 2015;69:77–79. | ||
Canto C, Gerhart-Hines Z, Feige JN, et al. AMPK regulates energy expenditure by modulating NAD+ metabolism and SIRT1 activity. Nature. 2009;458(7241):1056–1060. | ||
Karaskov E, Scott C, Zhang L, Teodoro T, Ravazzola M, Volchuk A. Chronic palmitate but not oleate exposure induces endoplasmic reticulum stress, which may contribute to INS-1 pancreatic beta-cell apoptosis. Endocrinology. 2006;147(7):3398–3407. | ||
Park SE, Cho MH, Lim JK, et al. A new colorimetric method for determining the isomerization activity of sucrose isomerase. Biosci Biotechnol Biochem. 2007;71(2):583–586. | ||
Lan T, Shen X, Liu P, et al. Berberine ameliorates renal injury in diabetic C57BL/6 mice: Involvement of suppression of SphK-S1P signaling pathway. Arch Biochem Biophys. 2010;502(2):112–120. | ||
Fang K, Dong H, Jiang S, et al. Diosgenin and 5-Methoxypsoralen Ameliorate Insulin Resistance through ER-alpha/PI3K/Akt-Signaling Pathways in HepG2 Cells. Evid Based Complement Alternat Med. 2016;2016:7493694. | ||
Hao J, Chen C, Huang K, et al. Polydatin improves glucose and lipid metabolism in experimental diabetes through activating the Akt signaling pathway. Eur J Pharmacol. 2014;745:152–165. | ||
Ceriello A. Oxidative stress and glycemic regulation. Metabolism. 2000;49(2 Suppl 1):27–29. | ||
Yim S, Malhotra A, Veves A. Antioxidants and CVD in diabetes: where do we stand now. Curr Diab Rep. 2007;7(1):8–13. | ||
Ribeiro DL, Pinto ME, Rafacho A, et al. High-fat diet obesity associated with insulin resistance increases cell proliferation, estrogen receptor, and PI3K proteins in rat ventral prostate. J Androl. 2012;33(5):854–865. | ||
Maegawa H, Ide R, Hasegawa M, et al. Thiazolidine derivatives ameliorate high glucose-induced insulin resistance via the normalization of protein-tyrosine phosphatase activities. J Biol Chem. 1995;270(13):7724–7730. | ||
Reed MJ, Meszaros K, Entes LJ, et al. A new rat model of type 2 diabetes: the fat-fed, streptozotocin-treated rat. Metabolism. 2000;49(11):1390–1394. | ||
Yaffe D. Retention of differentiation potentialities during prolonged cultivation of myogenic cells. Proc Natl Acad Sci USA. 1968;61(2):477–483. | ||
Poletto AC, David-Silva A, Yamamoto AP, Machado UF, Furuya DT. Reduced Slc2a4/GLUT4 expression in subcutaneous adipose tissue of monosodium glutamate obese mice is recovered after atorvastatin treatment. Diabetol Metab Syndr. 2015;7:18. | ||
Fang P, Shi M, Guo L, et al. Effect of endogenous galanin on glucose transporter 4 expression in cardiac muscle of type 2 diabetic rats. Peptides. 2014;62:159–163. | ||
Zhou T, Meng X, Che H, et al. Regulation of insulin resistance by multiple MiRNAs via targeting the GLUT4 signalling pathway. Cell Physiol Biochem. 2016;38(5):2063–2078. | ||
Morino K, Petersen KF, Dufour S, et al. Reduced mitochondrial density and increased IRS-1 serine phosphorylation in muscle of insulin-resistant offspring of type 2 diabetic parents. J Clin Invest. 2005;115(12):3587–3593. | ||
Zhu Y, Pereira RO, O’Neill BT, et al. Cardiac PI3K-Akt impairs insulin-stimulated glucose uptake independent of mTORC1 and GLUT4 translocation. Mol Endocrinol. 2013;27(1):172–184. | ||
Jiang Z, Yu B, Li Y. Effect of three statins on glucose uptake of cardiomyocytes and its mechanism. Med Sci Monit. 2016;22:2825–2830. |
 © 2017 The Author(s). This work is published and licensed by Dove Medical Press Limited. The
full terms of this license are available at https://www.dovepress.com/terms
and incorporate the Creative Commons Attribution
- Non Commercial (unported, 3.0) License.
By accessing the work you hereby accept the Terms. Non-commercial uses of the work are permitted
without any further permission from Dove Medical Press Limited, provided the work is properly
attributed. For permission for commercial use of this work, please see paragraphs 4.2 and 5 of our Terms.
© 2017 The Author(s). This work is published and licensed by Dove Medical Press Limited. The
full terms of this license are available at https://www.dovepress.com/terms
and incorporate the Creative Commons Attribution
- Non Commercial (unported, 3.0) License.
By accessing the work you hereby accept the Terms. Non-commercial uses of the work are permitted
without any further permission from Dove Medical Press Limited, provided the work is properly
attributed. For permission for commercial use of this work, please see paragraphs 4.2 and 5 of our Terms.