Back to Journals » International Journal of Nanomedicine » Volume 9 » Issue 1
Pharmacokinetics on a microscale: visualizing Cy5-labeled oligonucleotide release from poly(n-butylcyanoacrylate) nanocapsules in cells
Authors Tomcin S, Baier G, Landfester K ![]() , Mailänder V
, Mailänder V
Received 10 July 2014
Accepted for publication 3 September 2014
Published 26 November 2014 Volume 2014:9(1) Pages 5471—5489
DOI https://doi.org/10.2147/IJN.S70908
Checked for plagiarism Yes
Review by Single anonymous peer review
Peer reviewer comments 3
Editor who approved publication: Dr Thomas Webster
Stephanie Tomcin,1 Grit Baier,1 Katharina Landfester,1 Volker Mailänder1,2
1Max Planck Institute for Polymer Research, 2University Medical Center of the Johannes Gutenberg University, III Medical Clinic, Mainz, Germany
Abstract: For successful design of a nanoparticulate drug delivery system, the fate of the carrier and cargo need to be followed. In this work, we fluorescently labeled poly(n-butylcyanoacrylate) (PBCA) nanocapsules as a shell and separately an oligonucleotide (20 mer) as a payload. The nanocapsules were formed by interfacial anionic polymerization on aqueous droplets generated by an inverse miniemulsion process. After uptake, the PBCA capsules were shown to be round-shaped, endosomal structures and the payload was successfully released. Cy5-labeled oligonucleotides accumulated at the mitochondrial membrane due to a combination of the high mitochondrial membrane potential and the specific molecular structure of Cy5. The specificity of this accumulation at the mitochondria was shown as the uncoupler dinitrophenol rapidly diminished the accumulation of the Cy5-labeled oligonucleotide. Importantly, a fluorescence resonance energy transfer investigation showed that the dye-labeled cargo (Cy3/Cy5-labeled oligonucleotides) reached its target site without degradation during escape from an endosomal compartment to the cytoplasm. The time course of accumulation of fluorescent signals at the mitochondria was determined by evaluating the colocalization of Cy5-labeled oligonucleotides and mitochondrial markers for up to 48 hours. As oligonucleotides are an ideal model system for small interfering RNA PBCA nanocapsules demonstrate to be a versatile delivery platform for small interfering RNA to treat a variety of diseases.
Keywords: drug delivery, mitochondria, miniemulsion, colocalization
Introduction
The delivery of highly sensitive drugs is a challenging field in the development of new therapeutic agents. Proteins, peptides, and even nucleotide agents derived from deoxyribonucleic acid (DNA)-like plasmids or RNA-like small interfering RNA (siRNA) and micro RNA (miRNA) are particularly vulnerable to degradation by specific enzymes before they reach their intracellular target molecule.1 They also do not cross the cell membrane barrier by themselves. Nanotechnology-based drug and gene delivery systems made of polymeric materials like nanoparticles or nanocapsules,2 liposomes,3 and polyplexes4,5 have the potential to solve these problems.
Biocompatibility and biodegradation play a key role in drug carrier systems. These requirements are fulfilled both in the application of polymers like poly(alkylcyanoacrylates), known as skin adhesives or surgical glues for the closure of wounds.6 The most commonly used alkylcyanoacrylate is n-butylcyanoacrylate (BCA). In addition to being approved in medical applications, poly(n-butylcyanoacrylate) (PBCA) nanoparticles have been demonstrated to cross the blood–brain barrier efficiently.7–9 PBCA nanocapsules prepared via the miniemulsion process (Figure S1)enable proper encapsulation as well as release of sensitive bioactive molecules like oligonucleotides.10
Even complex and sensitive enzyme reactions like DNA amplification via polymerase chain reaction inside PBCA nanocapsules have been performed successfully by using nanocapsules as nanoreactors.11 The most important advantage of preparation of nanocarriers using the miniemulsion process is the ability to create particles as well as capsules with a defined properties under properly chosen reaction conditions (eg, physicochemical properties of the monomers/encapsulated materials and their corresponding ratios).12
Most work with PBCA nanoparticles has focused on detecting the macroscopic pharmacokinetics of their delivery to the brain and their effects. In contrast, the present work focused on PBCA nanocapsules as a nanocarrier system that overcomes cellular and intracellular barriers on a microscopic level and releases its payload inside the cell. Confocal imaging was used to demonstrate release of oligonucleotides from the nanocapsules into the cytoplasm. At the single-cell level, fluorescence microscopy enables detection of subcellular structures in living cells, like the cytoskeleton, mitochondria, and organelles of the endocytotic pathway in high resolution after staining these cell compartments with appropriate fluorescent markers.
Here and in previous work we have used Cy5-labeled oligonucleotides as a model cargo for siRNA in view of their several advantages. Oligonucleotides are inexpensive because they are widely synthesized as primers for polymerase chain reaction. Modifications to the nucleotide sequence as well as different fluorescent labels on both ends of the sequence are readily available. It should be noted that we and others have shown, that cyanine dyes which have been attached to the 5′-end of the nucleotide sequence result in staining of the mitochondria inside cells.10,13 This does not depend on the oligonucleotide sequence, but merely on the fluorophore as it integrates into the mitochondrial membrane because it is attracted by the high mitochondrial membrane potential due to the charge distribution in the cyanine molecule.10,13 This is also the basic principle for commercially available mitochondria-specific dyes.
For a drug delivery device, it is crucial to understand its efficiency in terms of protecting its cargo from degradation and delivering it to the intracellular site of interest. For toxicological considerations, it is important to determine what happens to the polymeric capsule material. While recent studies11 demonstrated that PBCA with Cy5-labeled oligonucleotides was readily taken up into endosomes and the fluorescence of the cyanine dye escaped the endosomes and located to the mitochondria, they did not investigate whether the oligonucleotide was still attached to the Cy5 dye as a whole or if the nucleotide sequence was cleaved. The present work also focused on determination of the intracellular fate of the polymeric shell, ie, the PBCA itself. Hence, an inverse miniemulsion process was used to encapsulate hydrophilic Cy5-labeled or Cy3/Cy5-labeled oligonucleotides into a PBCA-based shell. Further, oligonucleotides were double-labeled with Cy3/Cy5 to test the integrity of the oligonucleotide by fluorescence resonance energy transfer (FRET) in the confocal laser scanning microscope (CLSM). The polymer itself was labeled covalently by 5-carboxytetramethylrhodamine azide (TAMRA), a rhodamine dye. The advantage of labeling both the content and the shell of the capsule enabled specific detection of both the payload and the capsule material and the fate of both after cellular uptake.
Materials and methods
Materials
Span®80 and Tween®80 (Sigma-Aldrich, St Louis, MO, USA) were used to stabilize the aqueous droplets after the inverse miniemulsion process. The anionic surfactant sodium dodecyl sulfate (Fluka, Buchs, Switzerland) was used to stabilize PBCA nanocapsules in the aqueous phase. The BCA monomer was kindly supplied by Henkel (Düsseldorf, Germany). Miglyol 812N (caprylic/capric triglycerides) was a gift from Sasol Solvents (Moers, Germany), and was used as the continuous phase in the inverse miniemulsion process. The aqueous phase consisted of a buffer system comprising 25 mM Tris HCl (pH 8.4), 3.1 mM MgCl2, 62.5 mM KCl, and 0.0125 mg/mL gelatin. Cy5-labeled oligonucleotides with the sequence 5′-Cy5-CCACTCCTTTCCAGAAAACT-3′ and Cy3/Cy5-labeled oligonucleotides with the sequence 5′-Cy5-CCACTCCTTTCCAGAAAACT-Cy3-3′ were synthesized by Thermo Scientific (Dreieich, Germany). TAMRA azide was purchased from Baseclick (Tutzing, Germany) and used to label the shell of the nanocapsule. All chemicals were used without further purification. Demineralized water was used throughout the experiments.
Preparation of nanocapsules
Preparation of the inverse miniemulsion and polymerization took place at the droplet interfaces according to a previously published procedure.14 In brief, a mixture of surfactants (Span 80 and Tween 80) was used to stabilize the water-in-oil miniemulsion. The continuous phase and oil phase (3.8 g) consisted of 0.201 g of Span 80, 0.027 g of Tween 80, and Miglyol 812 N as the oil. The concentration of the surfactants corresponded to 6 wt% of the total amount of the continuous phase. An aqueous buffer made of Tris HCl, MgCl2, KCl, gelatin, and water formed the basis of the aqueous phase (see previous paragraph for amounts). The aqueous phase consisted of 120 μL Cy5-labeled or Cy5/Cy3-labeled oligonucleotides (100 pmol/μL) dissolved in 380 μL of aqueous buffer (pH 8.4, substances of content described above). The aqueous phase and continuous phase were mixed and then stirred for one hour to form an emulsion. Thereafter, the samples were homogenized using a Branson 450W sonifier with an inverse cup tip (60 seconds, 50% amplitude) at 4°C to generate aqueous droplets containing the labeled oligonucleotides. Soon after this inverse miniemulsion process, a mixture of BCA (50 μL) and chloroform 150 μL or a mixture of BCA/propargyl cyanoacrylate (PCA; 0.37/0.56 mmol) and chloroform 150 μL prepared earlier was added dropwise to the miniemulsion to start polymerization at the interface of the aqueous droplets and continuous phase. The polymerization took place over 4 hours at 25°C under mechanical stirring at 750 rpm. The nanocapsules obtained were washed three times with ethanol to separate the PBCA or P(BCA)-co-P(PCA) nanocapsules from the oil phase and subsequently centrifuged (Sigma-Aldrich, 3k-30, RCF 5870, 20 minutes). The wet pellet was redispersed in a 0.1 wt% aqueous solution of sodium dodecyl sulfate and characterized using dynamic light scattering and transmission electron microscopy. The click reaction between TAMRA azide and P(BCA)-co-P(PCA) nanocapsules was performed according to Baier et al.15 For the TAMRA azide click reaction, P(BCA)-co-P(PCA) nanocapsules (500 μL, solid content 1 wt%) were redispersed in 300 μL of TAMRA azide (3.8 nmol per μL in ethanol/Tween 80 solution (0.6 wt%). The dispersion obtained and Cu(II)Br2/PMDETA (0.9 mg, 0.002 mmol) were mixed together and put into an argon-flushed Schlenk tube. The dispersion was degassed by argon bubbling for 15 minutes. The click reaction was initiated by injection of 1 equivalent (100 μL) of ascorbic acid (0.03 M in water) into the nanocapsule dispersion under an argon atmosphere. The mixture was stirred for 24 hours at 25°C. After the clicking procedure, the nanocapsules were cleaned three times by repetitive centrifugation/redispersion in ethanol to remove the residuals of the clicking reagents and the nonreacted TAMRA azide. Next, the nanocapsules were centrifuged (Sigma-Aldrich, 3k-30, RCF 5870, 20 minutes), and the wet pellet was redispersed in a 0.1 wt% aqueous solution of sodium dodecyl sulfate and characterized using dynamic light scattering and transmission electron microscopy.
Characterization of nanocapsules
The average size and size distribution of the nanocapsules were measured by dynamic light scattering at 20°C using a PSS particle sizer 380 (Nicomp Particle Sizing Systems, Port Richey, FL, USA) equipped with a detector for a scattering angle of 90°. The measurements were performed at 25°C. The zeta potential of the nanocapsules was measured in 10−3 M potassium chloride solution (pH 6.8) with a Zeta Nanosizer (Malvern Instruments, Malvern, UK) at 20°C. For morphological observation, transmission electron microscopy was carried out using an EM400 electron microscope (Philips, Eindhoven, the Netherlands) operating with an acceleration voltage of 80 kV. The samples were prepared by diluting the capsule dispersion with demineralized water to a solid content of about 0.01%. One droplet of the sample was placed on a 300 carbon-coated copper mesh and left to dry overnight at ambient temperature. No additional contrasting was applied. The total solid content was measured gravimetrically.
Cell culture
Mesenchymal stem cells (MSC), human cervix adenocarcinoma cells (HeLa), and human breast adenocarcinoma cells (MCF-7) were used to perform the experiments. The HeLa and MCF-7 cancer cell lines, which are epithelial-like cells that grow in monolayers, were purchased from the German Collection of Microorganisms and Cell Cultures (DSMZ, Braunschweig, Germany). MSC, a primary cell line, were established by bone marrow aspiration from a healthy donor after obtaining informed consent and with the approval of the local ethics committee. MSC were generated as described by Pittenger in 2008.16 All cells were kept in Dulbecco’s Modified Eagle Medium (Invitrogen, Karlsruhe, Germany) without phenol red. Medium for the different cell lines was supplemented as follows. For MSC, Dulbecco’s Modified Eagle Medium with 20 vol% fetal calf serum (Invitrogen), 100 units of penicillin together with 100 μg/mL streptomycin (Invitrogen), 12 μg/mL ciprofloxacin (Fluka), 1 mM pyruvate (Sigma-Aldrich), and 2 mM GlutaMAX™ (Invitrogen) was used. HeLa medium was supplemented with 10 vol% fetal calf serum (Invitrogen), 100 units/mL penicillin and 100 μg/mL streptomycin (Invitrogen), and 2 mM GlutaMAX. The MCF-7-medium was supplemented with the same substances as for the HeLa medium but with addition of 1 mM pyruvate (Sigma-Aldrich). Cells were grown in a humidified incubator at 37°C and 5% CO2. One day prior to the experiments, adherent cells were detached using 0.5% trypsin (Invitrogen) and seeded out in an ibidi μ-Dish35 mm,low (ibidi, München, Germany) at a density of 8,500 cells per cm2. After readhesion overnight, the cells were washed once with Dulbecco’s phosphate-buffered saline before treatment with nanocapsules. PBCA nanocapsules were added at a concentration of 75 μg/mL. Further information is given in the paragraphs below.
MTS assay
In order to show that PBCA nanocapsules have no toxic influence on cells, an MTS (3-(4,5-dimethylthiazol-2-yl)-5-(3-carboxymethoxyphenyl)-2-(4-sulfophenyl)-2H-tetrazolium, inner salt) assay of NC1 in MSC was used. MTS was reduced in a NADH-dependent manner by cells to a colored formazan product which was soluble in culture medium. The concentration of formazan was photometrically detectable as absorption at 490 nm. An Infinite M1000 plate reader (Tecan, Crailsheim, Germany) was used to detect the absorption. Cells were seeded in 96-well plates (Becton Dickinson, Franklin Lakes, NJ, USA) at a density of 0.8×10⁵ cells per well. After readhesion overnight, the cells were incubated with NC1 nanocapsules at a concentration of 75, 150, 300, and 600 μg/mL for 72 hours in a humidified incubator at 37°C and 5% CO2. After incubation, the MTS assay was done in medium following the manufacturer’s protocol for the CellTiter 96® AQueous One Solution cell proliferation assay (Promega, Madison, WI, USA). The absorption signal of formazan was directly proportional to the number of live cells.17
CLSM imaging and kinetic studies
CLSM was used to demonstrate the intracellular uptake of PBCA nanocapsules containing Cy5-labeled oligonucleotides (Thermo Scientific) and the release of these oligonucleotides. The cells were incubated with NC1 nanocapsules at a concentration of 75 μg/mL for 2, 5, 9, 16, 24, and 48 hours. After incubation, the cells were washed three times with phosphate-buffered saline, covered with 1 mL phosphate-buffered saline, and stained with MitoTracker® Green FM (Invitrogen) by adding 0.2 μL of a 1 mM stock solution. After incubation for 30 minutes in a humidified incubator, the cells were washed once with phosphate-buffered saline, covered with phosphate-buffered saline, and stained with 0.2 μL CellMask™ Deep Red (Invitrogen) to detect cell membranes as well. Images were taken with LAS AF software on a TCS SP5 II microscope (Leica, Nussloch, Germany) equipped with five lasers (multiline argon laser with 458, 476, 488, 496, 514 nm, a DPSS (diode pumped solid state) 561 nm, a HeNe laser with 594 and 633 nm lasers, and a 592 nm CW STED laser) with a HCX PL APO CS 63×/1.4–0.6 oil-immersion objective. Cy5-labeled oligonucleotides were excited with a 633 nm HeNe laser and detected at 655–730 nm. Detection of the CellMask orange-labeled cell membranes occurred at 590–640 nm when excited at 561 nm with a DPSS laser. To detect mitochondria staining MitoTracker Green FM, a 488 nm argon laser line was used for excitation and emission was detected at 505–545 nm. Images were taken with a pinhole size of 1 AE, a line average of 2, and a resolution of 1,024×1,024 8-bit pixels, with photomultiplier tube used for detection. To avoid crosstalk, a serial mode was applied for imaging. Image processing was done with a Leica LAS AF and ImageJ software.
Imaging analysis
Colocalization and kinetic studies were performed using Volocity software (PerkinElmer, Boston, MA, USA), which is suitable for analyzing z-stacks in both three-dimensional and two-dimensional images, as in our case. Single cells were then separated and analyzed with regard to measuring Manders’ colocalization coefficient M1 and to get the pixel ratio of signals from Cy5 and MitoTracker Green FM. Before starting the measurements, threshold values for both the Cy5 channel and the MitoTracker channel were set manually (the same threshold for cells of a certain cell line). The M1 and pixel ratio were determined according to the literature.18 To compare the values calculated for M1, a threshold was defined for the cells after 2 hours of incubation. All cells with longer incubation times and values of M1 over the given threshold were chosen for further data interpretation. The pixel ratio was determined from cells with an appropriate M1 colocalization coefficient.
FRET experiments
The Cy3 and Cy5 cyanine dyes are a well-known FRET pair. Therefore, we chose oligonucleotides (Thermo Scientific) double-labeled with those dyes to demonstrate the FRET effect in our system. The first experiments were accomplished with an oligonucleotide concentrations of 120 nM (without cells) using an Infinite M1000 plate reader to obtain three-dimensional scans of the double-labeled oligonucleotides in comparison with the corresponding single-labeled oligonucleotides. Measurements were determined in the range of 500–700 nm for both λ (ex) and λ (em). Next we performed in vitro experiments using the HeLa cell line. Cells were incubated for 24 hours with both pure double-labeled oligonucleotides and NC2 nanocapsules with double-labeled oligonucleotides as the payload at an oligonucleotide concentration of 60 nM and a capsule concentration of 75 μg/mL. For simultaneous detection of Cy3 and Cy5, we used the same confocal Leica microscope as for the kinetic studies. First, a 561 nm DPSS laser was applied for excitation of Cy3 and subsequently a 633 nm HeNe laser to excite Cy5 at the same position in the specimen. Cy3 was detected at 570–610 nm simultaneously with Cy5 at 655–730 nm.
DNP as an uncoupler
MSC were incubated with NC1 for 24 hours. After incubation, the cells were stained with MitoTracker Green FM (for details, see paragraph on CLSM imaging and kinetic studies). The cells not treated with DNP (2,4-dinitrophenol) were washed once with phosphate-buffered saline and covered with 500 μL of phosphate-buffered saline (PBS) before detection of Cy5-labeled oligonucleotides and MitoTracker Green FM at λ (ex) and λ (em), as mentioned in the paragraph concerning the kinetic studies. The same procedure was repeated with DNP-treated cells, but imaging started after adding 500 μL of DNP solution (Sigma-Aldrich) to a final concentration of 250 μM. Images were captured every 10 seconds over a period of 3 minutes. The imaging conditions were the same as those mentioned for the kinetic studies. Image processing was done using Leica LAS AF and ImageJ software.
Detection of TAMRA-decorated nanocapsules
MSC were incubated for 24 hours with NC3 at a concentration of 75 μg/mL. These nanocapsules were labeled with fluorescent TAMRA azide on the shell, so it was possible to detect the shell of the capsule in addition to its content, ie, Cy5-labeled oligonucleotides. After incubation, the cells were immediately washed three times with phosphate-buffered saline and imaging was performed. A 561 nm DPSS laser was used to excite TAMRA and the shell. A photomultiplier tube with an emission band of 570–625 nm was used for detection. Excitation and detection of Cy5 and the oligonucleotides were the same as in the previous experiments.
Results and discussion
Characterization of nanocapsules
Polymeric nanocapsules consisting of a PBCA shell and an aqueous core with oligonucleotides were prepared as a nanocarrier system that was able to release its payload from endosomes. Using Cy5-labeled oligonucleotides, release into the cytoplasm was expected to be detectable. Stable nanocapsules with a defined size, morphology, and shell thickness could be obtained using an inverse miniemulsion process (Table 1, sample NC1) and transferred to the water phase. By analyzing the PBCA nanocapsules with transmission electron microscopy, we confirmed the capsular structure of these nanocarriers (Figure S2).
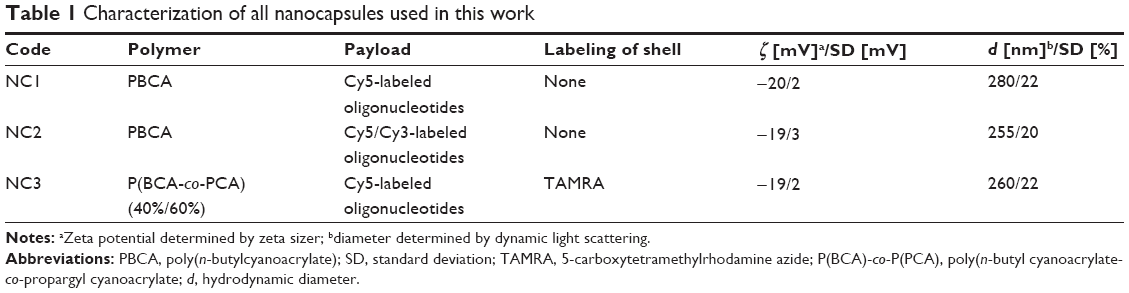 | Table 1 Characterization of all nanocapsules used in this work |
Measurements of the supernatant after centrifugation of the NC1 sample (Table 1) did not detect any fluorescent signal, indicating that the shell did not leak the Cy5-labeled oligonucleotides and could therefore be considered to be dense.
Two further samples were prepared. In the NC2 sample, Cy3/Cy5-labeled oligonucleotides representing a FRET pair were encapsulated in order to check for possible degradation of the oligonucleotides during endosomal release and passage through the cytoplasm. In the case of the NC3 capsule (Table 1), additionally to the payload the polymer was labeled with another dye. Here, a shell consisting of a copolymer of BCA and PCA was formed in order to obtain an alkyne-functionalized nanocapsule surface that allowed covalent coupling of azide-functionalized TAMRA to the polymer shell by the alkyne-azide click reaction. Figure 1 shows schematically the composition of the double-labeled PBCA nanocapsules after preparation by the inverse miniemulsion process and the click reaction with TAMRA.
 | Figure 1 Scheme of the composition of the nanocapsules, in particular for TAMRA-labeled capsules obtained after a click reaction. |
The properties, characterization measurements, compositions, and payloads of the nanocapsules are summarized in Table 1. All nanocapsules were in the same range for size and zeta potential. To verify that toxicity would be negligible at the concentrations used in further experiments, a tetrazolium-based cellular metabolic activity (MTS) assay was used to analyze NC1 as a representative of all capsules used in this work. We identified MSC as the most sensitive cell line for our studies using this assay. MSC did not show any toxic effects after an incubation time of 72 hours (Figure S3) and a nanocapsule concentration of up to 300 μg/mL. This concentration was four times higher than the concentration used for the other experiments in this study.
In vitro studies with the dinitrophenol uncoupler
Lipophilic cations like Cy5 and MitoTracker dyes accumulate in the mitochondria due to the high mitochondrial membrane potential.19 This electrostatic attraction is the driving force via which MitoTracker Green FM (Figure S4A) stains the mitochondria and is the reason why Cy5-labeled oligonucleotides (Figure S4B) stained these cell organelles as well. Mitochondrial targeting is of growing interest in the research setting at present.20 Mitochondria are the main producers of adenosine triphosphate in eukaryotic cells, and are also involved in other metabolic pathways, like oxidation of fatty acids, gluconeogenesis, and the citrate cycle.21 They also have a key role in the apoptosis mechanism, which can be exploited in cancer chemotherapy.22 From the morphological side, the mitochondria can exist as spherical particles, clusters, filaments, or even networks formed via dynamic processes, such as fusion and fission or active transport along microtubules and actin filaments.23 Further, they have a high membrane potential of 180–200 mV and contain their own genome.20
Rhee et al demonstrated that the mitochondrial membrane potential was indeed responsible for accumulation of the cyanine-labeled oligonucleotides used in their work.13 Using carbonyl cyanide m-chlorophenyl hydrazone (CCCP) as an uncoupler, the mitochondrial membrane potential was reduced, resulting in decreased fluorescence intensity of colocalized cyanine dye-labeled oligonucleotides and appearance of diffuse fluorescence. Detection was done one hour after treatment with CCCP.13 However, the effect of the uncoupler occurs much earlier, ie, immediately after addition to living cells. Instead of CCCP, we used the ionophore dinitrophenol (DNP) to show the effect in our system directly after addition by a time lapse experiment using CLSM. DNP was often used in the 1930s to treat morbid obesity, because uncouplers are protonophores that increase proton leakage from the inner mitochondrial membrane, whereupon oxidative phosphorylation decreases and fatty acid oxidation increases.24 We treated MSC with DNP after 24 hours of incubation with NC1 and staining with MitoTracker Green FM. Thereafter, a time lapse experiment involving live cells was performed to evaluate the effect of treatment with DNP. Without DNP, the filament-like staining and mitochondria staining of both MitoTracker Green FM and Cy5-labeled oligonucleotides did not change over a recording time of 3 minutes (Figure 2A–F). Alterations in cell morphology were due to movement of cells during the experiment. Further, no decrease in fluorescence intensity due to bleaching effects was observed.
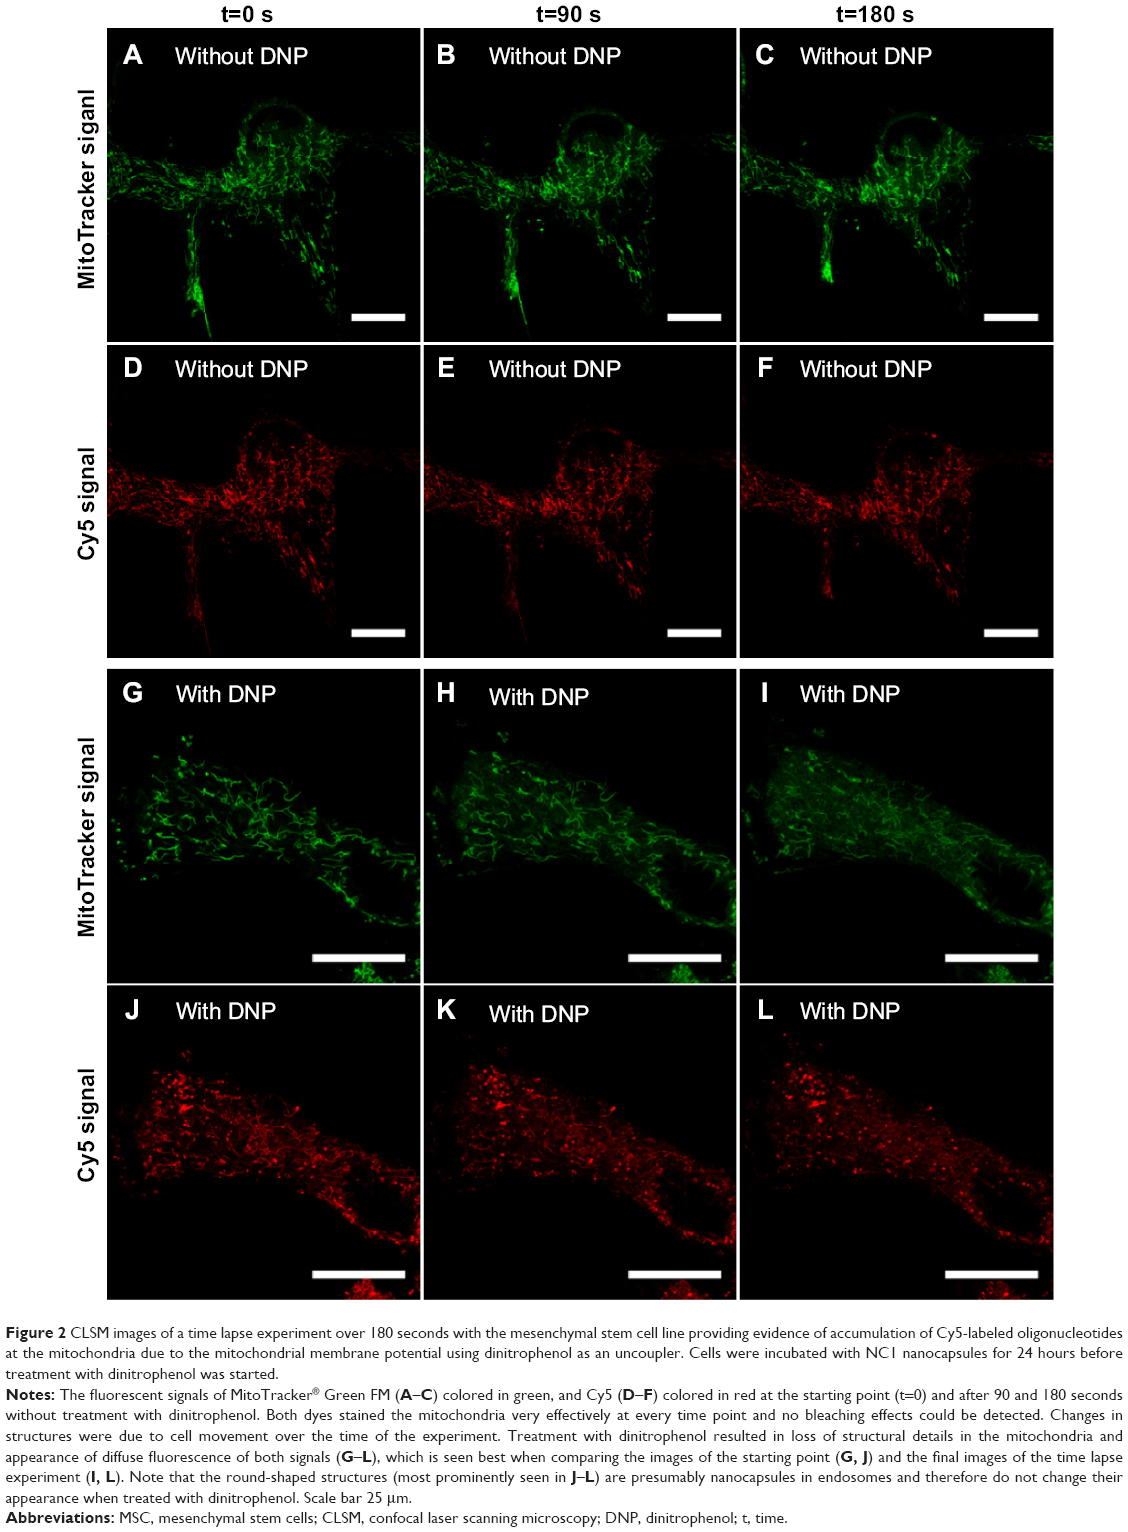 | Figure 2 CLSM images of a time lapse experiment over 180 seconds with the mesenchymal stem cell line providing evidence of accumulation of Cy5-labeled oligonucleotides at the mitochondria due to the mitochondrial membrane potential using dinitrophenol as an uncoupler. Cells were incubated with NC1 nanocapsules for 24 hours before treatment with dinitrophenol was started. |
Cells treated with DNP clearly showed the effect of the uncoupler. By comparing the first (Figure 2G and J) and last (Figure 2I and L) images of the time lapse experiment, differences in dye localization are obvious. The filament-like structures of the mitochondria stained by the MitoTracker Green FM dye had almost disappeared after 180 seconds and a diffuse fluorescence was distributed all over the cell. Also, the Cy5 signal located at the elongated structures became diffuse over the 180 seconds of observation. The round-shaped, red-colored Cy5 signals were most likely oligonucleotides in the PBCA capsules or endosomes which of course did not change their appearance during the course of the experiment. Therefore, the effect was detectable in the Cy5 channel, but not so impressive. The decreased electrostatic attraction led to diffuse cytosolic staining by MitoTracker Green FM and Cy5-labeled oligonucleotides as well. Bleaching effects were excluded due to the absence of changes in fluorescence intensity of both MitoTracker Green FM and Cy5 signals during measurement without DNP treatment.
Kinetic studies of oligonucleotide accumulation at the mitochondria
Accumulation of Cy5-labeled oligonucleotides was first observed only in MSC and for only 24 hours of incubation, so further cell lines and time points were investigated. Three cell lines, ie, HeLa, MSC, and MCF-7, were incubated with NC1 nanocapsules (payload: Cy5-labeled oligonucleotides) for varying times (2, 9, 16, 24, and 48 hours) with a constant concentration of 75 μg/mL. HeLa and MCF-7 (cervix carcinoma and breast adenocarcinoma cell lines, respectively) are representative of pathogenic cells. CLSM imaging was performed to detect colocalization of Cy5-labeled oligonucleotides with simultaneously stained mitochondria (displayed as merged images in Figure 3).
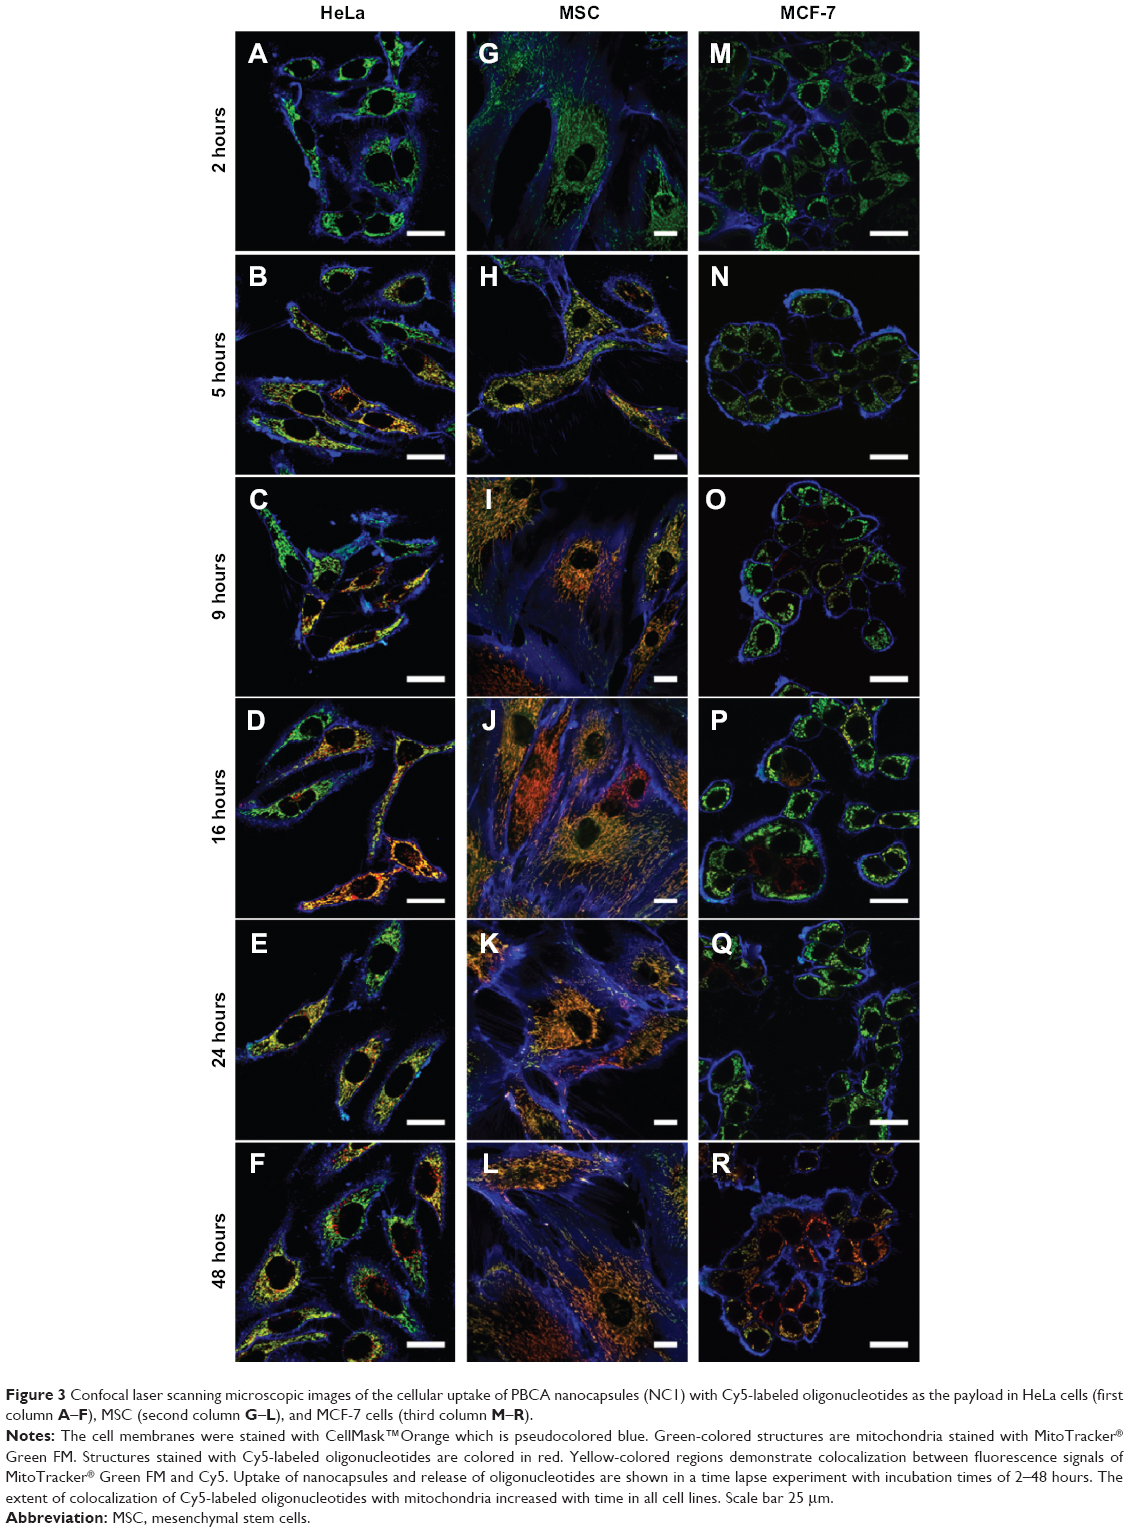 | Figure 3 Confocal laser scanning microscopic images of the cellular uptake of PBCA nanocapsules (NC1) with Cy5-labeled oligonucleotides as the payload in HeLa cells (first column A–F), MSC (second column G–L), and MCF-7 cells (third column M–R). |
All cell lines showed uptake of the nanocapsules as early as 2 hours. To highlight this fact, a slightly different illustration of the images at this time point of incubation was chosen. Figure S5 (Figure S5A shows the MitoTracker-only control and Figure S5B shows the CLSM images for nanocapsules) again shows the first pictures of the kinetic study, but with magnification of the Cy5-labeled oligonucleotides. These signals are shown in white to give the best contrast with the black background. Clearly, the morphology of the mitochondria and how they arrange themselves in the cytoplasm is different between these cell lines.
Uptake and release behavior also varied according to the type of cell line used. After 5 hours of incubation, HeLa cells and MSC showed a high degree of colocalization (Figure 3B and H) compared with the images after 2 hours of incubation (Figure 3A and 3G), which was due to a rapid release of oligonucleotides. In contrast with this, MCF-7 had barely taken up any nanocapsules after the same time points (Figure 3N), although the nanocapsule treatment was the same as in HeLa cells and MSC. Analyzing the HeLa cells was found to be difficult as some cells showed a high degree of uptake and colocalization while others had almost no uptake (Figure 3A–F). In these cells, only red, round-shaped dots could be seen in CLSM images without colocalization with mitochondria. Again this represents nanocapsules with Cy5-labeled oligonucleotides, which are supposed to be in endosomes where the oligonucleotides were not as yet released. Nearly all HeLa cells had a high amount of intact capsules (ie, showing no release of oligonucleotides), which increased with incubation time. On the other hand, intact nanocapsules, as indicated by round-shaped structures, were barely detectable in MSC or MCF-7 cells. This could be due to a cell type-specific amount of enzymes that might influence uptake and release kinetics. It is known from the literature that specific esterases are responsible for the degradation of PBCA. Scherer et al reported that proteolytic esterases had the most influence on the stability of PBCA in vitro when compared with other enzymes like amylase or pepsin.25 Hydrolysis of the side chain is supposed to be the main route of degradation of polymeric alkylcyanoacrylates25 (Figure S6).
In addition to the above, a rapid depolymerization–repolymerization mechanism described by Ryan et al degrades PBCA by base-induced depolymerization, yielding lower molecular weight oligomers26 (Figure S7), and an alternative mechanism based on the inverse Knoevenagel reaction has also proposed.27 Lenaerts et al have shown that this route of degradation played a marginal role when compared with the enzymatic route of degradation.28 The influence of pH on degradation of poly(alkylcyanoacrylates) has also been studied in detail, eg, in the work of Scherer et al.25 The degradation rate increased with increasing pH; however, after uptake in cells via the endocytotic pathway, the pH will decrease from early endosomes to lysosomes, making this route of degradation less likely.
Quantification of colocalization of Cy5-labeled oligonucleotides with mitochondria
The colocalization of MitoTracker Green FM and Cy5-labeled oligonucleotides can be used to quantify release, given that the mitochondria are clearly spatially separated from the endosomes. Analysis of the cargo released into the cytoplasm gives mostly a diffuse signal. Here the concentration of the fluorescently labeled cargo at a specific site like the mitochondria yields a higher sensitivity. Alternatively, cargoes that are only activated in the cytoplasm like molecular beacons29 or enzymatically activated fluorochromes30 can be used for this purpose. We calculated colocalization coefficients to quantify the colocalization. It has been proposed that Manders’ coefficients (M1, M2) are more biologically meaningful than the Pearson correlation coefficient.31 Manders’ coefficient M1 describes the amount of colocalizing pixels of Cy5 using pixels generated by MitoTracker Green FM. The signal of MitoTracker Green FM was the same at the different incubation times (due to the unchanged staining procedure) and only the signal of Cy5 changed. Figure 4A shows quantification of the colocalization by analyzing M1 in every cell line and for every incubation time. Each depicted value is the average of 30–50 analyzed cells. It should be noted that submitochondrial localization is beyond the resolution of CLSM, so other techniques like stimulated emission depletion microscopy or other subdiffraction methods should be used.
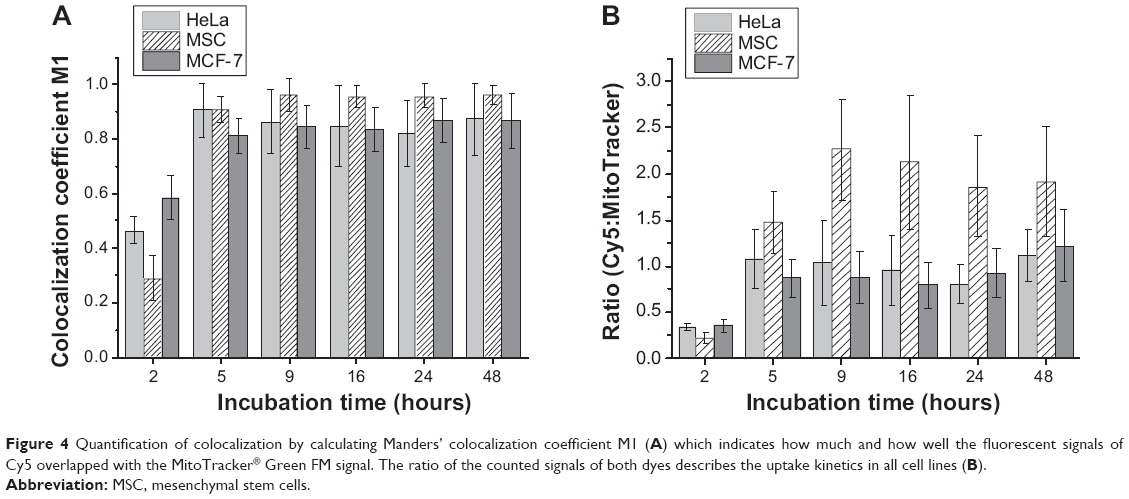 | Figure 4 Quantification of colocalization by calculating Manders’ colocalization coefficient M1 (A) which indicates how much and how well the fluorescent signals of Cy5 overlapped with the MitoTracker® Green FM signal. The ratio of the counted signals of both dyes describes the uptake kinetics in all cell lines (B). |
An increase in colocalization was observed in every cell line. Colocalization seemed to be saturated after 5 hours of incubation and leveled off for longer incubation times, meaning that, after 5 hours, all mitochondria in the sample have a Cy5 signal above the threshold set according to the calculations for the Manders’ coefficient. Therefore, the payload has to be released from the nanocapsules within this time frame. However, differences in the uptake behavior within a single cell line like HeLa could not be described with the calculated values. Another way to analyze the uptake kinetics was to calculate the ratio of pixels generated from Cy5 signals to those where MitoTracker Green FM was detected. The amount of pixels with MitoTracker signal was the same over time, as mentioned before, providing a value to normalize the Cy5 signal. Therefore, if the cells were incorporating more nanocapsules, an increase in the ratio of Cy5 to MitoTracker Green FM should be observed, and this is exactly what is shown in Figure 4B. Uptake increased over time in every cell line and leveled off after 9 hours.
Incubation studies with a higher capsule concentration
In addition to incubation of cells with a low concentration of nanocapsules (75 μg/mL), experiments with a higher capsule concentration of 300 μg/mL was performed to determine if there were any differences in uptake behavior. A higher uptake rate could influence further processing of the endosomal cargo, given that a larger amount of material needs to be degraded in the same time frame. Therefore, HeLa cells were incubated for 2 hours with 300 μg/mL of NC1 and the captured images were compared with images captured 2 hours after incubation with 75 μg/mL of NC1. After 2 hours of incubation with the higher concentration, a greater uptake was detected by CLSM. Accordingly, a higher release was also detected (Figure S8) when compared with the lower concentration. Therefore, there was no hindrance by the nanocapsules themselves, and release of the payload was also very rapid, with a high uptake rate. Again here the high variance between different cells was strikingly high.
FRET measurements
Having identified the increasing release behavior of oligonucleotides and colocalization with mitochondria after degradation of the capsule, the question arose as to whether the oligonucleotides were degraded after release from the PBCA capsules in the endosomes or during their passage through the cytoplasm. Therefore, we took advantage of the FRET effect of the common Cy3/Cy5 fluorophore pair in single-molecule fluorescence studies, which involves nucleic acids.32 FRET is a powerful tool for retrieving information on molecular proximity, orientation, and confirmation on the nm scale from samples.33 By applying double-labeled oligonucleotides with Cy3 as the donor on the 3′-end and Cy5 as the acceptor on the 5′-end of the oligonucleotide sequence, first experiments with pure oligonucleotides, that means without encapsulation and without the presence of cells, were performed via fluorescent measurements (Figure S9).
Three-dimensional scans of single-labeled oligonucleotides compared with double-labeled oligonucleotides demonstrated an indirect excitation of Cy5 by emission of Cy3, which was itself reduced due to the FRET effect (Figure S9C). Direct excitation of Cy5 caused a higher emission signal in respect to higher excitation intensity. Three-dimensional scans generated for single-labeled oligonucleotides (Figure S9A and B) demonstrated unaffected excitation and emission signals that differ significantly from the three-dimensional scans for double-labeled oligonucleotides. The latter had a clear emission peak at 649 nm (maximum of emission) when excited indirectly by the emission of the donor. Hence, cellular studies had to follow in order to also achieve a FRET effect in cells, if oligonucleotides were not degraded. Two different emission signals would be expected if transfer of degradation energy could no longer be ensured due to the lack of vicinity of donor and acceptor dye.
Further, we determined that only nucleotides labeled with Cy5 at the 5′-end located to the mitochondria, whereas oligonucleotides labeled at the 3′-end with Cy3 did not (data not shown). An oligonucleotide was double-labeled with Cy3 on the 3′-end and Cy5 at the 5′-end and encapsulated in a nanocarrier (NC2). After 24 hours of incubation in HeLa, these oligonucleotides were located at the mitochondria, as shown by the Cy5 signal (Figure 5B).
 | Figure 5 Confocal laser scanning microscopy studies after 24 hours of incubation demonstrated the fluorescence resonance energy transfer effect in live HeLa cells with NC2 nanocapsules containing double-labeled oligonucleotides. |
With excitation at 561 nm, no direct emission from Cy3 (colored in green, Figure 5A) was seen and only the FRET signal of Cy5 was detected (colored in red, Figure 5A). Therefore, we could conclude that the oligonucleotide was not cleaved. Staining of the mitochondria with MitoTracker Green FM was not performed as we intended to focus on the FRET effect in living cells and not on colocalization; however, the elongated structures that had been previously determined to be mitochondria are clearly visible in Figure 5.
In vitro studies with double-labeled nanocapsules
In order to study the fate of the polymeric shell material independently of the payload, TAMRA-decorated PBCA nanocapsules (NC3) as obtained by click chemistry offered the possibility to label the capsule’s shell when P(BCA)-co-P(PCA) was used to form that shell (Figure S10).
To confirm double-labeling of the shell and content, the nanocapsule was detected by CLSM as an aqueous dispersion with a nanocapsule concentration that was also used in subsequent cell experiments. Successful detection of both the TAMRA-labeled shell and the Cy5-labeled oligonucleotide contents (Figure S11) provided the basis of the cell uptake studies. MSC were incubated for 24 hours with NC3 and subsequently detected with CLSM without extra staining of the mitochondria. The nanocapsule shells colored in green appeared as spot-like structures (Figure 6A and B), whereas oligonucleotides formed common filament-like structures, well established from former experiments and shown in the merged images of both fluorescence signals (Figure 6C and D). It should be noted that the modifications done in NC3 by addition of the copolymer and decoration with TAMRA may alter uptake, and therefore the pharmacokinetics, although we did not observe obvious differences in this regard.
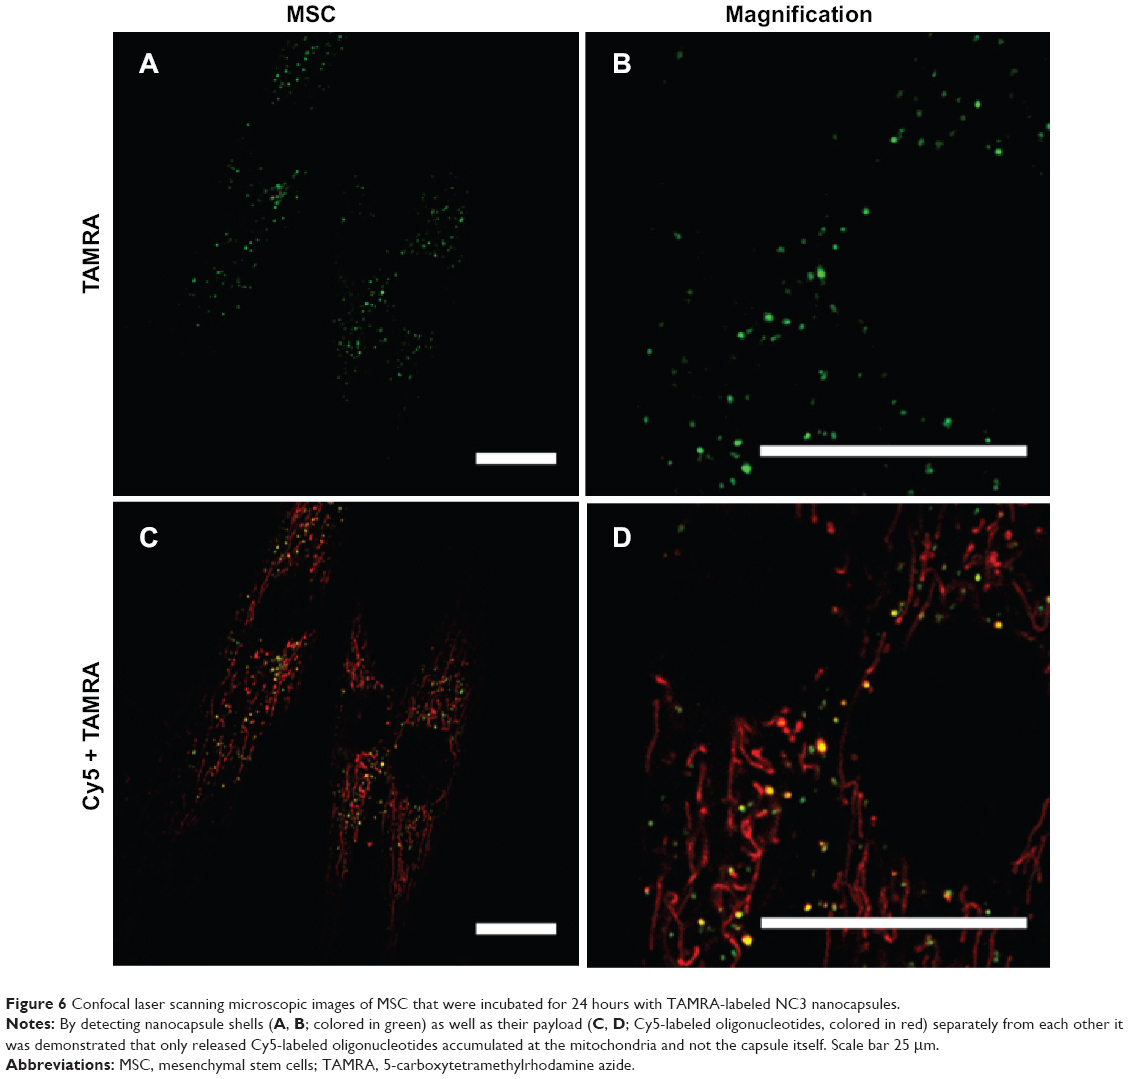 | Figure 6 Confocal laser scanning microscopic images of MSC that were incubated for 24 hours with TAMRA-labeled NC3 nanocapsules. |
Hence, only oligonucleotides showed accumulation on the mitochondria, but not the capsule itself. The presence of a few red dots indicated that there were some oligonucleotides not released as the red fluorescent spots colocalized with the green ones, which indicated the localization of the nanocapsules by their labeled shells. Some green spots were detected without colocalization with oligonucleotide fluorescence. This might represent remaining degradation products of the nanocapsules, most probably located in endosomes and lysosomes. Further investigation of the intracellular trafficking of the PBCA nanocapsule could help to elucidate the fate of these nanocapsules inside cells after uptake.
Cy5 as a representative of cyanine dyes associated with oligonucleotides ensured accumulation on the mitochondria. Although not the focus of our study, this points to the possibility of exploiting this capability to force other molecules with covalently bound cyanine dye to locate to the mitochondria. Mitochondrial diseases are often caused by defects of the mitochondrial genome, eg, mutations of mitochondrial fusion proteins, resulting in neurodegenerative diseases such as Alzheimer’s disease.34 An increased mitochondrial membrane potential leads to uncontrolled production of reactive oxygen species followed by DNA damage that might contribute to tumor progression.22 Therefore, this platform offers an excellent basic concept for the development of gene and drug delivery with rapid endosomal release, and demonstrates the targeting of a cargo to mitochondria.
Conclusion
While pharmacokinetics are usually studied on a macroscopic level, we demonstrated here for the first time the fate of a carrier platform (PBCA nanocapsules) and its cargo separately on a microscopic level. The nanocapsules were taken up by various cell lines. No toxic effects could be detected at high concentrations in any of the cell lines. Live cell imaging with CLSM for colocalization studies with the three different cell lines clearly demonstrated an increase in oligonucleotides released from the nanocapsules, and accumulation at the mitochondria with increasing incubation time. Experiments with the uncoupler dinitrophenol confirmed a strong dependency of cyanine dye-labeled oligonucleotides on the mitochondrial membrane potential. Most importantly, it could be shown that no degradation of the payload occurred during the delivery process. Further, it was shown that only the content of the nanocapsule, ie, the oligonucleotides, accumulated at the mitochondria and not the biocompatible and biodegradable shell itself. These results will make it possible to encapsulate drugs, siRNA, or enzymes, in PBCA nanocapsules for example, and offer an opportunity to deliver these payloads exclusively to then mitochondria when the structural requirements of the payload are fulfilled.
Acknowledgments
The authors would like to thank Henkel and Sasol Solvents for the chemicals they kindly provided for our research. The authors also wish to thank the Deutsche Forschungsgemeinschaft (DFG, SPP1313, LA1013/13-1; MA 3271/3-1 and SFB1066) for supporting the study. The Max Planck society is gratefully acknowledged.
Disclosure
The authors report no conflicts of interest in this work.
References
Wang J, Lu Z, Wientjes MG, Au JL. Delivery of siRNA therapeutics: barriers and carriers. AAPS J. 2010;12(4):492-503. | ||
Faraji AH, Wipf P. Nanoparticles in cellular drug delivery. Bioorg Med Chem. 2009;17(8):2950-2962. | ||
Immordino ML, Dosio F, Cattel L. Stealth liposomes: review of the basic science, rationale, and clinical applications, existing and potential. Int J Nanomedicine. 2006;1(3):297-315. | ||
Li J, Zhu Y, Hazeldine ST, Li C, Oupicky D. Dual-function CXCR4 antagonist polyplexes to deliver gene therapy and inhibit cancer cell invasion. Angew Chem Int Ed Engl. 2012;51(35):8740-8743. | ||
Dohmen C, Edinger D, Frohlich T, et al. Nanosized multifunctional polyplexes for receptor-mediated siRNA delivery. ACS Nano. 2012; 6(6):5198-5208. | ||
Marcovich R, Williams AL, Rubin MA, Wolf JS Jr. Comparison of 2-octyl cyanoacrylate adhesive, fibrin glue, and suturing for wound closure in the porcine urinary tract. Urology. 2001;57(4):806-810. | ||
Weiss CK, Kohnle MV, Landfester K, et al. The first step into the brain: uptake of NIO-PBCA nanoparticles by endothelial cells in vitro and in vivo, and direct evidence for their blood–brain barrier permeation. Chem Med Chem. 2008;3(9):1395-1403. | ||
Wohlfart S, Khalansky AS, Gelperina S, Begley D, Kreuter J. Kinetics of transport of doxorubicin bound to nanoparticles across the blood–brain barrier. J Control Release. 2011;154(1):103-107. | ||
Kreuter J, Ramge P, Petrov V, et al. Direct evidence that polysorbate-80-coated poly(butylcyanoacrylate) nanoparticles deliver drugs to the CNS via specific mechanisms requiring prior binding of drug to the nanoparticles. Pharm Res. 2003;20(3):409-416. | ||
Lorenz S, Tomcin S, Mailander V. Staining of mitochondria with Cy5-labeled oligonucleotides for long-term microscopy studies. Microsc Microanal. 2011;17(3):440-445. | ||
Baier G, Musyanovych A, Landfester K, Best A, Lorenz S, Mailander V. DNA amplification via polymerase chain reaction inside miniemulsion droplets with subsequent poly(n-butylcyanoacrylate) shell formation and delivery of polymeric capsules into mammalian cells. Macromol Biosci. 2011;11(8):1099-1109. | ||
Mailander V, Landfester K. Interaction of nanoparticles with cells. Biomacromolecules. 2009;10(9):2379-2400. | ||
Rhee WJ, Bao G. Slow non-specific accumulation of 2′-deoxy and 2′-O-methyl oligonucleotide probes at mitochondria in live cells. Nucleic Acids Res. 2010;38(9):e109. | ||
Musyanovych A, Landfester K. Synthesis of poly(butylcyanoacrylate) nanocapsules by interfacial polymerization in miniemulsions for the delivery of DNA molecules. Prog Colloid Polym Sci. 2008;134:120-127. | ||
Baier G, Siebert JM, Landfester K, Musyanovych A. Surface click reactions on polymeric nanocapsules for versatile functionalization. Macromolecules. 2012;45(8):3419-33427. | ||
Pittenger MF. Mesenchymal stem cells from adult bone marrow. Methods Mol Biol. 2008;449:27-44. | ||
van Meerloo J, Kaspers GJ, Cloos J. Cell sensitivity assays: the MTT assay. Methods Mol Biol. 2011;731:237-245. | ||
PerkinElmer. Volocity User Guide. 22.0 ed. Boston, MA, USA: PerkinElmer; 2011. Available from: http://cellularimaging.perkinelmer.com/pdfs/manuals/VolocityuserGuide.pdf. Accessed September 29, 2014. | ||
Murphy MP, Smith RA. Drug delivery to mitochondria: the key to mitochondrial medicine. Adv Drug Deliv Rev. 2000;41(2):235-250. | ||
Heller A, Brockhoff G, Goepferich A. Targeting drugs to mitochondria. Eur J Pharm Biopharm. 2012;82(1):1-18. | ||
Torchilin VP. Recent approaches to intracellular delivery of drugs and DNA and organelle targeting. Annu Rev Biomed Eng. 2006;8:343-375. | ||
Gogvadze V, Orrenius S, Zhivotovsky B. Mitochondria as targets for cancer chemotherapy. Semin Cancer Biol. 2009;19(1):57-66. | ||
Keil VC, Funke F, Zeug A, Schild D, Muller M. Ratiometric high-resolution imaging of JC-1 fluorescence reveals the subcellular heterogeneity of astrocytic mitochondria. Pflugers Arch. 2011;462(5):693-708. | ||
Buckler KJ, Vaughan-Jones RD. Effects of mitochondrial uncouplers on intracellular calcium, pH and membrane potential in rat carotid body type I cells. J Physiol. 1998;513 Pt 3:819-833. | ||
Scherer D, Robinson JR, Kreuter J. Influence of enzymes on the stability of polybutylcyanoacrylate nanoparticles. Int J Pharm. 1994;101(1-2):165-168. | ||
Ryan B, McCann G. Novel sub-ceiling temperature rapid depolymerization-repolymerization reactions of cyanoacrylate polymers. Macromol Rapid Comm. 1996;17(4):217-227. | ||
Leonard F, Kulkarni RK, Brandes G, Nelson J, Cameron JJ. Synthesis and degradation of poly(alkyl alpha-cyanoacrylates). J Appl Polym Sci. 1966;10(2):259-272. | ||
Lenaerts V, Couvreur P, Christiaens-Leyh D, et al. Degradation of poly(isobutyl cyanoacrylate) nanoparticles. Biomaterials. 1984;5(2): 65-68. | ||
Yu B, Wang X, Zhou C, et al. Insight into mechanisms of cellular uptake of lipid nanoparticles and intracellular release of small RNAs. Pharm Res. April 17, 2014. [Epub ahead of print]. | ||
Fichter M, Baier G, Dedters M, et al. Nanocapsules generated out of a polymeric dexamethasone shell suppress the inflammatory response of liver macrophages. Nanomedicine. 2013;9(8):1223-1234. | ||
Barlow AL, MacLeod A, Noppen S, Sanderson J, Guerin CJ. Colocalization analysis in fluorescence micrographs: verification of a more accurate calculation of Pearson’s correlation coefficient. Microsc Microanal. 2010;16(6):710-724. | ||
Iqbal A, Wang L, Thompson KC, Lilley DMJ, Norman DG. The structure of cyanine 5 terminally attached to double-stranded DNA: implications for FRET studies. Biochemistry. 2008;47(30):7857-7862. | ||
Pietraszewska-Bogiel A, Gadella TWJ. FRET microscopy: from principle to routine technology in cell biology. J Microsc. 2011;241(2):111-118. | ||
Wang XL, Su B, Lee HG, et al. Impaired balance of mitochondrial fission and fusion in Alzheimer’s disease. J Neurosci. 2009;29(28):9090-9103. |
Supplementary materials
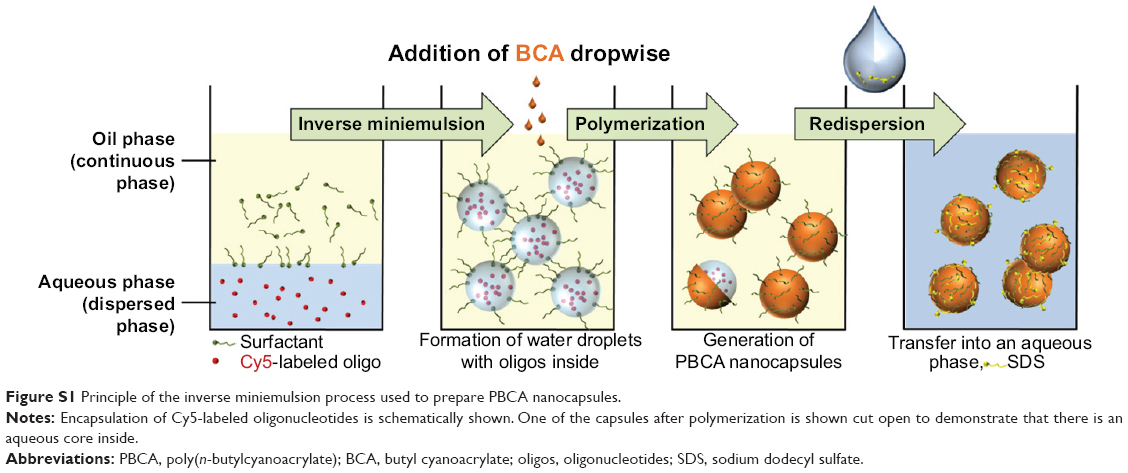 | Figure S1 Principle of the inverse miniemulsion process used to prepare PBCA nanocapsules. |
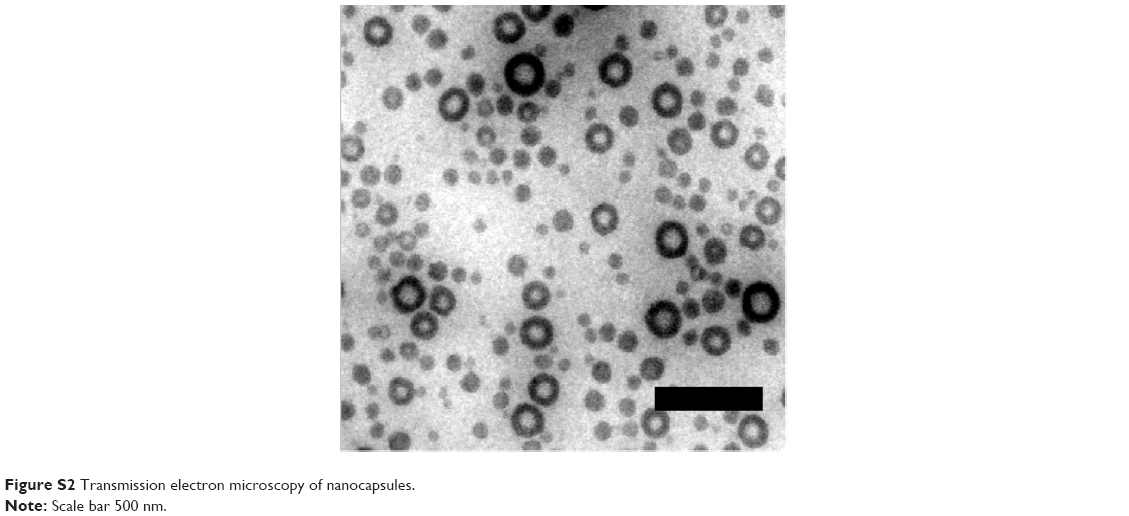 | Figure S2 Transmission electron microscopy of nanocapsules. |
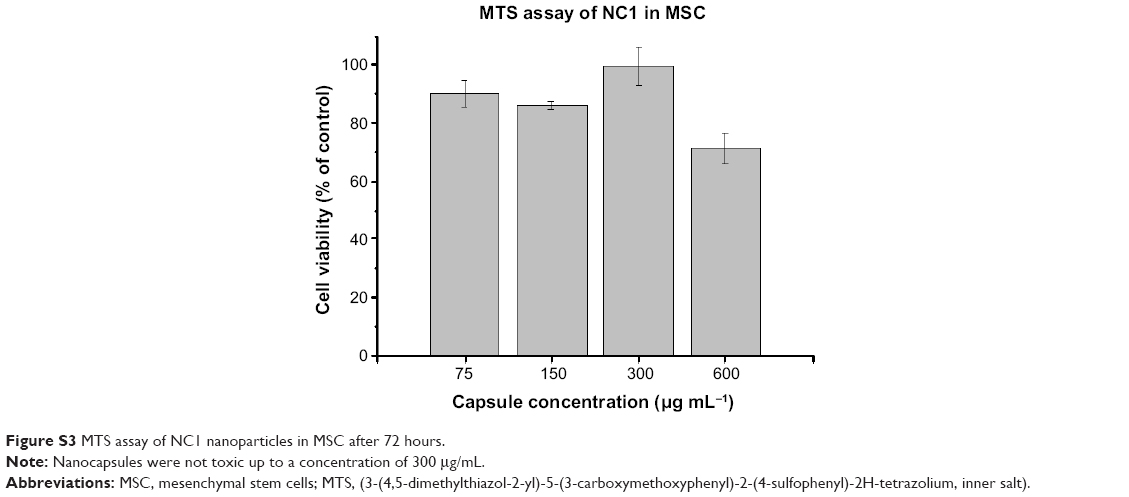 | Figure S3 MTS assay of NC1 nanoparticles in MSC after 72 hours. |
 | Figure S4 Structure of the MitoTracker® Green FM (A) and cyanine dye Cy5 (B) used for labeling the oligonucleotides in this study. |
 | Figure S5 (A) Confocal laser scanning microscopic images of HeLa, MSC, and MCF-7 cells after incubation with MitoTracker® Green FM and CellMask™ but without nanocapsules. No red fluorescence is seen in the micrographs. (B) Confocal laser scanning microscopic images of HeLa, MSC, and MCF-7 cells after incubation with NC1 for 2 hours. The upper row shows overlays of every fluorescence channel. The row beneath reflects the signals derived only from Cy5-labeled oligonucleotides as magnification in white. Scale bar 25 μm. |
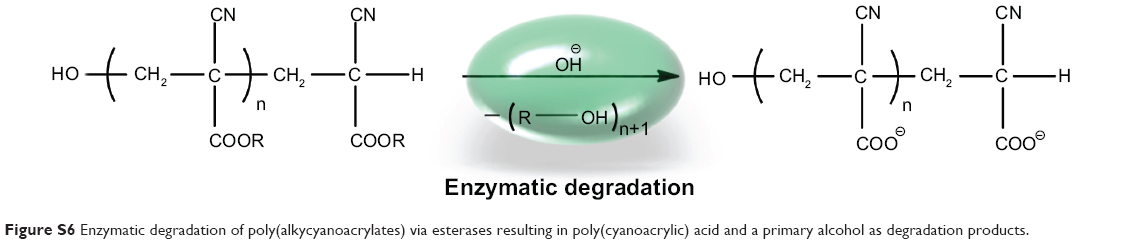 | Figure S6 Enzymatic degradation of poly(alkycyanoacrylates) via esterases resulting in poly(cyanoacrylic) acid and a primary alcohol as degradation products. |
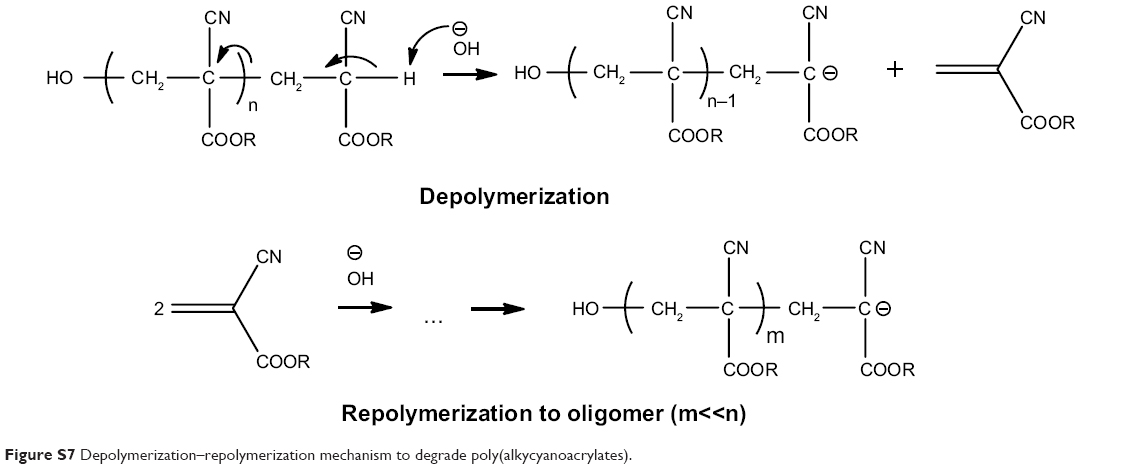 | Figure S7 Depolymerization–repolymerization mechanism to degrade poly(alkycyanoacrylates). |
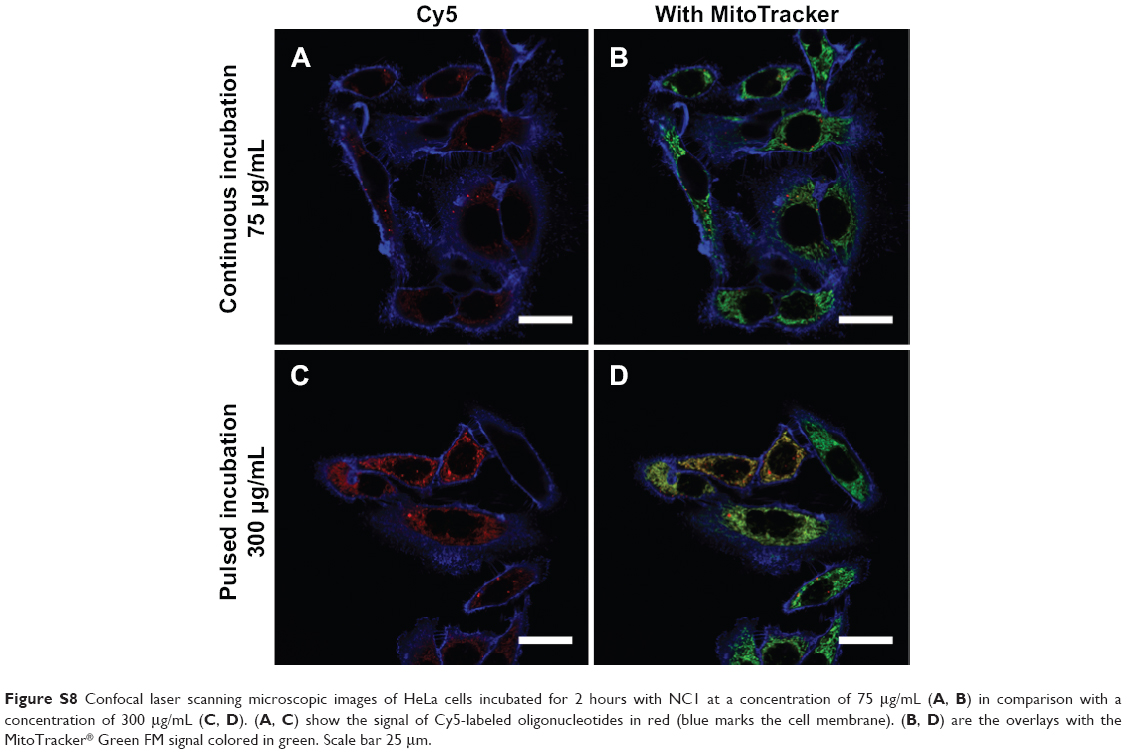 | Figure S8 Confocal laser scanning microscopic images of HeLa cells incubated for 2 hours with NC1 at a concentration of 75 μg/mL (A, B) in comparison with a concentration of 300 μg/mL (C, D). (A, C) show the signal of Cy5-labeled oligonucleotides in red (blue marks the cell membrane). (B, D) are the overlays with the MitoTracker® Green FM signal colored in green. Scale bar 25 μm. |
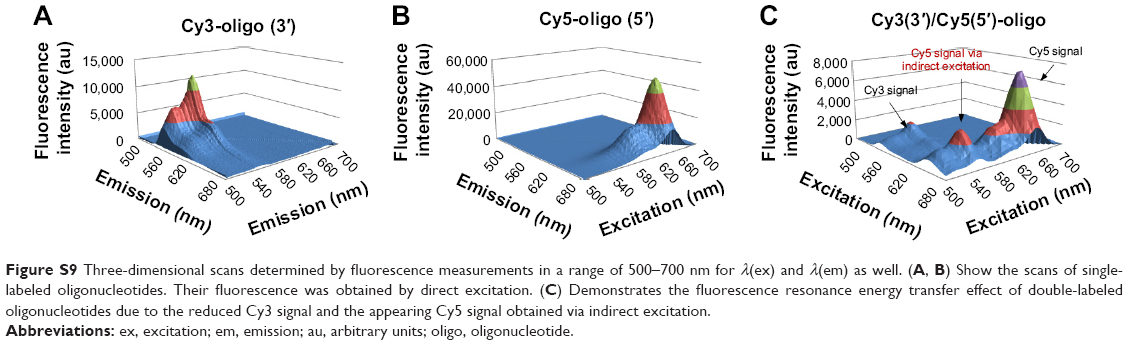 | Figure S9 Three-dimensional scans determined by fluorescence measurements in a range of 500–700 nm for λ(ex) and λ(em) as well. (A, B) Show the scans of single-labeled oligonucleotides. Their fluorescence was obtained by direct excitation. (C) Demonstrates the fluorescence resonance energy transfer effect of double-labeled oligonucleotides due to the reduced Cy3 signal and the appearing Cy5 signal obtained via indirect excitation. |
 | Figure S10 Click reaction between 5-carboxytetramethylrhodamine azide (I) and P(BCA)-co-P(PCA) (II with R=-propargyl or -butyl) to label the shells of nanocapsules fluorescently (III). |
 | Figure S11 Confocal laser scanning microscopic image of 5-carboxytetramethylrhodamine azide-labeled nanocapsules (in phosphate-buffered saline) that contained Cy5-labeled oligonucleotides. |
 © 2014 The Author(s). This work is published and licensed by Dove Medical Press Limited. The
full terms of this license are available at https://www.dovepress.com/terms
and incorporate the Creative Commons Attribution
- Non Commercial (unported, 3.0) License.
By accessing the work you hereby accept the Terms. Non-commercial uses of the work are permitted
without any further permission from Dove Medical Press Limited, provided the work is properly
attributed. For permission for commercial use of this work, please see paragraphs 4.2 and 5 of our Terms.
© 2014 The Author(s). This work is published and licensed by Dove Medical Press Limited. The
full terms of this license are available at https://www.dovepress.com/terms
and incorporate the Creative Commons Attribution
- Non Commercial (unported, 3.0) License.
By accessing the work you hereby accept the Terms. Non-commercial uses of the work are permitted
without any further permission from Dove Medical Press Limited, provided the work is properly
attributed. For permission for commercial use of this work, please see paragraphs 4.2 and 5 of our Terms.