")
Back to Archived Journals » Biosimilars » Volume 5
Pharmacokinetic and pharmacodynamic properties of a new biosimilar filgrastim TPI G-CSF in comparison to the marketed reference filgrastim Neupogen®: a double-blind, single-dose, two-period crossover trial
Authors Niazi S
Received 15 April 2015
Accepted for publication 14 September 2015
Published 3 November 2015 Volume 2015:5 Pages 93—101
DOI https://doi.org/10.2147/BS.S86638
Checked for plagiarism Yes
Review by Single anonymous peer review
Peer reviewer comments 4
Editor who approved publication: Professor Shein-Chung Chow
Sarfaraz K Niazi
Therapeutic Proteins International, LLC, Chicago, IL, USA
Abstract: Biosimilar biological products are a safe and effective alternative to branded biological agents. One of the most common uses of the therapeutic protein filgrastim, a biological drug (recombinant human granulocyte-colony stimulating factor), is to reduce the occurrence and duration of severe neutropenia and its associated serious complications. TPI G-CSF, a filgrastim product under development by Therapeutic Proteins International, LLC, is a proposed biosimilar to Amgen's marketed filgrastim, Neupogen®. To evaluate bioequivalence, we conducted a double-blind, randomized, two-period crossover study that took place at a single center and had a washout period of at least 2 weeks. The pharmacokinetic endpoints (area under the concentration-time curve from time 0 to time of the last observed/measured non-zero concentration [AUC0-t], AUC from time 0 extrapolated to infinity [AUC0-inf], and maximum observed concentration [Cmax]) and the pharmacodynamic endpoints (baseline-corrected area under the effect curve from time zero to the last non-zero cell count data [AUEC0-t] and maximum observed effect [Emax]) for the absolute neutrophil count were compared after administration of a subcutaneous 5 µg/kg dose of TPI G-CSF or Neupogen® in 58 healthy adults. These 58 healthy subjects (72% male, 34.8±10.5 years, 77.1±14.1 kg) were randomly assigned to a treatment sequence group (TPI G-CSF-Neupogen® or Neupogen®-TPI G-CSF); subjects received a single subcutaneous injection of 5 µg/kg in each period. The 95% pharmacodynamic and 90% pharmacokinetic geometric confidence intervals of the ratio (TPI G-CSF/Neupogen®) of least-squares means from the analysis of variance of the natural log-transformed data for each parameter fell within the approved bioequivalence range of 80% to 125%. There were no serious adverse events in this study. Treatment-emergent adverse events were reported by 69% of the study subjects, with a similar incidence between treatments. The notable incidents were treatment-emergent injection site reactions. Injections of TPI G-CSF and Neupogen® appeared to be safe and equally well tolerated.
Keywords: filgrastim, G-CSF, pharmacokinetic, pharmacodynamic, ANC, WBC
Introduction
Filgrastim is a recombinant, non-glycosylated form of human granulocyte-colony stimulating factor, with an additional N-terminal methionine added to allow expression in Escherichia coli.1 The molecule is composed of 175 amino acid residues, with one free Cys residue at position 18 and two intermolecular disulfide linkages – between Cys-37 and Cys-43 and between Cys-65 and Cys-75 – which are necessary for granulocyte-colony stimulating factor (G-CSF) bioactivity.1 The structure of recombinant human G-CSF is an anti-parallel 4-α-helical bundle with a left-handed twist and an up–up–down–down connectivity.1
The biological activity of G-CSF is initiated by the binding of G-CSF to the G-CSF receptor on myeloid progenitor cells and mature neutrophils.1,2 This binding initiates transduction signals that lead to the proliferation and differentiation of neutrophil committed progenitor cells, increase of mature neutrophils in the blood, and enhanced neutrophil function.2 G-CSF also mobilizes hematopoietic stem cells; the mechanism of action related to this effect is not fully understood.3 However, reports in the literature suggest the G-CSF receptor playing a critical role in this process.4
The pharmacokinetic characteristics of filgrastim are widely reported.5–7 The absorption is bi-segmental, and total body clearance of filgrastim follows a first-order pharmacokinetic model.7 A positive linear correlation is demonstrated between the parenteral dose administered and the serum concentration, as well as the areas under the concentration-time curves (AUCs).8 Subcutaneous (SC) administration of filgrastim results in a time to reach maximum serum concentration (Tmax) of 2 to 8 hours.9 The elimination half-life (T½el) is approximately 3.5 hours in normal subjects and cancer patients.9
Filgrastim increases the peripheral blood neutrophil count and causes a minor increase in monocytes.9 Filgrastim also mobilizes CD34+ stem cells; CD34+ stem cells in the peripheral blood serve as an indirect indicator of the marrow-repopulating ability of peripheral blood progenitor cells.10 According to the literature, the peak absolute neutrophil count (ANC) in healthy subjects is reached at approximately 12 hours after a single-dose administration of filgrastim.11 The ANC is expected to return to normal levels approximately 24 to 48 hours after the cessation of filgrastim administration.11,12 The amount of CD34+ cells in the peripheral blood increases up to 72 hours after administration of a single dose of filgrastim. The levels of peripheral blood progenitor cells return to baseline numbers approximately 336 hours after filgrastim cessation.8
Management of neutropenia is one of the main clinical applications of filgrastim. Neutropenia refers to an abnormally low count of neutrophils and in adults is generally defined as a neutrophil count of 1,500 or fewer per microliter of blood. Neutropenia may be caused by a variety of factors, such as diseases that damage bone marrow, congenital disorders, autoimmune disorders, and drugs that damage bone marrow (eg, chemotherapy), and can lead to severe bacterial and fungal infections. It has been shown that filgrastim can enable a higher-dose-intensity schedule, resulting in better antitumor effects and survival in patients receiving chemotherapy.13 Use of filgrastim also can help to prevent toxicity-related dose delays or reductions that contribute to reduced relative dose intensity, which may be associated with poor outcomes.14–16
In 1991, Amgen Inc.’s Neupogen® (Thousand Oaks, CA, USA) was the first licensed filgrastim product in the US9,17 and Europe.18 To date, several filgrastim biosimilars have been approved in Europe19–21 and one in the US.22 Neupogen® has clinical uses that include the following: to decrease the incidence of infection and reduce both the time to neutrophil recovery and the duration of fever following chemotherapy treatment; to reduce the incidence and duration of sequelae of neutropenia (eg‚ fever‚ infections‚ oropharyngeal ulcers) in symptomatic patients with congenital neutropenia; to mobilize hematopoietic progenitor cells into the peripheral blood; and to increase survival in patients exposed to myelosuppressive doses of radiation (hematopoietic syndrome of acute radiation syndrome).9 The first biosimilar filgrastim licensed by the US Food and Drug Administration was approved for the same indications as Neupogen® at the time of the biosimilar’s approval.22 Biosimilar agents, in general, have comparable safety and efficacy to approved reference products and may provide more affordable treatment options that offer increased access for the population at large.6,23
The development and approval process for biosimilars is a highly structured, tier-based system wherein the developer is required to demonstrate a high level of analytical and functional similarity, non-clinical safety, formulation stability, dosage form safety, and other patient safety elements prior to conducting studies in human subjects to compare pharmacokinetics, pharmacodynamics, and immunogenicity.24
A clinical pharmacokinetic–pharmacodynamic study was undertaken in healthy adult subjects. We report the results of this study, which was conducted to evaluate the biosimilarity of Therapeutic Proteins International’s TPI G-CSF (filgrastim) compared to the reference product Neupogen® (Amgen).
Materials and methods
Study design and objectives
The study reported in this communication was a single center, comparative pharmacokinetic and pharmacodynamic, double-blind, randomized, single-dose, two-period crossover study. The chosen design followed guidelines of the US Food and Drug Administration and European Medicines Agency, published at the time of the study, including guidelines on the investigation of bioavailability and bioequivalence.25,26 This study was conducted from December 2014 until January 2015 under IND 115333 on file with the US Food and Drug Administration. The study protocol and amendments were also approved by the IRB at Chesapeake Research Review, Inc., and Celerion conducted the study on behalf of Therapeutic Proteins International. The study was conducted in compliance with the Declaration of Helsinki27 and according to Good Clinical Practices.28
The primary objective of the study was to compare the pharmacokinetic and pharmacodynamic parameters of TPI G-CSF and Neupogen® after abdominal SC injection of a single 5 μg/kg dose in healthy subjects. The secondary objective of this study was to compare the safety, tolerability, and immunogenicity of TPI G-CSF and Neupogen® following injection.
Subjects and treatment
Eligible subjects were healthy, adult, non-tobacco-using male and female subjects aged 19 to 55 years with body weight between 40 and 125 kg and a body mass index from >18 kg/m2 to <32 kg/m2. All subjects provided written informed consent and were free to discontinue at any time.
Subjects were randomly assigned to one of the two sequences (TPI G-CSF-Neupogen® or Neupogen®-TPI G-CSF) of the treatment regimen for administration. All subjects received a single SC dose of 5 μg/kg of either TPI G-CSF or Neupogen® per period.
Study procedures
Following an initial screening period of up to 28 days, subjects entered two 10 (±3)-day treatment/assessment periods, which were separated by a washout period of at least 14 days. On Day 1 of each period, subjects received a single SC dose in the abdomen of 5 μg/kg TPI G-CSF or Neupogen®. Blood samples were collected prior to drug administration (predose) and at 0.5, 0.75, 1, 1.5, 2, 3, 4, 5, 6, 8, 10, 12, 16, 24, and 36 hours postdose to determine filgrastim concentrations for pharmacokinetic profiling. Samples were also collected prior to drug administration (predose) and at 0.5, 1, 2, 4, 6, 8, 10, 12, 16, 20, 24, 32, 48, and 72 hours postdose for ANC and white blood cell (WBC) analysis for pharmacodynamic evaluation. The level of any anti-filgrastim antibodies was monitored by blood draw, one prior to the first drug administration, one prior to the second drug administration, and a third at the follow-up visit on Day 10 (±3 days) after the last injection (Figure 1). Subjects were continuously observed over each period from at least 10 hours before drug administration (Day 1) until after the 36-hour postdose blood draw (Day 2). Safety was monitored throughout the study and was evaluated by clinical laboratory tests, physical examination, vital signs, injection site assessments, 12-lead electrocardiograms, and adverse events (AEs).
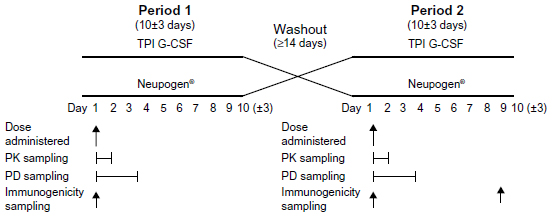 | Figure 1 Study design. |
Endpoints
The primary pharmacokinetic endpoints included AUC from time zero to the time of the last observed/measured non-zero concentration (AUC0–t), AUC from time zero extrapolated to infinity (AUC0–inf), and maximum observed concentration (Cmax) for filgrastim in the serum. Secondary pharmacokinetic endpoints included the residual area (ie, percent of AUC0–inf which is extrapolated), Tmax, apparent first-order terminal T½el, and apparent first-order terminal elimination rate constant (represents fraction of drug eliminated per unit of time [Kel]) for serum filgrastim. The primary pharmacodynamic endpoints included baseline-corrected area under the effect curve from time zero to the last non-zero cell count data (AUEC0–t) and maximum observed effect (defined as maximum cell count data [Emax]) for the ANC. Secondary pharmacodynamic endpoints included baseline-corrected time to reach Emax (Tmax,E) and uncorrected AUEC0–t, Emax, and Tmax,E for ANC.
Statistical analysis
All serum filgrastim pharmacokinetic concentrations and pharmacokinetic parameter descriptive statistics, as well as actual blood ANC and WBC count and pharmacodynamic parameter descriptive statistics, were generated using Phoenix® WinNonlin®. Summary statistics, including sample size (N), arithmetic mean (mean), standard deviation (SD), coefficient of variation (CV%), median, minimum, maximum, geometric mean, and geometric CV%, were calculated for all nominal concentration-time points and for all nominal cell count time points. Mean and individual filgrastim concentration-time profiles were presented on linear and semi-log scales; mean and individual baseline-corrected and uncorrected ANC and WBC count-time profiles were presented on a linear scale. Linear mean plots were presented with and without SD, and semi-log mean plots without SD.
Statistical analyses of pharmacokinetic and pharmacodynamic parameters were performed using SAS® Version 9.3.
A comparison of the natural log-transformed pharmacokinetic parameters (AUC0–t, AUC0–inf, and Cmax) and pharmacodynamic parameters (AUEC0–t and Emax) was made to compare the biosimilarity of filgrastim following the test or reference treatment by performing an analysis of variance. The initial analysis of variance model included treatment (TPI G-CSF or Neupogen®), group (due to logistical considerations within the clinic, subjects were dosed in several conduct groups), period nested within group [period (group)], sequence (TPI G-CSF-Neupogen® or Neupogen®-TPI G-CSF), and the interaction between treatment and group (treatment*group) as fixed effects, and subject nested within sequence and group [subject (sequence*group)] as a random effect. If the treatment*group interaction was not significant (P>0.05), then it was removed from the model and the analysis was rerun. If, in this analysis, the group was not significant (P>0.05), then a standard crossover model was run with treatment, period, and sequence as fixed effects and the subject nested within sequence [subject (sequence)] as a random effect. If treatment*group was significant (P≤0.05), then the analysis was run separately for each group with a model including treatment, period, and sequence as fixed effects, and subject nested within sequence [subject (sequence)] as a random effect.
The 90% confidence intervals (CIs) for pharmacokinetic parameters and 95% CIs for pharmacodynamic parameters were constructed for the difference in least-squares means between the two treatments on the natural log scale. Geometric least-squares means were calculated by exponentiating the treatment least-squares means from the analysis of variance. Exponentiation of the natural log scale differences and 90%/95% CIs provided the geometric mean ratios (GMRs) and 90%/95% CIs of the GMR. The intra-subject CV% was also estimated for each pharmacokinetic parameter included in the analysis. Biosimilarity was concluded if the 90% CIs for the pharmacokinetic parameter GMRs of test-versus-reference (or 95% CIs for pharmacodynamic parameters) lay entirely within the 80% to 125% reference interval.
Assuming intra-subject CV% would not exceed 18% for AUC and Cmax and an expected ratio within 0.90 and 1.11 for AUC, Cmax, AUEC0–t, and Emax, the study was to have a power of at least 90% to show pharmacokinetic and pharmacodynamic similarity, using the 90% geometric CIs of the ratio of test treatment to reference treatment within 80% to 125%, for a two-way crossover design with 52 subjects. To account for possible dropouts, a total of 58 subjects were enrolled.
A non-parametric analysis was conducted to test the differences in the pharmacokinetic parameters Tmax, Kel, and T½el in the original scale, using Walsh averages and the appropriate quantile of the Wilcoxon Signed Rank Test. Differences were considered significant if P<0.05. A non-parametric analysis was conducted to test the differences for the pharmacodynamic parameter Tmax,E.
As a measure of immunogenicity, results from the qualitative screening and confirmatory anti-recombinant human G-CSF assays were listed as Positive or Negative. Sample size was calculated for all nominal time points with a “Positive” or “Negative” mention.
AEs were routinely monitored and listed as percentage of subjects reporting the event.
Results
A total of 58 subjects were enrolled and 54 subjects completed the study. Four of the subjects were excluded from pharmacokinetic and pharmacodynamic summary statistics and statistical analyses because they did not complete Period 2 of the study. Another subject completed both study periods, but was excluded from the pharmacokinetic and pharmacodynamic summary statistics and statistical analyses because of incomplete dosing in Period 1. All 58 subjects were included in the safety analyses. The total duration of participation, including the screening period for each subject, was approximately 52 days until the last follow-up visit. As shown in Table 1, 44 (76%) of the healthy subjects were white, and the majority of subjects were male (42 subjects [72%]). The subjects were equally dispersed among treatment groups and their height, weight, and body mass index were similar.
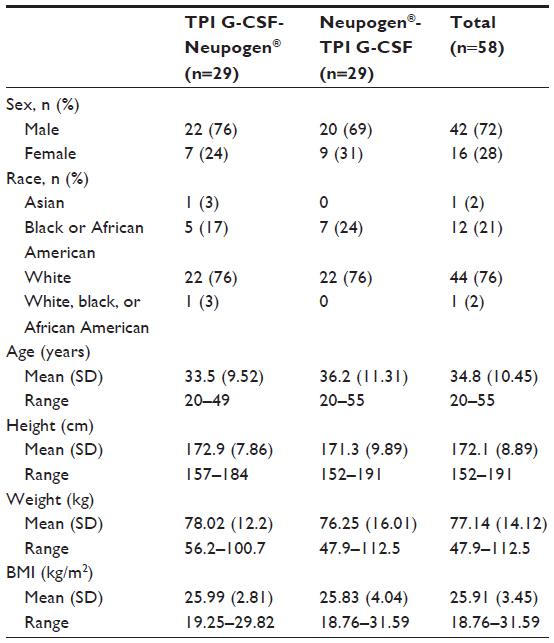 | Table 1 Demographic characteristics of the pharmacokinetic and pharmacodynamic study population |
Pharmacokinetics
Filgrastim was detectable in serum by the first scheduled time point (0.5 hour) postdose in all subjects and remained detectable in the majority of subjects throughout the sampling interval (up to 36 hours postdose). Serum filgrastim concentration-time mean profiles were comparable across the entire sampling schedule, with a slightly lower peak mean serum filgrastim concentration following SC injection of TPI G-CSF compared to Neupogen® (Figure 2A). Following both treatments, serum filgrastim concentrations declined in a biexponential manner.
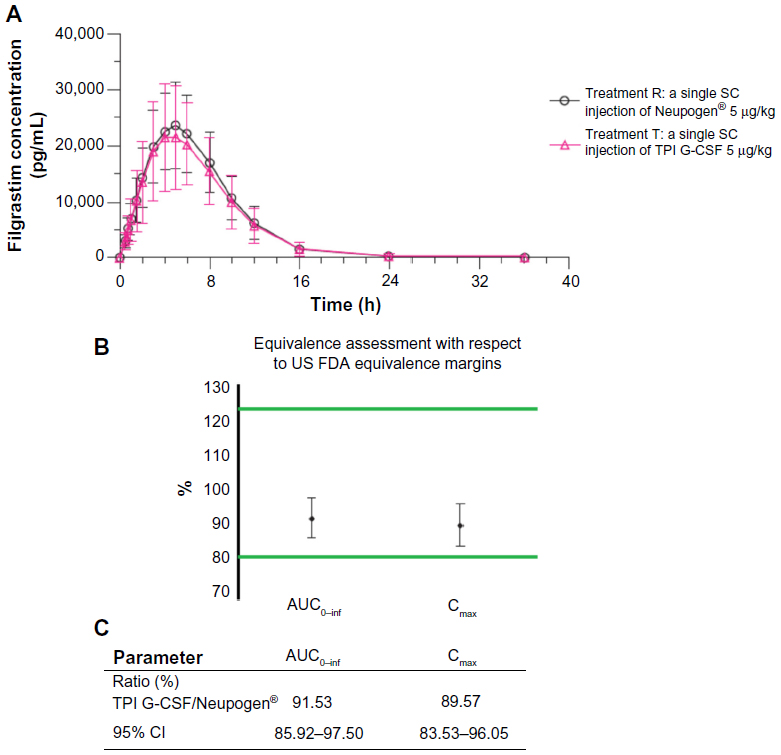 | Figure 2 (A) Mean (SD) observed recombinant G-CSF concentration-time profile of TPI G-CSF (Treatment T) and Neupogen® (Treatment R). (B) Statistical range display. (C) Statistical ranges. |
Mean serum filgrastim concentrations were highly variable following an SC injection of either treatment, with CV% values for scheduled time points ranging from 36.5% to 79.2% following TPI G-CSF and from 30.1% to 78.3% following Neupogen®. Individual serum filgrastim concentration-time profiles for 20 subjects (34% of the subjects) showed a dual or a triple peak of absorption. Among them, three subjects had a dual peak following each treatment, nine subjects had a dual peak only following SC injection of TPI G-CSF, two subjects had a triple peak only following SC injection of TPI G-CSF, and six subjects had a dual peak only following SC injection of Neupogen®. When multiple peaks of absorption were observed, the first peak always occurred between the 3- and 5-hour time points, the second peak between the 5- and 8-hour time points, and the third peak between the 9- and 10-hour time points.
The GMRs indicated that following a single SC injection, peak and overall exposure to filgrastim in serum (as measured by Cmax and AUCs, respectively) following TPI G-CSF was approximately 10% lower when compared to Neupogen®. However, the 90% CIs around the GMR of filgrastim Cmax, AUC0–t, and AUC0–inf for TPI G-CSF relative to Neupogen® were within the limits of 80% to 125% in favor of biosimilarity (Figure 2B and C). There was a less than 1% mean extrapolation of AUC0–t to AUC0–inf following both treatments.
The serum filgrastim mean half-life was 10% longer following SC injection for TPI G-CSF (6.3 hours) as compared to mean half-life following SC injection for Neupogen® (5.8 hours). The median Tmax was the same for both treatments (5 hours). The statistical comparisons of serum filgrastim Tmax (P=0.746), T½el (P=0.351), and Kel (P=0.609) following SC injection of TPI G-CSF and Neupogen® SC injection indicated that the differences in these three parameters were not significant (P>0.05) (Table 2).
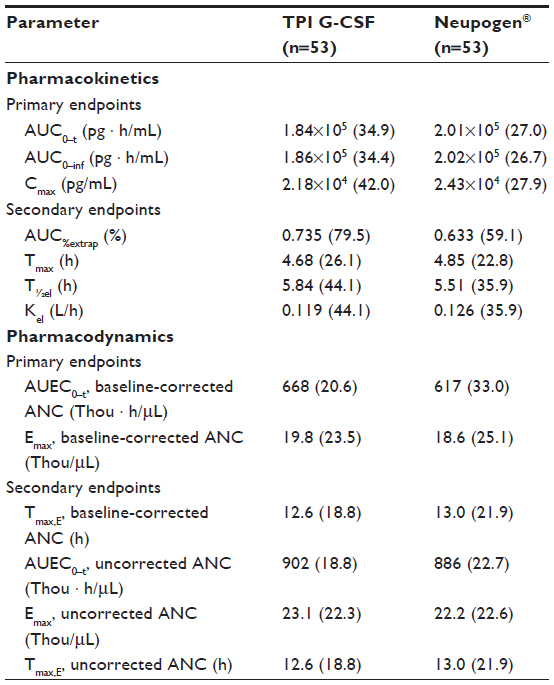 | Table 2 Pharmacokinetic and pharmacodynamic parameters following a single subcutaneous injection of 5 μg/kg TPI G-CSF or Neupogen®,* |
Pharmacodynamics
The mean blood ANC-versus-time profiles were determined following a single SC injection of either TPI G-CSF or Neupogen® given to healthy subjects. Mean uncorrected blood ANC declined following TPI G-CSF or Neupogen® administration, with an approximately 86% decrease from baseline observed at the first time point (0.50 hour postdose) following each SC injection of either TPI G-CSF or Neupogen®. Mean uncorrected blood ANC returned near baseline levels by 1 hour postdose and continued to increase until the 12-hour time point. Mean blood ANC then slowly decreased, returning near baseline levels at the end of the sampling interval at 72 hours postdose.
Uncorrected and baseline-corrected blood ANC mean profiles were comparable throughout the entire sampling schedule with a slightly higher peak mean blood ANC following SC injection of TPI G-CSF when compared to SC injection of Neupogen® (Figure 3A). Mean baseline-corrected blood ANC AUEC0–t and Emax were comparable between treatments with marginally higher values following TPI G-CSF injection (8% and 6% higher for AUEC0–t and Emax, respectively) when compared to Neupogen® injection. Median Tmax,E was reached at 12 hours following both treatments. Uncorrected mean blood ANC AUEC0–t and Emax were also comparable between treatments.
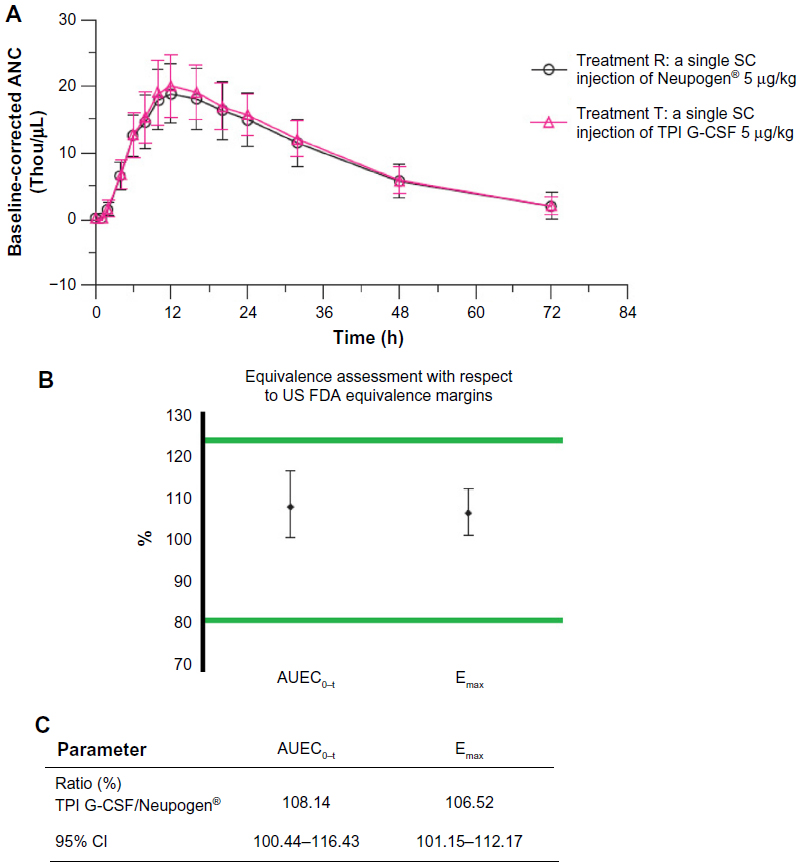 | Figure 3 (A) ANC-time profile of TPI G-CSF (Treatment T) and Neupogen® (Treatment R). (B) Statistical range display. (C) Statistical ranges. |
The peak and overall baseline-corrected blood ANC (as measured by geometric mean Emax and AUEC0–t) were similar following SC injection of either TPI G-CSF or Neupogen® with less than 10% difference in Emax and AUEC0–t between treatments. The 95% CIs around the GMR of blood ANC Emax and AUEC0–t for TPI G-CSF relative to Neupogen® were within the limits of 80% to 125% (Figure 3B and C).
The statistical comparison of baseline-corrected blood ANC Tmax,E following TPI G-CSF versus Neupogen® injection indicated there was no significant difference between treatments (P=0.480). Uncorrected and baseline-corrected WBC count mean profiles were similar throughout the entire sampling schedule following injections of TPI G-CSF and Neupogen®.
Immunogenicity
Three subjects had positive screening results at predose in Periods 1 and 2 and at follow-up, but all of these subjects were confirmed as seronegative after a recheck. Overall, none of the subjects were determined to have a positive anti-rhG-CSF detection.
Safety
In all, 58 subjects entered the study and received at least one dose of the study drug, while 53 subjects received a full dose of both study drugs. There were no deaths or serious AEs in this study. Two subjects were discontinued by the Principal Investigator due to AEs: one subject due to the AE of abdominal discomfort and one subject due to AEs of chills, myalgia, hyperhidrosis, cough, and pyrexia.
Overall, treatment-emergent AEs were reported by 69% of the subjects in this study with a similar incidence between treatments. The majority of AEs were mild in severity and considered probably or possibly related to the study drug.
Injection site AEs made up the most frequently reported category of events in this study experienced by 52% of subjects. Mild injection site erythema was the most frequently reported AE, experienced a total of 31 times by 17 (29%) subjects overall, with 13 subjects following TPI G-CSF and ten subjects following Neupogen® (some subjects experienced AE for each product but were only counted once in overall) (Table 3). The majority of these events occurred within 30 minutes of dosing and were resolved within 40 minutes, and all were considered as probably related to study drug. Injection site pain was reported a total of 26 times by 15 (26%) subjects overall, with seven subjects following TPI G-CSF and 12 subjects following Neupogen®. A total of 25 events were mild in severity and one (following TPI G-CSF) was moderate. The majority of events occurred within 30 minutes of dosing and were resolved within 1 hour. The Principal Investigator considered all 26 injection site pain events to be possibly related to study drug.
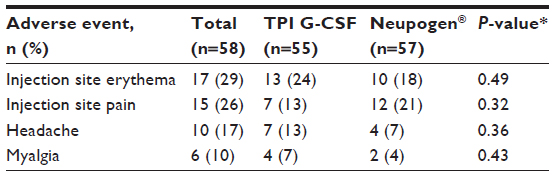 | Table 3 Treatment-emergent adverse events occurring in ≥10% of subjects overall (safety population) |
There were no treatment-related trends noted in vital sign, physical examination, or electrocardiogram assessments in this study. As expected, WBC count and ANC showed a significant decline initially after dosing, followed by a subsequent increase before the values were normalized by Day 4. No differences in laboratory values were noted between treatments.
Discussion
Overall, pharmacokinetic and pharmacodynamic parameters were similar following a single SC injection of either the test product (TPI G-CSF) or the reference product (Neupogen®). Following a single SC injection of either TPI G-CSF or Neupogen®, the 90% CIs around the GMR of filgrastim Cmax, AUC0–t, and AUC0–inf for TPI G-CSF relative to Neupogen® were within the limits of 80% to 125%. There were no significant median differences in serum filgrastim Tmax, T½el, or Kel between treatments (P-values >0.05). Uncorrected and baseline-corrected mean blood ANC AUEC0–t, Emax, and Tmax,E were similar between treatments. The 95% CIs around the GMR of baseline-corrected blood ANC Emax and AUEC0–t for TPI G-CSF relative to Neupogen® were also within the established limits of 80% to 125%. There were no significant differences in the baseline-corrected blood ANC pharmacodynamic parameter Tmax,E between treatments. Furthermore, uncorrected and baseline-corrected blood WBC mean profiles were similar between treatments.
Immunogenicity and safety results also were similar for both treatments. Immunogenicity assessments in this study demonstrated that none of the subjects had a positive anti-rhG-CSF detection that was confirmed by a recheck. Reported treatment-emergent AEs and other safety observations did not demonstrate any significant differences between treatments. Mild and transient injection site reactions were the most common AEs with both TPI G-CSF and Neupogen®.
Overall, the findings from this study are consistent with those of similarly-designed studies of other newly developed biosimilar filgrastim products that have been approved in Europe or the US.5,8,29,30 Establishing bioequivalence in terms of pharmacokinetics and pharmacodynamics is a key step in regulatory approval pathways (in the US and elsewhere), which is usually followed by establishing comparable efficacy and safety in patients.31 ANC may be considered a surrogate marker for efficacy; it is relevant in not only diagnosis of neutropenia, but also prognosis and assessment of treatment response.29 Thus, the results of this study suggest that TPI G-CSF may have an efficacy similar to that of Neupogen®.
In conclusion, pharmacokinetic and pharmacodynamic parameters for TPI G-CSF and the reference product, Neupogen®, were comparable following a single SC injection of 5 μg/kg. Single SC injections of TPI G-CSF and Neupogen® appeared to be safe and equally well tolerated in the healthy adult subjects in this study.
Acknowledgments
The author thanks Sherri D Jones, PharmD, of Pharma Write, LLC, for providing medical writing and editorial assistance. This manuscript was prepared according to the International Society for Medical Publication Professionals’ “Good Publication Practice for Communicating Company-Sponsored Medical Research: The GPP2 Guidelines.”
Disclosure
Sarfaraz K Niazi is an employee of Therapeutic Proteins International, LLC and the described research was funded by Therapeutic Proteins International, LLC. The author reports no other conflicts of interest.
References
Herman AC, Boone TC, Lu HS. Characterization, formulation, and stability of Neupogen® (Filgrastim), a recombinant human granulocyte-colony stimulating factor. In: Pearlman R, Wang YJ, editors. Formulation, Characterization, and Stability of Protein Drugs: Case Histories. New York: Springer; 2002:303–328. | |
Panopoulos AD, Watowich SS. Granulocyte colony-stimulating factor: molecular mechanisms of action during steady state and ‘emergency’ hematopoiesis. Cytokine. 2008;42(3):277–288. | |
Hoggatt J, Pelus LM. Mobilization of hematopoietic stem cells from the bone marrow niche to the blood compartment. Stem Cell Res Ther. 2011;2(2):13. | |
Christopher MJ, Rao M, Liu F, Woloszynek JR, Link DC. Expression of the G-CSF receptor in monocytic cells is sufficient to mediate hematopoietic progenitor mobilization by G-CSF in mice. J Exp Med. 2011;208(2):251–260. | |
Waller CF, Bronchud M, Mair S, Challand R. Pharmacokinetic profiles of a biosimilar filgrastim and Amgen filgrastim: results from a randomized, phase I trial. Ann Hematol. 2010;89(9):927–933. | |
Gascon P, Tesch H, Verpoort K, et al. Clinical experience with Zarzio(R) in Europe: what have we learned? Support Care Cancer. 2013;21(10):2925–2932. | |
Wang B, Ludden TM, Cheung EN, Schwab GG, Roskos LK. Population pharmacokinetic-pharmacodynamic modeling of filgrastim (r-metHuG-CSF) in healthy volunteers. J Pharmacokinet Pharmacodyn. 2001;28(4):321–342. | |
Lubenau H, Bias P, Maly AK, Siegler KE, Mehltretter K. Pharmacokinetic and pharmacodynamic profile of new biosimilar filgrastim XM02 equivalent to marketed filgrastim Neupogen: single-blind, randomized, crossover trial. BioDrugs. 2009;23(1):43–51. | |
Amgen. NEUPOGEN® (filgrastim) injection, for subcutaneous or intravenous use [prescribing information]. Thousand Oaks, CA: Amgen, Inc.; Mar 2015. | |
Schwinger W, Mache C, Urban C, Beaufort F, Toglhofer W. Single dose of filgrastim (rhG-CSF) increases the number of hematopoietic progenitors in the peripheral blood of adult volunteers. Bone Marrow Transplant. 1993;11(6):489–492. | |
Borleffs JC, Bosschaert M, Vrehen HM, et al. Effect of escalating doses of recombinant human granulocyte colony-stimulating factor (filgrastim) on circulating neutrophils in healthy subjects. Clin Ther. 1998;20(4):722–736. | |
Bronchud MH, Potter MR, Morgenstern G, et al. In vitro and in vivo analysis of the effects of recombinant human granulocyte colony-stimulating factor in patients. Br J Cancer. 1988;58(1):64–69. | |
Thatcher N, Girling DJ, Hopwood P, Sambrook RJ, Qian W, Stephens RJ. Improving survival without reducing quality of life in small-cell lung cancer patients by increasing the dose-intensity of chemotherapy with granulocyte colony-stimulating factor support: results of a British Medical Research Council Multicenter Randomized Trial. Medical Research Council Lung Cancer Working Party. J Clin Oncol. 2000;18(2):395–404. | |
Fauci JM, Whitworth JM, Schneider KE, et al. Prognostic significance of the relative dose intensity of chemotherapy in primary treatment of epithelial ovarian cancer. Gynecol Oncol. 2011;122(3):532–535. | |
Muhonen T, Jantunen I, Pertovaara H, et al. Prophylactic filgrastim (G-CSF) during mitomycin-C, mitoxantrone, and methotrexate (MMM) treatment for metastatic breast cancer. A randomized study. Am J Clin Oncol. 1996;19(3):232–234. | |
Wildiers H, Reiser M. Relative dose intensity of chemotherapy and its impact on outcomes in patients with early breast cancer or aggressive lymphoma. Crit Rev Oncol Hematol. 2011;77(3):221–240. | |
Center for Drug Evaluation and Research. Summary basis of approval for filgrastim. Rockville, MD: US Department of Health and Human Services; Feb 1991. | |
Amgen Ltd Neupogen 30 MU (0.3 mg/ml) solution for injection. Available from: http://www.medicines.org.uk/emc/medicine/27485. Accessed July 27, 2015. | |
European Medicines Agency. CHMP assessment report: Nivestim. London, UK: European Medicines Agency; 2009. | |
European Medicines Agency. CHMP assessment report for Zarzio. London, UK: European Medicines Agency; 2008. | |
European Medicines Agency. Assessment report for Tevagrastim. London, UK: European Medicines Agency; 2008. | |
US Food and Drug Administration. FDA approves first biosimilar product Zarxio [press release]. Silver Spring, MD: US Food and Drug Administration; 2015 [March 6]. Available from: http://www.fda.gov/NewsEvents/Newsroom/PressAnnouncements/ucm436648.htm. Accessed April 10, 2015. | |
Sun D, Andayani TM, Altyar A, MacDonald K, Abraham I. Potential cost savings from chemotherapy-induced febrile neutropenia with biosimilar filgrastim and expanded access to targeted antineoplastic treatment across the European union G5 countries: a simulation study. Clin Ther. 2015;37(4):842–857. | |
US Department of Health and Human Services. Scientific considerations in demonstrating biosimilarity to a reference product. Guidance for industry. Rockville, MD: US Department of Health and Human Services, Food and Drug Administration; Center for Drug Evaluation and Research; Center for Biologics Evaluation and Research; 2015. Available from: http://www.fda.gov/downloads/Drugs/Guidance ComplianceRegulatoryInformation/Guidances/UCM291128.pdf. Accessed May 12, 2015. | |
US Department of Health and Human Services. FDA guidance for industry. Scientific considerations in demonstrating biosimilarity to a reference product. Rockville, MD: Food and Drug Administration; Center for Drug Evaluation and Research; Center for Biologics Evaluation and Research; Apr 2015. Available from: http://www.fda.gov/downloads/DrugsGuidanceComplianceRegulatoryInformation/Guidances/UCM291128.pdf. Accessed October 1, 2015. | |
European Medicines Agency, Committee for Medicinal Products for Human Use (CHMP). Guideline on the investigation of bioequivalence. London, UK: European Medicines Agency; 2010. Available from: http://www.ema.europa.eu/docs/en_GB/document_library/Scientific_ guideline/2010/01/WC500070039.pdf. Accessed May 20, 2015. | |
World Medical Association. WMA Declaration of Helsinki – Ethical Principles for Medical Research Involving Human Subjects. France: World Medical Association, Inc.; 2012. | |
US Department of Health and Human Services. Guidance for industry E6 good clinical practice: consolidated guidance. Rockville, MD: Food and Drug Administration; Center for Drug Evaluation and Research); Center for Biologics Evaluation and Research; Apr 1996. Available from: http://www.fda.gov/downloads/Drugs/.../Guidances/ucm073122.pdf. Accessed October 1, 2015. | |
Gascon P, Fuhr U, Sorgel F, et al. Development of a new G-CSF product based on biosimilarity assessment. Ann Oncol. 2010;21(7):1419–1429. | |
Sorgel F, Schwebig A, Holzmann J, Prasch S, Singh P, Kinzig M. Comparability of biosimilar filgrastim with originator filgrastim: protein characterization, pharmacodynamics, and pharmacokinetics. BioDrugs. 2015;29(2):123–131. | |
Chugh PK, Roy V. Biosimilars: current scientific and regulatory considerations. Curr Clin Pharmacol. 2014;9(1):53–63. |
 © 2015 The Author(s). This work is published and licensed by Dove Medical Press Limited. The full terms of this license are available at https://www.dovepress.com/terms.php and incorporate the Creative Commons Attribution - Non Commercial (unported, v3.0) License.
By accessing the work you hereby accept the Terms. Non-commercial uses of the work are permitted without any further permission from Dove Medical Press Limited, provided the work is properly attributed. For permission for commercial use of this work, please see paragraphs 4.2 and 5 of our Terms.
© 2015 The Author(s). This work is published and licensed by Dove Medical Press Limited. The full terms of this license are available at https://www.dovepress.com/terms.php and incorporate the Creative Commons Attribution - Non Commercial (unported, v3.0) License.
By accessing the work you hereby accept the Terms. Non-commercial uses of the work are permitted without any further permission from Dove Medical Press Limited, provided the work is properly attributed. For permission for commercial use of this work, please see paragraphs 4.2 and 5 of our Terms.