Back to Journals » Cancer Management and Research » Volume 11
PF4V1, an miRNA-875-3p target, suppresses cell proliferation, migration, and invasion in prostate cancer and serves as a potential prognostic biomarker
Authors Li D ![]() , Hao X, Dong Y, Zhang M, Song Y
, Hao X, Dong Y, Zhang M, Song Y ![]()
Received 17 September 2018
Accepted for publication 31 December 2018
Published 21 March 2019 Volume 2019:11 Pages 2299—2312
DOI https://doi.org/10.2147/CMAR.S187831
Checked for plagiarism Yes
Review by Single anonymous peer review
Peer reviewer comments 4
Editor who approved publication: Dr Rituraj Purohit
Dongyang Li,1 Xuanyu Hao,2 Yudi Dong,3 Mo Zhang,1 Yongsheng Song1
1Department of Urology, Shengjing Hospital of China Medical University, Shenyang, Liaoning, People’s Republic of China; 2Department of Rheumatology and Immunology, Shengjing Hospital of China Medical University, Shenyang, Liaoning, People’s Republic of China; 3Laboratory of Experimental Oncology, Medical Research Center, Shengjing Hospital of China Medical University, Benxi, Liaoning, People’s Republic of China
Background: PF4V1 is a novel protein in inflammation, angiogenesis, and cancer. However, the pathogenesis, underlying mechanisms, and the prognostic value of PF4V1 in prostate cancer (PCa) are still unclear.
Materials and methods: The PF4V1 expression and relation with survival were analyzed based on a large sample size in the Cancer Genome Atlas. In vitro, the overexpression of PF4V1 was conducted in DU145 and LNCaP cells. Cell Counting Kit-8, colony formation, wound healing, and Transwell® assays were preformed to test biological functions of PF4V1 and miR-875-3p in PCa. Western blotting was used to measure downstream markers in AKT pathways and epithelial–mesenchymal transition (EMT). In vivo experiments were performed to test the therapeutic effect of PF4V1 protein to PCa via a mouse model.
Results: The expression of PF4V1 was significantly lower in 497 PCa samples than in 52 normal controls (P=0.0012). High PF4V1 expression (normalized by TP53) was associated with poor disease-free survival (DFS) and good overall survival (OS) in PCa (P<0.05). PF4V1 was underexpressed in four PCa cell lines than in normal prostate cells. Overexpression of PF4V1 could significantly suppress the proliferation, migration, and invasion of DU145 and LNCaP cells (P<0.05). Moreover, miR-875-3p targeted the 3’-untranslated region of PF4V1 and derepressed the inhibitory function of PF4V1 in PCa (P<0.05). Key proteins such as p-AKT/p-ERK/Snail/Slug/N-cadherin were downregulated, while E-cadherin was upregulated when PF4V1 was overexpressed in PCa cells. Finally, intratumoral injection of PF4V1 protein could significantly inhibit PCa growth in vivo.
Conclusion: PF4V1 can suppress the proliferation, migration, and invasion of PCa cells by regulating AKT/ERK pathways and EMT. Elevated PF4V1/TP53 expression is correlated with poorer DFS and better OS in the patients with PCa. The miR-875-3p-PF4V1 axis may be a new therapeutic target site in PCa.
Keywords: PF4V1, miR-875-3p, prostate cancer, survival
Introduction
Prostate cancer (PCa) is the commonest malignancy in Western men and the second leading cause of cancer-related death in men worldwide.1,2 The National Cancer Institute estimates 164,690 new PCa cases and 29,430 deaths in the USA in 2018.3 As PCa contains heterogeneous phenotypes from indolent to aggressive forms, it is urgently necessary to develop novel parameters or biomarkers in early diagnosis and survival prognosis. Good biomarkers can help doctors to stratify risk, make treatment strategies, and monitor effects.4,5 As described in the previous article,6 we used the isobaric tags for relative and absolute quantitation technology to find that the combination of three proteins (serum PF4V1, PSA, and urine CRISP3) had an excellent diagnostic efficacy of PCa. Among them, the function, mechanism, and potential prognostic value of PF4V1 in PCa are still largely unknown.
miRNA is a class of endogenous, short, single-stranded, noncoding RNA. It is widely acknowledged that miRNA can regulate the posttranscription process of genes by targeting mRNAs.7,8 Previous studies have reported that miRNAs played crucial roles in cancer biological processes including tumorigenesis, proliferation, migration, invasion, and metastasis.9,10 In terms of PCa, aberrant miRNA expression results in the inappropriate activation or inhibition of downstream pathways, such as p53/PTEN/NF-κB/mTOR.11,12 Bioinformatic analysis is a primary method to identify possible target mRNAs of miRNAs.13 Based on multiple expression profiles, our group found that several differently expressed miRNAs were important in the miRNA–mRNA regulatory networks of PCa.14 Similarly, we deduce that there will also be some miRNAs that may target PF4V1 in PCa.
Therefore, in the present study, we investigated the role of PF4V1 in PCa proliferation, migration, and invasion by a series of in vitro experiments. Then, we performed in vivo experiments to test the therapeutic effect of PF4V1 protein to PCa via a mouse model. In addition, the miRNAs that might target PF4V1 were predicted, and miR-875-3p was validated by luciferase assays. We subsequently explored the downstream AKT/ERK/E-cadherin pathways that were regulated by PF4V1. We also analyzed the prognostic significance of PF4V1 in the overall survival (OS) and disease-free survival (DFS) of PCa patients. Hence, the present study provides new insights that PF4V1 can serve as a novel biomarker and a therapeutic target in PCa.
Materials and methods
Bioinformatics and the Cancer Genome Atlas (TCGA) analyses
The potential miRNAs that may target the PF4V1 mRNA were predicted by the intersection of four bioinformatics databases: 1) TargetScan (http://www.targetscan.org), 2) miRanda (http://www.microrna.org/), 3) miRWalk (http://zmf.umm.uni-heidelberg.de/apps/zmf/mirwalk2/), and 4) miRDB (http://mirdb.org/). The Gene Expression Omnibus data set GSE64333 (including 27 PCa samples and 27 normal prostate control tissues) was used to test the expression of miR-875-3p. We downloaded the “TCGA-PRAD” data from TCGA (https://tcga-data.nci.nih.gov/tcga/), which contained 499 PCa samples and 52 matched normal samples. We subsequently evaluated the expression of PF4V1 between tumor and normal samples. In addition, we analyzed the relationship between PF4V1 expression (normalized by total p53) and the OS and DFS in the available 490 PCa patients by drawing Kaplan–Meier survival curves.
Cell culture and transfection
Four human PCa cell lines (LNCaP, 22RV1, DU145, and PC-3) and a normal human prostate cell line (WPMY-1) were obtained from the Cell Bank of Chinese Academy of Sciences (Shanghai, People’s Republic of China). The cell lines were cultured in Roswell Park Memorial Institute (RPMI) 1640 medium (Biological Industries, Kibbutz Beit HaEmek, Israel) supplemented with 10% fetal bovine serum (FBS; Biological Industries), 100 U/mL penicillin, and 100 µg/mL streptomycin (Hyclone Laboratories, Logan, UT, USA), at 37°C in a 5% CO2 incubator.
The sequences of PF4V1 gene were inserted into a recombinant lentiviral pHBLV-CMV-ZsGreen-GFP-Puro vector (HANBIO, Shanghai, People’s Republic of China), Lv-PF4V1, while the negative control was named as Lv-NC. The cells were seeded at 1×10⁴/well in a 24-well plate and cultured for 48 hours. The medium was replaced with fresh antibiotics-free medium with 5 µg/mL polybrene and lentivirus solution (107 TU/mL, multiplicity of infection =10) for 24 hours. Then, the medium was replaced back to normal fresh culturing medium. Subsequently, the transfection effect was evaluated by fluorescence microscope, and the stable transfected cell lines were screened by puromycin (10 µg/mL) for three passages.
The mimics of miRNAs were synthesized by RiboBio (Guangzhou, People’s Republic of China). The wild/mutant-type PF4V1 vector plasmids were designed and produced by GeneChem (Shanghai, People’s Republic of China). The jetPRIME™ (Polyplus Transfection, Illkirch, France) was used for mimics/vectors transfection according to the manufacturer’s instruction. We added 10 µL mimics/inhibitor, 12 µL jetPRIME™, 120 µL buffer, and 1,858 µL RPMI 1640 culture medium in each well of the six-well plate (final mimics/inhibitor concentration =100 nM). After 48 hours of transfection, the cells were harvested.
Cell proliferation assays
Cell proliferation assays were performed by the Cell Counting Kit-8 (CCK-8; Dojindo Molecular Technologies, Inc., Kumamoto, Japan). The cells were seeded into a 96-well plate (5,000 cells/well) and cultured for 24 and 48 hours. CCK-8 (10 µL) was added per well and incubated for another 2 hours at 37°C in 5% CO2. The optical density was measured at 450 nm by a microplate reader. Cell proliferation was also evaluated by the colony formation assay. The cells were seeded into 6-cm dishes (100 cells/dish) and cultured for 10 days. The miR-875-3p mimics was transfected 48 hours before seeding and transfected again on the fifth day. At day 10, the medium was discarded, and the dishes were washed with PBS for three times. The colonies were fixed by methanol for 30 minutes and stained with 0.1% crystal violet. The numbers of colonies were counted (>50 cells/colony) under a microscope (Nikon Corporation, Tokyo, Japan).
Wound healing assay
About 2×10⁴ cells were seeded in 96-well plates and cultured to ~90% density. A straight wound was created manually with a clean 100 μL plastic pipette tip. The wells were washed with PBS. The cell migration areas were recorded by microscope every 24 hours (0, 24, and 48 hours).
Transwell® migration and invasion assay
After resuspended in serum-free RPMI 1640, about 1×10⁵ cells were seeded in each upper chamber (3422; Corning Costar®, Corning, NY, USA). To carry out invasion assay, the chambers were predealed with Corning Matrigel® (356243), while the migration assay did not require Matrigel®. The bottom wells were filled with 600 µL RPMI 1640 containing 30% FBS. After incubation for 24 hours, the upper chamber cells that did not pass through membrane were carefully wiped off by a cotton swab. Next, the cells were fixed by 4% paraformaldehyde and stained with crystal violet. Five random fields were counted in each well.
Dual-Luciferase reporter assay
The potential binding sites of miR-875-3p with PF4V1 were predicted by the following two bioinformatics software databases: miRanda and miRDB. The fragment containing probable binding sites from the 3’-untranslated region (3’-UTR) of PF4V1 was amplified and cloned into a pmiR-GV272 dual-luciferase vector (PF4V1-WT; GeneChem). The sequence of the putative binding site was replaced to construct the mutant-type dual-luciferase vector (PF4V1-Mut). The vectors and miR-875–3 p mimics were cotransfected into LNCaP and DU145 cells, and the Dual-Luciferase™ Reporter Assay System (Promega Corporation, Madison, WI, USA) was used to measure luciferase activity.
In vivo experiments in nude mice
Tumorigenesis experiments in vivo were carried out according to the guidelines approved by the Ethnic Committee of Shengjing Hospital of China Medical University (Approval Number: 2017PS170K). The animal welfare was followed by the Medical Laboratory Animal Management Guideline of the Ministry of Health of the People’s Republic of China. Five- to 8-week-old athymic mice were purchased from Vital/Charles River Laboratory Animal Technology Co., Ltd. (Beijing, People’s Republic of China). Human PCa 22RV1 cells (1×10⁶ in 100 µL PBS/Matrigel®, 1:1) were subcutaneously injected into the left flank of each mouse. We subsequently intratumorally injected recombinant human PF4V1 protein (25 µg/mouse, NBP2-51688; Novus Biologicals LLC, Centennial, CO, USA) three times per week. Tumor size was measured every 3 days, and the tumor volume was calculated as follows: V= (width2 × length × 0.5) mm.2 After 21 days, all mice were sacrificed, and the tumors were extracted to measure weight. The treatment group contained eight mice, and the control group contained four mice.
Quantitative real-time PCR (qRT-PCR)
Total RNA was extracted by TRIzol® reagent (Invitrogen, Carlsbad, CA, USA) according to the manufacturer’s protocol. The first-strand cDNAs of mRNAs were reverse-transcribed from 2 µg total RNA using PrimeScript RT-polymerase (TaKaRa, Kusatsu, Japan). The cDNAs for miRNAs were synthesized using Bulge-Loop™ (RiboBio). The qRT-PCR was conducted by using SYBR Premix Taq™ II (TaKaRa) with specific PCR primers (Sangon Biotech Ltd., Shanghai, People’s Republic of China). Table 1 lists the primer sequences. We chose GAPDH and U6 as internal controls because of their stability across all the groups studied. Relative quantification of RNA level was calculated by means of the 2−ΔΔCt method.
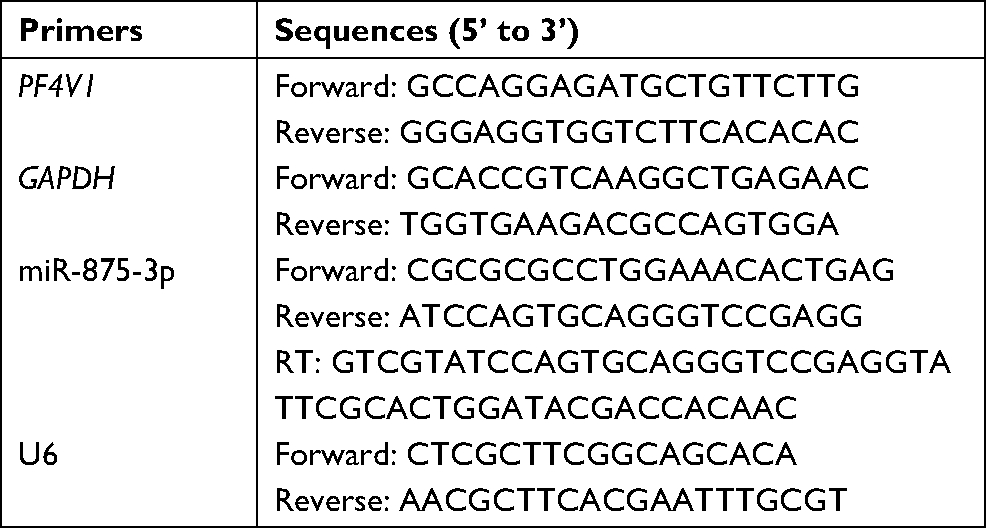 | Table 1 Sequences of primers in the qRT-PCR experiments in this study Abbreviations: qRT-PCR, quantitative real-time PCR; RT, real-time. |
Western blotting
Total protein was extracted by radioimmunoprecipitation assay buffer (Beyotime, Shanghai, People’s Republic of China) adding phenylmethylsulfonyl fluoride (Beyotime). Protein extracts (50–100 µg) in each condition were separated by sodium dodecyl sulfate–polyacrylamide gel electrophoresis (Beyotime) and transferred to polyvinylidene difluoride membrane (Millipore, Bedford, MA, USA). After blocking with 5% skim milk, the membranes were incubated with the following primary antibodies at 4°C overnight: PF4V1 (1:2,000; Thermo Fisher Scientific, Waltham, MA, USA), ERK (1:1,000; Abcam, Cambridge, UK), p-ERK (1:1,000; Abcam), AKT (1:1,000; Abcam), p-AKT (1:2,000; Cell Signaling Technology, Danvers, MA, USA), E-cadherin (1:1,000; Abcam), N-cadherin (1:2,000; Cell Signaling Technology), SRC-1 (1:2,500; Cell Signaling Technology), Snail (1:2,000; Cell Signaling Technology), Slug (1:2,000; Cell Signaling Technology), or GAPDH (1:10,000; KangChen Bio-tech, Shanghai, People’s Republic of China). The enhanced chemiluminescence reagent (Thermo Fisher Scientific) was used to detect the intensity of protein bands.
Statistical analyses
Statistical analyses were conducted by using SPSS Version 22.0 software (IBM Corporation, Armonk, NY, USA). All experiments were performed three times. Data were presented as mean ± SD. Differences between the groups were tested by Student’s t-test or chi-squared test. P-value <0.05 was considered to be statistically significant (*P<0.05, **P<0.01, ***P<0.001).
Results
Expression of PF4V1 is lower in PCa and associated with survival
To identify the aberrant expression of PF4V1 in PCa, we used the TCGA data for analysis, which contains 497 PCa samples and 52 normal control prostate tissues (http://ualcan.path.uab.edu/). The expression of PF4V1 was significantly decreased in PCa (Figure 1A), which indicated that PF4V1 was a tumor-suppressing factor. Gleason score is a crucial index of the pathological grade in PCa. The results revealed that PF4V1 expression was significantly lower in each Gleason score (6–10; Figure 1B). Interestingly, the PF4V1 level was extremely low in the 10 Gleason score group. However, we did not find the significant correlation of PF4V1 expression and other clinical parameters, such as age; PSA level; and TNM stage (Table S1).
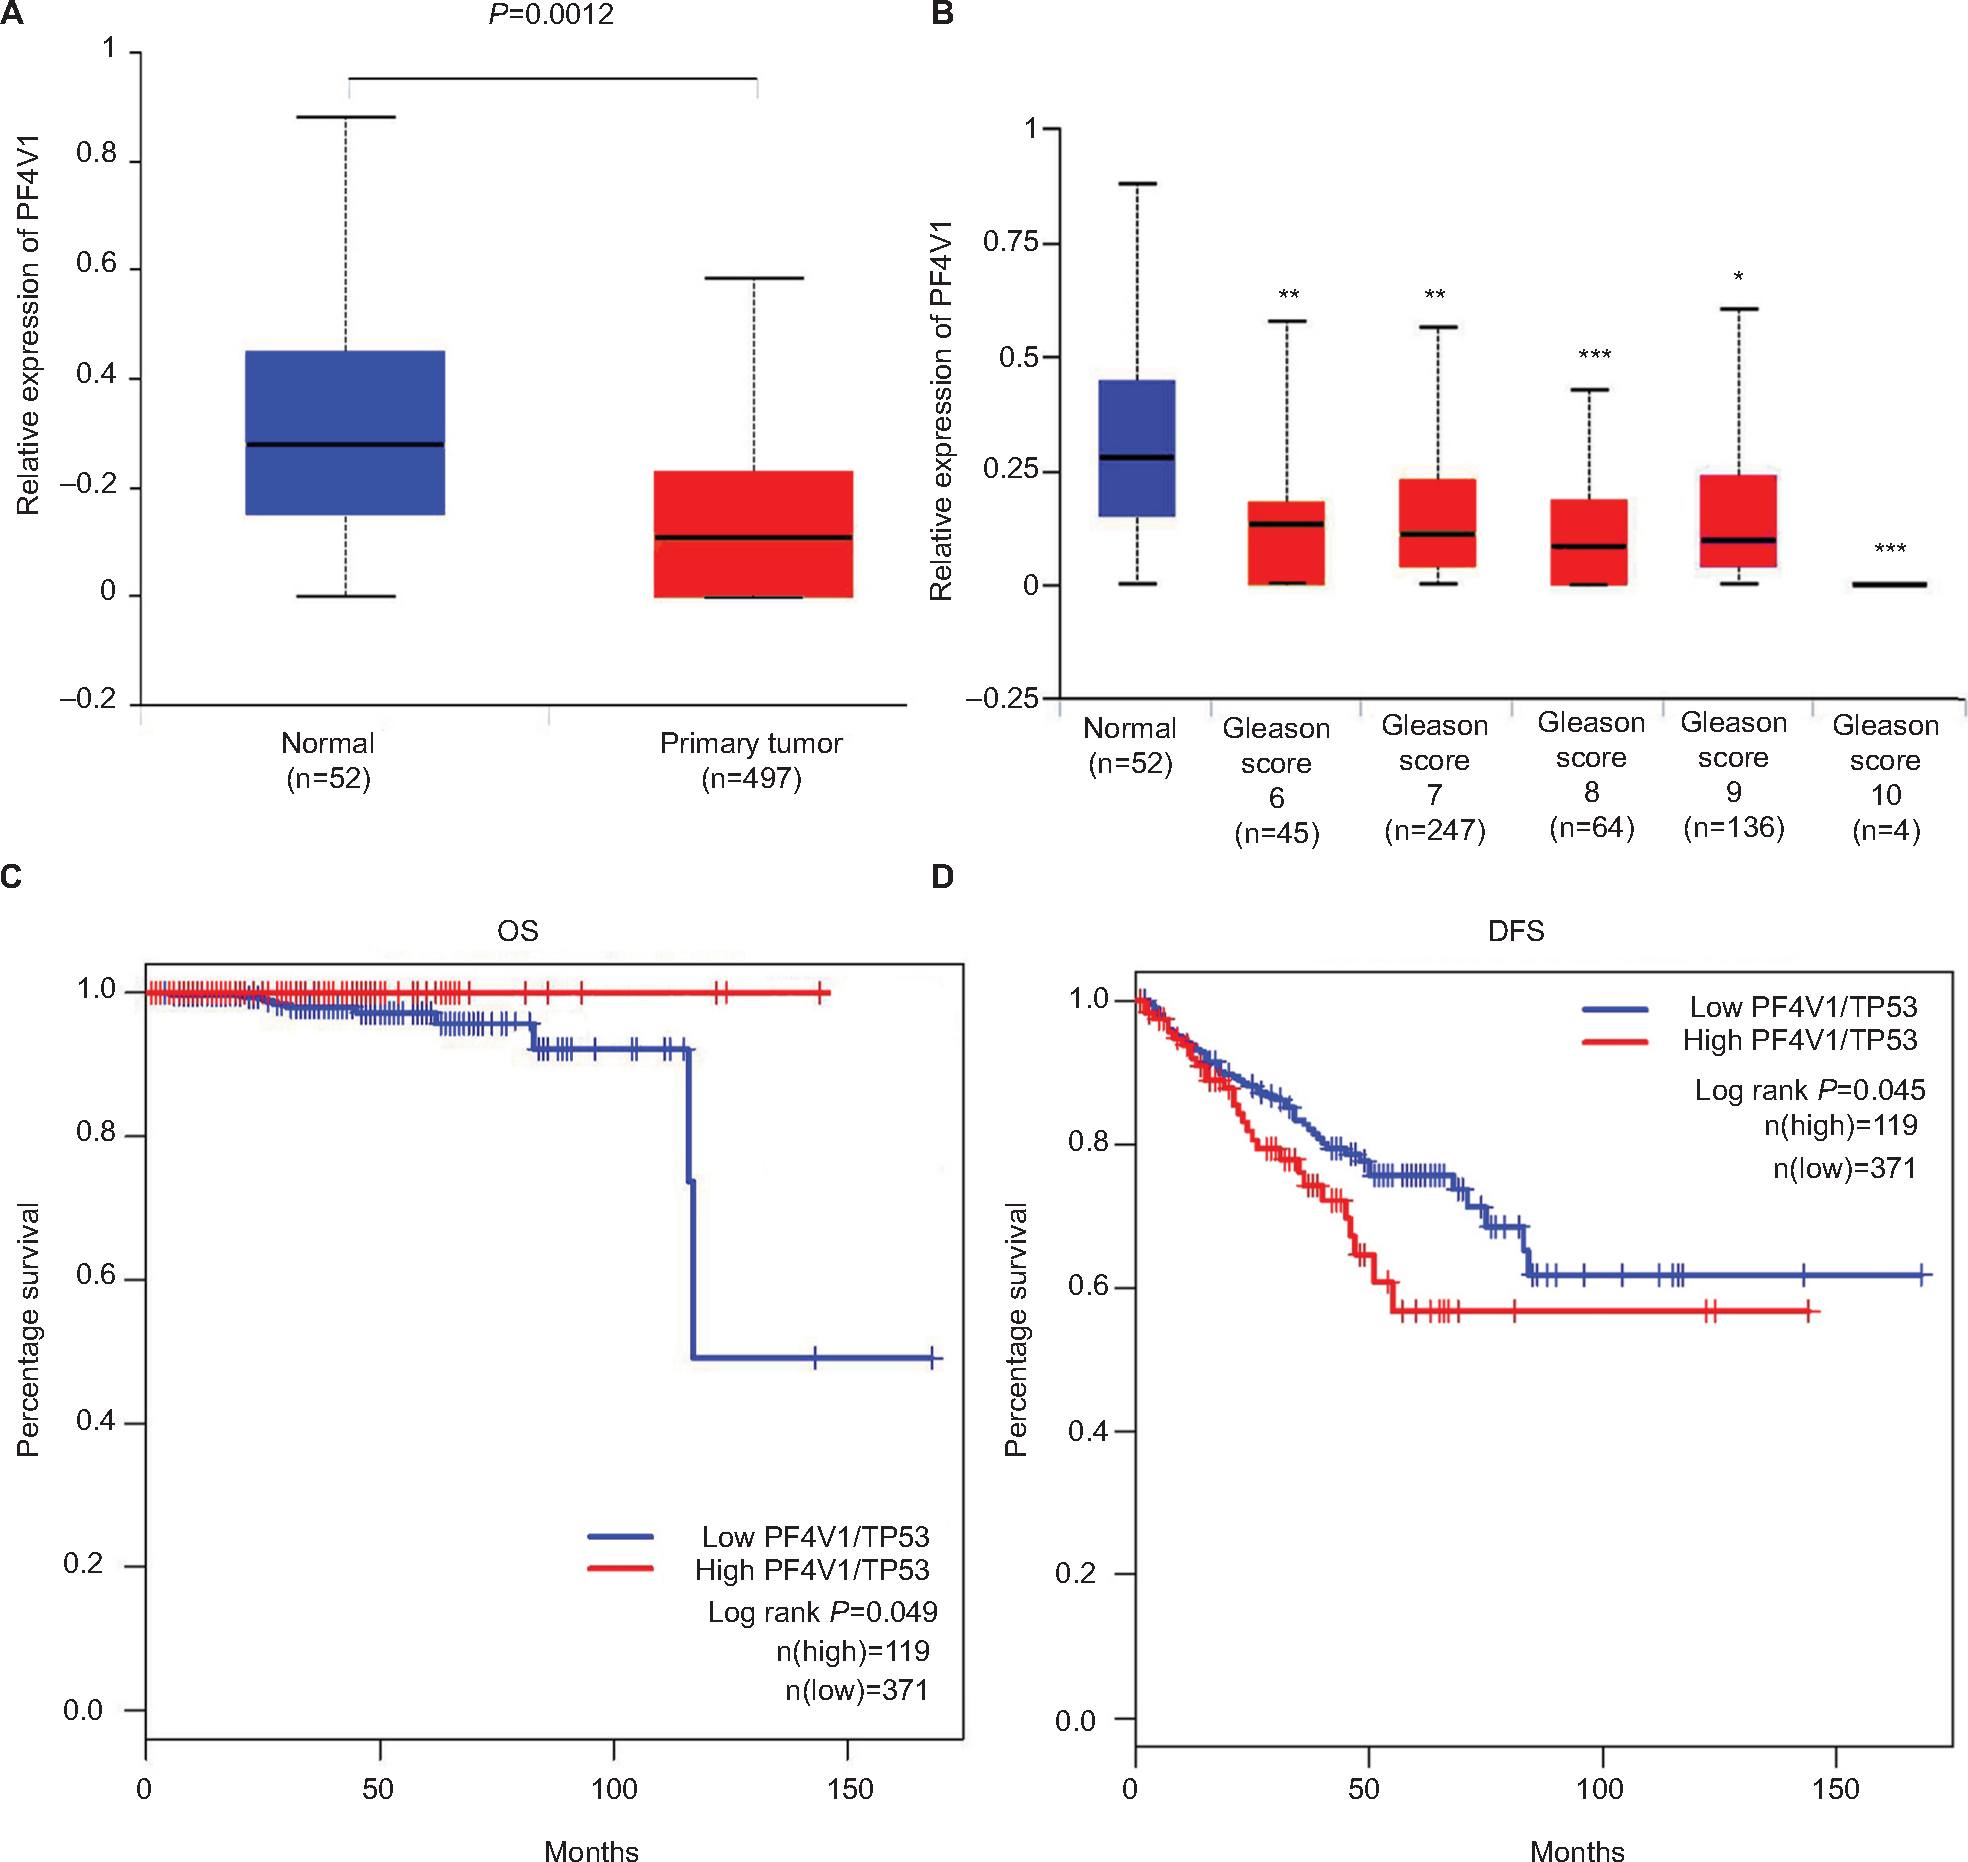 | Figure 1 PF4V1 is downregulated and has different prognostic values in OS and CSS in human PCa according to the TCGA database. Notes: (A) The expression of PF4V1 was significantly lower in 492 PCa samples than in 52 normal prostate samples (unpaired Student’s t-test, P=0.0012). (B) The expression of PF4V1 was significantly lower in PCa samples with different Gleason scores, compared with normal prostate samples (unpaired Student’s t-test, *P<0.05, **P<0.01, ***P<0.001). (C) Kaplan–Meier survival analysis for 490 patients with PCa stratified by high or low PF4V1 expression showed that high PF4V1/TP53 was significantly associated with good OS (P<0.05). (D) Kaplan–Meier survival analysis for 490 patients with PCa stratified by high or low PF4V1 expression showed that high PF4V1/TP53 was significantly associated with poor DFS (P<0.05). Abbreviations: CSS, cancer-specific survival; DFS, disease-free survival; OS, overall survival; PCa, prostate cancer; TCGA, The Cancer Genome Atlas. |
We subsequently analyzed the relationship between PF4V1 expression and OS/DFS in 490 patients with PCa in the TCGA database. TP53 is a well-known gene regulating many biological pathways in human cancer. In the present study, we used TP53 expression to normalize PF4V1 expression because single PF4V1 or single TP53 level was not related to OS or DFS at the same cutoff value, 75%. By drawing the Kaplan–Meier plots, we found that higher PF4V1/TP53 was significantly associated with better OS (Figure 1C) and poorer DFS (Figure 1D) than in the patients with low PF4V1/TP53 ratio.
In vitro, the overexpression of PF4V1 can suppress the proliferation, migration, and invasion of PCa
First, we tested the expression of PF4V1 at five human PCa cell lines by qRT-PCR (Figure 2A) and Western blotting (Figure 2B). The results showed that PF4V1 was underexpressed in PCa cell lines than in normal prostate cell line WPMY-1 (P<0.001). Among the four PCa cell lines, PF4V1 was significantly higher in PC-3 than in DU145, LNCaP, and 22RV1 at both mRNA and protein levels, whereas the protein level of PF4V1 was similar in WPMY-1 and PC-3.
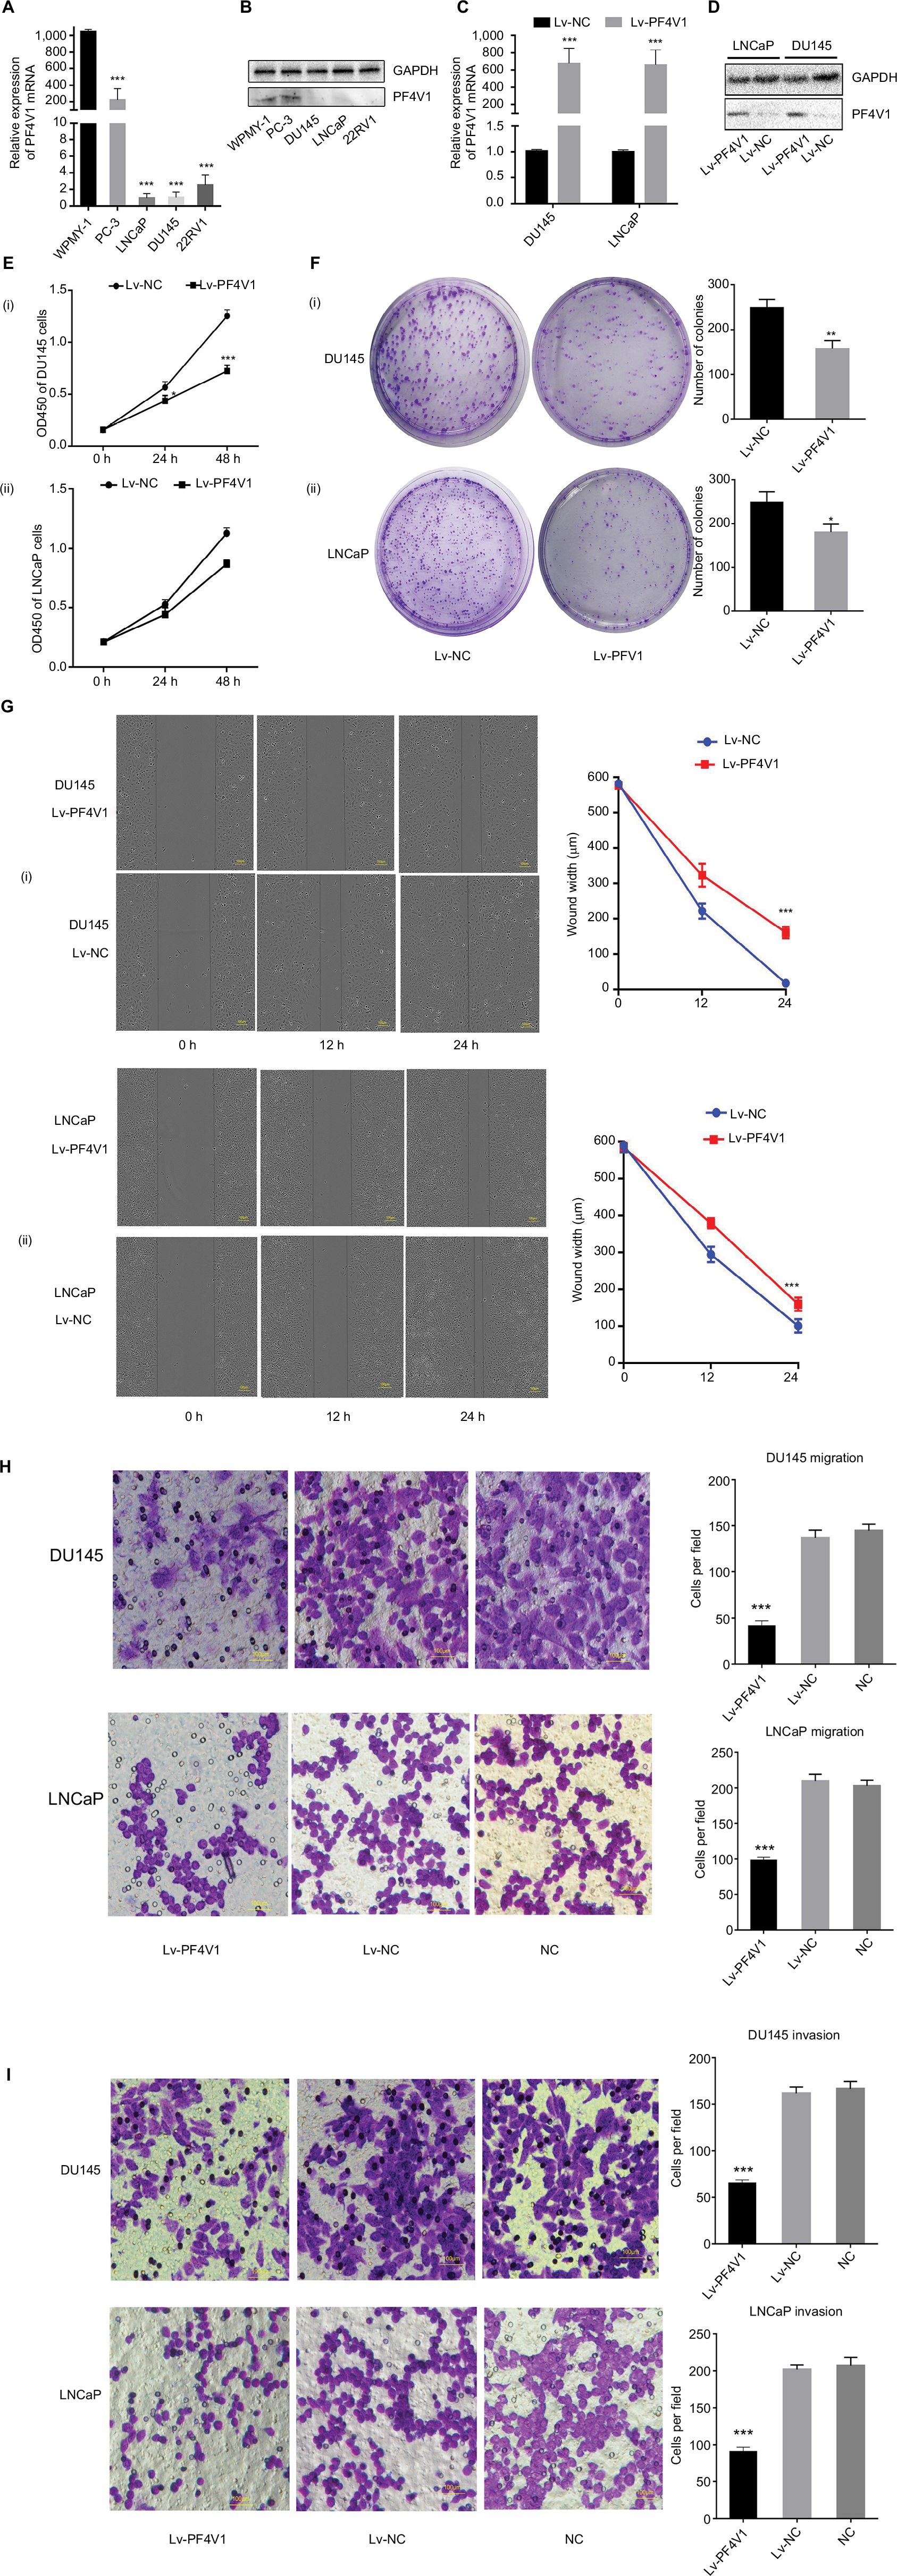 | Figure 2 In vitro, PF4V1 is downregulated and suppresses the proliferation, migration, and invasion of PCa cells. Notes: (A) The relative expression of PF4V1 was investigated by qRT-PCR in PCa cell lines PC-3, LNCaP, DU145, and 22RV1 and a normal human prostate cell line WPMY-1. GAPDH was used as an internal control. (B) The expression of PF4V1 at protein level was evaluated by Western blotting. (C) The relative expression of PF4V1 was investigated by qRT-PCR in PCa cell lines DU145 and LNCaP after lentivirus transfection. (D) The expression of PF4V1 at protein level was evaluated by Western blotting after lentivirus transfection. (E) The effects of PF4V1 on the proliferation of (i) DU145 and (ii) LNCaP cells were evaluated by CCK-8 tests. (F) The effects of PF4V1 on the proliferation of (i) DU145 and (ii) LNCaP cells were evaluated by colony formation tests. (G) The effects of PF4V1 on the migration of (i) DU145 and (ii) LNCaP cells were evaluated by wound healing assays. (H) The effects of PF4V1 on the migration of (i) DU145 and (ii) LNCaP cells were evaluated by Transwell® assays. (I) The effects of PF4V1 on the invasion of (i) DU145 and (ii) LNCaP cells were evaluated by Transwell® assays with Matrigel®. The results were acquired from three independent experiments, and error bars represent mean and SD (Student’s t-test, *P<0.05, **P<0.01, ***P<0.001). Abbreviations: CCK-8, Cell Counting Kit-8; PCa, prostate cancer; qRT-PCR, quantitative real-time PCR. |
To elucidate the biological function of PF4V1 in PCa, we used lentivirus carrying PF4V1 overexpression plasmids to transfect PCa cells. LNCaP is androgen-dependent and low-invasive, while DU145 is androgen-independent and relatively high-invasive. Therefore, we chose these two representative human PCa cell lines to perform functional experiments. After lentivirus transfection and puromycin screening, we measured the mRNA (Figure 2C) and protein levels (Figure 2D) of PF4V1. The results showed that the PF4V1 was significantly overexpressed at both mRNA and protein levels in DU145 and LNCaP cell lines in the Lv-PF4V1 group than in the empty lentivirus control (Lv-NC) group (P<0.001).
Then, we explored the effects of PF4V1 overexpression on the proliferation of DU145 and LNCaP cells by CCK-8 assay (Figure 2E) and colony formation assay (Figure 2F). The results indicated that upregulated PF4V1 could significantly repress the proliferation of both PCa cell lines. Meanwhile, the influence of PF4V1 on PCa migration was assessed by wound healing assay (Figure 2G) and Transwell® assay (Figure 2H). The results of both the experiments revealed that high PF4V1 could suppress the migration of DU145 and LNCaP cells. Moreover, the invasion ability of PCa cells was tested by Transwell® assay with Matrigel® (Figure 2I). The invasiveness of PF4V1-overexpressed DU145 and LNCaP cells was significantly lower than in the control groups (empty lentivirus and normal).
PF4V1 induces AKT/ERK pathways and epithelial–mesenchymal transition (EMT) in PCa cells
To determine the downstream regulatory pathways of PF4V1, we examined the expression of key protein in AKT/ERK pathways and EMT markers. The key proteins in AKT pathway such as AKT, ERK1/2, and SRC-1 were significantly downregulated when PF4V1 was highly expressed in DU145 (Figure 3A) and LNCaP (Figure 3B) cells. Simultaneously, the phosphorylated AKT and ERK proteins were also significantly decreased when PF4V1 is upregulated. These results indicated that PF4V1 might perform function by regulating the phosphorylation of AKT/ERK pathways. Furthermore, the EMT process is crucial in cancer migration and invasion. The key markers in EMT such as Snail and Slug were decreased when PF4V1 was overexpressed. High PF4V1 could also increase the expression of E-cadherin while decrease N-Cadherin expression in DU145 (Figure 3A) and LNCaP (Figure 3B) cells. To sum up, PF4V1 might induce the AKT/ERK pathways and EMT to suppress the proliferation, migration, and invasion of PCa cells.
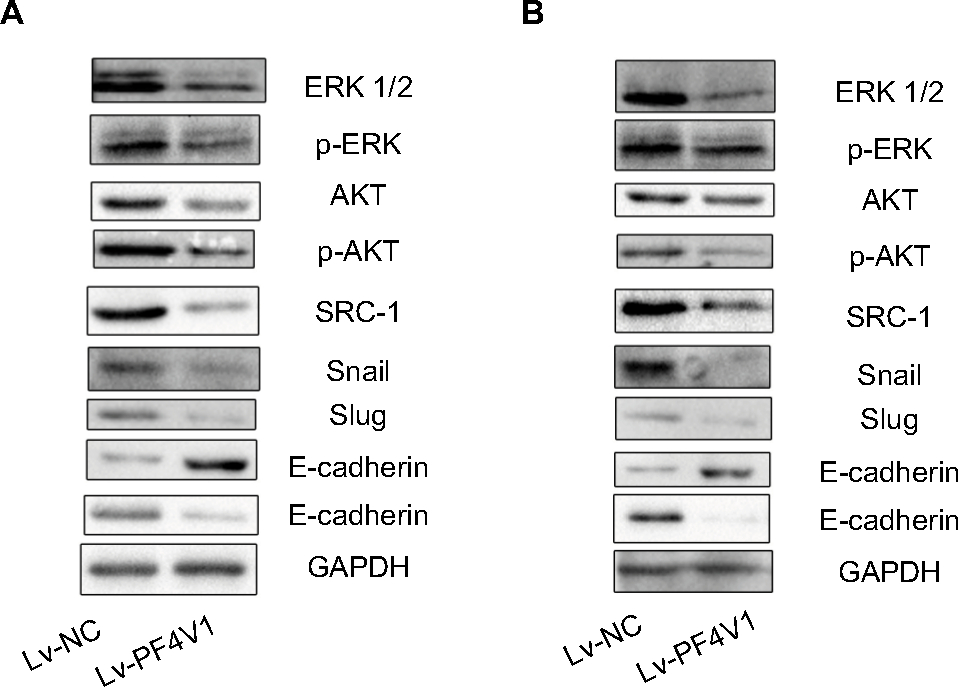 | Figure 3 PF4V1 suppresses the AKT/ERK pathway and EMT process in prostate cancer. Notes: Western blotting analysis of the potential downstream targets of PF4V1. The AKT, p-AKT, ERK, p-ERK, SRC-1, E-cadherin, N-cadherin, Snail, Slug, and GAPDH were tested by Western blotting in DU145 (A) and LNCaP (B) cells after Lv-NC or Lv-PF4V1 transfection. Abbreviation: EMT, epithelial–mesenchymal transition. |
In vivo intratumoral injection PF4V1 has a therapeutic effect of PCa
To determine the function of PF4V1 in vivo, we analyzed the tumor volume and tumor weight after PF4V1 protein intratumoral injection. After 3 weeks, we harvested tumor from every mouse in both the groups (Figure 4A). The tumor weight in PF4V1 treatment group was significantly lower than in control group (P<0.001, Figure 4B). Moreover, the growth of tumor volume was significantly suppressed in PF4V1 group (P<0.001, Figure 4C). Therefore, these results indicated that PF4V1 may have a potential treatment effect in PCa.
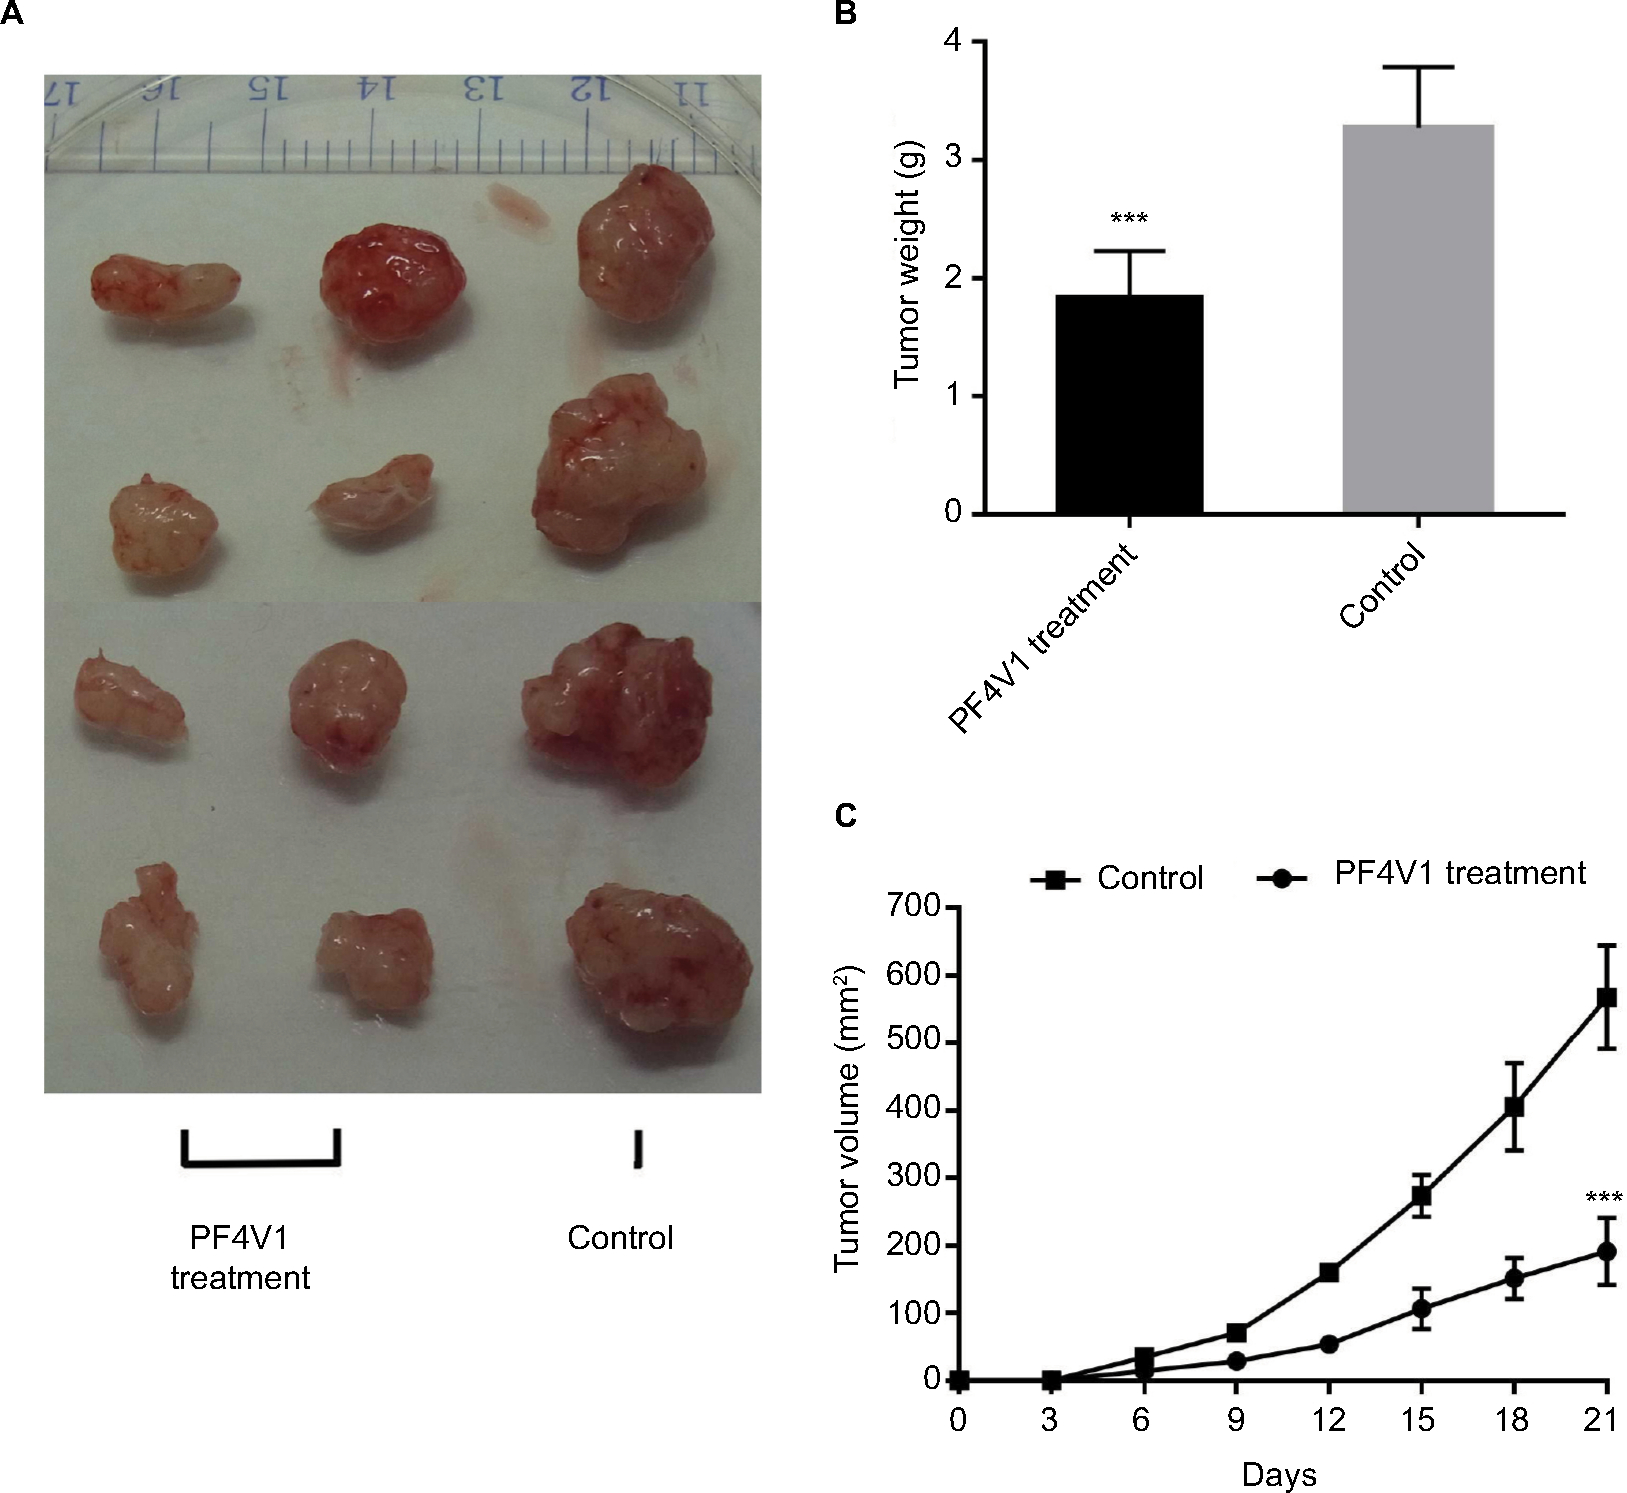 | Figure 4 In vivo PF4V1 suppresses the growth of prostate cancer in nude mice model. Notes: (A) The sample tumors from the nude mice at 21 days are shown. (B) The tumor weight was significantly lower in PF4V1 treatment group than in the control group. (C) The tumor volume was measured every 3 days. The results were acquired from three independent experiments, and error bars represent mean and SD (Student’s t-test, ***P<0.001). |
miR-875-3p targets the 3’-UTR of PF4V1 mRNA and inhibits the function of PF4V1
We used four bioinformatics databases to predict the possible miRNAs that might target PF4V1 mRNA. There were eight potential miRNAs (miR-27a, miR-27b, miR-129-5p, miR-374, miR-410, miR-543, miR-875-3p, and miR-1299) in the intersection of four databases. Then, we transfected eight mimics respectively to upregulate these miRNAs in the Lv-PF4V1 steadily transfected DU145 cells. The CCK-8 assay was used to test the function of miRNAs on cell proliferation (Figure 5A). Dramatically, the results demonstrated that only miR-875-3p promoted proliferation. We found the absence of miR-875-3p reads in PRAD-TCGA; however, the expression of miR-875-3p was found in the PCa samples in GSE64333 data set.
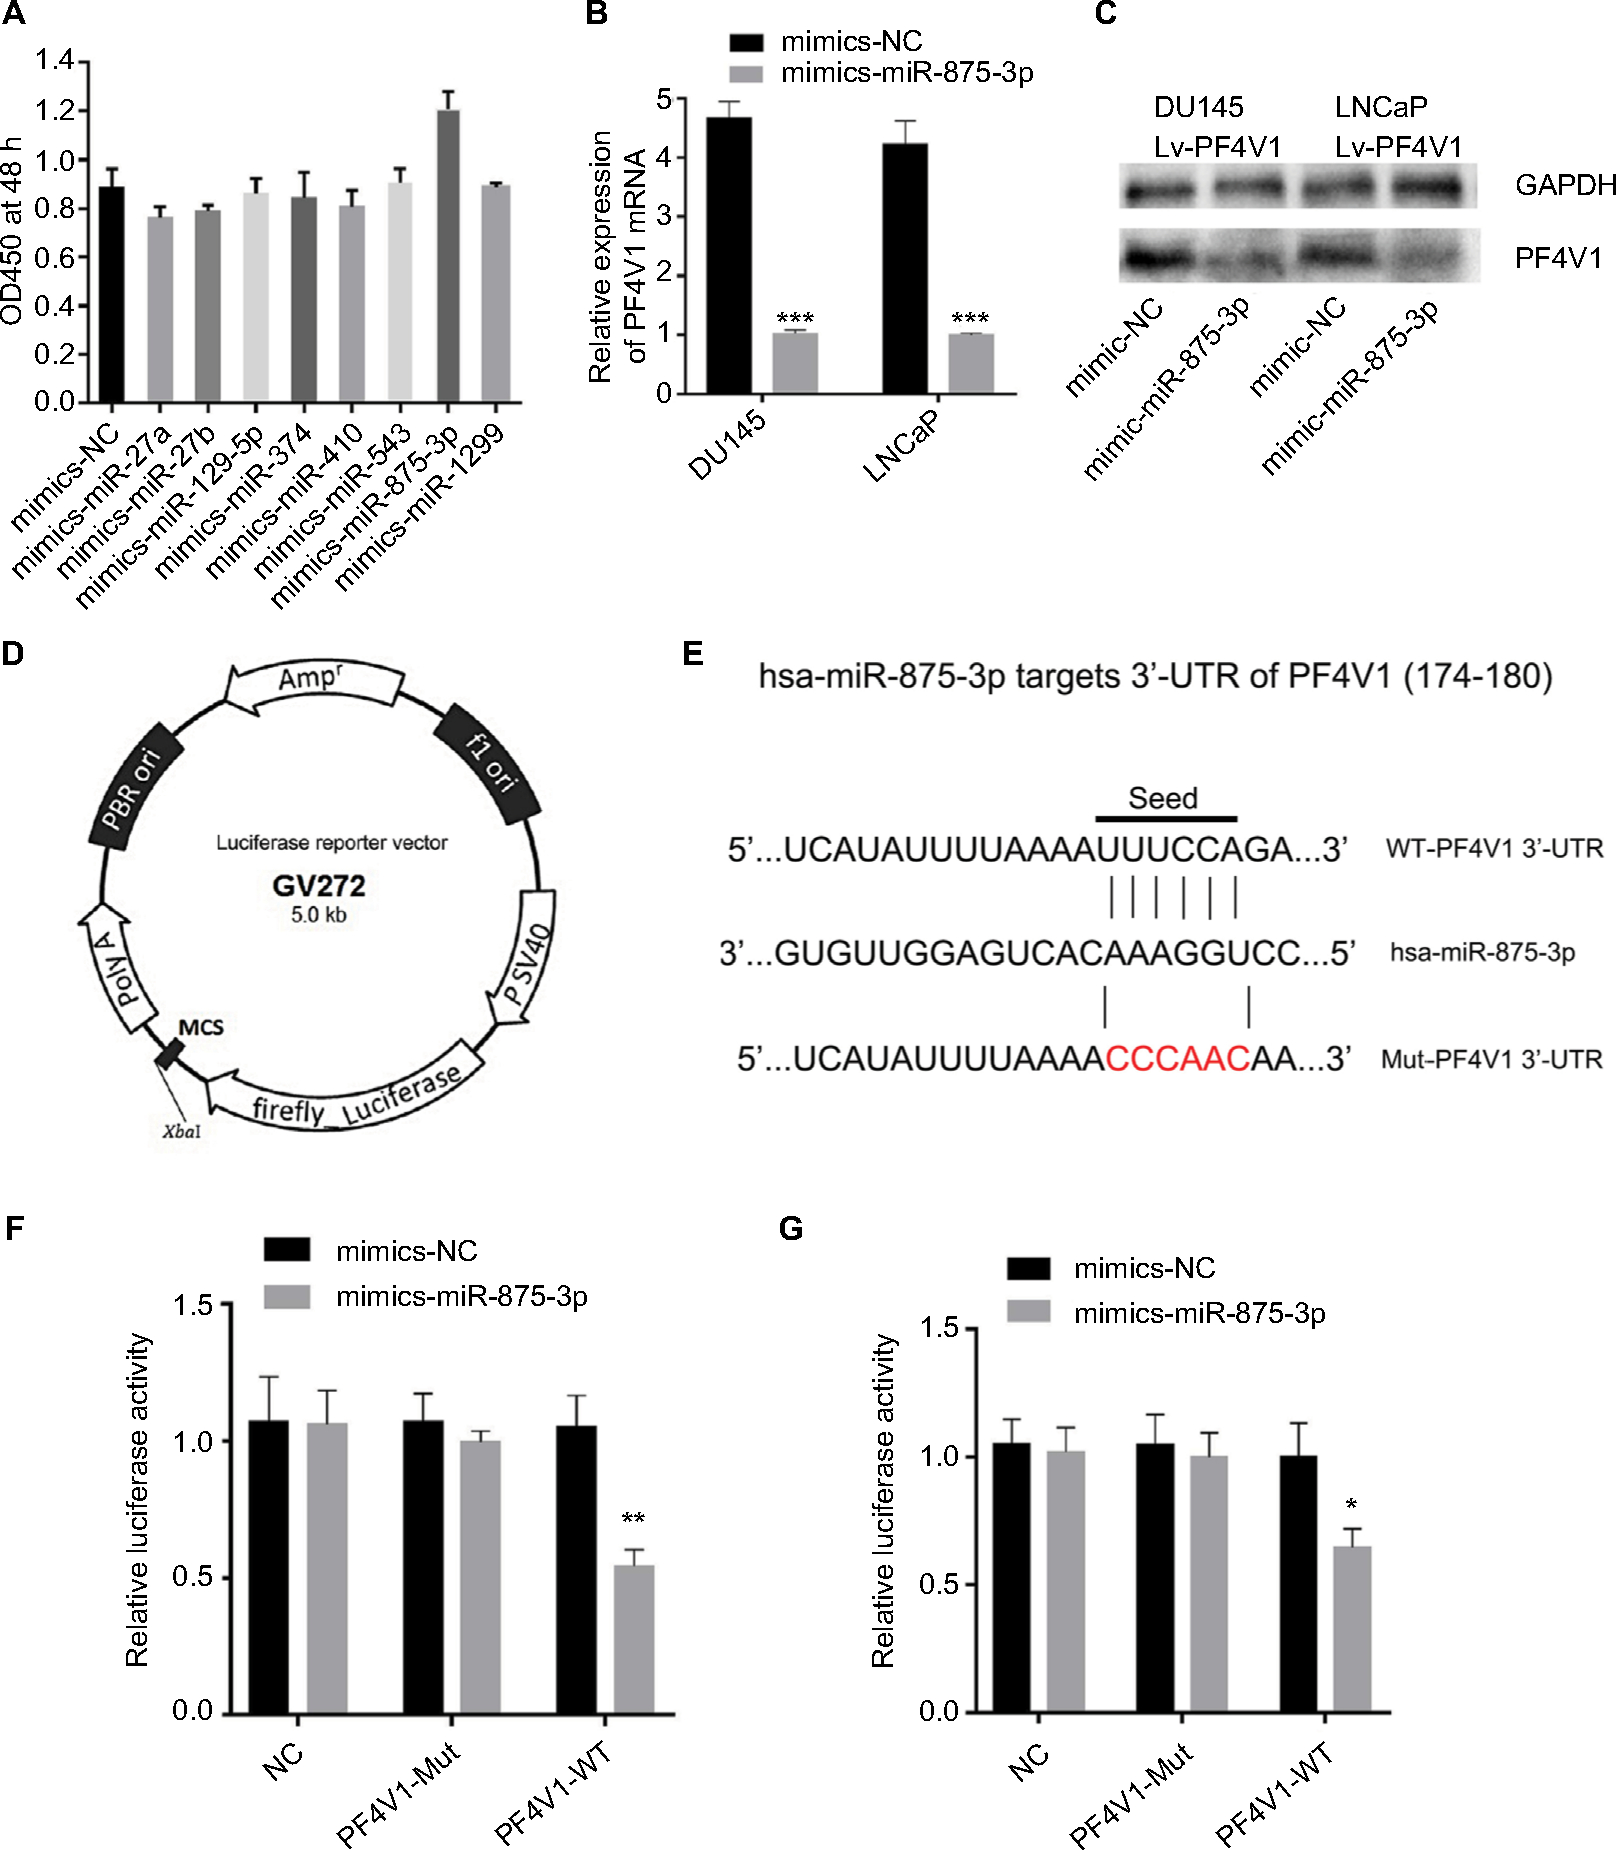 | Figure 5 PF4V1 is a target of hsa-miR-875-3p at specific 3’-UTR. Notes: (A) The effects of different miRNAs on the proliferation of DU145-Lv-PF4V1 cells were evaluated by CCK-8 tests. (B) The relative expression of PF4V1 was investigated by qRT-PCR in PCa cell lines DU145 and LNCaP after mimics transfection. (C) The relative expression of PF4V1 protein was investigated by Western blotting in PCa cell lines DU145 and LNCaP after mimics transfection. (D) The GV272 dual-luciferase reporter vector. (E) The 3’-UTR of PF4V1 harbors an miR-875-3p cognate site. (F) Relative luciferase activity was measured after cotransfecting miR-875-3p/NC mimics and reporter plasmids carrying mutant or wild-type PF4V1 3’-UTR in DU145 cells. (G) Relative luciferase activity was measured after cotransfecting miR-875-3p/NC mimics and reporter plasmids carrying mutant or wild-type PF4V1 3’-UTR in LNCaP cells. The results were acquired from three independent experiments, and error bars represent mean and SD (Student’s t-test, *P<0.05, **P<0.01, ***P<0.001). Abbreviations: CCK-8, Cell Counting Kit-8; NC, negative control; PCa, prostate cancer; qRT-PCR, quantitative real-time PCR; MCS, multiple cloning site; WT, wild type; Mut,mutant; UTR, untranslated region. |
We subsequently transfected the miR-875-3p mimics to DU145 and LNCaP cells. After transfection, the mRNA level of PF4V1 was significantly decreased by qRT-PCR analyses (Figure 5B, P<0.001). The level of PF4V1 protein was also decreased in DU145 and LNCaP cells after miR-875-3p overexpression (Figure 5C). Then, we constructed dual-luciferase reporter vector (Figure 5D) to test the potential region where PF4V1 integrated with miR-875-3p (Figure 5E). DU145 and LNCaP cells were cotransfected with miR-875-3p mimics vs NC and PF4V1-Mut (or NC) reporter vector. The luciferase activity was significantly lower in the wild-type PF4V1 combined with miR-875-3p mimics DU145 (Figure 5F) and LNCaP (Figure 5G) cells.
In vitro miR-875-3p derepresses the inhibitory function of PF4V1 on PCa cells
After confirming that miR-875-3p targets PF4V1, we further explored the biological function of miR-875-3p. The mimics and inhibitor were used to overexpress or knockout miR-875-3p (Figure 6A). We subsequently investigated the function of miR-875-3p on the proliferation of PCa cells by CCK-8 assays. The results suggested that the overexpression of miR-875 could derepress the function of PF4V1 in DU145 and LNCaP cells (Figure 6B). Compared with PF4V1 overexpression group, the absorbance value is significantly higher in the PF4V1 and miR-875-3p groups (P<0.05). Besides, the impact of miR-875-3p on PF4V1 and migration was researched by wound healing assays. The results showed that miR-875-3p overexpression could derepress the inhibitory function of PF4V1 on DU145 and LNCaP cells (Figure 6C). In addition, upregulated miR-875-3p could also derepress the inhibitory function of PF4V1 on the invasiveness of DU145 and LNCaP cells (Figure 6D). Because of the low expression of miR-875-3p in PCa cell lines, the miR-875-3p inhibitor did not produce significance on the proliferation, migration, and invasion of the Lv-PF4V1 PCa cells.
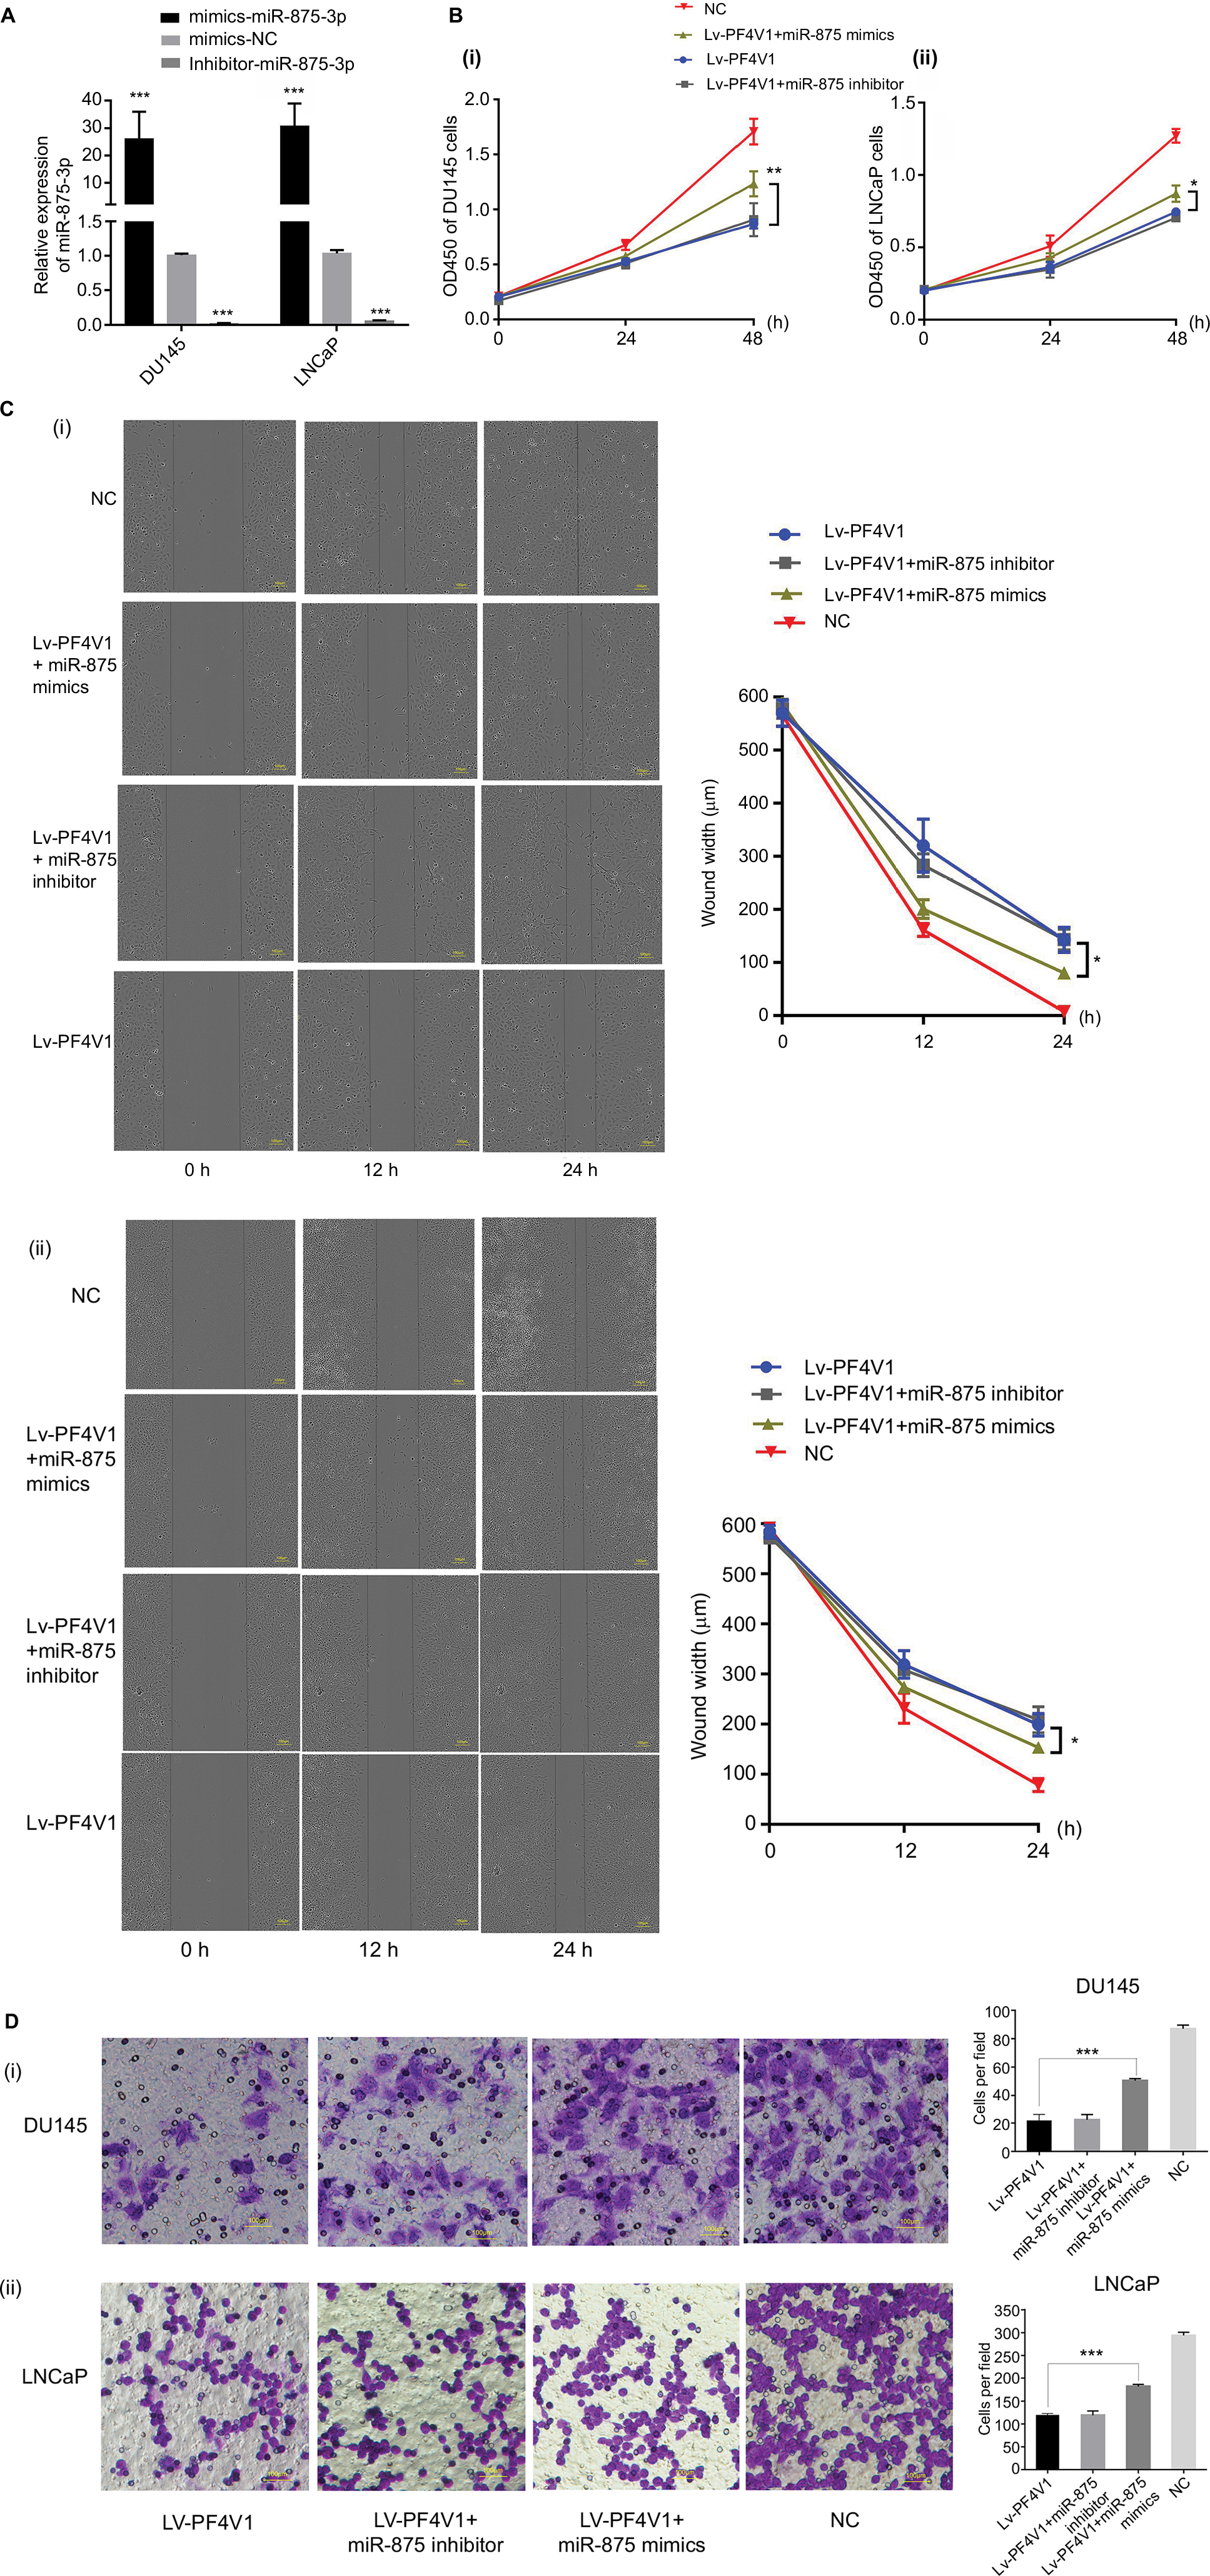 | Figure 6 MiR-875-3p can derepress the effects on PCa cells proliferation, migration, and invasion from PF4V1. Notes: (A) The relative expression of miR-875-3p was investigated by qRT-PCR in PCa cell lines DU145 and LNCaP after the miR-875-3p mimics/inhibitor transfection. (B) The effects of miR-875-3p and PF4V1 on the proliferation of (i) DU145 and (ii) LNCaP cells were evaluated by CCK-8 tests. (C) The effects of miR-875-3p and PF4V1 on the migration of (i) DU145 and (ii) LNCaP cells were evaluated by wound healing assays. (D) The effects of miR-875-3p and PF4V1 on the invasion of (i) DU145 and (ii) LNCaP cells were evaluated by Transwell® assays with Matrigel®. The results were acquired from three independent experiments, and error bars represent mean and SD (Student’s t-test, *P<0.05, **P<0.01, ***P<0.001). Abbreviations: CCK-8, Cell Counting Kit-8; NC, negative control; PCa, prostate cancer; qRT-PCR, quantitative real-time PCR. |
Discussion
Mounting evidence indicates that chemokines (chemotactic cytokines) play an important role in cancer microenvironment by binding cell surface receptors.15,16 Chemokines are divided into four families (C, CC, CX3C, and CXC).17 The CXC family chemokines appear to have complex involvement in tumor.18 For instance, elevated CXCR2 level in high-grade ovarian cancer is significantly correlated with poor OS and relapse,19 while CXCL13 can direct colon cancer migrating to liver.20 The PF4V1, also known as CXCL4L1, is the homologous nonalleles gene of PF4.21 Previous studies reported that the two platelet-associated chemokines, PF4 and PF4V1, expressed and functioned in several cancers such as ovarian carcinoma, breast cancer, and pancreatic cancer.22–24 However, the specific biological functions and mechanisms of PF4V1 in PCa have not been reported. In the prior study, we reported the lower expression of PF4V1 in PCa tissues as well as the diagnostic efficacy of serum PF4V1.6 In the present study, we carried out further experiments to verify the role of PF4V1 in PCa. We identified that PF4V1 was underexpressed in PCa cell lines as well as in PCa tissues in TCGA patients. The overexpression of PF4V1 could suppress the proliferation, migration, and invasion of PCa cells in vitro. In addition, intratumoral injection of recombinant PF4V1 protein had a therapeutic effect of PCa in vivo. Meanwhile, we confirmed that miR-875-3p targeted the 3’-UTR of PF4V1 to inhibit PF4V1’s expression and function. The experiments using miRNA inhibitor did not produce significant effects. We consider that it was owing to the low baseline expression of miR-875-3p in PCa cell lines. Moreover, the overexpression of PF4V1 could suppress the phosphorylation of AKT/ERK pathway and affect the EMT process. These results highlight the potency of PF4V1 as novel treatment loci in PCa.
Aberrantly expressed miRNAs trigger complex RNA regulatory networks in different cancers.25 A growing number of studies revealed that the dysfunction of miRNAs can affect PCa progression.26 For example, androgen-stimulated upregulation of miR-27a leads to the suppression of PCa growth by targeting prohibitin.27 miR-21 promotes PCa cell transformation by targeting PDCD4 gene.28 miR-143 inhibits PCa proliferation and migration by targeting ERK5 signaling.29 Lately, it was reported that miR-875-5p enhanced a radiation response in PCa through the repression of the EGFR-ZEB1 axis.30 However, the role of miR-875-3p in PCa remains unclear. To elucidate the miRNA-mediated pathway in PCa, we used several bioinformatics databases to predict the miRNAs that might regulate PF4V1. We subsequently revealed that miR-875-3p targeted the mRNA of PF4V1, functioning as an “onco-miRNA.” The mechanism of miR-875-3p may partially be targeting PF4V1 and then derepress the downstream AKT/ERK pathways because miR-875-3p may also target other mRNA or transcription factors in PCa, which we would like to study in the future.
This study suggested that high PF4V1 to TP53 ratio in PCa was significantly associated with poor DFS and good OS. Interestingly, the prognostic effect on DFS and OS turned out to be opposite. Owing to the tumor suppression effect of PF4V1, high PF4V1/TP53 ratio indicates favorable OS. Thus, PF4V1 is more likely related to a long-term survival outcome, whereas DFS means the length of time after primary treatment until new signs or symptoms occur. The systemic inflammation and cancer-immune reaction mechanism in PCa are complicated.31,32 PF4V1 may impose less impacts on the bone metastasis or castration resistance of PCa, which is a possible reason for high PF4V1/TP53 indicating poor DFS, the short-term outcome. Moreover, the prognosis of PCa is generally better than other aggressive cancers like pancreatic cancer. After recurrence or metastasis, it will also last a relatively long period until the death of patients with PCa. Nevertheless, our results demonstrated that PF4V1 might have a potential prognostic value in treatment evaluation and decision in PCa. Our results should be interpreted cautiously because the survival data were from a single data set (TCGA-PRAD). We need more high-quality studies with a large sample size in different centers to verify the relationship between PF4V1/TP53 and the survival of patients with PCa.
Although this is the first study about miR-875-3p/PF4V1 in PCa, the current research was actually subjected to several limitations. First, we only used the data from TCGA database to perform the survival analysis. The results require verification by more clinical centers in different countries. Second, it would be helpful to test the circulating miR-875-3p expression and its correlation with clinical parameters. At present, we lack enough PCa cases with a long-term follow-up in our hospital. Third, other functions (such as angiogenesis and chemotactic immune reactions) and underlying mechanisms of miR-875-3p/PF4V1 in PCa were not investigated.33 We will launch more researches on these aspects.
Conclusion
PF4V1 can suppress the proliferation, migration, and invasion of PCa cells by regulating AKT/ERK pathways and EMT. Elevated PF4V1/TP53 expression is correlated with poorer DFS and better OS in the patients with PCa based on TCGA data set. The miR-875-3p-PF4V1 axis may be a new therapeutic target site in PCa.
Acknowledgments
We would like to thank Professor Zhijie Li (Medical Research Center, Shengjing Hospital) for her instruction and assistance in laboratory techniques. This study was supported by the Chinese National Natural Science Foundation (Program No. 81802540), Shenyang Government Science and Technology Plan Projects (Program No. F15-199-1-47), and the Excellent PhD Program of Shengjing Hospital of China Medical University (Program No. MF18).
Disclosure
The authors report no conflicts of interest in this work.
References
Daniyal M, Siddiqui ZA, Akram M, Asif HM, Sultana S, Khan A. Epidemiology, etiology, diagnosis and treatment of prostate cancer. Asian Pac J Cancer Prev. 2014;15(22):9575–9578. | ||
Tao Z-Q, Shi A-M, Wang K-X, Zhang W-D. Epidemiology of prostate cancer: current status. Eur Rev Med Pharmacol Sci. 2015;19(5):805–812. | ||
Siegel RL, Miller KD, Jemal A. Cancer statistics, 2018. CA Cancer J Clin. 2018;68(1):7–30. | ||
Li D, Hao X, Li J, et al. Dose-response relation between dietary inflammatory index and human cancer risk: evidence from 44 epidemiologic studies involving 1,082,092 participants. Am J Clin Nutr. 2018;107(3):371–388. | ||
Li D, Lv H, Hao X, Dong Y, Dai H, Song Y. Prognostic value of bone scan index as an imaging biomarker in metastatic prostate cancer: a meta-analysis. Oncotarget. 2017;8(48):84449–84458. | ||
Zhang M, Chen L, Yuan Z, et al. Combined serum and EPS-urine proteomic analysis using iTRAQ technology for discovery of potential prostate Cancer biomarkers. Discov Med. 2016;22(122):281–295. | ||
Zhang N, Zhang H, Liu Y, et al. SREBP1, targeted by miR-18a-5p, modulates epithelial-mesenchymal transition in breast cancer via forming a co-repressor complex with snail and HDAC1/2. Cell Death Differ. 2018;66. | ||
Hausser J, Zavolan M. Identification and consequences of miRNA-target interactions – beyond repression of gene expression. Nat Rev Genet. 2014;15(9):599–612. | ||
Svoronos AA, Engelman DM, Slack FJ. OncomiR or tumor suppressor? The Duplicity of microRNAs in cancer. Cancer Res. 2016;76(13):3666–3670. | ||
Kanwal R, Plaga AR, Liu X, Shukla GC, Gupta S. MicroRNAs in prostate cancer: functional role as biomarkers. Cancer Lett. 2017;407:9–20. | ||
Massillo C, Dalton GN, Farré PL, de Luca P, de Siervi A. Implications of microRNA dysregulation in the development of prostate cancer. Reproduction. 2017;154(4):R81–R97. | ||
Wang P, Liu XM, Ding L, Zhang XJ, Ma ZL. mTOR signaling-related microRNAs and cancer involvement. J Cancer. 2018;9(4):667–673. | ||
Li D, Hao X, Song Y. An integrated analysis of key microRNAs, regulatory pathways and clinical relevance in bladder cancer. Onco Targets Ther. 2018;11:3075–3085. | ||
Li D, Hao X, Song Y. Identification of the key microRNAs and the miRNA-mRNA regulatory pathways in prostate cancer by bioinformatics methods. Biomed Res Int. 2018;2018(48):1–10. | ||
Nerviani A, Pitzalis C. Role of chemokines in ectopic lymphoid structures formation in autoimmunity and cancer. J Leukoc Biol. 2018;104(2):333–341. | ||
Kotyza J. Chemokines in tumor proximal fluids. Biomed Pap Med Fac Univ Palacky Olomouc Czech Repub. 2017;161(1):41–49. | ||
Lee HJ, Song I-C, Yun H-J, Jo D-Y, Kim S. CXC chemokines and chemokine receptors in gastric cancer: from basic findings towards therapeutic targeting. World J Gastroenterol. 2014;20(7):1681–1693. | ||
Vandercappellen J, van Damme J, Struyf S. The role of CXC chemokines and their receptors in cancer. Cancer Lett. 2008;267(2):226–244. | ||
Yang G, Rosen DG, Liu G, et al. CXCR2 promotes ovarian cancer growth through dysregulated cell cycle, diminished apoptosis, and enhanced angiogenesis. Clin Cancer Res. 2010;16(15):3875–3886. | ||
Meijer J, Zeelenberg IS, Sipos B, Roos E. The CXCR5 chemokine receptor is expressed by carcinoma cells and promotes growth of colon carcinoma in the liver. Cancer Res. 2006;66(19):9576–9582. | ||
Ruytinx P, Proost P, Struyf S. CXCL4 and CXCL4L1 in cancer. Cytokine. 2018;109:65–71. | ||
Furuya M, Tanaka R, Miyagi E, et al. Impaired CXCL4 expression in tumor-associated macrophages (TAMs) of ovarian cancers arising in endometriosis. Cancer Biol Ther. 2012;13(8):671–680. | ||
van Raemdonck K, Berghmans N, Vanheule V, et al. Angiostatic, tumor inflammatory and anti-tumor effects of CXCL4(47-70) and CXCL4L1(47-70) in an EGF-dependent breast cancer model. Oncotarget. 2014;5(21):10916–10933. | ||
Quemener C, Baud J, Boyé K, et al. Dual roles for CXCL4 chemokines and CXCR3 in angiogenesis and invasion of pancreatic cancer. Cancer Res. 2016;76(22):6507–6519. | ||
He SJ, Xiang CQ, Zhang Y, Lu XT, Chen HW, Xiong LX. Recent progress on the effects of microRNAs and natural products on tumor epithelial-mesenchymal transition. Onco Targets Ther. 2017;10:3435–3451. | ||
Fang YX, Gao WQ. Roles of microRNAs during prostatic tumorigenesis and tumor progression. Oncogene. 2014;33(2):135–147. | ||
Fletcher CE, Dart DA, Sita-Lumsden A, Cheng H, Rennie PS, Bevan CL. Androgen-regulated processing of the oncomiR miR-27a, which targets prohibitin in prostate cancer. Hum Mol Genet. 2012;21(14):3112–3127. | ||
Lu Z, Liu M, Stribinskis V, et al. MicroRNA-21 promotes cell transformation by targeting the programmed cell death 4 gene. Oncogene. 2008;27(31):4373–4379. | ||
Clapé C, Fritz V, Henriquet C, et al. miR-143 interferes with ERK5 signaling, and abrogates prostate cancer progression in mice. PLoS One. 2009;4(10):e7542. | ||
El Bezawy R, Cominetti D, Fenderico N, et al. miR-875-5p counteracts epithelial-to-mesenchymal transition and enhances radiation response in prostate cancer through repression of the EGFR-ZEB1 axis. Cancer Lett. 2017;395:53–62. | ||
Li DY, Hao XY, Ma TM, Dai HX, Song YS. The prognostic value of platelet-to-lymphocyte ratio in urological cancers: a meta-analysis. Sci Rep. 2017;7(1):15387. | ||
Prats AC, van den Berghe L, Rayssac A, et al. CXCL4L1-fibstatin cooperation inhibits tumor angiogenesis, lymphangiogenesis and metastasis. Microvasc Res. 2013;89:25–33. | ||
Struyf S, Salogni L, Burdick MD, et al. Angiostatic and chemotactic activities of the CXC chemokine CXCL4L1 (platelet factor-4 variant) are mediated by CXCR3. Blood. 2011;117(2):480–488. |
Supplementary material
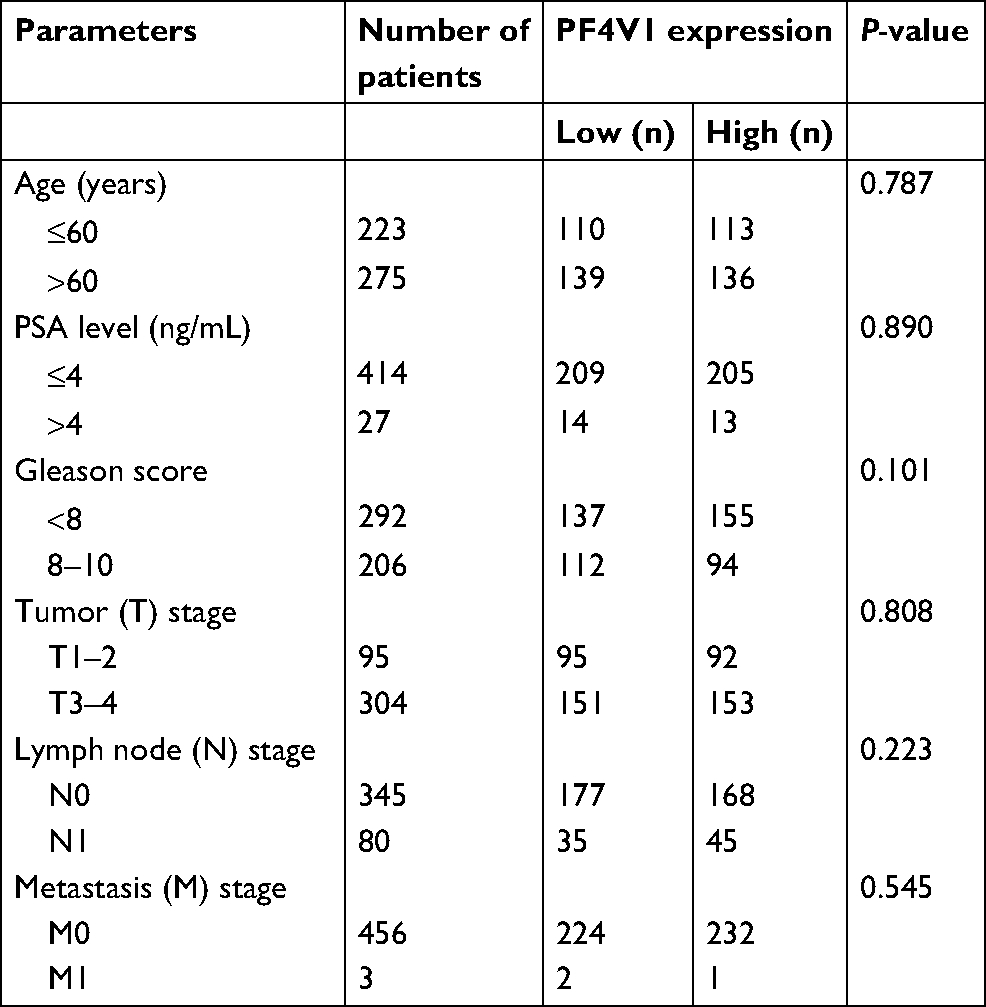 | Table S1 Relationship between PF4V1 and clinical/pathological parameters of prostate cancer Notes: We downloaded all the data of TCGA-PRAD data set. Among the 499 prostate cancer samples, the expression value of PF4V1 was available for 498 patients. The data of “Age” and “Gleason score” were complete for all the 498 patients. However, other data were not available for all these 498 patients. The TCGA-PRAD data set only provides “PSA level” data from 441 patients, “T stage” data from 399 patients, “N stage” data from 425 patients, and “M stage” data from 459 patients. |
 © 2019 The Author(s). This work is published and licensed by Dove Medical Press Limited. The
full terms of this license are available at https://www.dovepress.com/terms
and incorporate the Creative Commons Attribution
- Non Commercial (unported, 3.0) License.
By accessing the work you hereby accept the Terms. Non-commercial uses of the work are permitted
without any further permission from Dove Medical Press Limited, provided the work is properly
attributed. For permission for commercial use of this work, please see paragraphs 4.2 and 5 of our Terms.
© 2019 The Author(s). This work is published and licensed by Dove Medical Press Limited. The
full terms of this license are available at https://www.dovepress.com/terms
and incorporate the Creative Commons Attribution
- Non Commercial (unported, 3.0) License.
By accessing the work you hereby accept the Terms. Non-commercial uses of the work are permitted
without any further permission from Dove Medical Press Limited, provided the work is properly
attributed. For permission for commercial use of this work, please see paragraphs 4.2 and 5 of our Terms.