Back to Journals » Nature and Science of Sleep » Volume 11
Personalized Sleep Parameters Estimation from Actigraphy: A Machine Learning Approach
Authors Khademi A, EL-Manzalawy Y ![]() , Master L, Buxton OM, Honavar VG
, Master L, Buxton OM, Honavar VG ![]()
Received 25 June 2019
Accepted for publication 21 October 2019
Published 11 December 2019 Volume 2019:11 Pages 387—399
DOI https://doi.org/10.2147/NSS.S220716
Checked for plagiarism Yes
Review by Single anonymous peer review
Peer reviewer comments 2
Editor who approved publication: Dr Sutapa Mukherjee
Video abstract presented by Aria Khademi.
Views: 288
Aria Khademi,1–3 Yasser EL-Manzalawy,1,4 Lindsay Master,5 Orfeu M Buxton,5–9 Vasant G Honavar1–3,6,10,11
1College of Information Sciences and Technology, The Pennsylvania State University, University Park, PA, USA; 2Artificial Intelligence Research Laboratory, The Pennsylvania State University, University Park, PA, USA; 3Center for Big Data Analytics and Discovery Informatics, The Pennsylvania State University, University Park, PA, USA; 4Department of Imaging Science and Innovation, Geisinger Health System, Danville, PA, 17822, USA; 5Department of Biobehavioral Health, The Pennsylvania State University, University Park, PA, USA; 6Clinical and Translational Sciences Institute, The Pennsylvania State University, University Park, PA, USA; 7Division of Sleep Medicine, Harvard University, Boston, MA, USA; 8Department of Social and Behavioral Sciences, Harvard Chan School of Public Health, Boston, MA, USA; 9Division of Sleep and Circadian Disorders, Departments of Medicine and Neurology, Brigham and Women’s Hospital, Boston, MA, USA; 10Institute for Computational and Data Sciences, The Pennsylvania State University, University Park, PA, USA; 11Huck Institutes of the Life Sciences, The Pennsylvania State University, University Park, PA, USA
Correspondence: Orfeu M Buxton
The Pennsylvania State University, University Park, PA 16802, USA
Tel +1 814 865 3141
Email [email protected]
Background: The current gold standard for measuring sleep is polysomnography (PSG), but it can be obtrusive and costly. Actigraphy is a relatively low-cost and unobtrusive alternative to PSG. Of particular interest in measuring sleep from actigraphy is prediction of sleep-wake states. Current literature on prediction of sleep-wake states from actigraphy consists of methods that use population data, which we call generalized models. However, accounting for variability of sleep patterns across individuals calls for personalized models of sleep-wake states prediction that could be potentially better suited to individual-level data and yield more accurate estimation of sleep.
Purpose: To investigate the validity of developing personalized machine learning models, trained and tested on individual-level actigraphy data, for improved prediction of sleep-wake states and reliable estimation of nightly sleep parameters.
Participants and methods: We used a dataset including 54 participants and systematically trained and tested 5 different personalized machine learning models as well as their generalized counterparts. We evaluated model performance compared to concurrent PSG through extensive machine learning experiments and statistical analyses.
Results: Our experiments show the superiority of personalized models over their generalized counterparts in estimating PSG-derived sleep parameters. Personalized models of regularized logistic regression, random forest, adaptive boosting, and extreme gradient boosting achieve estimates of total sleep time, wake after sleep onset, sleep efficiency, and number of awakenings that are closer to those obtained by PSG, in absolute difference, than the same estimates from their generalized counterparts. We further show that the difference between estimates of sleep parameters obtained by personalized models and those of PSG is statistically non-significant.
Conclusion: Personalized machine learning models of sleep-wake states outperform their generalized counterparts in terms of estimating sleep parameters and are indistinguishable from PSG labeled sleep-wake states. Personalized machine learning models can be used in actigraphy studies of sleep health and potentially screening for some sleep disorders.
Keywords: actigraphy, polysomnography, personalized, machine learning, sleep parameters
Introduction
Sleep health plays a critical role in both physiological and psychological health. Poor sleep is associated with an increased chance of cardiovascular disease,1–4 Type 2 diabetes,5 cognitive problems,6 attention-deficit hyperactivity disorder (ADHD),7 depression, and performance.8–11 Addressing such problems requires reliable assessment of sleep.12–15 The current gold standard to measure sleep is polysomnography (PSG) which can be burdensome. Actigraphy is a relatively low-burden alternative to PSG16–18 for estimating sleep parameters such as total sleep time, sleep efficiency, wake after sleep onset, and the number of awakenings. However, comparisons of sleep parameters obtained from actigraphy to those from PSG rely on algorithms with low specificity (ie, are limited in detecting wake epochs reliably). Thus, the current manuscript develops and validates both personalized and general machine learning approaches to improve upon currently available and widely used algorithms.
The literature of detection and prediction of sleep-wake states from actigraphy includes many sleep scoring algorithms19–37 and machine learning-based methods38–43 developed at the population-level. Such population-level studies have focused on developing a single predictive model or algorithm, which we call generalized models. Generalized models are trained using population data and are used to detect or predict sleep-wake states in individuals. Such population-level models assume similarity between individuals that may not be true. Considerable variability in sleep patterns across individuals44 can be due to differences in personal characteristics such as age, environmental and genetic factors, lifestyle, etc. Personalized models for sleep-wake states prediction trained and tested on specific individuals (ie, using only individual-level data) could better account for individual-level characteristics that might yield classes of individuals for whom a class of algorithms could be used.
In our previous work, we investigated and established the feasibility of developing reliable personalized machine learning models trained on individual data matching the performance of their generalized counterparts for sleep-wake states prediction from actigraphy.45 In this paper, we extend this approach via machine learning experiments to test the superiority of personalized machine learning models over their generalized counterparts in estimation of night-level sleep parameters from actigraphy.
Materials and Methods
Data
Actigraphy data were collected simultaneously with PSG recordings, at every 30 s, in a sleep laboratory, as previously described.25 AW-64 (Minimitter, Inc, Bend, OR) and Actiwatch Spectrum (Philips/Respironics, Murrysville, PA) were used for actigraphy collection. PSG recordings were scored by Registered Polysomnographic Technologists and recoded as sleep or wake, movement artifact as wake, and missing data as missing. Data collection included a total of 81 participants across the following studies: a study on healthy adults (baseline) whose sleep was disturbed by noise, henceforth referred to as the Acoustics (AC) study;46–48 a study including older adults on Tiagabine medication (henceforth TI) [unpublished data, for description, see Ref. 25]; a sleep restriction (SR) study on healthy participants (all collected sleep recordings were in controlled standardized conditions and study participants received no medication or placebo on individual nights);49 and daytime sleep in night-workers (NW).50 In all of the studies but SR, participants spent 8.5 hrs in bed. In the SR study, participants spent 10 hrs in bed on sleep-replete nights and 5 hrs on sleep restricted nights. In all of the studies, for each participant, we have data collected from multiple sleeping periods (ie, days in the NW study and nights in other studies), with each sleeping period consisting of roughly 1000 epochs of data, each of 30-s duration. For each epoch (ie, at every 30 s) in each participant’s data, we have an activity counts value from actigraphy that is labeled as either sleep or wake based on expert annotation of the corresponding (temporally aligned as previously described25) PSG recording epoch. All procedures were approved by the Brigham and Women’s Hospital Institutional Review Board and all participants provided informed written consent.
To factor out night-specific effects on the performance of sleep-wake states predictors and the design of our machine learning experiments, we worked with at least 2 sleeping periods to train and 1 additional sleeping period to test our machine learning sleep-wake states predictors. Hence, we limited our analyses to 54 participants on whom we had collected data from ≥3 sleeping periods (see Table 1). We randomly partitioned the data of the 54 participants into 3 disjoint groups each with 18 participants. In each group, one sleeping period was designated as the source of test data and the remaining sleeping periods were used as the sources of training data. The different groups used different nights (1, 2, or 3) among the first 3 nights, for testing the sleep-wake states predictors. In SR data, a random selection of sleep-replete and sleep-restricted nights was used for training; ie, we have trained our classifiers on both sleep-replete and sleep-restricted nights and then tested them on 1 randomly chosen night out of the first 3 (sleep-replete) nights. Our rationale was that classification of sleep-wake is more difficult in sleep-replete nights because there is a longer period of time in bed, and because of that there are many “wake states” to be detected by the machine learning model. In contrast, on sleep-restricted nights with 5 hrs of time in bed, participants are mostly asleep, and there would not be many wake state epochs. Sleep-replete nights were also longer (10 hrs time in bed) and thus included more epochs.
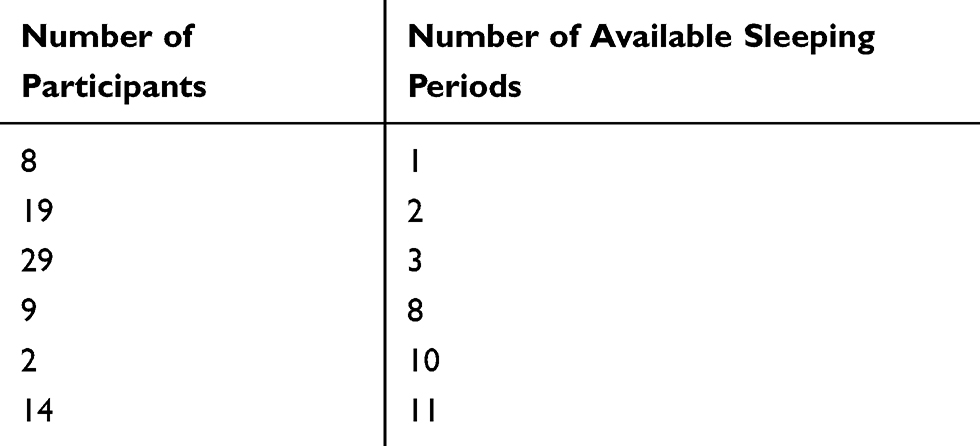 |
Table 1 Number of Participants and the Number of Their Available Sleeping Periods in the Data |
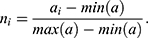
Data Normalization
In order to minimize the effect of scale variability between devices and participants, the raw actigraphy values were normalized per sleeping period as follows: Let (1)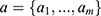 be the sequence of actigraphy measurements in a given sleeping period. The normalized actigraphy measurement
  corresponding to
  is given by:
Feature Extraction
Consistent with our previous study,45 we extracted features from the actigraphy data using a sliding window of 21 epochs centered at the target actigraphy value. We then used the extracted features as input to our sleep-wake states predictors. For each sliding window (which represents each actigraphy value), we extracted the following features used in previous works:32,51 10th, 20th, 50th, 5th, and 90th percentiles, mean, sum of values, standard deviation, coefficient of variation, peak-to-peak amplitude, interquartile range, skewness, kurtosis, signal power, peak intensity, median crossings (ie, the number of times actigraphy values cross the median of the sliding window), time above threshold (ie, the number of actigraphy values >15), and maximum value, along with the 21 normalized actigraphy measurements within the window. Therefore, each sliding window was represented with a 39-tuple of feature values and was assigned either a PSG-defined wake or sleep label.
Predictive Models
We experimented with 5 commonly used machine learning algorithms all using Python’s sklearn (version 0.17.1) implementations with default parameters unless stated otherwise:
- Naive Bayes (NB): The NB is a generative classifier that is provably optimal when the features are conditionally independent given the class label. NB is often quite effective in practice and works as follows: Let
 be an instance, with
  features, to be classified. Assuming that the features are conditionally independent given the class, for any possible class label
  , the conditional probability that the sample
  belongs to the class
  is given by the posterior probability:
  . NB assigns
  to the class with the largest posterior probability.52 The parameters defining
  (ie, the prior distribution of the classes) and
  (ie, the conditional distribution of each attribute
  given the class, also known as the likelihood) are estimated from the labeled training data. Herein, we use a multi-variate Bernoulli model for
  and default sklearn discretization scheme for continuous values.
- Regularized logistic regression (RLR): Logistic regression (LR)53 is the discriminative counterpart of 2-class NB model where a binary logistic model is used to directly estimate the probability of a binary response. Here,
 , where the parameters
  are estimated from the training data using maximum likelihood estimation which in the case of LR reduces to least square regression. RLR adds a regularizer to the least square objective function to counteract the tendency of the model to overfit the training data. We used L2 regularizer and the resulting objective function was optimized using stochastic gradient descent (SGD).
- Random forest (RF) is an ensemble of decision tree classifiers. The members of the ensemble are obtained by applying bootstrap aggregation (“bagging”) to decision tree learners.54 The process of bagging works as follows: Given a training set, bagging repeatedly selects B random samples (with replacement) of the same size, each time uses the randomly selected data as the training set, and fits a decision tree to the training sample, resulting in an ensemble of B decision trees (ie, a forest). Test samples are then classified by taking a majority vote over the class labels produced by the trees of the forest. In this work, we used RF classifiers with B=100.
- AdaBoost (AB)55 is an adaptive boosting meta-algorithm. Suppose each training sample
 has a label
  . After
  iterations, AB produces an ensemble classifier of the linear form
(2)
 is a (weak) classifier that assigns a label
  . At the
  iteration, AB augments the ensemble to obtain
  . AB chooses the classifier weight
  and the classifier
  so as to minimize the exponential loss of
  given by
 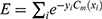 . We use AB with an ensemble size of 100 where each classifier in the ensemble is a decision tree classifier.
- Extreme gradient boosting (XGB)56 is a scalable variant of gradient boosting.57 XGB produces an ensemble of classification or regression models, typically decision trees. Like AB, it builds the ensemble in a stage-wise fashion, using any arbitrary differentiable objective function that includes a loss function and a regularization term. We used XGB to generate an ensemble of 100 classification trees with a logistic loss function and L2 regularization term.
Performance Evaluation and Statistical Analyses
We trained and evaluated personalized sleep-wake states predictors (ie, classifiers), one for each individual, using the training and test data for each individual. In contrast, we trained generalized sleep-wake states predictors using the training data for the entire population. We evaluated the resulting predictors on the test data for each individual so as to allow direct comparison of personalized and generalized predictor counterparts in terms of classifier performance evaluation metrics. We further compared the estimates of sleep parameters obtained by personalized and generalized sleep-wake states predictors to those obtained by PSG in estimation of sleep parameters (see Sections Classifier performance evaluation and Sleep parameters). We also conducted statistical analyses as described below.
Classifier Performance Evaluation
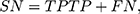
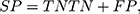
We used standard performance measures for evaluating the performance of sleep-wake states predictors. Let the number of test samples belonging to the wake class correctly labeled as wake (true positives) be TP; the number of wake instances classified incorrectly as sleep (false negatives) be FN; the number of sleep instances classified correctly by the classifier as sleep (true negatives) be TN; and the number of sleep instances that are labeled incorrectly as wake (false positives) be FP. Then, accuracy (ACC), sensitivity (SN), specificity (SP), and Matthews correlation coefficient (MCC) are given by:
(3) (4) (5) (6)
In general, it is possible to trade-off SP against SN by adjusting the classification threshold used to convert predicted class probabilities into class labels. Hence, it is useful to plot the Receiver Operating Characteristic (ROC) curve58 to visualize the performance of a classifier over all possible choices of classification thresholds. The ROC curve is a two-dimensional plot in which the true positive rate (TPR), that is, SN, is plotted on the Y-axis, and the false-positive rate (FPR), that is, (1-SP) is plotted on the X-axis. Each point on the ROC curve represents the behavior of the classifier at a specific choice of the threshold. Thus, if one classifier has higher TPR for all FPR as compared to another, then we can conclude that the former outperforms the latter for any choice of the classification threshold, or equivalently, the trade-off between TPR and FPR. The area under ROC curve (AUC), the probability that a randomly chosen wake sample is scored higher than a randomly chosen sleep sample by the classifier, is often used as a summary statistic to compare classifiers. An AUC score higher than 0.5 is considered better than random guessing. A perfect classifier will have an AUC of 1.
Sleep Parameters
We used the following 5 standard sleep parameters: total sleep time (TST), the amount of time in minutes that the person is asleep during a sleeping period; sleep onset latency (SOL), the time in minutes that it takes for the person to fall asleep for the first time since the start of the data recording in a given sleeping period; wake after sleep onset (WASO), the amount of time in minutes the person spends awake, starting from when they first fall asleep to when they become fully awake and do not attempt to go back to sleep; sleep efficiency (SE), the percentage of total time in bed actually spent in sleep; and number of awakenings (NA), the number of transitions from sleep to wakefulness.
Statistical Analyses
We applied paired t-tests to assess the statistical significance of the observed differences in performance. When assessing such difference among multiple classifiers at the same time (eg, when simultaneously comparing classifiers based on classifier performance metrics), we used paired t-tests with the Bonferroni corrected significance level to avoid the family-wise Type I error.59 In our case, to test for statistical significance at a significance level of  , the p-values would have to be compared with
  where
where  is the total number of predictive models under consideration. If we choose of
  , since
  (because we have 5 personalized and 5 generalized classifiers) we have to compare p-values with
  . On the other hand, when assessing the difference in performance of two observed outcomes (eg, the difference between a classifier’s estimated TST and that of PSG, same for other sleep parameters), we used paired t-test with significance level
  and hence, compared the p-values accordingly.
Variability Across Individuals
Let  and
and  be two participants. Let
  and
and  be the personalized classifiers trained on the training data for individuals
  and
and  , respectively. Let
  be the concatenation of
  and
and  , where
  and
and  denote the test data for individuals
  and
and  , respectively. Finally, let
  and
and  be the sequences of predicted probabilities for the positive class (wake) produced by
  and
and  on the sequence
  . We say that two individuals are similar if the corresponding personalized classifiers
  and
and  yield similar sequences of predicted probabilities for the positive (or negative) class. We define
  , a measure of similarity between individuals
  and
and  , as simply the Pearson correlation coefficient between
  and
and  . We used this similarity measure to examine the usefulness of personalized classifiers for sleep-wake states detection.
Results
In this section, we proceed to report results of experiments designed to compare personalized sleep-wake states predictors with their generalized counterparts over all studies and considering each study separately. We statistically compare the predictors both in terms of how well they estimate sleep parameters (See Section Sleep parameters) and in terms of classifier performance evaluation metrics (See Section Classifier performance evaluation).
Sleep Parameters Estimation: Personalized vs Generalized Predictors
We report results of our comparison averaged over all participants and all studies in Table 2 (see Supplementary Tables S1-S6 for detailed results on each participant and all studies). We observe personalized sleep-wake states predictors outperform their generalized counterparts overall in estimation of night-level sleep parameters of TST, WASO, SE, and NA compared to PSG. We further observe among the five classifiers used in this work, estimates of sleep parameters obtained from RF are overall, closer to those estimates obtained from PSG, than the obtained estimates from other classifiers.
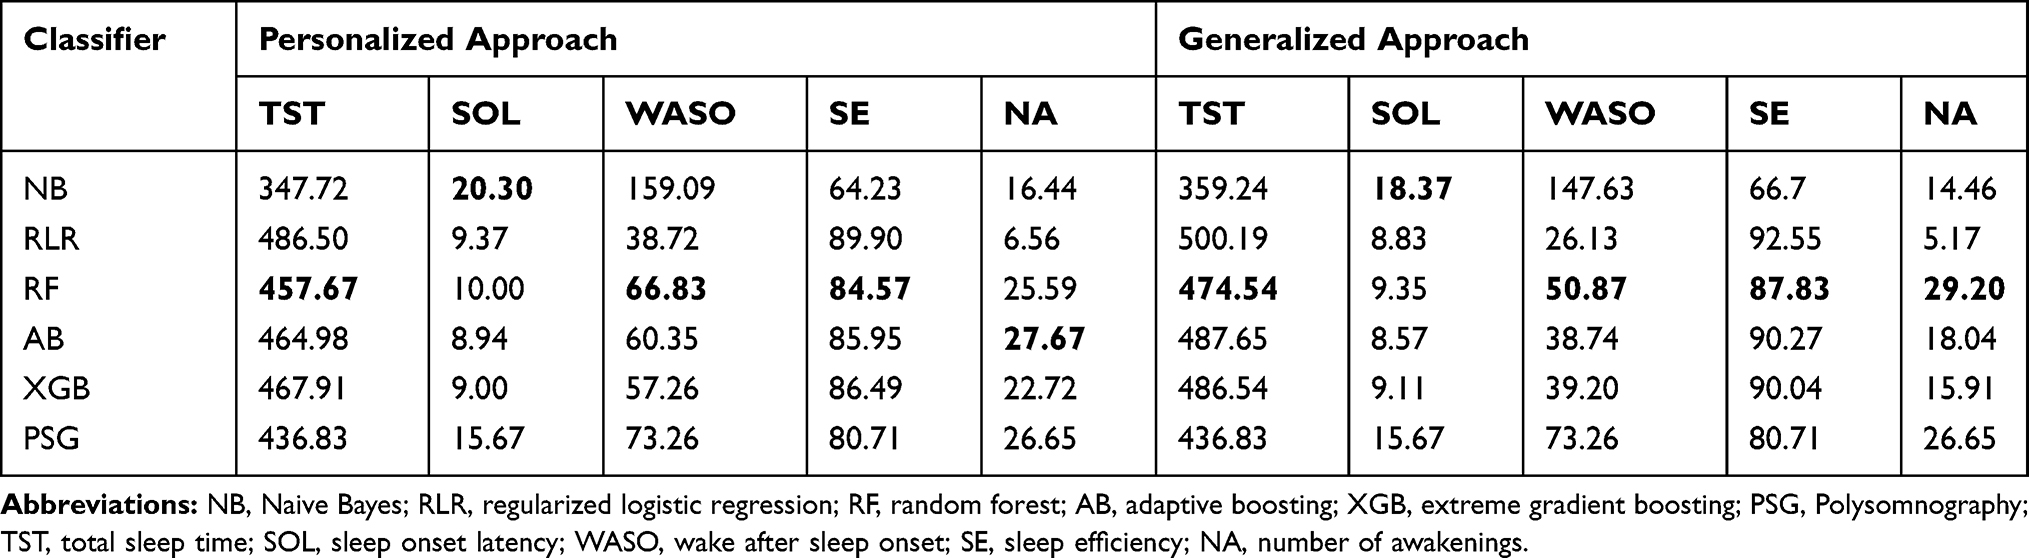 |
Table 2 Estimates of Sleep Parameters Obtained with Personalized and Generalized Sleep-Wake States Predictors and PSG, Averaged Over all Participants Across All Studies Combined. In Each Column, the Boldface Number Indicates the Estimated Sleep Parameter Closest to That of PSG |
We analyzed the effect of different classification cut-offs (ie, the threshold used to convert predicted wake or sleep probabilities into their corresponding class labels) on sleep parameters estimates obtained from our developed personalized predictors. Specifically, we chose our two best performing classifiers, RF and XGB, and obtained their estimates of sleep parameters with the following cutoffs: 0.1, 0.2, 0.3, 0.4, and 0.5. We report the results (averaged over all participants across all studies) in Table 3. We observe for TST, WASO, SE, and NA, the most reliable (as compared to PSG estimates) estimates by classifiers are obtained with a threshold of either 0.4 or 0.5. For SOL, however, our results suggest 0.2 for both RF and XGB.
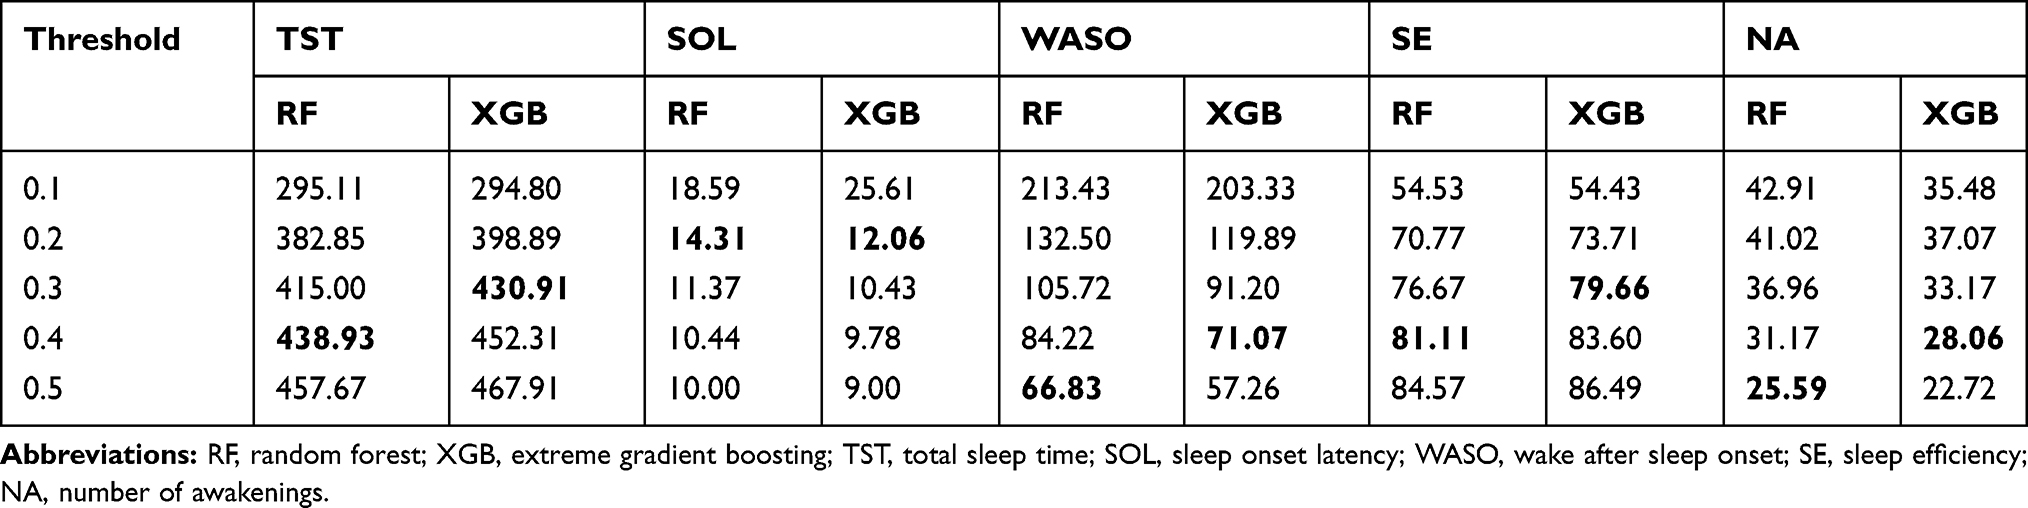 |
Table 3 Estimates of Sleep Parameters Obtained with Different Classification Thresholds via Personalized RF and XGB Sleep-Wake States Predictors, Averaged Over All Participants Across All Studies Combined. In Each Column, the Boldface Number Indicates the Estimated Sleep Parameter Closest to That of PSG |
To statistically analyze the estimates of sleep parameters obtained by our classifiers, we ran paired t-tests on (i) the difference between estimates of sleep parameters obtained by personalized models and those obtained by PSG and (ii) the difference between estimates of sleep parameters obtained by generalized models and those obtained by PSG. We report the results in Table 4; a p-value < 0.05 shows the classifier estimates are statistically different than those obtained by PSG. Interestingly, we observe that none of the estimates of TST, WASO, SE, and NA, obtained by personalized RF, are statistically different than those obtained by PSG. We further observe personalized AB and XGB outperform their generalized counterparts for sleep parameters WASO and NA. In terms of SOL, both personalized and generalized NB obtained estimates that are not statistically different than those obtained by PSG. Overall estimates of sleep parameters by generalized models are statistically different than those obtained by PSG.
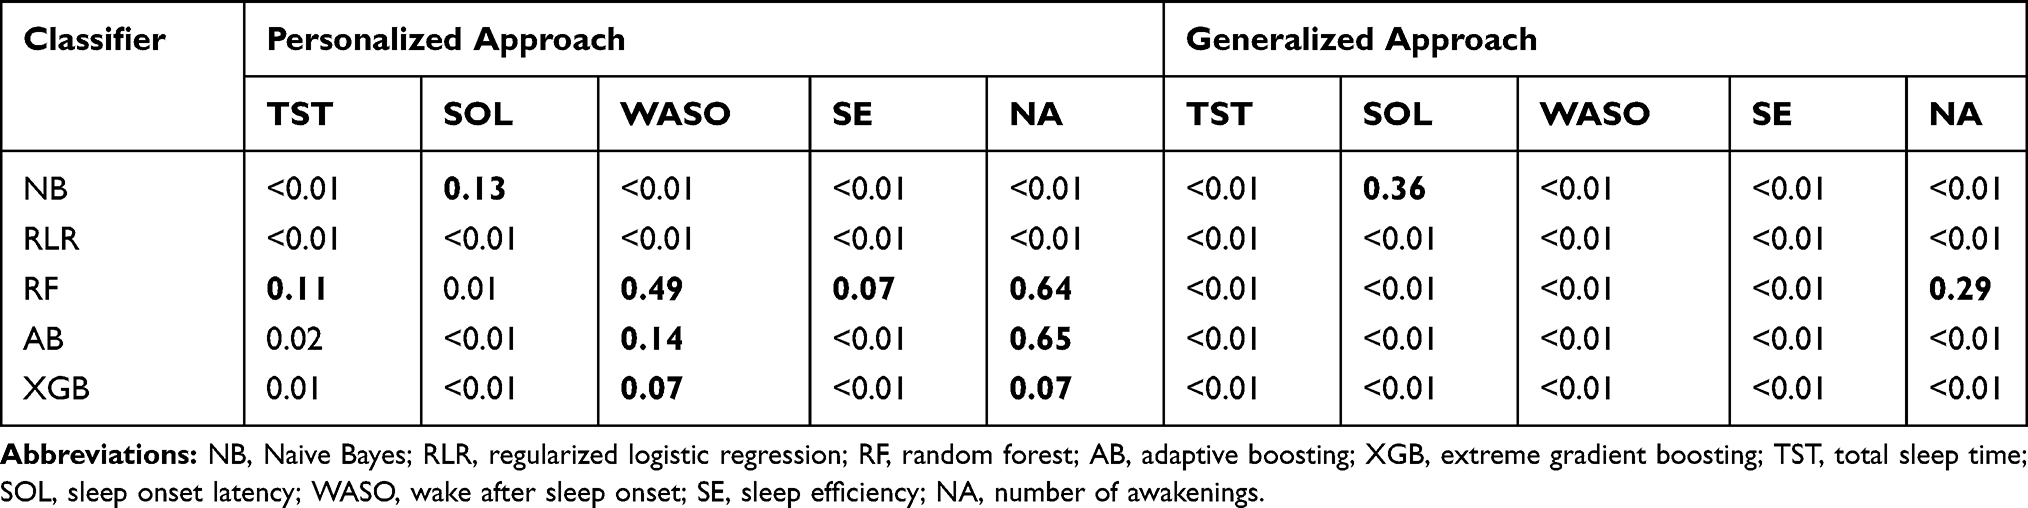 |
Table 4 P-Values of the T-Tests Between Estimates of Sleep Parameters Obtained with Personalized and Generalized Sleep-Wake States Predictors Compared to Those Obtained by PSG. Significance Level Is 0.05. Boldface Numbers Indicate Statistically Non-Significant Values |
Performance of Classifiers: Personalized vs Generalized Predictors
We report results of our comparison, in terms of classifier performance evaluation metrics (see Section Classifier performance evaluation), averaged over all participants across all studies in Table 5 (see Supplementary Tables S7–S12 for detailed results on each participant and all studies). The performance of personalized classifiers is comparable to that of their generalized counterparts in terms of AUC (see Table 5, Figure 1). XGB sleep-wake states predictors outperform their NB, RLR, AB, and RF counterparts with an AUC of 0.84. Interestingly, in the case of 16 out of the 54 participants, or roughly 30% of the population under consideration, personalized XGB significantly outperforms generalized XGB in terms of AUC (p-value < 0.00014 in t-test). Moreover, in the case of 8 individuals, personalized XGB performs as well as generalized XGB (performances can be observed in Supplementary Table S7). Thus, in approximately 44% of the population under consideration, personalized XGB outperforms or matches the performance of generalized XGB, and underperforms in the majority of individuals.
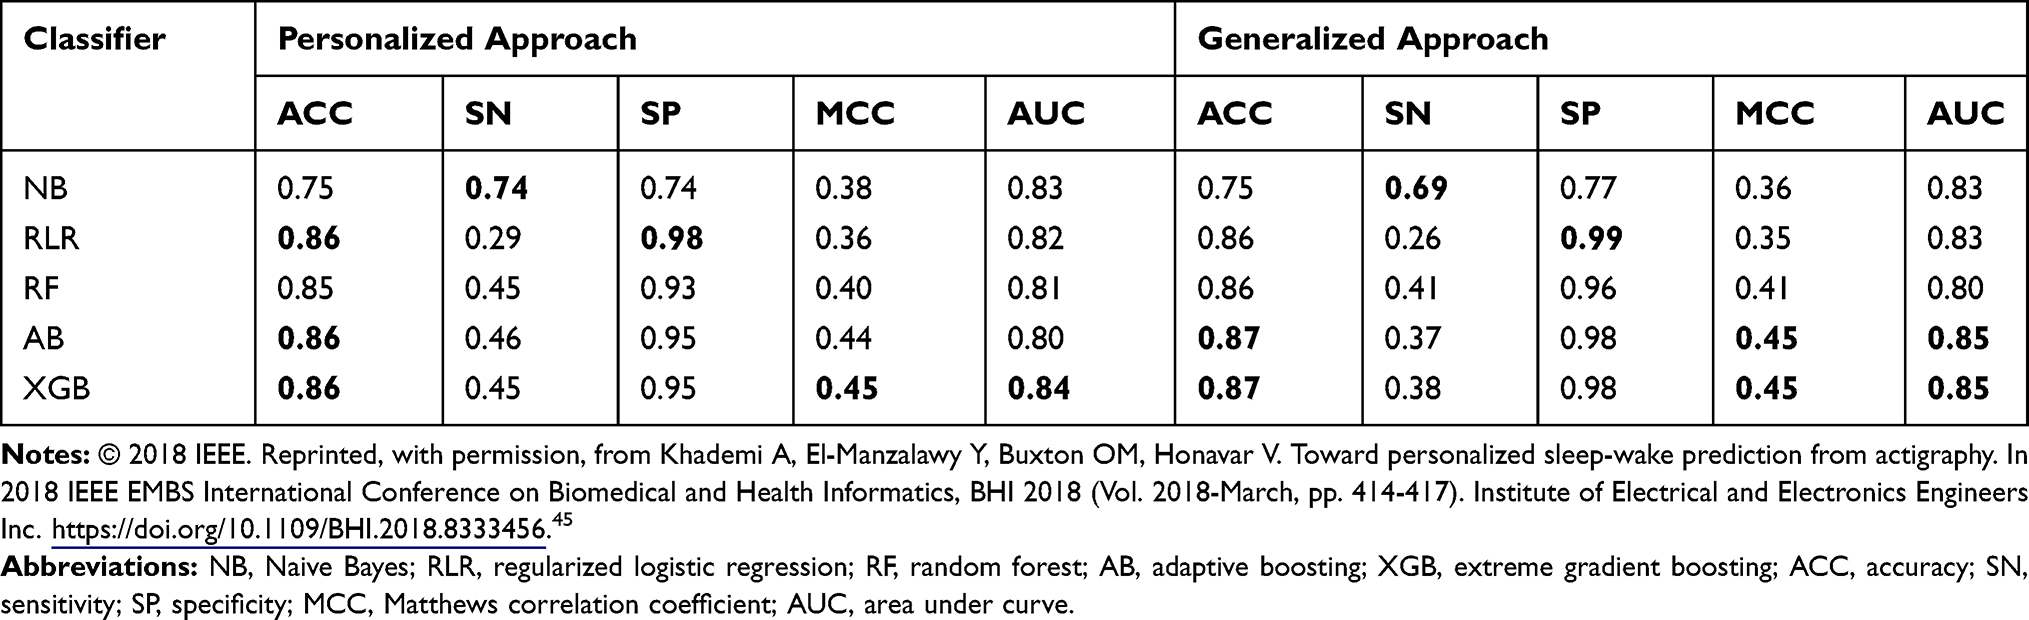 |
Table 5 Performance of Personalized and Generalized Sleep-Wake States Predictors Averaged Over All Participants Across All Studies Combined. In Each Column, tThe Boldface Number(s) Indicate(s) the Highest Value Obtained for the Corresponding Metric |
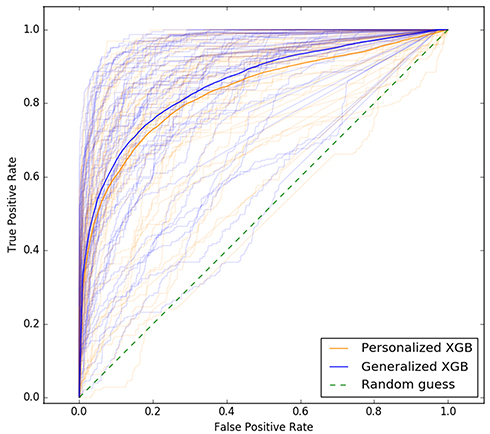 |
Figure 1 ROC curves of personalized and generalized XGB sleep-wake states predictors. The two darker ROC curves show the performance of the generalized predictor (blue) and personalized predictors (orange) averaged over all individuals across all studies. The lighter curves show performance of the generalized XGB predictor and personalized XGB predictors tested on each individual. © 2018 IEEE. Reprinted, with permission, from Khademi A, El-Manzalawy Y, Buxton OM, Honavar V. Toward personalized sleep-wake prediction from actigraphy. In 2018 IEEE EMBS International Conference on Biomedical and Health Informatics, BHI 2018 (Vol. 2018-March, pp. 414–417). Institute of Electrical and Electronics Engineers Inc. https://doi.org/10.1109/BHI.2018.8333456.45 |
We compare performance of personalized and generalized predictors averaged over test data from each study separately (ie, test data from participants from the same study) and report the results in Table 6. Interestingly, personalized and generalized models are consistently comparable to each other in all four studies.
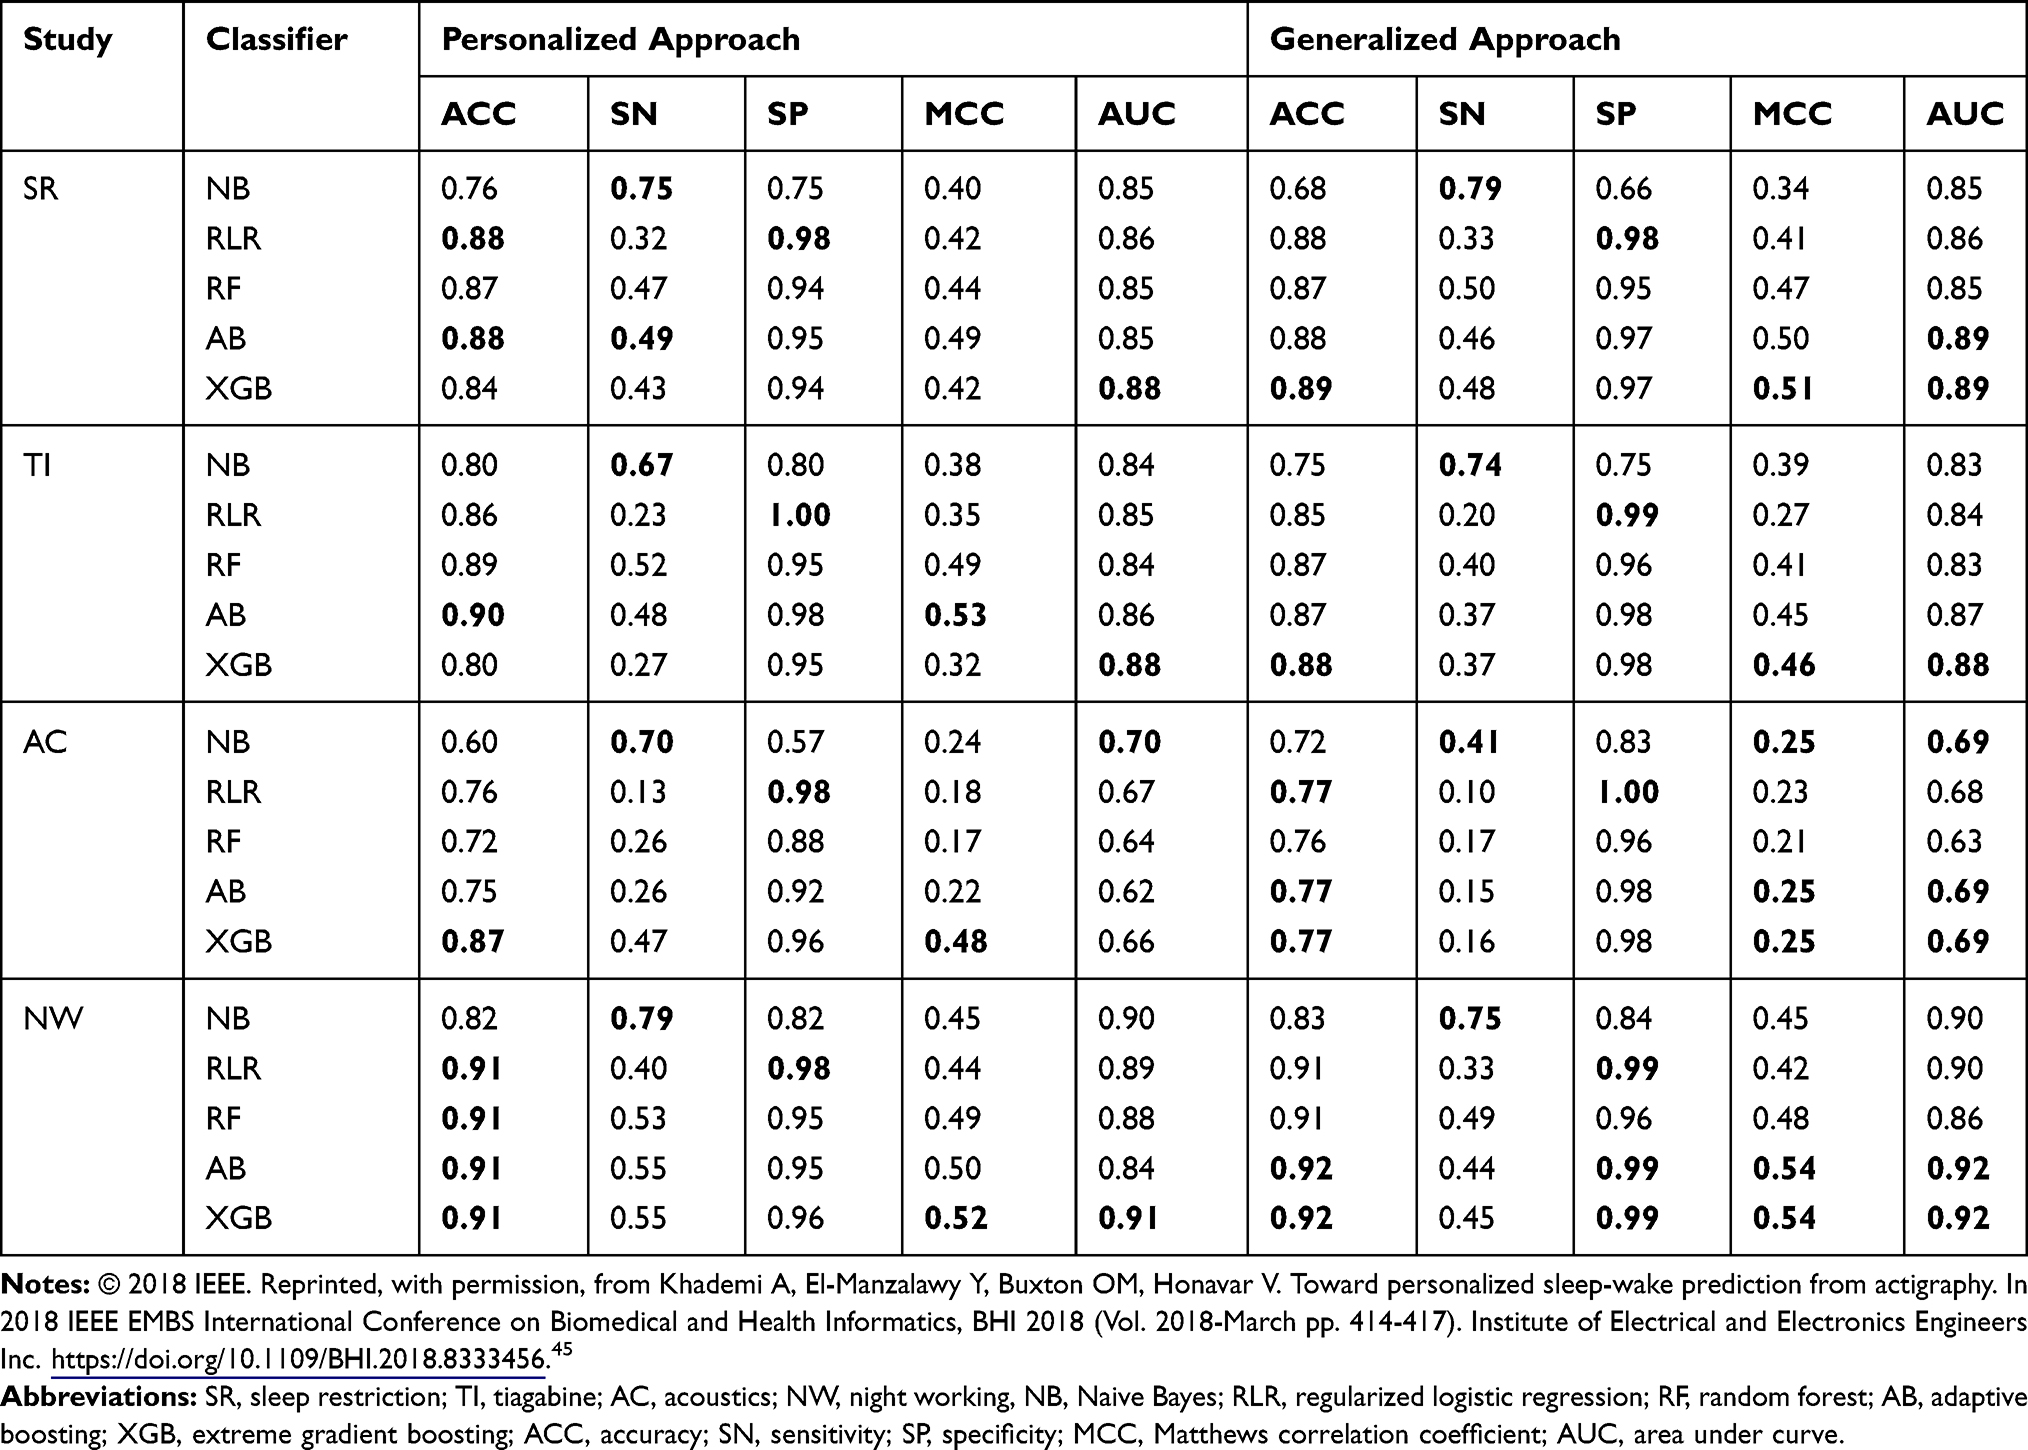 |
Table 6 Performance of Personalized and Generalized Sleep-Wake States Predictors Averaged Separately Across Individuals Within Each Study. In Each Column of Each Study, the Boldface Number(s) Indicate(s) the Highest Value Obtained for the Corresponding Metric |
Supplementary Table S13 shows the results of our statistical analysis on the significance in difference between personalized and generalized predictors’ performances in our experiments. Interestingly, the difference in performance of personalized and generalized predictors is not statistically significant in any of the predictors except for AB. One possible justification is that AB is more prone to over-fitting when training data belong to only one participant (ie, the personalized case).
Finally, to assess whether differences in performances of predictive models could be attributed to differences in sizes of training data, we experimented with two training datasets of different sizes. Results (see Supplementary Tables S14–S16) suggest that training predictive models with more than two sleeping periods yields no significant improvements in their performance compared to when trained with only two sleeping periods.
How Do the Difference in Performances of Predictors Relate to Participants’ Characteristics?
To determine whether the differences in predictive performance (in terms of AUC) between personalized and generalized XGB predictors (chosen because of their highest achieved AUC among other classifiers) could be attributed to differences in individuals’ age, gender, sleep disorder, or time in bed (in minutes) on test data, we computed Pearson’s correlation coefficients between each of these variables and difference in AUC between personalized and generalized XGB predictors. No significant correlation with any of these variables is observed. In agreement with a previous analysis,25 the highest Pearson’s correlation coefficient of 0.264 with p-value = 0.53 was found for age.
Do the Different Studies (Sources of Data) Impact the Relative Performance of the Generalized vs Personalized Sleep-Wake Predictors?
To examine whether there are systematic differences in the relative performance of the personalized vs generalized sleep-wake states predictors, we repeated our analyses separately for each study (ie, source of experimental data) and report the results in Table 7. We refer to such predictive models as study-specific ones, each trained only using data from a specific study and tested on the data from that study.
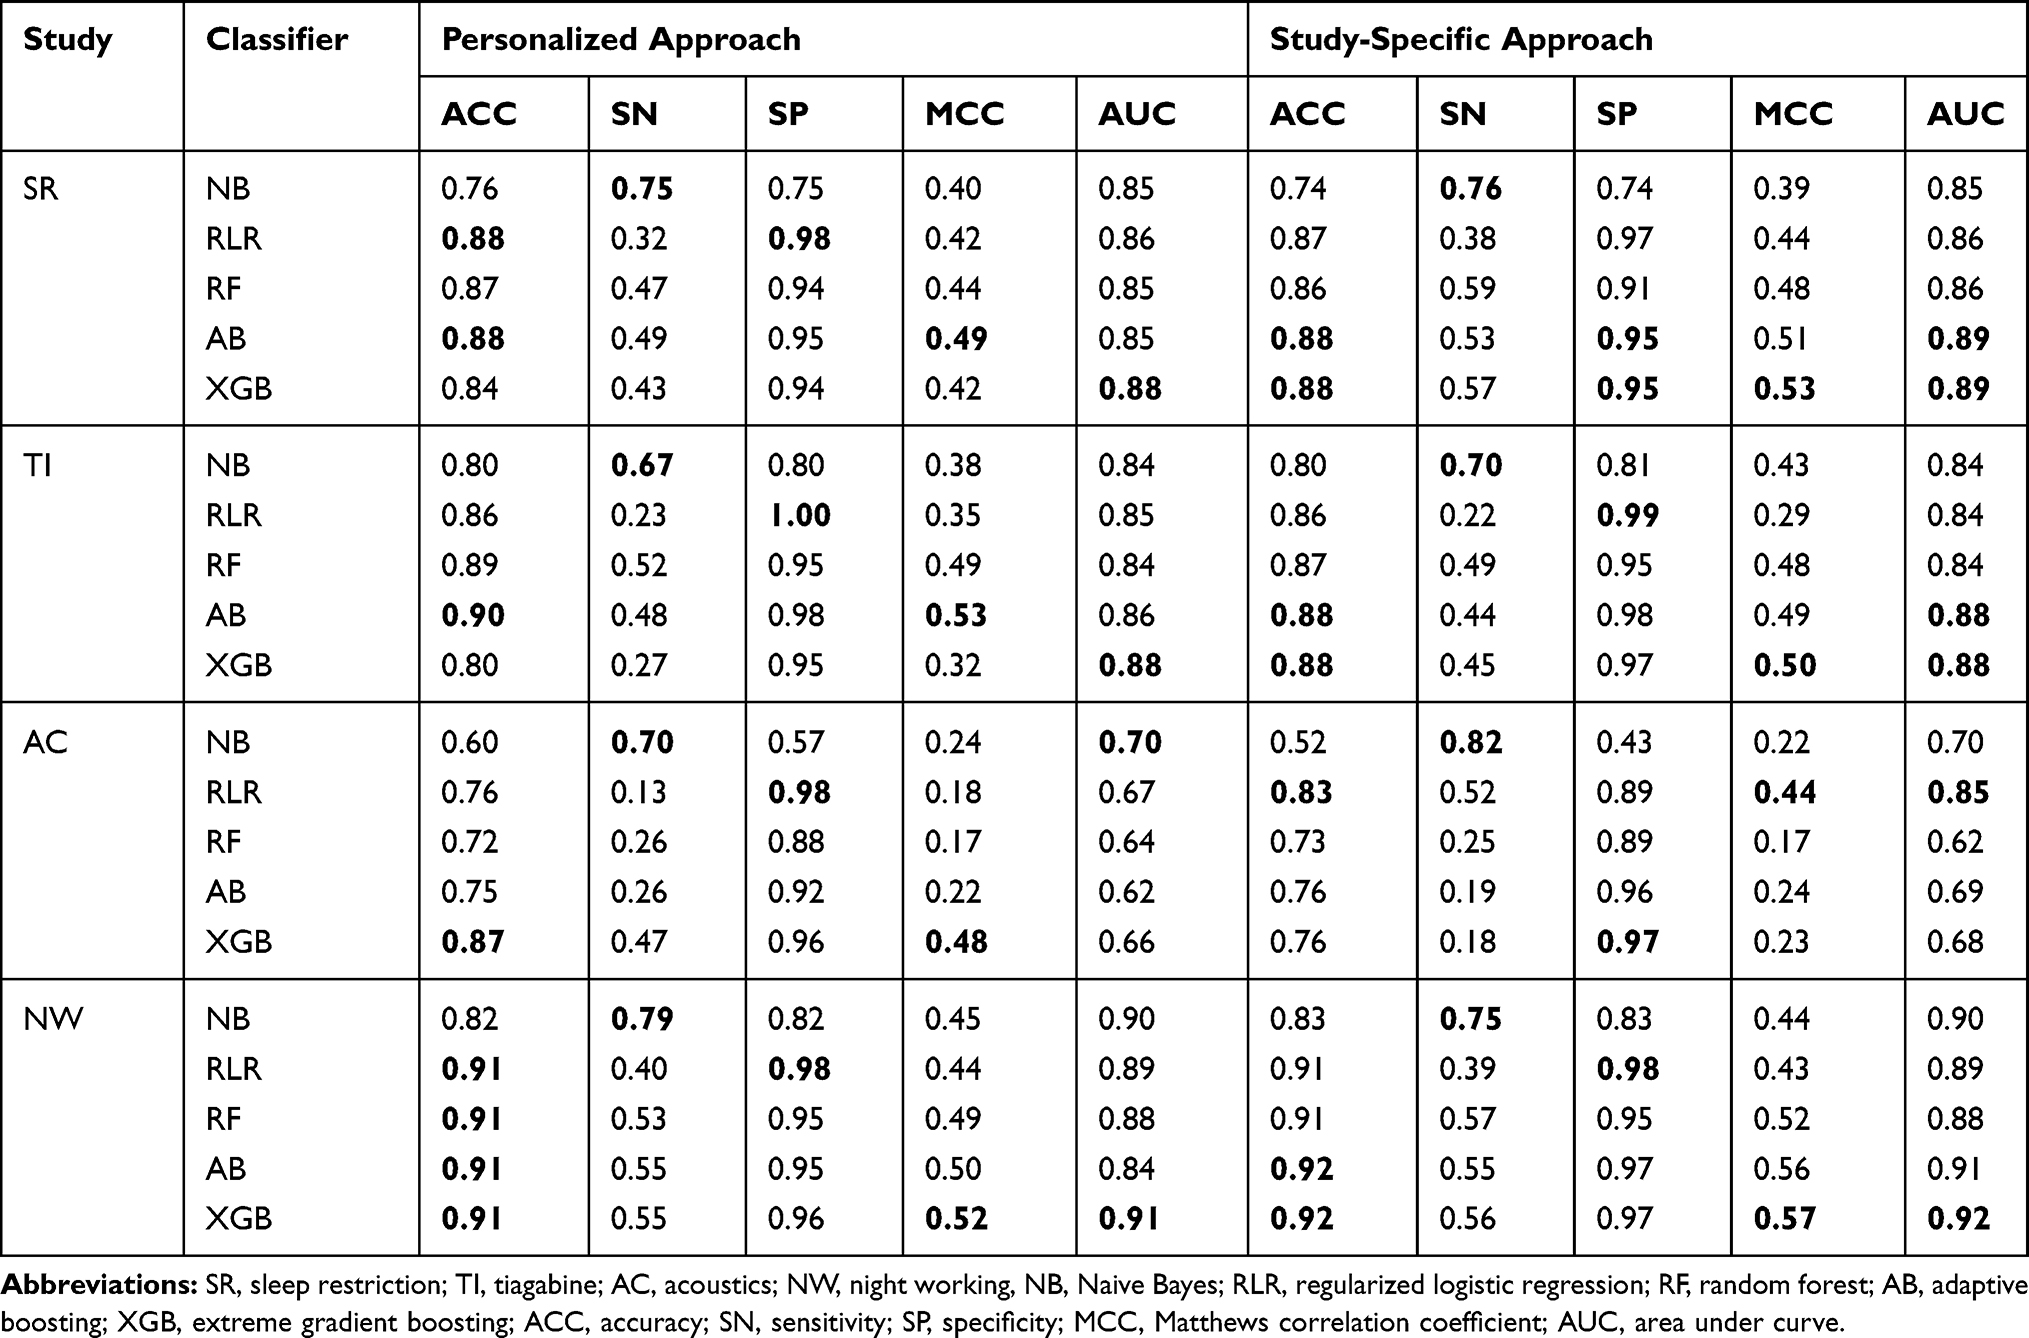 |
Table 7 Performance of Personalized and Study-Specific Sleep-Wake States Predictors Averaged Separately Across Individuals Within Each Study. In Each Column of Each Study, the Boldface Number(s) Indicate(s) the Highest Value Obtained for the Corresponding Metric |
In the SR study of young adult males and TI study of older adults, all personalized models, with the exception of XGB, outperform their generalized counterparts in terms of ACC. Also, we see that in all studies, personalized models are comparable with their study-specific counterparts in terms of AUC. The performance of both personalized and generalized models on data from the Acoustics study is lower than that in the case of other studies. On the Acoustics study, personalized XGB model outperforms its generalized counterpart in terms of ACC by a margin of nearly 11%. All personalized predictors, except for NB and LR, have higher SN than their generalized counterparts. However, in terms of AUC, barring one exception (NB), the personalized predictors do not outperform their generalized counterparts.
Does Testing on Different Sleeping Periods Impact the Test Results?
We ran paired t-tests on the AUC of all sleep-wake states predictors (see Section pred_models) obtained on test data. Specifically, let  be the mean of performance (ie, AUC) on test data in group
  , where
  . For each trained predictor, we ran three t-tests each with the null hypothesis
  where
where  and
and  . For example, rejecting
  would mean results of testing on test data in group 1 are significantly different from testing on test data in group 2. We report results of our t-tests in Supplementary Table S17. Since none of the p-values are significant, there is not enough evidence to reject
  for any of the predictors. We conclude resulting performance of the predictors does not depend on which sleeping period to use as test data.
Discussion
Existing work on developing methods to estimate sleep parameters from actigraphy has focused on developing a single model for all individuals, ie, a generalized model. The considerable variation in sleeping patterns across individuals44 implies that person-specific models could account for such variation across individuals and yield superior models. We develop and show the validity of 5 families of personalized machine learning models for predicting sleep-wake states from actigraphy and compare their performance with that of generalized models using PSG as the gold standard. Our results show that the performance of personalized models, as evaluated by standard classifier performance measures for epoch-level sleep-wake states prediction, yields slightly worse performance than generalized models. Personalized models match or outperform their generalized counterparts in approximately 44% of the population, ie, underperform generalized models in 56% of the population. In contrast, results of our experiments also show personalized models significantly outperform their generalized counterparts in estimating the night-level sleep parameters of total sleep time, wake after sleep onset, sleep efficiency, and number of awakenings, compared to PSG. Our analyses show that differences between estimates of sleep parameters obtained by personalized models are statistically indistinguishable from sleep parameters obtained by PSG, whereas nearly all generalized model sleep parameters differed from PSG. Among our personalized machine learning models, ensemble methods, including random forest and extreme gradient boosting, have superior performance compared to other predictive methods. Our results lay the groundwork for development of classes of reliable personalized machine learning models able to estimate sleep parameters on an individual-level basis and capable of coping with personal characteristics and variability of sleep patterns across individuals.
With recent advances in technology, the public have access to multiple types of actigraphy-collecting devices on the market. These consumer devices provide individuals with measures of their sleep often via phone-based apps. However, all of the currently available devices are equipped with a priori trained and developed (usually non-transparently) generalized sleep assessment models and hence, are not person-specific. The “black box” models also may be changed via non-transparent software updates. We note that these devices can collect individual-level actigraphy data very conveniently and over time. Such availability of data will open up the potential to equip individuals’ devices with personalized models of sleep parameter estimation. Research-grade data could be used to cluster individuals by patterns of sleep to select the closest and most appropriate validated model rather than repeat PSG validations for every individual.
Performances of our developed classifiers on the Acoustics study were lower than the performances on other studies (see Section data for explanation of studies). In the Acoustics study, sleep was occasionally disrupted by environmental noise. A heat map of the similarity between subjects (Figure 2) (see Section Variability across individuals) illustrates the difference between subjects in the Acoustics study. Not only are they different from participants in other studies but also from each other. We speculate the high degree of variability across participants in the Acoustics study explains the difference in performance of the predictive models on the Acoustics study compared to other studies.
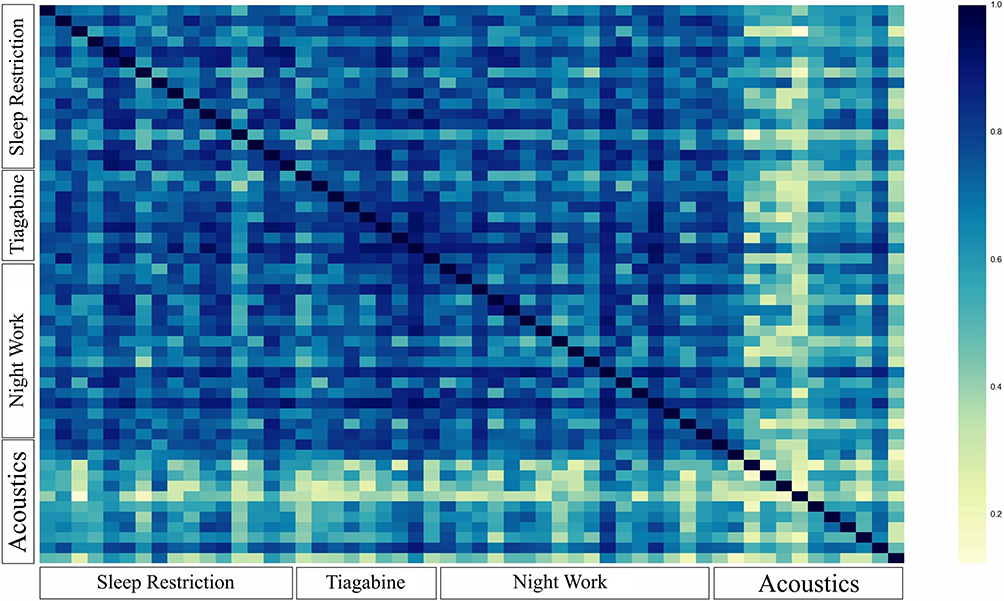 |
Figure 2 Heatmap of the similarity between participants obtained according to the defined similarity measure. Axes group participants based on the study they were in. Each pixel corresponds to one participant. Dark blue means maximum similarity and yellow means minimum similarity. Participants from the Acoustics study are observed to be different than each other and those from other studies potentially explaining the difference in the performance of our predictive models on them. |
Interestingly, our analyses on how size of training data would impact performances of our developed classifiers demonstrate sufficiency of 2 sleeping periods of annotated actigraphy data for training reliable personalized and generalized classifiers. Specifically, considering training classifiers using 2 sleeping periods as baseline, we observed no significant improvement on test data in performances of either personalized or generalized classifiers when trained with more than 2 sleeping periods. We conclude developing reliable personalized and generalized machine learning predictive models of sleep-wake states from actigraphy data is viable with only data from 2 sleeping periods.
To our knowledge, current work along with45 are the first comprehensive machine learning-based approaches to sleep-wake states prediction from actigraphy with 5 families of developed reliable personalized and population-level machine learning models. We systematically developed our machine learning models and tested them with various measures of classifier performance and statistical analyses through extensive machine learning experimentation on high resolution (30-s epoch) data. We achieve a high sensitivity using a Naive Bayes classifier. As we denote wake states to be a positive class label in our study, sensitivity reflects the predictive model’s ability to detect wake states. We pinpoint a high sensitivity, ie, ability to detect wake states, while noting that from a machine learning perspective, there is a trade-off between sensitivity and specificity with higher sensitivities potentially lowering specificities and vice versa. We argue that in using any sleep-wake states prediction or scoring algorithm (and binary classification in general), one can trade-off sensitivity and specificity by changing the threshold used to convert predicted probability of class labels.60 The trade-off can be application and context dependent. Hence, we suggest the use of the Receiver Operating Characteristics (ROC) curves capturing all possible trade-offs (see Section Classifier performance evaluation).
Using actigraphy in measuring sleep has several advantages over PSG. Recording and collecting PSG over an extended period of time can be inconvenient and costly, making it impractical61 in settings where longitudinal measures of sleep are of interest. Using actigraphy, one can relatively conveniently collect movement data over time and this provides us with the opportunity to measure sleep in longitudinal settings with relatively low-cost. The inexpensive and unobtrusive nature of actigraphy, as opposed to PSG, makes actigraphy a valuable tool to increase the amount of collected data. Actigraphy devices are usually small in size and light in weight making them an unobtrusive alternative to PSG recordings that can be cumbersome for patients. These advantages of actigraphy over PSG pave the way for choosing actigraphy over PSG in developing personalized models of measuring sleep.
We use actigraphy data from25 collected during sleep laboratory sessions, but we note such data may not reflect actigraphy behavior in home settings. The population under consideration comprise a wide range of ages which entails both advantages and disadvantages. To our strength, sufficient classifier performance on such age diversity shows the reliability, validity, and applicability of our developed machine learning models on people with a variety of ages. We observed no statistically significant correlation between age and the difference between our developed personalized and generalized predictive models. As a limitation, the age range calls for elucidation of sleep patterns across people in different age categories and development of reliable personalized machine learning models for sleep quality assessment in each category.
Some directions for future research include, but are not limited to: (1) The data used in our work do not contain 24 hrs of sleep screening and are limited to night time (sleeping period). Development of reliable personalized machine learning models of sleep-wake states prediction using 24-hr data is a promising next step, (2) PSG annotation is a non-trivial task and is not always available along with actigraphy data. A fruitful future research direction is developing personalized variants of the unsupervised (not using the PSG labels) machine learning models of sleep-wake states prediction using actigraphy,41 (3) We considered at least 3 sleeping periods of data from each participant: 2 or more to train and 1 to test our predictive models. However, in situations such as clinical sleep studies, it is conceivable that only 1 sleeping period of data may be available. Future work can develop personalized models that are trained and tested using only 1 sleeping period of actigraphy data, and (4) Developing personalized machine learning models for sleep-stages prediction as well as for that of physical activity recognition.51
Acknowledgments
This work was funded in part by grants from the NIH NCATS through the grant UL1 TR002014, and by the NSF through the grants 1640834, and 1636795, NIH NLM through T32 LM012415, the Edward Frymoyer Endowed Professorship in Information Sciences and Technology at Pennsylvania State University and the Sudha Murty Distinguished Visiting Chair in Neurocomputing and Data Science funded by the Pratiksha Trust at the Indian Institute of Science (both held by Vasant Honavar). This was not an industry supported study. Original data collected represent secondary use of past trial data collected in a General Clinical Research Center funded by M01-RR02635. Investigator-initiated grants from the Academy of Architecture for Health and the Facilities Guidelines Institute (Jo Solet, PI) supported data collection. Investigator-initiated grants to Dr. Buxton from Cephalon Inc. and Sepracor Inc supported data collection. The content is solely the responsibility of the authors and does not necessarily represent the official views of the sponsors.
Author Contributions
The manuscript was written by AK. OB and LM contributed to data acquisition and analysis. AK, YE, OB, and VH contributed to design, analysis, and interpretation of the content in the paper. All authors contributed to data analysis, drafting or revising the article, gave final approval of the version to be published, and agree to be accountable for all aspects of the work.
Disclosure
Dr Buxton reports investigator-initiated grants from Cephalon, Inc, and Sepracor, Inc, during the conduct of the study that partially supported data collection. Outside of the current work, Orfeu M. Buxton received two subcontract grants to Penn State, from Mobile Sleep Technologies/Proactive Life (NSF/STTR #1622766, NIH/NIA SBIR R43AG056250). Dr. Buxton also receives honoraria and travel support from non-profit institutions for lectures from the Tufts University School of Dental Medicine Boston College, Boston University, and Harvard Chan School of Public Health; and from the for-profit entity Allstate Insurance Company; and honoraria from the National Sleep Foundation for his role as Editor in Chief (designate) of Sleep Health. Preliminary findings of this paper were presented at The IEEE-EMBS International Conference on Biomedical and Health Informatics (BHI) as an oral presentation with interim findings. The findings were published in “Toward personalized sleep-wake prediction from actigraphy” in 2018 IEEE-EMBS International Conference on Biomedical & Health Informatics (BHI), pp. 414–417; IEEE; 2018 (https://ieeexplore.ieee.org/abstract/document/8333456). The authors report no other conflicts of interest in this work.
References
1. Spiegelhalder K, Scholtes C, Riemann D. The association between insomnia and cardiovascular diseases. Nat Sci Sleep. 2010;2:71. doi:10.2147/NSS.S7471
2. Marrone O, Bonsignore MR. Blood-pressure variability in patients with obstructive sleep apnea: current perspectives. Nat Sci Sleep. 2018;10:229. doi:10.2147/NSS.S148543
3. Morris CJ, Purvis TE, Hu K, Scheer FA. Circadian misalignment increases cardiovascular disease risk factors in humans. Proc Natl Acad Sci. 2016;113:E1402–E1411. doi:10.1073/pnas.1516953113
4. Scheer FA, Hu K, Evoniuk H, et al. Impact of the human circadian system, exercise, and their interaction on cardiovascular function. Proc Natl Acad Sci. 2010;107:20541–20546. doi:10.1073/pnas.1006749107
5. Rajan P, Greenberg H. Obstructive sleep apnea as a risk factor for type 2 diabetes mellitus. Nat Sci Sleep. 2015;7:113.
6. Gruber R, Michaelsen S, Bergmame L, et al. Short sleep duration is associated with teacher-reported inattention and cognitive problems in healthy school-aged children. Nat Sci Sleep. 2012;4:33. doi:10.2147/NSS.S24607
7. Cassoff J, Wiebe ST, Gruber R. Sleep patterns and the risk for ADHD: a review. Nat Sci Sleep. 2012;4:73.
8. Orta OR, Barbosa C, Velez JC, et al. Associations of self-reported and objectively measured sleep disturbances with depression among primary caregivers of children with disabilities. Nat Sci Sleep. 2016;8:181. doi:10.2147/NSS.S104338
9. Kabrita CS, Hajjar-Muça TA. Sex-specific sleep patterns among university students in lebanon: impact on depression and academic performance. Nat Sci Sleep. 2016;8:189. doi:10.2147/NSS.S104383
10. Lovato N, Short MA, Micic G, Hiller RM, Gradisar M. An investigation of the longitudinal relationship between sleep and depressed mood in developing teens. Nat Sci Sleep. 2017;9:3. doi:10.2147/NSS.S111521
11. Buxton OM, Shea SA. Sleep & work, work & sleep . Sleep Heal J Natl Sleep Found. 2018;4:497–498. doi:10.1016/j.sleh.2018.10.007
12. Cappuccio FP, D’Elia L, Strazzullo P, Miller MA. Sleep duration and all-cause mortality: a systematic review and meta-analysis of prospective studies. Sleep. 2010;33:585–592. doi:10.1093/sleep/33.5.585
13. Hargens TA, Kaleth AS, Edwards ES, Butner KL. Association between sleep disorders, obesity, and exercise: a review. Nat Sci Sleep. 2013;5:27. doi:10.2147/NSS.S34838
14. Anderson KN, Bradley AJ. Sleep disturbance in mental health problems and neurodegenerative disease. Nat Sci Sleep. 2013;5:61. doi:10.2147/NSS.S34842
15. Medic G, Wille M, Hemels ME. Short-and long-term health consequences of sleep disruption. Nat Sci Sleep. 2017;9:151. doi:10.2147/NSS.S134864
16. Sadeh A. The role and validity of actigraphy in sleep medicine: an update. Sleep Med Rev. 2011;15:259–267. doi:10.1016/j.smrv.2010.10.001
17. Quante M, Kaplan ER, Cailler M, et al. Actigraphy-based sleep estimation in adolescents and adults: a comparison with polysomnography using two scoring algorithms. Nat Sci Sleep. 2018;10:13. doi:10.2147/NSS.S151085
18. Quante M, Kaplan ER, Rueschman M, et al. Practical considerations in using accelerometers to assess physical activity, sedentary behavior, and sleep. Sleep Health. 2015;1:275–284. doi:10.1016/j.sleh.2015.09.002
19. Kripke DF, Mullaney D, Messin S, Wyborney VG. Wrist actigraphic measures of sleep and rhythms. Electroencephal Clin Neurophysiol. 1978;44:674–676. doi:10.1016/0013-4694(78)90133-5
20. Kripke DF, Hahn EK, Grizas AP, et al. Wrist actigraphic scoring for sleep laboratory patients: algorithm development. J Sleep Res. 2010;19:612–619. doi:10.1111/j.1365-2869.2010.00835.x
21. Mullaney D, Kripke D, Messin S. Wrist-actigraphic estimation of sleep time. Sleep. 1980;3:83–92. doi:10.1093/sleep/3.1.83
22. Sadeh A, Alster J, Urbach D, Lavie P. Actigraphically based automatic bedtime sleep-wake scoring: validity and clinical applications. J Ambul Monit. 1989;2:209–216.
23. Sadeh A, Sharkey M, Carskadon MA. Activity-based sleep-wake identification: an empirical test of methodological issues. Sleep. 1994;17:201–207. doi:10.1093/sleep/17.3.201
24. Cole RJ, Kripke DF, Gruen W, Mullaney DJ, Gillin JC. Automatic sleep/wake identification from wrist activity. Sleep. 1992;15:461–469. doi:10.1093/sleep/15.5.461
25. Marino M, Li Y, Rueschman MN, et al. Measuring sleep: accuracy, sensitivity, and specificity of wrist actigraphy compared to polysomnography. Sleep. 2013;36:1747–1755. doi:10.5665/sleep.3142
26. Jean-Louis G, Kripke DF, Mason WJ, Elliott JA, Youngstedt SD. Sleep estimation from wrist movement quantified by different actigraphic modalities. J Neurosci Methods. 2001;105:185–191. doi:10.1016/S0165-0270(00)00364-2
27. Jean-Louis G, Kripke DF, Cole RJ, Assmus JD, Langer RD. Sleep detection with an accelerometer actigraph: comparisons with polysomnography. Physiol Behav. 2001;72:21–28. doi:10.1016/S0031-9384(00)00355-3
28. de Souza L, Benedito-Silva AA, Pires ML, et al. Further validation of actigraphy for sleep studies. Sleep. 2003;26:81–85. doi:10.1093/sleep/26.1.81
29. Hedner J, Pillar G, Pittman SD, et al. A novel adaptive wrist actigraphy algorithm for sleep-wake assessment in sleep apnea patients. Sleep. 2004;27:1560–1566. doi:10.1093/sleep/27.8.1560
30. Enomoto M, Endo T, Suenaga K, et al. Newly developed waist actigraphy and its sleep/wake scoring algorithm. Sleep Biol Rhythm. 2009;7:17–22. doi:10.1111/j.1479-8425.2008.00377.x
31. Tilmanne J, Urbain J, Kothare MV, Wouwer AV, Kothare SV. Algorithms for sleep–wake identification using actigraphy: a comparative study and new results. J Sleep Res. 2009;18:85–98. doi:10.1111/j.1365-2869.2008.00706.x
32. Lamprecht ML, Bradley AP, Tran T, Boynton A, Terrill PI. Multisite accelerometry for sleep and wake classification in children. Physiol Meas. 2014;36:133. doi:10.1088/0967-3334/36/1/133
33. van der Berg JD, Willems PJ, van der Velde JH, et al. Identifying waking time in 24-h accelerometry data in adults using an automated algorithm. J Sports Sci. 2016;34:1867–1873. doi:10.1080/02640414.2016.1140908
34. Kaplan RF, Wang Y, Loparo KA, Kelly MR, Bootzin RR. Performance evaluation of an automated single-channel sleep–wake detection algorithm. Nat Sci Sleep. 2014;6:113. doi:10.2147/NSS.S71159
35. Dayyat EA, Spruyt K, Molfese DL, Gozal D. Sleep estimates in children: parental versus actigraphic assessments. Nat Sci Sleep. 2011;3:115.
36. Sharif MM, BaHammam AS. Sleep estimation using bodymedia’s sensewear™ armband in patients with obstructive sleep apnea. Ann Thoracic Med. 2013;8:53. doi:10.4103/1817-1737.105720
37. Paavonen EJ, Fjällberg M, Steenari M-R, Aronen ET. Actigraph placement and sleep estimation in children. Sleep. 2002;25:235–237. doi:10.1093/sleep/25.2.235
38. Orellana G, Held, CM, Estévez, PA, et al. A balanced sleep/wakefulness classification method based on actigraphic data in adolescents. In
39. Domingues A, Paiva T, Sanches JM. Sleep and wakefulness state detection in nocturnal actigraphy based on movement information. IEEE Trans Biomed Eng. 2014;61:426–434. doi:10.1109/TBME.2013.2280538
40. Willemen T, Van Deun D, Verhaert V, et al. An evaluation of cardiorespiratory and movement features with respect to sleep-stage classification. IEEE J Biomed Health Inf. 2014;18:661–669. doi:10.1109/JBHI.2013.2276083
41. El-Manzalawy Y, Buxton O, Honavar V. Sleep/wake state prediction and sleep parameter estimation using unsupervised classification via clustering. In: Proceedings. 2017 IEEE International Conference on Bioinformatics and Biomedicine (BIBM). Hu X, Shyu CR, Bromberg Y, et al, editors. Kansas City: IEEE; 2017:718–723.
42. Aktaruzzaman M, Rivolta MW, Karmacharya R, et al. Performance comparison between wrist and chest actigraphy in combination with heart rate variability for sleep classification. Comp Biol Med. 2017;89:212–221. doi:10.1016/j.compbiomed.2017.08.006
43. Razjouyan J, Lee H, Parthasarathy S, et al. Improving sleep quality assessment using wearable sensors by including information from postural/sleep position changes and body acceleration: a comparison of chestworn sensors, wrist actigraphy, and polysomnography. J Clin Sleep Med. 2017;13:1301–1310. doi:10.5664/jcsm.6802
44. Rusterholz T, Tarokh L, Van Dongen H, Achermann P. Interindividual differences in the dynamics of the homeostatic process are trait-like and distinct for sleep versus wakefulness. J Sleep Res. 2017;26:171–178. doi:10.1111/jsr.12483
45. Khademi A, El-Manzalawy Y, Buxton OM, Honavar V. Toward personalized sleep-wake prediction from actigraphy. In: 2018 IEEE EMBS International Conference on Biomedical and Health Informatics, BHI 2018. Las Vegas: IEEE; 2018:414–417.
46. Dang-Vu TT, McKinney SM, Buxton OM, Solet JM, Ellenbogen JM. Spontaneous brain rhythms predict sleep stability in the face of noise. Curr Biol. 2010;20:R626–R627. doi:10.1016/j.cub.2010.06.032
47. McKinney SM, Dang-Vu TT, Buxton OM, Solet JM, Ellenbogen JM. Covert waking brain activity reveals instantaneous sleep depth. PLoS ONE. 2011;6:e17351. doi:10.1371/journal.pone.0017351
48. Buxton OM, Ellenbogen JM, Wang W, et al. Sleep disruption due to hospital noises - a prospective evaluation. Ann Internal Med. 2012;157:170–179. doi:10.7326/0003-4819-156-12-201208070-00472
49. Buxton OM, Pavlova M, Reid EW, et al. Sleep restriction for 1 week reduces insulin sensitivity in healthy men. Diabetes. 2010;59:2126–2133. doi:10.2337/db09-0699
50. Buxton OM, Pavlova M, Wang W, et al. Examining the effects of daytime eszopiclone administration on daytime sleep and nighttime wakefulness: a randomized, double-blind, placebo-controlled, crossover trial in shift workers. Sleep. 2013;36:
51. Zheng Y, Wong W-K, Guan X, Trost S Physical activity recognition from accelerometer data using a multi-scale ensemble method. In
52. Mitchell TM. Machine learning. wcb (1997).
53. Cox DR. The regression analysis of binary sequences. J Royal Stat Soc Ser B (Methodological). 1958;215–242.
54. Breiman L. Random forests. Mach Learn. 2001;45:5–32. doi:10.1023/A:1010933404324
55. Freund Y, Schapire RE. A decision-theoretic generalization of on-line learning and an application to boosting. I
56. Chen T, Guestrin C. Xgboost: a scalable tree boosting system. In: Proceedings of the 22nd ACM SIGKDD International Conference on Knowledge Discovery and Data Mining. New York: ACM; 2016:785–794.
57. Friedman JH. Greedy function approximation: a gradient boosting machine. Ann Stat. 2001;29:1189–1232. doi:10.1214/aos/1013203451
58. Provost FJ, Fawcett T, Kohavi R, et al. The case against accuracy estimation for comparing induction algorithms. ICML. 1998;98:445–453.
59. Benavoli A, Corani G, Mangili F. Should we really use post-hoc tests based on mean-ranks. J Mach Learn Res. 2016;17:1–10.
60. Baldi P, Brunak S, Chauvin Y, Andersen CA, Nielsen H. Assessing the accuracy of prediction algorithms for classification: an overview. Bioinformatics. 2000;16:412–424. doi:10.1093/bioinformatics/16.5.412
61. Morgenthaler T, Alessi C, Friedman L, et al. Practice parameters for the use of actigraphy in the assessment of sleep and sleep disorders: an update for 2007. Sleep. 2007;30:519–529. doi:10.1093/sleep/30.4.519
 © 2019 The Author(s). This work is published and licensed by Dove Medical Press Limited. The
full terms of this license are available at https://www.dovepress.com/terms
and incorporate the Creative Commons Attribution
- Non Commercial (unported, 3.0) License.
By accessing the work you hereby accept the Terms. Non-commercial uses of the work are permitted
without any further permission from Dove Medical Press Limited, provided the work is properly
attributed. For permission for commercial use of this work, please see paragraphs 4.2 and 5 of our Terms.
© 2019 The Author(s). This work is published and licensed by Dove Medical Press Limited. The
full terms of this license are available at https://www.dovepress.com/terms
and incorporate the Creative Commons Attribution
- Non Commercial (unported, 3.0) License.
By accessing the work you hereby accept the Terms. Non-commercial uses of the work are permitted
without any further permission from Dove Medical Press Limited, provided the work is properly
attributed. For permission for commercial use of this work, please see paragraphs 4.2 and 5 of our Terms.