Back to Journals » Vascular Health and Risk Management » Volume 22
Perivascular Adipose Tissue Radiomics Predicts Abdominal Aortic Aneurysm Rupture: A Multicenter Study
Authors Feng Y ![]() , Wu M, An H, Geng Y, Zhang H, Lu J, Wu X, Xu L, Yang Y
, Wu M, An H, Geng Y, Zhang H, Lu J, Wu X, Xu L, Yang Y
Received 25 August 2025
Accepted for publication 25 December 2025
Published 8 January 2026 Volume 2026:22 559381
DOI https://doi.org/10.2147/VHRM.S559381
Checked for plagiarism Yes
Review by Single anonymous peer review
Peer reviewer comments 2
Editor who approved publication: Dr Akash Batta
Yuan Feng,1 Mengchao Wu,1 Hongfei An,1 Yihe Geng,1 Hanfang Zhang,1 Jinghan Lu,1 Xuejun Wu,2 Lei Xu,3 Yaoguo Yang1
1Department of Vascular Surgery, Beijing Anzhen Hospital, Capital Medical University, Beijing, People’s Republic of China; 2Department of Vascular Surgery, Shandong Provincial Hospital Affiliated to Shandong University, Jinan, Shandong, People’s Republic of China; 3Department of Radiology, Beijing Anzhen Hospital, Capital Medical University, Beijing, People’s Republic of China
Correspondence: Yaoguo Yang, Department of Vascular Surgery, Beijing Anzhen Hospital, Capital Medical University, No. 2, Anzhen Road, Beijing, 100032, People’s Republic of China, Email [email protected]
Objective: Compared to stable abdominal aortic aneurysms (AAA), the inflammatory response in perivascular adipose tissue (PVAT) may be exacerbated prior to rupture, leading to functional and structural alterations that manifest as imaging disparities. Radiomics enables the extraction of images features, which can be integrated with machine learning(ML) to construct models for clinical decision support. This study investigated the potential of radiomic features derived from PVAT to predict AAA rupture.
Methods: A retrospective analysis was conducted using aortic Computed Tomography Angiography (CTA) images from two centers, comprising patients with either stable or ruptured AAA who had pre-rupture CTA scans. These images were allocated to a development set and an external validation set. After radiomic feature extraction, statistically significant features between the two groups were subjected to dimensionality reduction. Subsequently, ten common ML models were constructed and validated using both internal and external validation sets.
Results: The development set comprised 37 ruptured patients and 155 non-ruptured patients. The external test set included 6 ruptured patients and 30 non-ruptured patients. A total of 107 radiomic features were extracted per patient, of which 18 exhibited statistically significant differences between groups. After dimensionality reduction, 5 representative features were selected. The constructed models achieved an average accuracy of 0.76 and an average AUC of 0.81 in the internal test set, while the external test set yielded an average accuracy of 0.73 and an average AUC of 0.77.
Conclusion: Significant differences exist in PVAT characteristics between ruptured and non-ruptured AAA patients, supporting the feasibility of using radiomic features for rupture prediction with reasonable accuracy.
Keywords: abdominal aortic aneurysm, computational models, cardiovascular disease, perivascular adipose tissue, machine learning
Introduction
An abdominal aortic aneurysm (AAA) is a common vascular disorder defined as a localized, permanent dilation of the abdominal aorta exceeding 50% of its normal diameter.1 Typically, an AAA is diagnosed when the aortic diameter exceeds 3 cm.1 This condition leads to structural weakening of the vascular wall, which may result in severe complications such as AAA rupture.1,2 Perivascular adipose tissue (PVAT), the fat depot surrounding the vascular adventitia, is predominantly distributed around large and medium-sized arteries3–5 (eg, the aorta and coronary arteries). Vascular wall inflammation plays a critical role in AAA pathogenesis,6 and AAA wall components can modulate PVAT structure and function via bioactive molecule secretion.7,8 Thus, it is reasonable to hypothesize that vascular inflammatory activity may influence PVAT, potentially manifesting as radiologic differences in PVAT.
Computed tomography angiography (CTA) provides high-resolution visualization of AAA dimensions and intraluminal hemodynamics, serving as the gold standard for AAA diagnosis and surveillance. Additionally, CTA enables assessment of peri-aneurysmal adipose tissue. Radiomics, an emerging technique integrating medical imaging and big data analytics, extracts high-throughput features from medical images to uncover latent biological information for clinical decision support.9,10 Machine learning (ML), a mathematical framework for automated pattern recognition and predictive modeling, is frequently applied to large datasets. Prior studies have utilized PVAT-derived radiomic features to predict post-endovascular aneurysm repair sac expansion.11 However, no research has yet investigated the predictive value of PVAT radiomics for AAA rupture.
Therefore, this study aims to: 1) Compare pre-rupture PVAT characteristics in ruptured AAA patients versus stable AAA controls; 2) Develop multiple ML models for AAA rupture prediction based on these differential features.
Methods
Patients Selection and Image Acquirement
All patients were diagnosed with AAA or ruptured AAA. The development set comprised patients admitted to Beijing Anzhen Hospital between July 2005 and May 2025, while the external validation set consisted of patients treated at Shandong Provincial Hospital from July 2010 to July 2022. The inclusion criteria for the rupture group were as follows: 1. Diagnosis of ruptured AAA; 2. Undergoing aortic CTA at the admitting hospital; 3. Availability of pre-rupture aortic CTA images or admission aortic CTA reports without confirmed AAA rupture. The inclusion criteria for the control group were as follows: 1. Diagnosis of AAA; 2. Undergoing aortic CTA at the admitting hospital; 3. Availability of preoperative aortic CTA images for AAA.
Image Segmentation
Using 3D Slicer (v5.8.1),12 AAA segmentation was performed by manually placing regions of interest (ROI) slice-by-slice at the aortic border below the renal arteries to above the bifurcation of the abdominal aorta. Measurements of the maximum AAA diameter performed on maximum cross-section. After segmentation, a vascular surgeon with more than 25 years of experience (Yang, Y). Subsequently, the “margin” function of the 3D Slicer software was employed to expand the AAA segmentation boundary outward by 5 mm, with the CT value range set between −200 and 0, to achieve preliminary segmentation of PVAT. The “logical operators” function was then utilized to duplicate the AAA segmentation, which was subsequently reduced by 1 mm to minimize manual segmentation errors. The refined PVAT segmentation was obtained by subtracting this reduced segmentation from the initial PVAT segmentation.11,13,14 Figure 1 demonstrates an example of segmented AAA and its PVAT.
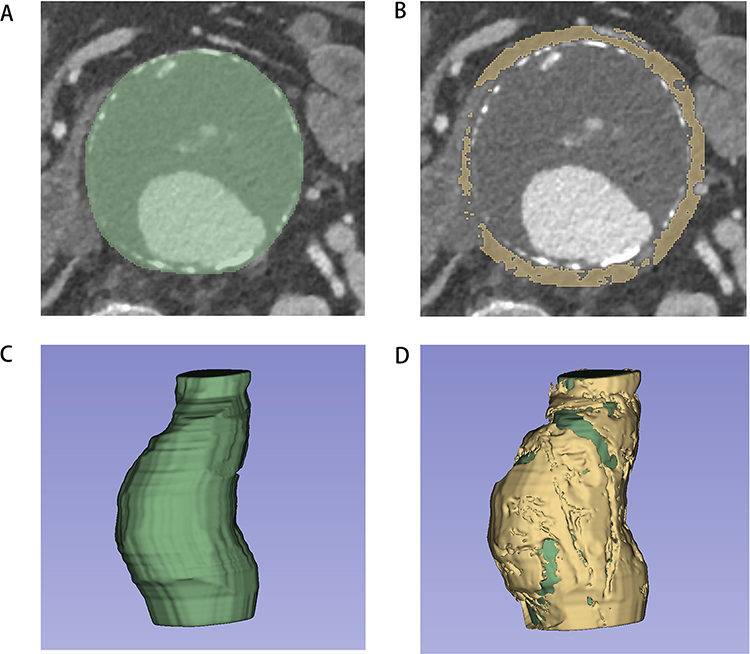 |
Figure 1 Demonstrates an example of segmented AAA and its PVAT. Notes: This figure was derived from a patient in the ruptured group. (A) demonstrates the segmentation of AAA. (B) displays the processed PVAT region. (C) provides a 3D reconstruction of the AAA, while (D) presents a combined 3D visualization of both PVAT and AAA. |
Feature Extraction
The plugin “radiomics” of 3D Slicer was employed to extract radiological characteristics from the PVAT region, including 14 shape features, 18 histogram features (also referred to as first-order features), and 75 texture features. Shape features were utilized to characterize the geometric morphology of the ROI, reflecting the 3D spatial distribution, boundary regularity, and structural complexity of the lesion. Histogram features were applied to quantify the overall distribution properties of gray-scale values within the ROI, with tissue radiological characteristics being represented solely in response to the frequency distribution of intensity values. Texture features described the spatial distribution patterns of voxels within the image, reflecting the heterogeneity, regularity, and complexity of tissue structures.
Machine Learning
To investigate whether radiomics features of perivascular adipose tissue can assist in predicting AAA rupture, we developed 10 common ML models based on extracted features. The ML models included logistic regression (LR), adaptive boosting (AB), bagging (BAG), gradient boosting (GB), Gaussian naive Bayes (GNB), k-nearest neighbors (KNN), linear discriminant analysis (LDA), quadratic discriminant analysis (QDA), random forest (RF), and support vector machine (SVM). The machine learning workflow consisted of the following steps: 1. Univariate analysis was performed for each feature, retaining those with P < 0.05; 2. The development dataset was randomly partitioned into a training set (80%) and a test set (20%); 3. Feature dimensionality reduction was achieved using least absolute shrinkage and selection operator (LASSO) regression; 4. The retained features were used to construct the aforementioned ML models; 5. Model performance was evaluated in the internal validation set; 6. Model performance was evaluated in the external validation set. For each model, the optimal probability threshold was derived by maximizing the Youden index (J = sensitivity + specificity − 1) on the ROC curve in the development set, and this threshold was subsequently applied to the external validation set to calculate sensitivity and specificity. Univariate analysis was conducted using SPSS (v25.0, International Business Machines Corporation), while all other steps were implemented in Python (v3.12).
Statistical Analysis
Statistical analysis was performed using SPSS (v25.0, International Business Machines Corporation). For continuous variables, univariate analysis was conducted using either the independent t-test or Fisher’s exact test, depending on the variable type. Categorical variables were analyzed using the χ2 test for univariate analysis. Ordinal data were evaluated using the Mann–Whitney U-test for univariate comparisons. A two-tailed p-value <0.05 was considered statistically significant.
Results
Population Characteristic
The development set comprised 8699 patients with AAAs or ruptured AAAs, including 556 ruptured AAA cases. Among ruptured AAA patients, 431 were excluded due to the absence of pre-rupture aortic CTA images, 9 were excluded because their pre-rupture CTA images were confirmed to depict already ruptured aneurysms, and 79 were excluded due to unavailable pre-rupture aortic CTA images. Consequently, 37 ruptured AAA patients were ultimately included. The non-ruptured group initially consisted of 8143 patients, of whom 6964 were excluded due to unavailable aortic CTA images. After propensity score matching with the ruptured AAA group to control for baseline confounders, 155 non-ruptured AAA patients were finally included (Figure 2). The external validation cohort included 15 patients: 6 with ruptured AAAs and 9 with non-ruptured AAA.
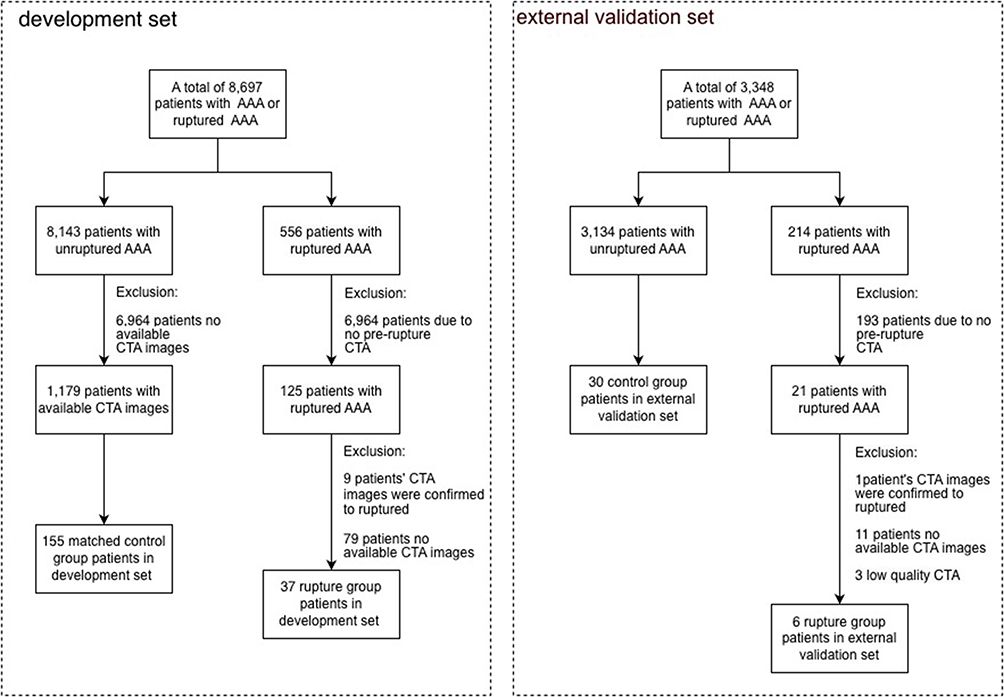 |
Figure 2 Patient Enrollment and Exclusion Flowchart. |
The ruptured AAA group consisted of 33 males and 4 females, with a mean aneurysm diameter of 68.96 ± 22.51 mm. The control group (non-ruptured AAA) included 145 males and 10 females, with a mean aneurysm diameter of 68.32 ± 12.85 mm. Partial medical history data were missing for some ruptured AAA patients due to emergency admissions. After excluding missing values, no statistically significant differences were observed in baseline characteristics between the two groups except for age (Table 1).
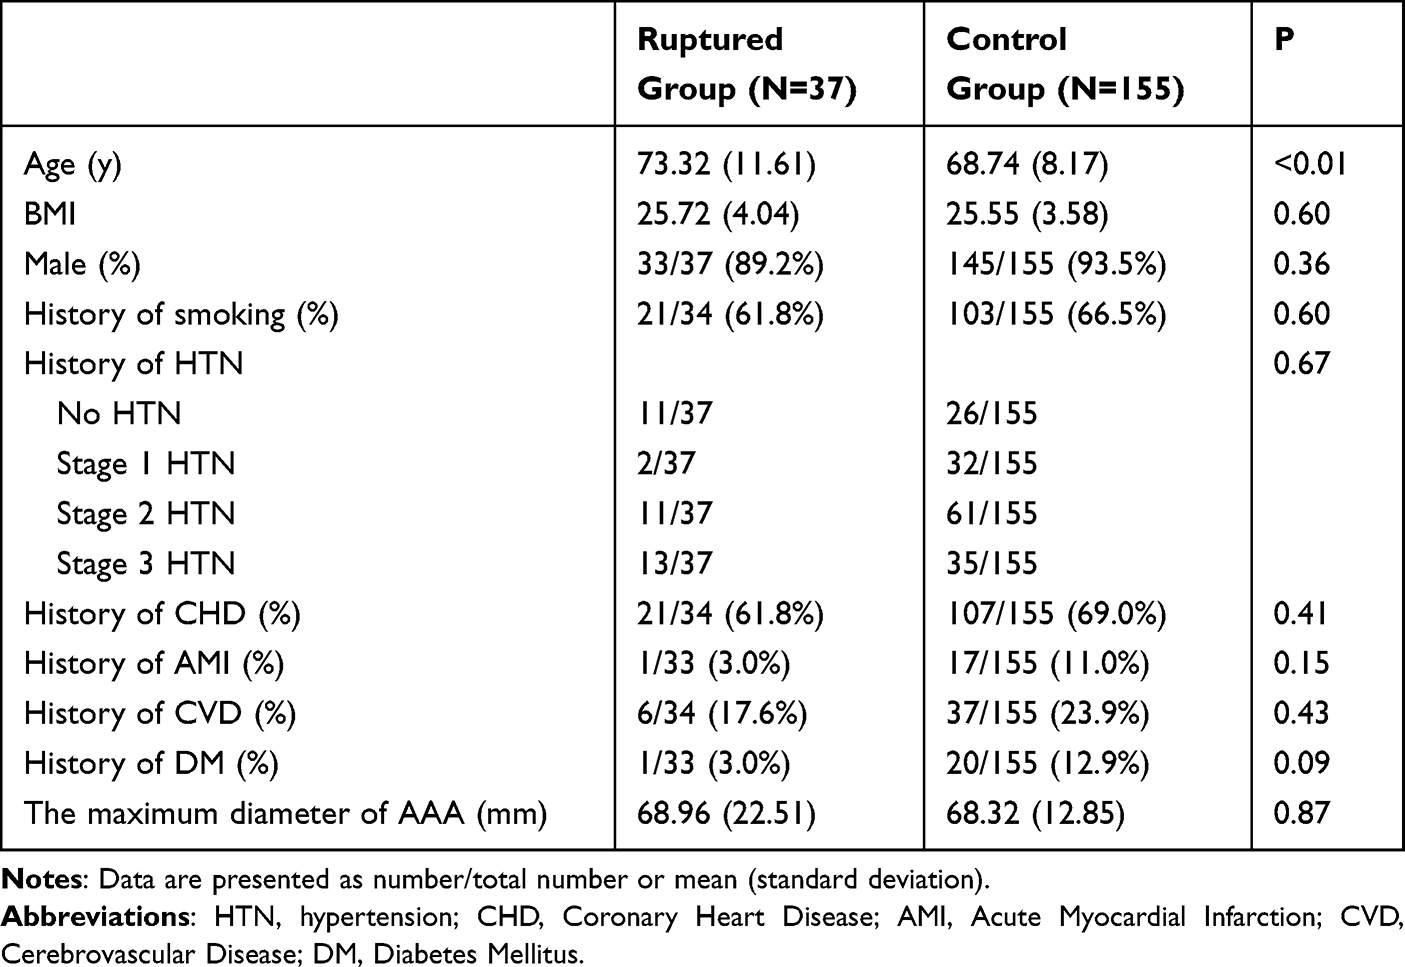 |
Table 1 Baseline Characteristics of Patients |
The mean interval between the completion time of examinations and May 1, 2025 was 1763.43 days for the unruptured group and 1477.58 days for the ruptured group. No statistically significant difference was observed between the two groups (Supplementary Table 1).
Differences in PVAT
A total of 107 radiomic features were extracted from each patient, among which 18 features demonstrated statistically significant differences between the two groups. These comprised 2 shape features, 5 histogram features, and 11 texture features. Table 2 presents the comparative analysis of shape and histogram features between groups, revealing statistically significant differences in the following parameters: Sphericity (0.13 vs 0.15, p=0.004), SurfaceVolumeRatio (0.96 vs 0.82, p=0.04), 10Percentile (−108.49 vs −117.74, p=0.004), 90Percentile (−13.08 vs −17.28, p<0.001), Mean (−61.68 vs −69.69, p<0.001), Median (−61.57 vs −70.99, p<0.001), RootMeanSquared (71.56 vs 79.15, p=0.001), Idmn, (0.98 vs 0.97, p=0.046), Idn (0.91 vs 0.90, p=0.032), LowGrayLevelEmphasis (0.03 vs 0.04, p=0.029), GrayLevelNonUniformityNormalized (0.20 vs 0.18, p=0.038), LongRunLowGrayLevelEmphasis (0.09 vs 0.11, p=0.013), LowGrayLevelRunEmphasis (0.03 vs 0.04, p=0.034), RunEntropy (3.63 vs 3.70, p=0.025), LowGrayLevelZoneEmphasis (0.06 vs 0.08, p=0.019), SizeZoneNonUniformityNormalized (0.36 vs 0.32, p<0.001), SmallAreaEmphasis (0.62 vs 0.59, p<0.001), ZoneEntropy (5.13 vs 5.39, p=0.001). The integrated radiomic features collectively indicate that the PVAT in the ruptured plaque group exhibits more irregular and complex morphology, with significantly higher overall grayscale intensity. Regarding textural heterogeneity, while the elevated global grayscale and reduced dark regions lead to increased homogeneity as reflected by certain metrics, the inherent non-uniformity of grayscale distribution and regional size heterogeneity are conversely enhanced. These findings suggest a transformation in the spatial complexity of PVAT’s internal architecture in response to pathological changes. Figure 3 displays the attenuation heatmaps of PVAT CT values in both groups.
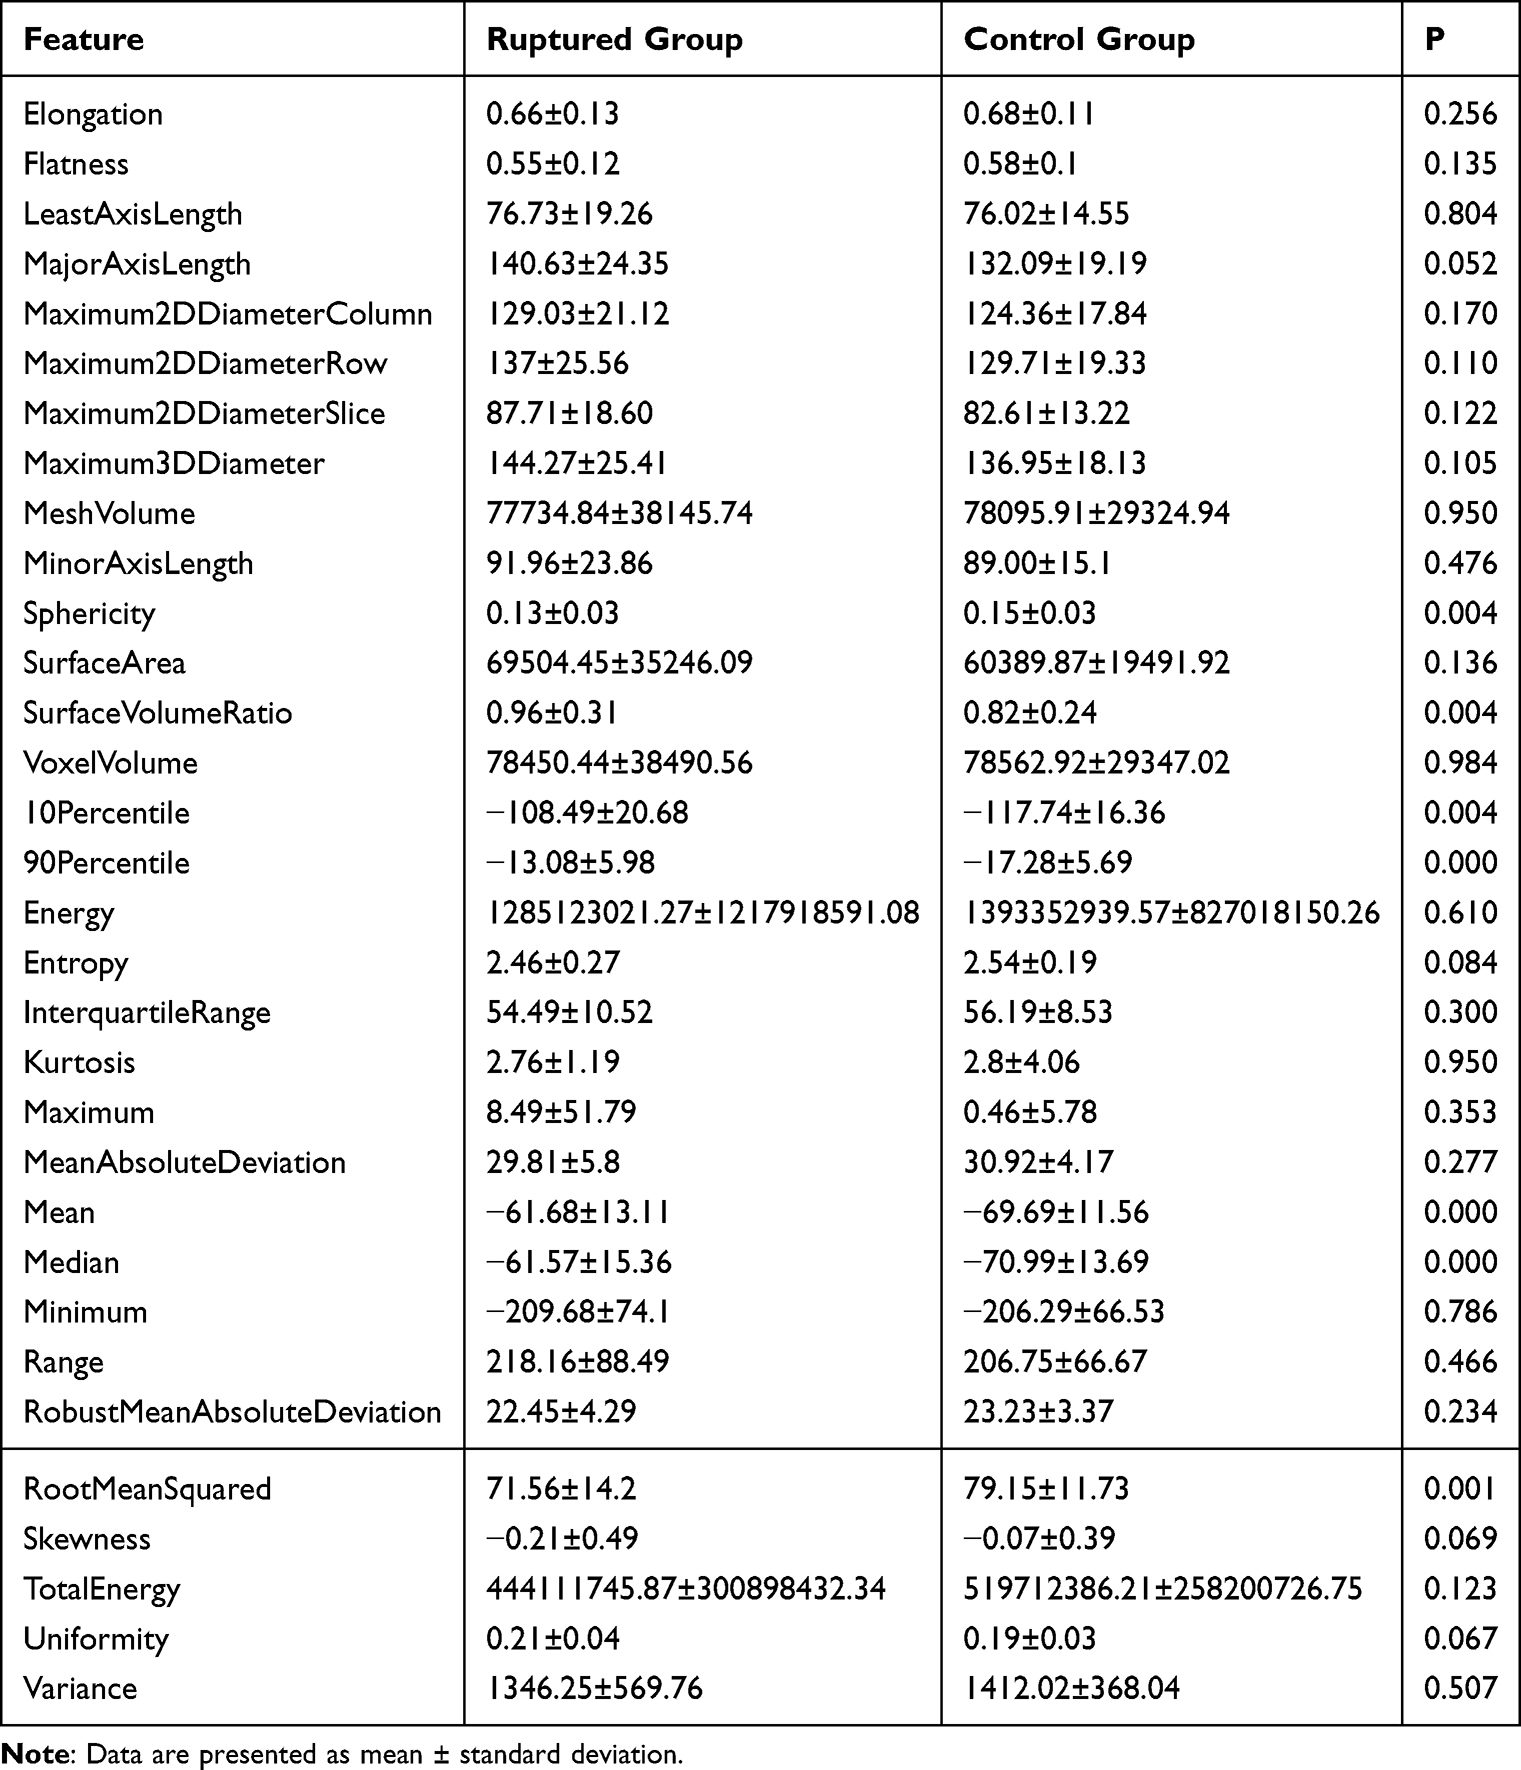 |
Table 2 Morphological and Histogram Features |
 |
Figure 3 Heatmaps of PVAT CT Attenuation Values in Both Groups. Notes: Patients with matched maximum AAA diameters were selected from both groups, and cross-sectional images at the level of maximal aneurysm diameter were obtained. (A) represents a representative patient from the control group, while (B) corresponds to a patient from the ruptured group. In the color bar, lighter shades indicate higher CT values, whereas darker regions correspond to lower CT values. |
Prediction of AAA Rupture with PVAT
Using a fixed random seed, patients were randomly divided into a training set (80%, 153/192) and an internal test set (20%, 39/192). LASSO regression was performed on radiomic features that had previously demonstrated statistically significant differences. Figure 4 presents the results of the LASSO regression, with the optimal α value identified as 0.0215. Ultimately, five representative radiomic features were selected (Figure 5).
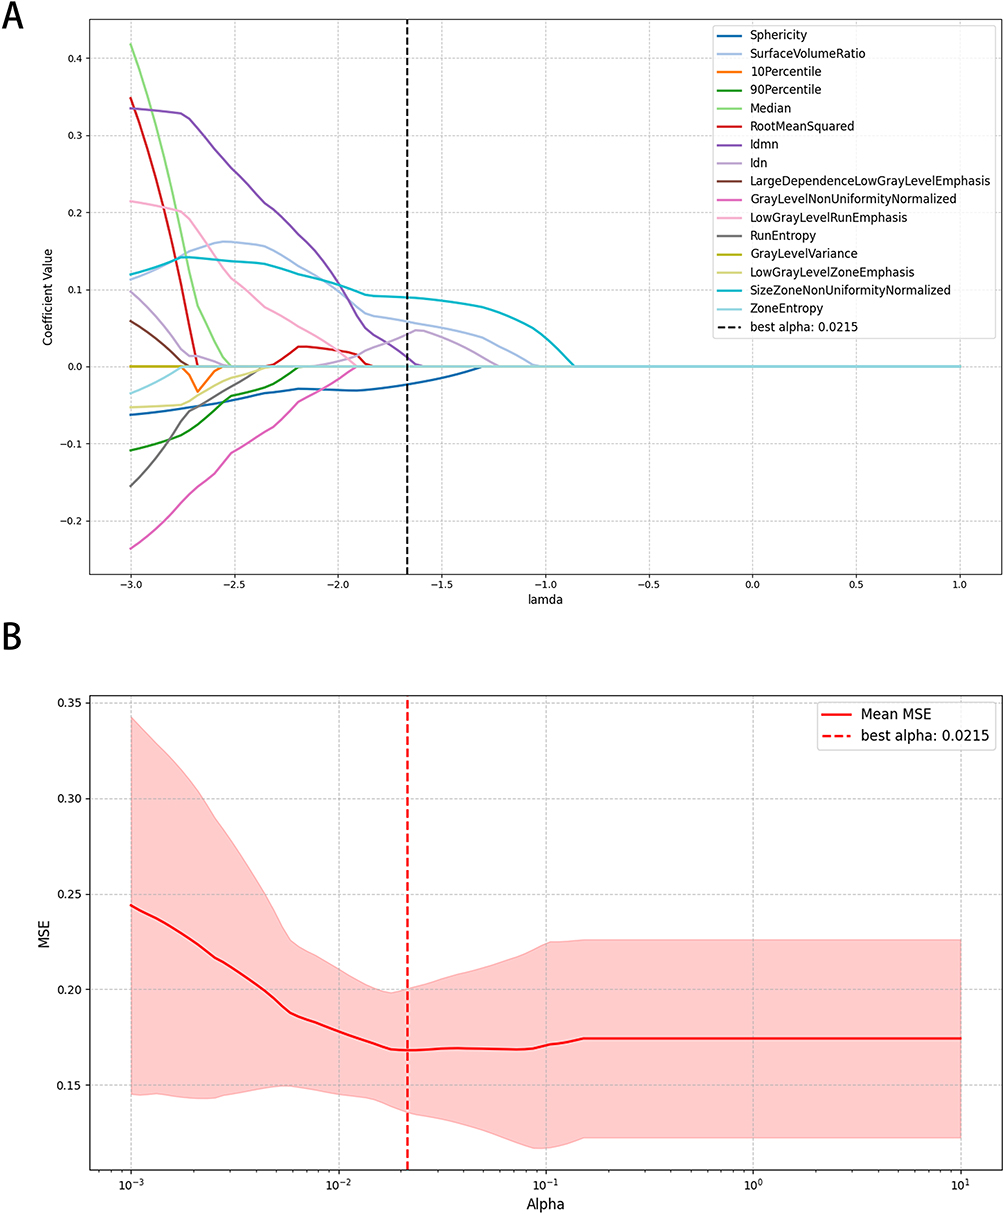 |
Figure 4 Results of LASSO Regression. Notes: (A) Cross-validation curve; the curve balances prediction error and model sparsity to determine the optimal regularization strength (λ). The red line represents the mean squared error (MSE), the light red shaded area indicates the standard deviation, and the black dashed line denotes the optimal λ value. (B) Coefficient path plot; this plot visualizes the trajectory of feature coefficient changes across varying regularization strengths (λ), elucidating feature importance, selection process, and correlations. As shown in (A and B), the minimum MSE was achieved when λ = 0.0215. |
 |
Figure 5 Retained Features. Notes: When α=0.0215, the MSE reached its minimum value, at which point 5 representative radiomic features were retained. |
Based on these five representative features, 10 common ML models were constructed for the prediction of AAA rupture. The average AUC of the models was 0.81. Among them, 6 models achieved AUC values greater than 0.8: k-Nearest Neighbors (KNN, AUC=0.91), Random Forest (RF, AUC=0.85), Bagging (BAG, AUC=0.84), Support Vector Machine (SVM, AUC=0.83), Gradient Boosting (GB, AUC=0.82), and Linear Discriminant Analysis (LDA, AUC=0.81). Other 4 models had AUC values between 0.7 and 0.8. Subsequently, the models were validated in an external test set, yielding an average AUC of 0.77. The AUC curves for each model in the internal and external validation sets are shown in Figure 6. Among these, 3 models achieved AUC values greater than 0.8 (LAD, AUC=0.88; Logistic Regression [LR], AUC=0.88; adaptive boosting [AB], AUC=0.81), while 6 models had AUC values between 0.7 and 0.8 (RF, AUC=0.79; Gaussian Naive Bayes [GNB], AUC=0.79; SVM, AUC=0.75; Quadratic discriminant analysis [QDA], AUC=0.77; BAG, AUC=0.70). A comparison of model performance between the internal and external validation sets is illustrated in Figure 7.
 |
Figure 6 ROC curve. Abbreviations: LR, Logistic Regression; AB, AdaBoost; BAG, Bagging; GB, XGBoost; GNB, GaussianNB; KNN, k-Nearest Neighbors; LDA, Latent Dirichlet Allocation; QDA, quadratic discriminant analysis; RF, Random Forest; SVM, support vector machine. Notes: (A) ROC curves of each model in the internal validation set; (B) ROC curves of each model in the external validation set. |
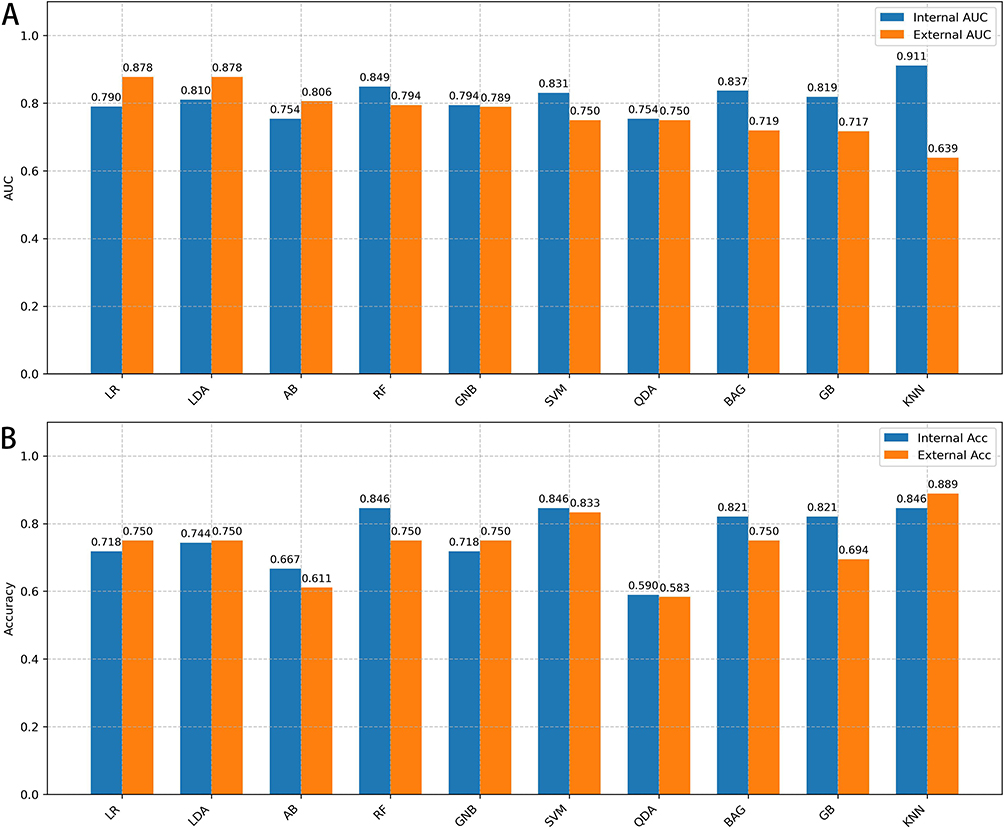 |
Figure 7 Performance comparison of different models on internal and external test sets. Notes: (A) Comparison of AUC values across models. (B) Comparison of accuracy across models. Models are ranked by their AUC values in the external test set. |
We obtained the optimal probability threshold for each model and accuracy (ACC), sensitivity (SEN), specificity (SPE) at threshold points in internal test set and external test set (Table 3). Across the internal test set, non-linear models such as RF, SVM and KNN achieved the highest accuracies (ACC = 0.85–0.87) with consistently high specificities (SPE = 0.84–0.87), whereas QDA obtained the highest sensitivity (SEN = 1.00) at the expense of markedly reduced specificity (SPE = 0.48) and overall accuracy (ACC = 0.59). In contrast, LR, LDA and GNB showed more moderate but well-balanced internal performance (ACC = 0.72–0.74, SEN = 0.88, SPE = 0.68–0.71). On external validation, KNN yielded the highest overall accuracy (ACC = 0.89) and specificity (SPE = 0.97), although its sensitivity was only moderate (SEN = 0.50), while SVM maintained similarly high specificity (SPE = 0.97) but with a pronounced drop in sensitivity (SEN = 0.17), indicating substantial under-detection of positive cases. AB and QDA provided the highest sensitivities on the external test set (SEN = 1.00 and 0.83, respectively), but with relatively low specificities (SPE = 0.53) and accuracies (ACC = 0.61 and 0.58). LR, LDA and GNB exhibited the most balanced external performance (ACC = 0.75 with SEN = 0.67 and SPE = 0.77 for all three models), suggesting comparatively better generalizability. RF, BAG and GB demonstrated intermediate external accuracies (ACC = 0.69–0.75), characterized by preserved specificity (SPE = 0.70–0.83) but reduced sensitivity (SEN = 0.33–0.67).
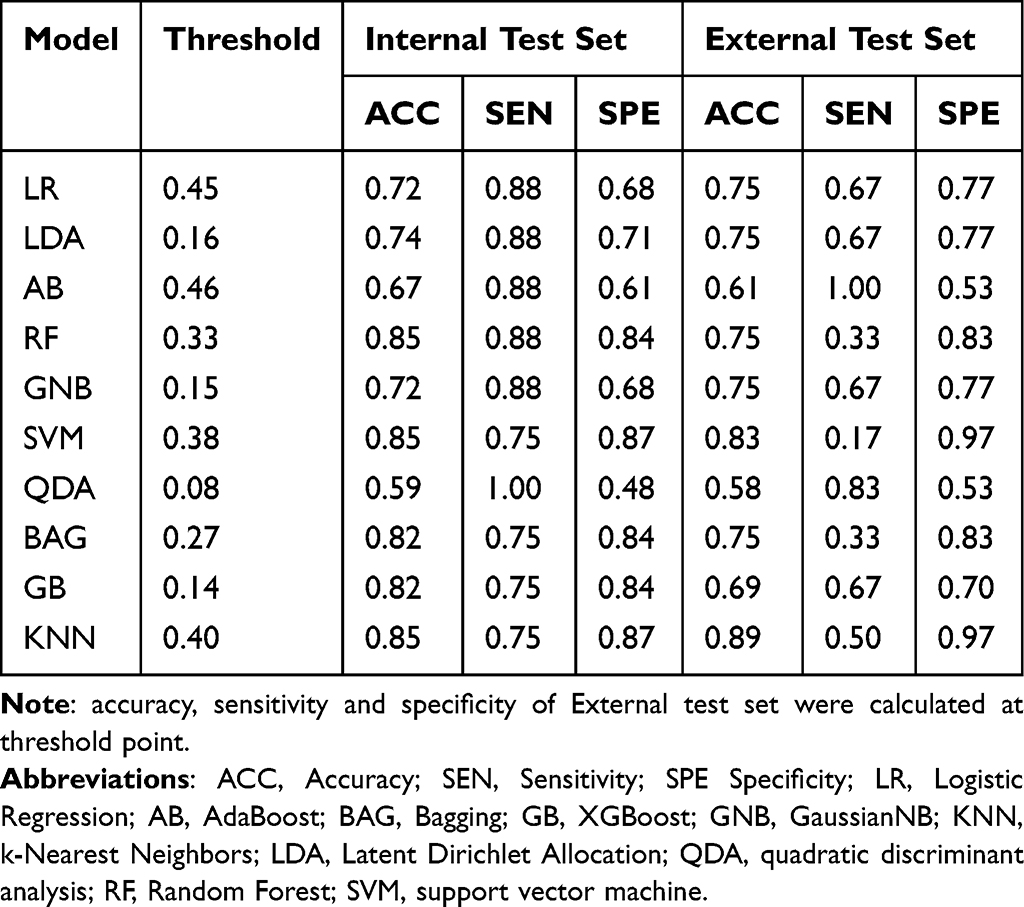 |
Table 3 Model Performance |
Subgroups Analysis of Age Differences
Since the two groups differed significantly in age, this variable was incorporated into the model together with the radiomics features selected by LASSO regression. All other parameters remained consistent with those previously described. The performance of all models declined to varying degrees, yielding an average accuracy of 0.69 and an average AUC of 0.69 in the internal test set. Comparisons of the models’ AUC values are shown in Supplementary Figure 1.
Discussion
In this study, radiomic features of PVAT were extracted from pre-rupture CTA images of ruptured AAA patients and compared with CTA images from stable AAA patients. Multiple machine learning models were developed and validated using an external multicenter dataset. Radiomic analysis revealed that the rupture group exhibited larger PVAT volume, more irregular shape, higher density, and lower internal heterogeneity compared to the control group. 10 machine learning models were constructed for AAA rupture prediction. The mean AUC in the internal validation set were 0.81, while the external validation set yielded mean values of 0.77. All models showed at least moderate discriminative ability. Considering all metrics, LR is the best-performing model which achieved relatively stable and balanced diagnostic performance (ACC 0.75, SEN 0.67, SPE 0.77) while maintaining high discriminative ability (external validation AUC 0.88).
This retrospective multicenter study enrolled 237 patients (43 rupture cases, 194 controls). Due to the insidious nature of AAA and low occurrence rate of rupture, pre-rupture CTA images—which document critical morphological characteristics—are scarce. Ruptured AAA patients often lack symptoms or routine imaging follow-up before rupture, and emergency conditions further complicate data collection. Prior studies have been limited by small sample sizes. A total of 91 patients with ruptured AAA were included in the study by Claire van der Riet et al.15 The number of eligible cases based on CTA imaging of ruptured abdominal aortic aneurysms was even more limited. For instance, Gale et al16 included only 19 cases of ruptured AAA, while Yohsuke Makino et al similarly enrolled 19 ruptured AAA patients.17 Our cohort included both surveillance-detected ruptures and emergency admissions with “AAA rupture” diagnoses, enhancing model generalizability. In the control group, all patients met the surgical criteria for AAA diameter (mean diameter 68.32 mm ± 12.85 mm), and they were subjected to surgical treatment after admission. Therefore, the exact duration of abdominal aortic aneurysm stability could not be determined. In the absence of symptoms such as abdominal pain or diarrhea at admission, we operationally classified these aneurysms as stable.
Age disparity was observed (rupture group: 73.32 years vs control: 68.74 years), likely reflecting AAA’s degenerative pathophysiology. In this study, this variable was incorporated into the model together with the radiomics features. It turned out that age decreased performance of all models. Age is a recognized risk factor for AAA, and its incidence rises with advancing age.18,19 The most commonly used predictor of AAA rupture is the maximum diameter of the aneurysm, and AAA growth rate, female sex, smoking, and high blood pressure are also independently and significantly associated with AAA rupture risk.19–21 Whether age constitutes a risk factor for AAA rupture remains unclear. Given this uncertainty and performance decline, the between-group age difference in our cohort may be interpreted as a potential confounder rather than a causal driver of rupture.
PVAT has been increasingly recognized not merely as a supportive structure, but also as an active modulator of vascular function through paracrine and endocrine mechanisms.22 Under physiological conditions, PVAT exerts vasodilatory, antioxidant, and anti-inflammatory effects.7 In pathologic states, PVAT undergoes phenotypic switching: increased immune cell infiltration, micro‑neovascularization, fibrotic remodeling of adipose tissue, adipocyte hypertrophy/atrophy, and increased connective‑tissue infiltration.23 Dysfunctional PVAT contributes to cardiovascular diseases; for instance, BMP4 knock-out in PVAT accelerates atherosclerosis.24 Histologically, the PVAT surrounding AAA exhibits necrotic adipocytes and sterile inflammatory infiltration.25 This pathologically altered adipose tissue, characterized by necrosis and inflammation, may contribute to the sustained vascular injury process by acting on the adjacent aneurysmal aortic wall.25 A CT‑based study found that in aneurysm patients, PVAT close to the aortic wall had higher attenuation compared with distant fat, interpreted as a marker of perivascular inflammation.14 In our rupture group we observed higher grayscale intensity of PVAT, which likely corresponds to increased density caused by inflammatory cell infiltration, edema and fibrosis in the PVAT depot adjacent to the vessel wall.7,26,27 The irregular morphology suggests focal remodeling of the PVAT, perhaps adipocyte loss and inflammatory infiltration, marking advanced perivascular degeneration.25 Increased internal heterogeneity may indicate heterogeneous local perivascular microenvironments reflecting ongoing dynamic remodeling.28 Together, these features may identify lesions where the perivascular environment is in a late‐stage, destabilized state, contributing to wall weakening and eventual rupture.
Conversely, PVAT is influenced by vascular status, making it a viable biomarker.8,29,30 Current research on the diagnostic and prognostic utility of PVAT as a biomarker has primarily focused on coronary artery disease. For instance, Evangelos K. Oikonomou et al utilized CTA to assess vascular fat attenuation for predicting the risk of cardiac mortality.31 Regarding studies on PVAT in AAA, Rui Lv et al demonstrated its potential in predicting post-endovascular aneurysm repair aneurysm expansion.11
Radiomic differences suggest rupture-associated PVAT undergoes browning (brown adipose-like phenotypic changes), potentially mitigating inflammation.32 This phenotypic shift may explain the observed imaging disparities. Radiomics quantifies pixel/voxel data to extract features (eg, shape, texture, intensity) for predictive modeling, uncovering disease heterogeneity imperceptible to visual assessment.33,34 Currently, CTA serves as the primary imaging modality for constructing AAA rupture prediction models. CTA provides comprehensive data on aneurysm morphology, intraluminal thrombus characteristics, and spatial relationships with adjacent structures. Multiple studies have utilized abdominal aortic CTA to develop AAA rupture prediction models. For instance, Mohamed Mansouri et al established a prediction model incorporating aneurysm morphology and spatial distribution patterns of calcification, achieving an AUC of 0.81.35 Similarly, Ying Wang et al developed seven distinct AAA rupture prediction models based on radiomic features combined with aneurysm and lumen area change rates, among which the highest C-index reached 0.760.36 Our radiomics model achieved an average AUC value of 0.80 in the internal test set, with the best-performing model reaching 0.90. In the external test set, the average AUC value was 0.66, while the top-performing model attained 0.85. From a clinical perspective, the main trade-off lies between avoiding missed high-risk patients and preventing unnecessary interventions in low-risk patients. In our cohort, AB and QDA achieved very high sensitivities on the external test set (up to 1.00) at Youden-based thresholds, meaning that almost all ruptured AAA cases would be flagged as high-risk, but this was accompanied by relatively low specificities and accuracies, implying that a considerable proportion of clinically stable patients would be overclassified as high-risk. Such models may be more suitable for early warning or triage scenarios, where the priority is not to miss any patient at imminent risk and additional imaging or closer follow-up is acceptable However, CTA requires iodinated contrast agents, posing a risk of contrast-induced nephropathy, particularly in patients with renal insufficiency. In this study, PVAT was utilized to construct an AAA rupture prediction model. Notably, PVAT evaluation itself does not require contrast agents, suggesting that non-contrast CT may still hold predictive value for AAA rupture. Furthermore, MRI exhibits higher sensitivity than CT for fat detection. Future studies will further refine this model by incorporating non-contrast CT or MRI-based PVAT assessments.
There are some limitations in our study: 1) Retrospective nature and limited sample size may have influenced the stability of the performance estimates, and the validation results should therefore be interpreted with some caution; 2) Manual PVAT segmentation may introduce subjectivity; 3) The CTA examinations in this study spanned a period of 12 years. Variations in scanning equipment, imaging protocols, and clinical practices across different time periods may introduce temporal heterogeneity and potential bias.
Pre-rupture PVAT exhibits distinct radiomic features in AAA patients. CTA-based PVAT machine learning models show promise for rupture risk stratification, warranting further prospective evaluation.
Conclusion
In conclusion, this study demonstrates that PVAT radiomic features can effectively distinguish ruptured from non-ruptured AAAs and support pre-rupture risk prediction. Compared with controls, PVAT of the ruptured group exhibited more irregular morphology, higher attenuation, and altered textural heterogeneity, reflecting increased spatial complexity. Machine learning models built on PVAT features achieved good discrimination, with average AUC of 0.81 in the internal test set and 0.77 in the external cohort, and several models showing relatively balanced sensitivity and specificity and thus better generalizability. Incorporating age into the models led to a uniform decline in performance, suggesting that PVAT radiomics alone already captures much of the rupture-related information. These findings support PVAT-based radiomics as a promising imaging biomarker for AAA rupture risk stratification, warranting validation in larger prospective studies.
Data Sharing Statement
The data that support the findings of this study are available from the corresponding author, upon reasonable request.
Ethics
Approval was obtained from the ethics committee of Beijing Anzhen Hospital (No. 2025156x) and the need for informed consent was waived. In accordance with the regulations of the Ethics Committee of Beijing Anzhen Hospital, this study was exempt from obtaining patients’ informed consent for the review of their medical records. The waiver of consent was granted due to the retrospective nature of this study, which involved only the extraction and analysis of anonymized data, did not interfere with patient care, and posed no more than minimal risk to the patients. We affirm that all patient data were strictly de-identified and that adequate security measures were implemented throughout the study to ensure data confidentiality. The procedures used in this study adhere to the tenets of the Declaration of Helsinki.
Funding
This work was jointly funded by the National Natural Science Foundation of China (Grant No. 82271610, 81870340) and the Beijing Natural Science Foundation (Grant No. L256073). The funders had no role in study design or data interpretation.
Disclosure
The authors declare that they have no known competing financial interests or personal relationships that could have appeared to influence the work reported in this paper.
References
1. Sakalihasan N, Limet R, Defawe OD. Abdominal aortic aneurysm. Lancet Lond Engl. 2005;365(9470):1577–14. doi:10.1016/S0140-6736(05)66459-8
2. Schmitz-Rixen T, Keese M, Hakimi M, Peters A, Böckler D, Nelson K, Grundmann RT. Ruptured abdominal aortic aneurysm-epidemiology, predisposing factors, and biology. Langenbecks Arch Surg. 2016;401(3):275–288. doi:10.1007/s00423-016-1401-8
3. Dias-Neto M, Meekel JP, van Schaik TG, et al. High density of periaortic adipose tissue in abdominal aortic aneurysm. Eur J Vasc Endovasc Surg off J Eur Soc Vasc Surg. 2018;56(5):663–671. doi:10.1016/j.ejvs.2018.07.008
4. Bengs S, Haider A, Warnock GI, et al. Quantification of perivascular inflammation does not provide incremental prognostic value over myocardial perfusion imaging and calcium scoring. Eur J Nucl Med Mol Imaging. 2021;48(6):1806–1812. doi:10.1007/s00259-020-05106-0
5. Oikonomou EK, Desai MY, Marwan M, et al. Perivascular fat attenuation index stratifies cardiac risk associated with high-risk plaques in the CRISP-CT study. J Am Coll Cardiol. 2020;76(6):755–757. doi:10.1016/j.jacc.2020.05.078
6. Stepien KL, Bajdak-Rusinek K, Fus-Kujawa A, Kuczmik W, Gawron K. Role of extracellular matrix and inflammation in abdominal aortic aneurysm. Int J Mol Sci. 2022;23(19):11078. doi:10.3390/ijms231911078
7. Kim HW, Shi H, Winkler MA, Lee R, Weintraub NL. Perivascular adipose tissue and vascular perturbation/atherosclerosis. Arterioscler Thromb Vasc Biol. 2020;40(11):2569–2576. doi:10.1161/ATVBAHA.120.312470
8. Margaritis M, Antonopoulos AS, Digby J, et al. Interactions between vascular wall and perivascular adipose tissue reveal novel roles for adiponectin in the regulation of endothelial nitric oxide synthase function in human vessels. Circulation. 2013;127(22):2209–2221. doi:10.1161/CIRCULATIONAHA.112.001133
9. Tomaszewski MR, Gillies RJ. The biological meaning of radiomic features. Radiology. 2021;298(3):505–516. doi:10.1148/radiol.2021202553
10. Mayerhoefer ME, Materka A, Langs G, et al. Introduction to radiomics. J Nucl Med off Publ Soc Nucl Med. 2020;61(4):488–495. doi:10.2967/jnumed.118.222893
11. Lv R, Hu G, Zhang S, et al. Assessing abdominal aortic aneurysm growth using radiomic features of perivascular adipose tissue after endovascular repair. Insights Imag. 2024;15(1):232. doi:10.1186/s13244-024-01804-7
12. Fedorov A, Beichel R, Kalpathy-Cramer J, et al. 3D slicer as an image computing platform for the quantitative imaging network. Magn Reson Imaging. 2012;30(9):1323–1341. doi:10.1016/j.mri.2012.05.001
13. Hu G, Ding N, Wang Z, Jin Z. Unenhanced computed tomography radiomics help detect endoleaks after endovascular repair of abdominal aortic aneurysm. Eur Radiol. 2024;34(3):1647–1658. doi:10.1007/s00330-023-10000-y
14. Ginzburg D, Nowak S, Attenberger U, Luetkens J, Sprinkart AM, Kuetting D. Computer tomography-based assessment of perivascular adipose tissue in patients with abdominal aortic aneurysms. Sci Rep. 2024;14(1):20512. doi:10.1038/s41598-024-71283-9
15. van der Riet C, Schuurmann RCL, Karelis A, et al. Supra- and infra-renal aortic neck diameter increase after endovascular repair of a ruptured abdominal aortic aneurysm. J Clin Med. 2022;11(5):1203. doi:10.3390/jcm11051203
16. Gale ME, Johnson WC, Gerzof SG, Robbins AH. Problems in CT diagnosis of ruptured abdominal aortic aneurysms. J Comput Assist Tomogr. 1986;10(4):637–641. doi:10.1097/00004728-198607000-00018
17. Makino Y, Yamamoto S, Shiotani S, et al. Can ruptured abdominal aortic aneurysm be accurately diagnosed as the cause of death without postmortem computed tomography when autopsies cannot be performed? Forensic Sci Int. 2015;249:107–111. doi:10.1016/j.forsciint.2015.01.022
18. Nordon IM, Hinchliffe RJ, Loftus IM, Thompson MM. Pathophysiology and epidemiology of abdominal aortic aneurysms. Nat Rev Cardiol. 2011;8(2):92–102. doi:10.1038/nrcardio.2010.180
19. Vardulaki KA, Walker NM, Day NE, Duffy SW, Ashton HA, Scott RA. Quantifying the risks of hypertension, age, sex and smoking in patients with abdominal aortic aneurysm. Br J Surg. 2000;87(2):195–200. doi:10.1046/j.1365-2168.2000.01353.x
20. Brown LC, Powell JT. Risk factors for aneurysm rupture in patients kept under ultrasound surveillance. UK small aneurysm trial participants. Ann Surg. 1999;230(3):289–296. discussion 296-297. doi:10.1097/00000658-199909000-00002
21. Powell JT, Brown LC, Greenhalgh RM, Thompson SG. The rupture rate of large abdominal aortic aneurysms: is this modified by anatomical suitability for endovascular repair? Ann Surg. 2008;247(1):173–179. doi:10.1097/SLA.0b013e3181557d2a
22. Szasz T, Bomfim GF, Webb RC. The influence of perivascular adipose tissue on vascular homeostasis. Vasc Health Risk Manag. 2013;9:105–116. doi:10.2147/VHRM.S33760
23. Meekel JP, Dias-Neto M, Bogunovic N, et al. Inflammatory gene expression of human perivascular adipose tissue in abdominal aortic aneurysms. Eur J Vasc Endovasc Surg off J Eur Soc Vasc Surg. 2021;61(6):1008–1016. doi:10.1016/j.ejvs.2021.02.034
24. Mu W, Qian S, Song Y, et al. BMP4-mediated browning of perivascular adipose tissue governs an anti-inflammatory program and prevents atherosclerosis. Redox Biol. 2021;43:101979. doi:10.1016/j.redox.2021.101979
25. Folkesson M, Vorkapic E, Gulbins E, et al. Inflammatory cells, ceramides, and expression of proteases in perivascular adipose tissue adjacent to human abdominal aortic aneurysms. J Vasc Surg. 2017;65(4):1171–1179.e1. doi:10.1016/j.jvs.2015.12.056
26. Sun K, Park J, Gupta OT, et al. Endotrophin triggers adipose tissue fibrosis and metabolic dysfunction. Nat Commun. 2014;5(1):3485. doi:10.1038/ncomms4485
27. Miao CY, Li ZY. The role of perivascular adipose tissue in vascular smooth muscle cell growth. Br J Pharmacol. 2012;165(3):643–658. doi:10.1111/j.1476-5381.2011.01404.x
28. Niculescu R, Stoian A, Arbănași EM, et al. The dual role of perivascular adipose tissue in vascular homeostasis and atherogenesis: from physiology to pathological implications. Int J Mol Sci. 2025;26(17):8320. doi:10.3390/ijms26178320
29. Antonopoulos AS, Margaritis M, Verheule S, et al. Mutual regulation of epicardial adipose tissue and myocardial redox state by PPAR-γ/adiponectin signalling. Circ Res. 2016;118(5):842–855. doi:10.1161/CIRCRESAHA.115.307856
30. Antonopoulos AS, Margaritis M, Coutinho P, et al. Adiponectin as a link between type 2 diabetes and vascular NADPH oxidase activity in the human arterial wall: the regulatory role of perivascular adipose tissue. Diabetes. 2015;64(6):2207–2219. doi:10.2337/db14-1011
31. Oikonomou EK, Marwan M, Desai MY, et al. Non-invasive detection of coronary inflammation using computed tomography and prediction of residual cardiovascular risk (the CRISP CT study): a post-hoc analysis of prospective outcome data. Lancet Lond Engl. 2018;392(10151):929–939. doi:10.1016/S0140-6736(18)31114-0
32. Adachi Y, Ueda K, Nomura S, et al. Beiging of perivascular adipose tissue regulates its inflammation and vascular remodeling. Nat Commun. 2022;13(1):5117. doi:10.1038/s41467-022-32658-6
33. Horvat N, Papanikolaou N, Koh DM. Radiomics beyond the hype: a critical evaluation toward oncologic clinical use. Radiol Artif Intell. 2024;6(4):e230437. doi:10.1148/ryai.230437
34. Qi YJ, Su GH, You C, et al. Radiomics in breast cancer: current advances and future directions. Cell Rep Med. 2024;5(9):101719. doi:10.1016/j.xcrm.2024.101719
35. Mansouri M, Therasse E, Montagnon E, et al. CT analysis of aortic calcifications to predict abdominal aortic aneurysm rupture. Eur Radiol. 2024;34(6):3903–3911. doi:10.1007/s00330-023-10429-1
36. Wang Y, Liu F, Wu S, Sun K, Gu H, Wang X. CTA-based radiomics and area change rate predict infrarenal abdominal aortic aneurysms patients events: a multicenter study. Acad Radiol. 2024;31(8):3165–3176. doi:10.1016/j.acra.2024.01.017
 © 2026 The Author(s). This work is published and licensed by Dove Medical Press Limited. The
full terms of this license are available at https://www.dovepress.com/terms
and incorporate the Creative Commons Attribution
- Non Commercial (unported, 4.0) License.
By accessing the work you hereby accept the Terms. Non-commercial uses of the work are permitted
without any further permission from Dove Medical Press Limited, provided the work is properly
attributed. For permission for commercial use of this work, please see paragraphs 4.2 and 5 of our Terms.
© 2026 The Author(s). This work is published and licensed by Dove Medical Press Limited. The
full terms of this license are available at https://www.dovepress.com/terms
and incorporate the Creative Commons Attribution
- Non Commercial (unported, 4.0) License.
By accessing the work you hereby accept the Terms. Non-commercial uses of the work are permitted
without any further permission from Dove Medical Press Limited, provided the work is properly
attributed. For permission for commercial use of this work, please see paragraphs 4.2 and 5 of our Terms.