Back to Journals » International Journal of Chronic Obstructive Pulmonary Disease » Volume 14
Peripheral blood CD4+ T cell populations by CD25 and Foxp3 expression as a potential biomarker: reflecting inflammatory activity in chronic obstructive pulmonary disease
Authors Meng ZJ ![]() , Wu JH, Zhou M, Sun SW, Miao SY, Han HL, Chen L, Xiong XZ
, Wu JH, Zhou M, Sun SW, Miao SY, Han HL, Chen L, Xiong XZ ![]()
Received 16 March 2019
Accepted for publication 25 June 2019
Published 30 July 2019 Volume 2019:14 Pages 1669—1680
DOI https://doi.org/10.2147/COPD.S208977
Checked for plagiarism Yes
Review by Single anonymous peer review
Peer reviewer comments 2
Editor who approved publication: Dr Chunxue Bai
Zhao-Ji Meng,* Jiang-Hua Wu,* Mei Zhou, Sheng-Wen Sun, Shuai-Ying Miao, Hong-Li Han, Long Chen, Xian-Zhi Xiong
Department of Respiratory and Critical Care Medicine, Union Hospital, Tongji Medical College, Huazhong University of Science and Technology, Wuhan 430022, People’s Republic of China
*These authors contributed equally to this work
Background: The temporally dynamic changes of CD25 and Foxp3 expression in CD4+ T cells are initiated by T cell receptor (TCR) signals strength or frequency. There is a deficiency of peripheral markers for assessing COPD activity, and the current study was conducted to explore whether peripheral CD4+ T cell populations based on CD25 and Foxp3 expression could serve as an indicator for COPD inflammatory activity.
Methods: The distribution and phenotypic characteristics of CD4+CD25±Foxp3± T cells from peripheral blood in different populations were determined by flow cytometry. The model for the differentiation of CD4+ T cells populations by CD25 and Foxp3 expression was explored in vitro.
Results: The frequencies of peripheral CD4+CD25+Foxp3− T cells and CD4+CD25+Foxp3+ T cells were increased in AECOPD patients, whereas the frequency of CD4+CD25−Foxp3+ T cells was increased in SCOPD patients without receiving systemic treatment. Phenotypic analysis revealed that CD4+CD25+Foxp3− T cells, CD4+CD25+Foxp3+ T cells and CD4+CD25−Foxp3+ T cells had received antigenic stimulation and resembled central memory or effector memory T cells. The differentiation of CD4+ T cells populations by CD25 and Foxp3 expression was dictated by TCR signals. The paired study indicated that the frequencies of CD4+CD25+Foxp3− T cells, CD4+CD25+Foxp3+ T cells and CD4+CD25− Foxp3+ T cells were decreased while the frequency of CD4+CD25−Foxp3− T cells were increased in the same patients from AECOPD to convalescence.
Conclusions: Collectively, we propose that the dynamic changes of CD4+ T cell populations by CD25 and Foxp3 expression could function as potential biomarkers for reflecting inflammatory activity in COPD.
Keywords: COPD, CD4+ T cell subsets, inflammation, peripheral biomarkers
Introduction
Chronic obstructive pulmonary disease (COPD) is a multidimensional disease that involves the initiation, progression, and consolidation of inflammation in the airways, parenchyma and pulmonary vasculature.1 Patients with COPD are vulnerable to exacerbations, defined as episodes of increasing respiratory symptoms that are usually associated with increased airway inflammation and systemic inflammatory effects.2 COPD exacerbations are mainly triggered by bacteria, viruses or environmental agents. Frequent exacerbations accelerate the processes of progression and consolidation, resulting in the deterioration of pulmonary function and the increasing risk of mortality in patients with COPD.3,4 Therefore, early and timely detection of the pathogenic process of COPD will be of great significance in the management of patients with COPD.
The inflammation in the lungs of patients with COPD is associated with inappropriate immune activation, especially of the adaptive immune system.5,6 There is an increase in the numbers of lymphocytes in both sputum and airway biopsies of patients with COPD.7,8 Inflammation in the lung results in an “overspill” into the circulation, causing systemic inflammation.9 There are few universally-accepted circulating biomarkers for the activation status in peripheral blood. Activation of T cells via T cell receptor (TCR) stimulation leads to widespread alterations in cell cycle, metabolism and protein expression. CD25 and Foxp3 are transiently up-regulated in human CD4+CD25− T cells in vitro after TCR stimulation,10,11 suggesting that CD25 and Foxp3 expression are not specific for regulatory T cells (Tregs) and may sometimes be only a consequence of the activation status. The dynamic changes of CD25 and Foxp3 expression have been also shown in an in vivo model in which the CD25+Foxp3− population occurs in the earliest time after receiving TCR signals, the CD25−Foxp3+ subset is enriched with Foxp3+ cells after the aborted TCR signaling, and CD25+Foxp3+ T cells differentiation is induced by persistent TCR signals.12 Our recent study first found that peripheral CD4+CD25−Foxp3+ T cells were significantly increased in stable COPD patients (SCOPD), and CD4+CD25+Foxp3+ T cells could transdifferentiate into CD4+CD25−Foxp3+ T cells via the influence of TGFβ1 following the aborted TCR signaling in vitro.13 Hence, we speculate that peripheral CD4+ T cell populations by CD25 and Foxp3 expression may hold potential as peripheral biomarkers to identify the inflammatory activity or the therapeutic effects by analyzing their temporally dynamic changes in COPD patients.
To verify this hypothesis, we further explored the distributions and phenotypes of CD4+ T cell populations by CD25 and Foxp3 expression in different populations and then investigated paired samples from the same patients both at the onset of acute exacerbation of COPD (AECOPD) and during the stable state. Our results show that dynamic changes of CD25 and Foxp3 expression in CD4+ T cells occurred in the different phases of COPD, and provide evidence supporting CD4+ T cell populations by CD25 and Foxp3 expression as a potential biomarker to predict the disease activity and clinical efficacy of treatments.
Methods
Study design and subjects
This is largely a pilot study. The recently published cohort including 22 never-smokers with normal lung function, 18 asymptomatic smokers with normal lung function, 28 SCOPD patients and 24 AECOPD patients was reanalyzed; the clinical characteristics of subjects have been presented in detail previously.13 Another cohort including 18 AECOPD patients were designed and further studied in the paired population (Table 1). All patients with SCOPD were initially diagnosed and had not received any systemic treatment including anticholinergics and glucocorticoids within 4 weeks prior to the study. Patients with AECOPD were diagnosed at the initiation of exacerbated COPD symptoms, which required hospitalization within the previous 72 h without any new therapeutic intervention. After admission to hospital, AECOPD patients received the standardized treatment regimen including (but not limited to) a corticosteroid, a long-acting β2 agonist, a long-acting muscarinic antagonist, antibiotics, and oxygen therapy. Management of stable (non-exacerbating) disease was followed by COPD guidelines. Patients were considered stable in the absence of worsening of respiratory symptoms associated with an exacerbation at least 1 month after hospital discharge. Subjects with malignant tumors, diabetes, coronary heart disease, allergic and rheumatologic diseases or other immune-related diseases were excluded. This study was conducted in accordance with the Declaration of Helsinki, and was approved by the Ethics Committee of Union Hospital, Tongji Medical College, Huazhong University of Science and Technology (#2013/S048). Written informed consent was obtained from all participants.
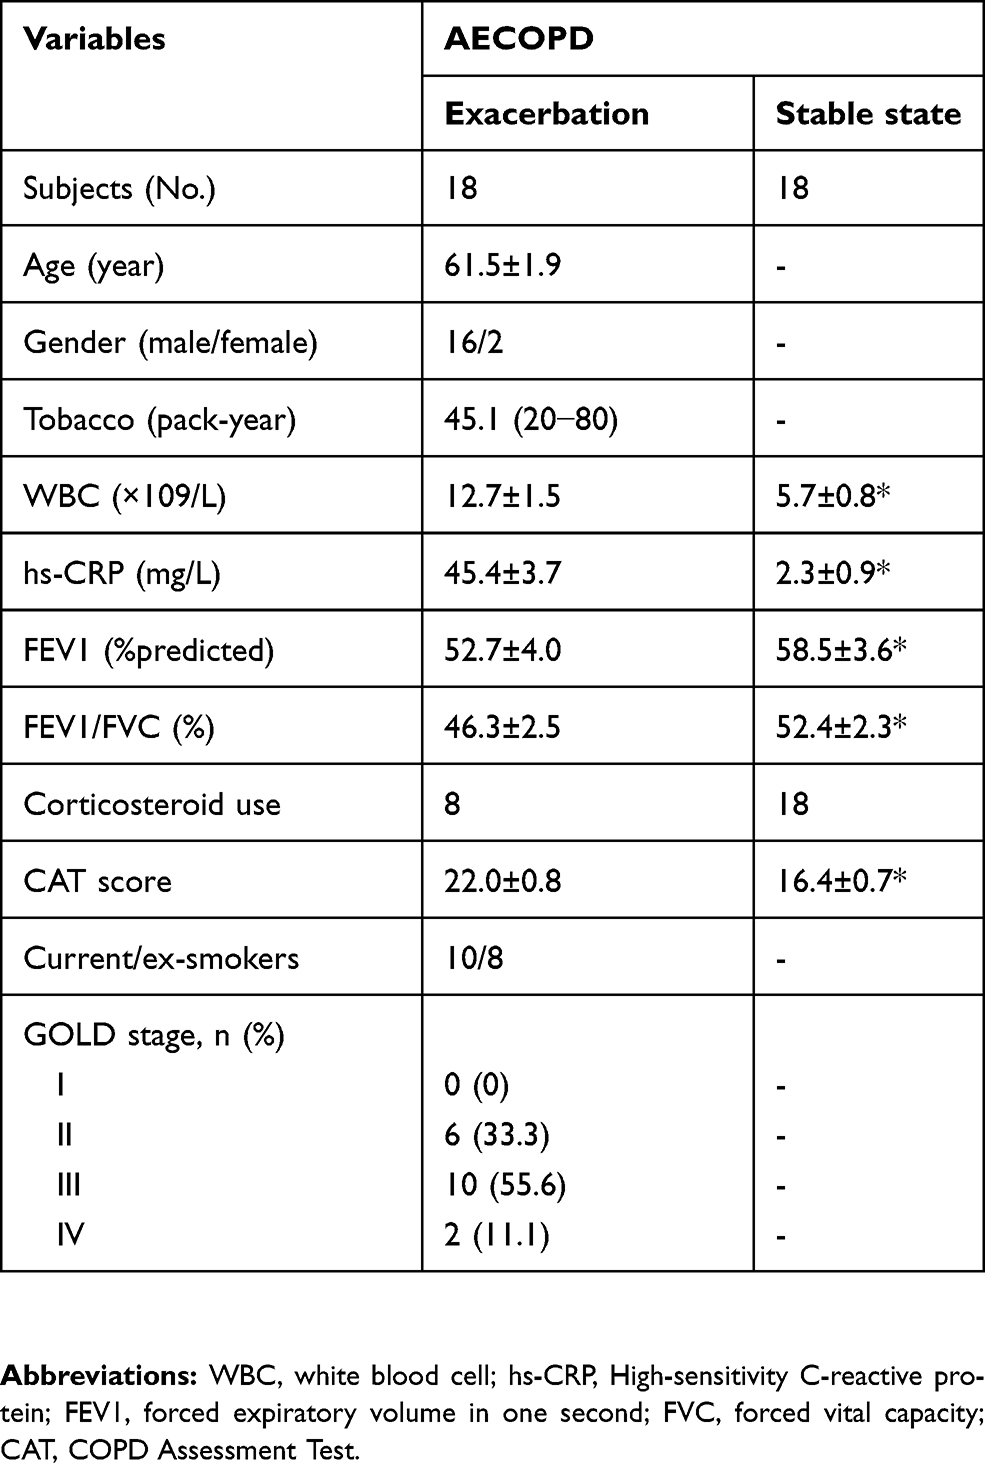 |
Table 1 Characteristics of participants |
Sample collection and processing
Peripheral blood samples were collected in heparin-treated tubes from each subject and, within 1 h, used for peripheral blood mononuclear cell (PBMC) isolation from never-smokers with normal lung function, asymptomatic smokers with normal lung function, SCOPD patients and AECOPD patients. Each blood sample was immediately placed on ice. PBMC were isolated from heparinized blood by Ficoll-Hypaque gradient centrifugation (Pharmacia, Uppsala, Sweden) to determine T cell subsets and purify subsets of CD4+ T cells.
Cell isolation
Naive CD4+ T cells from PBMC were isolated by negative selection with a naive CD4+ T cell isolation kit (Miltenyi Biotec, Bergisch-Gladbach, Germany), according to the manufacturer’s instructions. The purity of cells was ≥97%, as measured by flow cytometry.
Activation of naïve CD4+ T cells in vitro
Purified naive CD4+ T cells (5×10⁵) were cultured in 1 mL RPMI 1640 medium containing 10% fetal bovine serum (FBS) in 48-well plates and stimulated with plate-bound anti-CD3 (OKT3; 5 μg/mL; eBioscience, USA) and soluble anti-CD28 mAb (5 μg/mL; eBioscience) in the presence of IL-2 (5 ng/mL; PeproTech, USA) for 7 days; during culture, mix the cells with the pipette 10 times every two days. To observe CD25 and Foxp3 expression, cells were harvested every other day and subsequently labeled with the corresponding mAbs conjugated with fluorescent molecules.
Flow cytometry
The expression of surface markers and the intracellular molecules by T cells were determined using flow cytometry. Cells were stained with the following antibodies: anti-CD4-FITC (clone: RPA-T4), anti-CD25-PE-Cy7 (clone: M-A251), anti-CD45RA-APC (clone: HI100), anti-CD45RO-BV421 (clone: UCHL1), anti-CD62L-BV510 (clone: DREG-56), anti-CD69-BV421 (clone: FN50), anti-CD95-BV421 (clone: DX2), and anti-Foxp3-PE (clone: 236A/E7), which were purchased from BD Biosciences or eBioscience. After fixation and permeabilization (eBioscience), intracellular protein was labeled with the corresponding mAb conjugated with fluorescent molecules, according to the manufacturer’s instructions. Flow cytometry was performed on a BD LSRFortessa X-20 and analyzed with FlowJo V10 software.
Statistics
The Shapiro-Wilk test was used to evaluate the distribution of variance. For data distributed normally, comparisons between different groups were analyzed by either two-tailed paired t-test or one-way analysis of variance (ANOVA) followed by Bonferroni`s multiple comparisons test. The Wilcoxon signed-rank test or a Kruskal-Wallis one-way ANOVA on ranks was used to compare data with a non-normal Distribution. Data are expressed as the mean ± SEM (unless indicated in the figure legends). Preliminary receiver operating characteristic curves were drawn, and areas under the curves (AUCs) were calculated to determine the capacity of peripheral CD4+ T cell subsets to differentiate the activity of COPD. The optimum cut-off values were defined based on their maximum Youden index (sensitivity+specificity−1). All statistical data were analyzed using SPSS version 16.0 Statistical Software (Chicago, IL, USA), and p<0.05 was considered statistically significant.
Results
Proportions of peripheral CD4+CD25±Foxp3± T cells in different populations
We first investigated the differences in the frequencies of CD4+CD25−Foxp3− T cells, CD4+CD25+Foxp3− T cells, CD4+ CD25+Foxp3+ T cells and CD4+CD25−Foxp3+ T cells in different populations. Our previous study has revealed that the frequency of peripheral CD4+CD25+Foxp3+ T cells were increased in AECOPD patients in comparison to never-smokers with normal lung function, asymptomatic smokers with normal lung function and patients with SCOPD, whereas the frequency of peripheral CD4+CD25−Foxp3+ T cells was increased in SCOPD patients.13 Next, we further explored the frequencies of CD4+CD25−Foxp3− T cells and CD4+CD25+Foxp3− T cells in these populations. Similarly, we found that the frequency of CD4+CD25+Foxp3− T cells was significantly elevated in AECOPD patients; however, the frequency of CD4+ CD25−Foxp3− T cells in AECOPD patients was much lower than in never-smokers with normal lung function, asymptomatic smokers with normal lung function and patients with SCOPD (Figure 1A–C). These data suggested that the dynamic changes of CD4+ T cell populations by CD25 and Foxp3 expression might hold potential as peripheral biomarkers to identify the inflammatory activity in COPD patients.
 |
Figure 1 Frequencies of circulating CD4+CD25±Foxp3± T cells in different populations. Lymphocytes were gated on FSC-A versus SSC-A plots, and CD4+ T cells were identified based on their expression of CD4. (A) Representative flow cytometric dot plots of CD4+CD25−Foxp3− T cells, CD4+CD25+Foxp3− T cells, CD4+CD25+Foxp3+ T cells and CD4+CD25−Foxp3+ T cells within CD4+ T cells in healthy subjects (HC), asymptomatic smokers with normal lung function (HS), patients with stable COPD (SCOPD) and patients with acute exacerbation of COPD (AECOPD). Comparisons of CD4+CD25−Foxp3− T cells (B) and CD4+CD25+Foxp3− T cells (C) percentages in peripheral blood from HC (n=22), HS (18), SCOPD (n=28) and AECOPD (n=24) patients. Horizontal bars indicate means ± SEM. *p<0.05, **p<0.01, ***p<0.001.Abbreviation: NS, not significant. |
Phenotypes of peripheral CD4+CD25±Foxp3± T cells in COPD patients
Based on the Treg cell differentiation models,12 we next investigated the phenotypic characteristics of peripheral CD4+ CD25±Foxp3± T cells through reanalyzing the expression profiles of CD45RA, CD45RO, CD62L, CD69 and CD95. High levels of CD45RO and CD95, but not of CD45RA, were detected in CD4+CD25+Foxp3− T cells, CD4+CD25+Foxp3+ T cells and CD4+ CD25−Foxp3+ T cells in peripheral blood from SCOPD patients (Figure 2A-D), indicating that these cells had ever encountered antigenic stimulation and belonged to memory T cells. In addition, peripheral CD4+CD25+Foxp3− T cells exhibited a higher expression of CD69 (9.2±1.1%) than did CD4+CD25−Foxp3− T cells (3.4±0.5%), CD4+CD25+Foxp3+ T cells (6.9±0.8%) and CD4+CD25−Foxp3+ T cells (3.8±0.5%), suggesting that CD4+CD25+Foxp3− T cells represented potential recently activated T cells (Figure 2E). Furthermore, CD4+CD25−Foxp3+ T cells (65.6±5.0%) had a lower expression of CD62L compared to CD4+CD25−Foxp3− T cells (74.7±3.1%), CD4+CD25+Foxp3− T cells (74.4±2.4%) and CD4+CD25+Foxp3+ T cells (86.0±1.7%), indicating that CD4+CD25−Foxp3+ T cells gradually stepped into the stage of effector memory T cells following the aborted TCR signaling or less sustained TCR signals (Figure 2F). Thus, these data suggested that the frequencies of CD4+ T cell populations by CD25 and Foxp3 expression might fluctuate following the TCR signaling dynamics in COPD patients.
 |
Figure 2 Phenotypic characteristics of CD4+CD25±Foxp3± T cells. (A) Peripheral CD4+CD25+Foxp3− T cells within CD4+ T cells were identified on the basis of their expression of CD25 and not of Foxp3. (B-F) Comparisons of the percentages of CD45RA+, CD45RO+, CD62L+, CD69+, CD95+ cells in peripheral CD4+CD25−Foxp3− T cells, CD4+CD25+Foxp3− T cells, CD4+CD25+Foxp3+ T cells and CD4+CD25−Foxp3+ T cells from SCOPD patients (n=10). Horizontal bars indicate the means ± SEM. *p<0.05, **p<0.01, ***p<0.001.Abbreviation: NS, not significant. |
Validation of CD4+CD25±Foxp3± T cells differentiation models
Next, we determined the differentiation of CD4+ T cell populations by CD25 and Foxp3 expression in vitro. Naive CD4+ T cells were purified from peripheral blood of SCOPD patients and stimulated with plate-bound anti-CD3 and soluble anti-CD28 mAb. We observed that CD25 and Foxp3 were gradually upregulated in naive CD4+ T cells 7 days following the activation (Figure 3A), which are in agreement with previous studies demonstrating that their expressions are only a consequence of the activation status in virtually all activated T-cells.10,11 Interestingly, CD25 was expressed more rapidly than Foxp3, suggesting that CD4+CD25+Foxp3− T cells represent early activated T cells after encountering antigen stimulation (Figure 3A and B). Our study further supported the CD4+CD25±Foxp3± T cells differentiation models proposed by Bending.12 In combination with our recent study that CD4+CD25+Foxp3+ T cells could transdifferentiate into CD4+CD25−Foxp3+ T cells via the influence of TGFβ1 following the aborted TCR signaling in vitro,13 we supplemented this differentiation model (Figure 3C).
 |
Figure 3 Model for the differentiation of CD4+ T cells populations by CD25 and Foxp3 expression. (A) Representative dot plots detecting the expression of CD25 and Foxp3 in total cells after naive CD4+ T cells from COPD patients were stimulated with plate-bound anti-CD3 and soluble anti-CD28 mAb in the presence of IL-2 for 7 days. (B) Line graph of changes in the percentages of CD4+CD25+ T cells and CD4+Foxp3+ T cells over time. Data are presented as the mean ± SEM of 5 independent experiments; *p<0.05 compared with CD4+Foxp3+ T cells control at the same time point. (C) Model for the dynamic differentiation of CD4+ T cells populations by CD25 and Foxp3 expression following the TCR signaling dynamics.Abbreviations: TCR, T cell receptor; DC, Dendritic cell. |
CD4+CD25±Foxp3± T cells can reflect inflammatory activity in COPD
We further asked whether these cells were an effective marker to evaluate disease activity in COPD patients. We recruited 18 AECOPD patients and measured the frequencies of CD4+ T cell populations by CD25 and Foxp3 expression during the first 24 h of hospitalization, which were investigated again in the stable state. After receiving the standardized treatment regimen, substantial improvements were observed in respiratory symptoms and pulmonary function in COPD patients (Table 1). Simultaneously, we observed that the frequencies of CD4+CD25+Foxp3+ T cells and CD4+CD25+Foxp3− T cells and CD4+CD25−Foxp3+ T cells were decreased, whereas the frequency of CD4+CD25−Foxp3− T cells were increased in the same patients from AECOPD to convalescence (Figure 4A and B). Next, we made receiver operating characteristic curve analyses to assess the capacity of CD4+ T cell populations by CD25 and Foxp3 expression to differentiate the activity of COPD. The cut-off values (sensitivity and specificity) of CD4+CD25−Foxp3− T cells, CD4+CD25+Foxp3− T cells, CD4+CD25+Foxp3+ T cells and CD4+CD25−Foxp3+ T cells were 64.4% (94.4% and 66.7%), 16.2% (61.1% and 66.7%), 9.15% (88.9% and 77.8%) and 7.1% (55.6% and 77.8%), respectively; by contrast, CD4+CD25−Foxp3− T cells and CD4+CD25+Foxp3+ T cells have higher value than the other two subsets (Figure 4C). Together, we come to the preliminary conclusion that the dynamic changes of peripheral CD4+ T cell populations by CD25 and Foxp3 expression could reflect inflammatory activity in COPD to a certain extent.
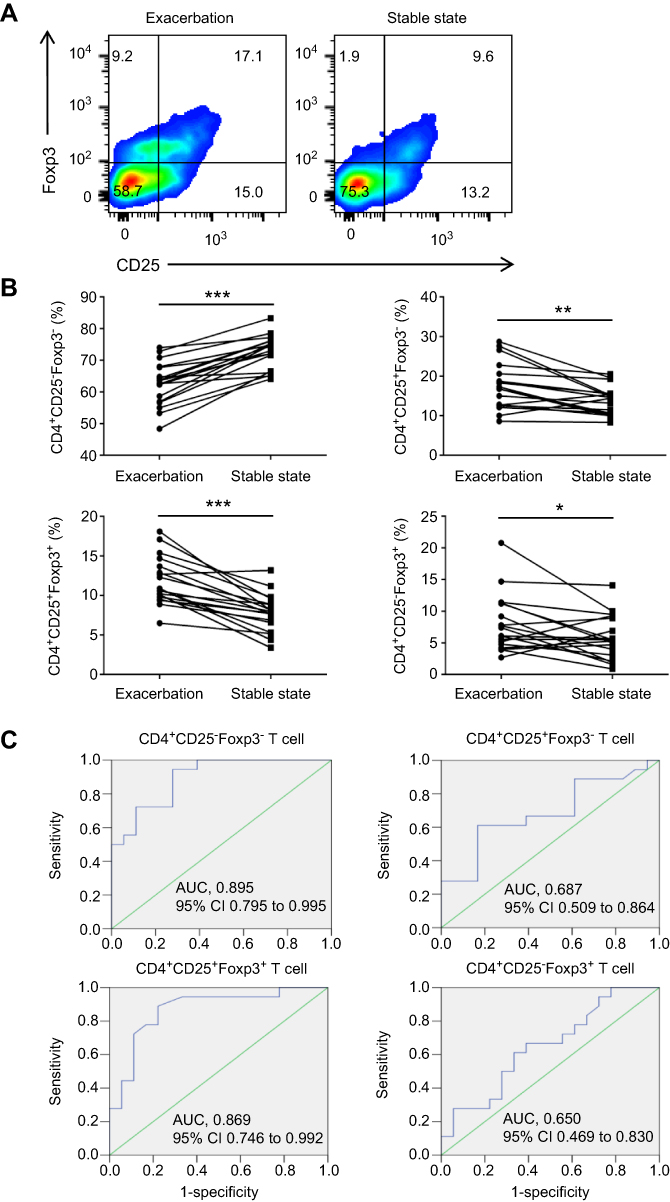 |
Figure 4 CD4+CD25±Foxp3± T cells reflect inflammatory activity in COPD. (A) Representative flow cytometric dot plots of CD4+CD25−Foxp3− T cells, CD4+CD25+Foxp3− T cells, CD4+ CD25+Foxp3+ T cells and CD4+CD25−Foxp3+ T cells within CD4+ T cells in the same patient both at the onset of AECOPD and during the stable state. (B) Comparisons of CD4+CD25−Foxp3− T cells, CD4+CD25+Foxp3− T cells, CD4+CD25+Foxp3+ T cells and CD4+CD25−Foxp3+ T cells percentages in peripheral blood from the same group of COPD patients (n=18). (C) Receiver operating characteristic curves of CD4+CD25−Foxp3− T cells, CD4+CD25+Foxp3− T cells, CD4+CD25+Foxp3+ T cells and CD4+CD25−Foxp3+ T cells for the assessment of COPD activity (n = 18). *p<0.05, **p<0.01, ***p<0.001. Abbreviation: AUC, area under curve. |
Discussion
COPD results from an aberrant inflammatory reaction of the lungs to cigarette smoke, pollutants, and infectious agents. Patients with more severe COPD are prone to frequent exacerbations. Reliable biomarkers are useful for predicting disease progression, disease instability and the response to current therapies in chronic inflammatory disease. In the present study, we observed dynamic changes in the percentages of CD4+ T cell populations by CD25 and Foxp3 expression in the different phases of COPD. Hence, we propose that peripheral CD4+ T cell populations by CD25 and Foxp3 expression can function as a potential biomarker for reflecting inflammatory activity and therapeutic effects in COPD.
To date, COPD is still diagnosed and treated according to the severity of airflow limitation, symptoms, and frequency of previous exacerbations, and not on the basis of underlying pathobiological mechanisms. Meanwhile, there is still debate about how exacerbations should be defined and graded, and their mechanisms are not totally understood. Clinically, patients with AECOPD were diagnosed at the initiation of exacerbated COPD symptoms. This situation greatly limits the implementation of a precision medicine strategy in COPD patients. Given the paucity of reliable peripheral biomarkers for disease activity, to a certain extent, the inflammatory response can be easily concealed by symptom tolerance in COPD patients. The GOLD classification can be used to discern groups of COPD patients, but due to the complexity and heterogeneity of the disease, this classification does not seem adequate as a basis for individual management plans in rehabilitation. An alternative to this conventional taxonomy would be a mechanism-based, unbiased approach that reflects the phenotypic heterogeneity and dynamic evolution of COPD.14 Celli argues that analogous to the definitions used for the different acute events in the course of coronary artery disease (CAD), the acute events of the course of COPD can be classified into three different stages: unstable COPD, exacerbation and respiratory failure.15 Considering that the disease may become more unstable and that symptoms worsen over a certain period of time, it is important to identify biomarkers of disease activity or surrogate measurements that will predict patients at risk for or experiencing an exacerbation. Hence, rethinking the definition of COPD exacerbation from a biological point of view enables a mechanistic approach to disease stratification, thus advancing clinical practice towards precision medicine.
Currently, there is a deficiency of peripheral markers for assessing COPD activity. Vestbo et al use frequent exacerbations as an indicator of disease activity, particularly as a measure of exacerbation susceptibility.16 From a biological point of view, exacerbations essentially represent an increase in the inflammation that is present in the stable state, with increased numbers of inflammatory cells in the blood.2 COPD is associated with activation of circulating inflammatory cells and increased plasma levels of proinflammatory cytokines.17 Frequent exacerbations, whether caused by bacterium, viruses or autoantigens, contribute to the activation of T cells through TCR signaling pathway. In the present study, we observed significantly increased proportions of peripheral CD4+CD25+Foxp3− T cells and CD4+CD25+Foxp3+ T cells in patients with AECOPD, indicating that TCR triggering may result in CD25 and Foxp3 expression in T cells during exacerbation. Our phenotypic analysis revealed that CD4+CD25+Foxp3− T cells, CD4+CD25+Foxp3+ T cells and CD4+CD25−Foxp3+ T cells had ever received antigenic stimulation and resembled central memory or effector memory T cells. Interestingly, the frequency of CD4+CD25−Foxp3+ T cells was increased in SCOPD patients without receiving systemic treatment, indicating that CD4+CD25+Foxp3+ T cells might transdifferentiate into CD4+CD25−Foxp3+ T cells following the aborted TCR signaling.13 Moreover, the paired study indicated that the frequencies of CD4+CD25+Foxp3− T cells, CD4+CD25+Foxp3+ T cells and CD4+CD25−Foxp3+ T cells were decreased while the frequency of CD4+CD25−Foxp3− T cells were increased in the same patients from AECOPD to convalescence.
However, the detailed mechanism by which CD4+ T cell populations by CD25 and Foxp3 expression fluctuate in different phases of COPD is not completely known. There are several potential explanations for the phenomenon in our study. First, mature naive T cells show proliferation, cytokine production and expression of early activation markers such as CD25, Foxp3 and CD69 upon antigen encounter.13,18,19 We observed that the frequencies of CD4+CD25+Foxp3+ T cells and CD4+CD25+Foxp3− T cells were enriched for CD69+ T cells, suggesting that a portion of these cells were potential recently activated T cells in vivo. But we didn’t exclude the possibility that CD69 expression was induced by interferon expression during inflammatory settings.20,21 Second, all AECOPD patients received the standardized treatment regimen including (but not limited to) a corticosteroid, a long-acting β2 agonist, a long-acting muscarinic antagonist, antibiotics, and oxygen therapy. As potent anti-inflammatory and immunosuppressive agents, glucocorticoids are recommended in clinics for the treatment of patients with AECOPD.22 Mechanistically, glucocorticoids can promote the resolution of the inflammatory response through inhibiting lymphocyte activation and promoting lymphocyte apoptosis.23 Hence, it may also be the explanation that the increased frequency of CD4+CD25−Foxp3+ T cells did not occur in the same patients from AECOPD to convalescence due to the apoptosis of T cells caused by therapeutic intervention. Lastly, our study found that TGFβ1 could decrease CD25 expression on CD4+CD25+Foxp3+ T cells following the aborted TCR signaling in vitro.13
COPD is an inflammatory disease and, therefore, the dynamic evolution of CD4+ T cell populations by CD25 and foxp3 expression reflect the dynamic processes of inflammatory state in such illness. Exacerbations are usually triggered by environmental agents, infections or autoantigens. After receiving antigen stimulation, mature dendritic cells expressing high levels of class II major-histocompatibility-complex (MHC) proteins and some costimulatory molecules such as CD80 and CD86 migrated into local lymph nodes and presented antigens to T cells.24,25 TCR signals strength or frequency can influence effector T cell differentiation.26 Bending thought that the CD25−Foxp3+ subset is enriched with Foxp3+ cells that have received relatively weaker and/or less sustained TCR signals.12 Considering that a substantial proportion of patients with stable disease had bacterial colonisation in the lower airways, these patients had long-term exposure to chronic infection.27 When pathogenic microorganisms proliferation exceeds a certain clinical threshold, symptoms of acute exacerbation appear. These relatively weaker stimulation like smoking and chronic infection may be favorable to the occurrence of CD4+CD25−Foxp3+ T cells. Hence, the frequency of CD4+CD25−Foxp3+ T cells might reflect this special phase in COPD.
However, the role of CD4+CD25±Foxp3± T cells in immune regulation in COPD remains to be fully investigated. Tregs play a critical role in controlling inflammatory immune responses and effector T-cell function by secreting inhibitory cytokines, such as TGFβ1 and IL-10.28 Much attention has been given to CD4+CD25+Foxp3+ T cells for their role in the maintenance of immune homeostasis in COPD.29–31 The imbalance of Tregs subpopulations has reportedly involved in abnormal inflammatory immune responses in COPD.30,32 Human CD4+CD25+Foxp3+ Tregs include CD25++CD45RA− cytokine-secreting T cells with proinflammatory capacity, which lacks suppressive activity or has limited suppressive activity but can produce IL-17 and IFN-γ, resulting in T-cell activation and pulmonary inflammation in COPD patients.30,33 Our present study demonstrated that CD4+CD25−Foxp3+ T cells exhibited the features of activated conventional T cells and functionally exert an auxiliary effect on Th17 cells generation and might perpetuate chronic inflammation in COPD.13 Foxp3 expression occurs as a consequence of T-cell activation and meanwhile regulates the T-cell activation via negative feedback control.34 CD4+CD25+Foxp3+ T cells proliferate under the stimulation of inflammatory condition for governing the burst of inflammation during an acute exacerbation. Following the resolution of inflammation, a fraction of expanded CD4+CD25+ Foxp3+ T cells gradually dedifferentiate into CD4+CD25− T cells.
Limitations
Many limitations in our study need to be taken into consideration. First, our current study is the relatively small sample size of the study group. Second, we did not distinguish patients with infection and noninfection in AECOPD because all AECOPD patients recruited in our study recently had respiratory infection. Thus, whether our results are generalizable to other types of exacerbations caused by noninfectious factors needs further study. Moreover, we did not discuss any inner link between CD4+ T cell populations by CD25 and Foxp3 expression and other markers such as erythrocyte sedimentation rate (ESR), hemoglobin, CRP, D-dimer, proinflammatory cytokines and other blood cells. There is also the caveat that the changes in the percentage of CD4+ T cell populations by CD25 and Foxp3 expression may reflect a general effect of inflammatory activity, which may not be specific to COPD. For example, the frequency of CD4+CD25−Foxp3+ T cells in smokers without lung disease was much higher than in HC subjects, which might be associated with the fact that cigarette smoke extract-induced neutrophil extracellular traps drive plasmacytoid dendritic cell maturation and activation, initiating a T-cell-mediated immune response.35 Finally, a large-scale prospective cohort study needs to be designed to further validate CD4+ T cell populations by CD25 and Foxp3 expression as biomarkers of disease activity and their potential pathogenicity in COPD patients followed up longitudinally.
Conclusion
In conclusion, we first linked dynamic changes in the percentages of CD4+ T cell populations by CD25 and Foxp3 expression with inflammatory activity in COPD patients. While the full mechanism of CD4+ T cells during disease progression requires further investigation, particularly with regards to the underlying pathological processes in COPD, our findings establish a framework for the development of a novel biomarker for the progression of inflammation and disease activity. The use of CD4+ T cell populations by CD25 and Foxp3 expression might eventually affect the treatment of COPD and facilitate a more precise, effective, and safer management of patients with this disease in future clinical applications.
Acknowledgments
The authors thank Yi-Ting Xu, Zhen Yu and Pan-Pan Chang for their technical assistance. We thank Jointown Caritas Fund of Hubei Red Cross Foundation for their support of our research. This work was supported by the National Nature Science Foundation of China (No. 81570032; No. 81370146) and the Scientific Research Project of Health and Family Planning Commission of Hubei province (WJ2017M097). This work was also funded by Jointown Caritas Fund of Hubei Red Cross Foundation.
Disclosure
The authors report no conflicts of interest in relation to this work.
References
1. Tuder RM, Petrache I. Pathogenesis of chronic obstructive pulmonary disease. J Clin Invest. 2012;122(8):2749–2755. doi:10.1172/JCI60324
2. Celli BR, Barnes PJ. Exacerbations of chronic obstructive pulmonary disease. Eur Respir J. 2007;29(6):1224–1238. doi:10.1183/09031936.00109906
3. Donaldson GC, Seemungal TA, Bhowmik A, et al. Relationship between exacerbation frequency and lung function decline in chronic obstructive pulmonary disease. Thorax. 2002;57(10):847–852. doi:10.1136/thorax.57.10.847
4. Dransfield MT, Kunisaki KM, Strand MJ, et al. Acute exacerbations and lung function loss in smokers with and without chronic obstructive pulmonary disease. Am J Respir Crit Care Med. 2017;195(3):324–330. doi:10.1164/rccm.201605−1014OC
5. Curtis JL, Freeman CM, Hogg JC. The immunopathogenesis of chronic obstructive pulmonary disease: insights from recent research. Proc Am Thorac Soc. 2007;4(7):512–521. doi:10.1513/pats.200701−002FM
6. Freeman CM, Martinez CH, Todt JC, et al. Acute exacerbations of chronic obstructive pulmonary disease are associated with decreased CD4+ & CD8+ T cells and increased growth & differentiation factor−15 (GDF−15) in peripheral blood. Respir Res. 2015;16(1):94. doi:10.1186/s12931−015−0251−1
7. Sales DS, Ito JT, Zanchetta IA, et al. Regulatory T-Cell distribution within lung compartments in COPD. COPD. 2017;14(5):533–542. doi:10.1080/15412555.2017.1346069
8. Saetta M, Di Stefano A, Maestrelli P, et al. Activated T-lymphocytes and macrophages in bronchial mucosa of subjects with chronic bronchitis. Am Rev Respir Dis. 1993;147(2):301–306. doi:10.1164/ajrccm/147.2.301
9. Sinden NJ, Stockley RA. Systemic inflammation and comorbidity in COPD: a result of ‘overspill’ of inflammatory mediators from the lungs? Review of the evidence. Thorax. 2010;65(10):930–936. doi:10.1136/thx.2009.130260
10. Wang J, Ioan-Facsinay A, van der Voort EI, et al. Transient expression of FOXP3 in human activated nonregulatory CD4+ T cells. Eur J Immunol. 2007;37(1):129–138. doi:10.1002/eji.200636435
11. Pillai V, Ortega SB, Wang CK, et al. Transient regulatory T-cells: a state attained by all activated human T-cells. Clin Immunol. 2007;123(1):18–29. doi:10.1016/j.clim.2006.10.014
12. Bending D, Martin PP, Paduraru A, et al. A timer for analyzing temporally dynamic changes in transcription during differentiation in vivo. J Cell Biol. 2018;217(8):2931–2950. doi:10.1083/jcb.201711048
13. Wu JH, Zhou M, Jin Y, et al. Generation and immune regulation of CD4+CD25-Foxp3+ T cells in chronic obstructive pulmonary disease. Front Immunol. 2019;10:220. doi:10.3389/fimmu.2019.01365
14. Agustí A, Celli B, Faner R. What does endotyping mean for treatment in chronic obstructive pulmonary disease? Lancet. 2017;390(10098):980–987. doi:10.1016/S0140−6736(17)32136−0
15. Celli BR. Dissecting COPD exacerbations: time to rethink our definition. Eur Respir J. 2017;50(3):1701432. doi:10.1183/13993003.00711−2017
16. Vestbo J, Rennard S. Chronic obstructive pulmonary disease biomarker(s) for disease activity needed–urgently. Am J Respir Crit Care Med. 2010;182(7):863–864. doi:10.1164/rccm.201004−0602ED
17. Barnes PJ. Inflammatory mechanisms in patients with chronic obstructive pulmonary disease. J Allergy Clin Immunol. 2016;138(1):16–27. doi:10.1016/j.jaci.2016.05.011
18. van Den Broek T, Borghans JAM, van Wijk F. The full spectrum of human naive T cells. Nat Rev Immunol. 2018;18(6):363–373. doi:10.1038/s41577−018−0001-y
19. Friesen TJ, Ji Q, Fink PJ. Recent thymic emigrants are tolerized in the absence of inflammation. J Exp Med. 2016;213(6):913–920. doi:10.1084/jem.20151990
20. Sun S, Zhang X, Tough DF, et al. Type I interferon-mediated stimulation of T cells by CpG DNA. J Exp Med. 1998;188(12):2335–2342. doi:10.1084/jem.188.12.2335
21. Shiow LR, Rosen DB, Brdickova N, et al. CD69 acts downstream of interferon-alpha/beta to inhibit S1P1 and lymphocyte egress from lymphoid organs. Nature. 2006;440(7083):540–544. doi:10.1038/nature04606
22. Leuppi JD, Schuetz P, Bingisser R, et al. Short-term vs conventional glucocorticoid therapy in acute exacerbations of chronic obstructive pulmonary disease: the REDUCE randomized clinical trial. JAMA. 2013;309(21):2223–2231. doi:10.1001/jama.2013.5023
23. Cain DW, Cidlowski JA. Immune regulation by glucocorticoids. Nat Rev Immunol. 2017;17(4):233–247. doi:10.1038/nri.2017.1
24. Lambrecht BN, Prins JB, Hoogsteden HC. Lung dendritic cells and host immunity to infection. Eur Respir J. 2001;18(4):692–704.
25. McWilliam AS, Napoli S, Marsh AM, et al. Dendritic cells are recruited into the airway epithelium during the inflammatory response to a broad spectrum of stimuli. J Exp Med. 1996;184(6):2429–2432. doi:10.1084/jem.184.6.2429
26. Tubo NJ, Jenkins MK. TCR signal quantity and quality in CD4(+) T cell differentiation. Trends Immunol. 2014;35(12):591–596. doi:10.1016/j.it.2014.09.008
27. Sethi S, Murphy TF. Infection in the pathogenesis and course of chronic obstructive pulmonary disease. N Engl J Med. 2008;359(22):2355–2365. doi:10.1056/NEJMra0800353
28. Miyara M, Sakaguchi S. Natural regulatory T cells: mechanisms of suppression. Trends Mol Med. 2007;13(3):108–116. doi:10.1016/j.molmed.2007.01.003
29. Kalathil SG, Lugade AA, Pradhan V, et al. T-regulatory cells and programmed death 1+ T cells contribute to effector T-cell dysfunction in patients with chronic obstructive pulmonary disease. Am J Respir Crit Care Med. 2014;190(1):40–50. doi:10.1164/rccm.201312−2293OC
30. Hou J, Sun Y, Hao Y, et al. Imbalance between subpopulations of regulatory T cells in COPD. Thorax. 2013;68(12):1131–1139. doi:10.1136/thoraxjnl−2012−201956
31. Barcelo B, Pons J, Ferrer JM, et al. Phenotypic characterisation of T-lymphocytes in COPD: abnormal CD4+CD25+ regulatory T-lymphocyte response to tobacco smoking. Eur Respir J. 2008;31(3):555–562. doi:10.1183/09031936.00010407
32. Yang X, Huo B, Zhong X, et al. Imbalance between subpopulations of regulatory T cells in patients with acute exacerbation of COPD. COPD. 2017;14(6):618–625. doi:10.1080/15412555.2017.1385055
33. Miyara M, Yoshioka Y, Kitoh A, et al. Functional delineation and differentiation dynamics of human CD4+ T cells expressing the FoxP3 transcription factor. Immunity. 2009;30(6):899–911. doi:10.1016/j.immuni.2009.03.019
34. Ono M, Tanaka RJ. Controversies concerning thymus-derived regulatory T cells: fundamental issues and a new perspective. Immunol Cell Biol. 2016;94(1):3–10. doi:10.1038/icb.2015.65
35. Qiu SL, Zhang H, Tang QY, et al. Neutrophil extracellular traps induced by cigarette smoke activate plasmacytoid dendritic cells. Thorax. 2017;72(12):1084–1093. doi:10.1136/thoraxjnl−2016−209887
 © 2019 The Author(s). This work is published and licensed by Dove Medical Press Limited. The
full terms of this license are available at https://www.dovepress.com/terms
and incorporate the Creative Commons Attribution
- Non Commercial (unported, 3.0) License.
By accessing the work you hereby accept the Terms. Non-commercial uses of the work are permitted
without any further permission from Dove Medical Press Limited, provided the work is properly
attributed. For permission for commercial use of this work, please see paragraphs 4.2 and 5 of our Terms.
© 2019 The Author(s). This work is published and licensed by Dove Medical Press Limited. The
full terms of this license are available at https://www.dovepress.com/terms
and incorporate the Creative Commons Attribution
- Non Commercial (unported, 3.0) License.
By accessing the work you hereby accept the Terms. Non-commercial uses of the work are permitted
without any further permission from Dove Medical Press Limited, provided the work is properly
attributed. For permission for commercial use of this work, please see paragraphs 4.2 and 5 of our Terms.