Back to Journals » Clinical Ophthalmology » Volume 18
Peripapillary Retinal Nerve Fiber Layer Thickness as a Predictor of Visual Outcomes in Patients with Acute Nonarteritic Anterior Ischemic Optic Neuropathy
Authors Sriwannavit S, Padungkiatsagul T ![]() , Jindahra P
, Jindahra P ![]() , Vanikieti K
, Vanikieti K
Received 14 January 2024
Accepted for publication 19 April 2024
Published 29 April 2024 Volume 2024:18 Pages 1133—1142
DOI https://doi.org/10.2147/OPTH.S459636
Checked for plagiarism Yes
Review by Single anonymous peer review
Peer reviewer comments 2
Editor who approved publication: Dr Scott Fraser
Sivapoj Sriwannavit,1 Tanyatuth Padungkiatsagul,1 Panitha Jindahra,2 Kavin Vanikieti1
1Department of Ophthalmology, Faculty of Medicine Ramathibodi Hospital, Mahidol University, Bangkok, Thailand; 2Department of Medicine, Faculty of Medicine Ramathibodi Hospital, Mahidol University, Bangkok, Thailand
Correspondence: Kavin Vanikieti, Department of Ophthalmology, Faculty of Medicine Ramathibodi Hospital, Mahidol University, 270 Rama VI Road, Bangkok, 10400, Thailand, Tel +662 201 1526, Email [email protected]
Objective: To evaluate the utility of peripapillary retinal nerve fiber layer thickness (pRNFLT) for the prediction of visual outcomes, including visual acuity (VA) and visual field (VF), in subjects with acute nonarteritic anterior ischemic optic neuropathy (NAION).
Materials and Methods: We performed a retrospective study of data relating to 60 eyes of 60 subjects with acute NAION. Of these, reliable VF values were obtained at both the initial and at 6-month follow-up visits for 30 eyes, which were included in the VF analysis. The pRNFLT was measured globally and separately in all four quadrants (superior, inferior, nasal, and temporal) using optical coherence tomography at the initial visit. Multivariate analysis and the area under the curve (AUC) were used to evaluate the utility of pRNFLT for the prediction of visual outcomes, including favorable VA (VA better than or equal to 20/25) and favorable VF (visual field index (VFI) ≥ 90%), at the 6-month follow-up visit.
Results: The median VA and mean VFI at the initial visit were 0.40 (interquartile range (IQR): 0.40, 0.54; logarithm of the minimum angle of resolution (logMAR)) and 73.07% ± 6.73%, respectively. The median VA and mean VFI at the 6-month follow-up visit were 0.30 (IQR: 0.00, 0.70) logMAR and 69.27% ± 28.94%, respectively. Thinner temporal-quadrant pRNFLT was associated with favorable VA (odds ratio 0.98; p = 0.042) with a cut-off value of 128 μm (AUC 0.839, 95% CI: 0.732– 0.947, sensitivity 77.27%, specificity 84.21%). Thinner nasal-quadrant pRNFLT was associated with favorable VF (odds ratio 0.97; p = 0.047) with a cut-off value of 105 μm (AUC 0.780, 95% CI: 0.612– 0.948, sensitivity 90.00%, specificity 70.00%).
Conclusions: The pRNFLT is clinically useful for the prediction of visual outcomes in patients with acute NAION. A temporal-quadrant pRNFLT ≤ 128 μm and a nasal-quadrant pRNFLT ≤ 105 μm predict favorable VA and VF at the 6-month follow-up visit, respectively.
Keywords: nonarteritic anterior ischemic optic neuropathy, peripapillary retinal nerve fiber layer thickness, optical coherence tomography, visual acuity, visual field, visual prognosis
Introduction
Nonarteritic anterior ischemic optic neuropathy (NAION) is the most common cause of acute optic neuropathy in patients who are older than 50 years.1,2 By definition, anterior ischemic optic neuropathy affects the intraocular segment of the optic nerve, also known as the optic disc, and results in visible optic disc swelling and peripapillary retinal nerve fiber layer (pRNFL) swelling, during the acute phase.
The pathophysiology of acute NAION involves compromise to the retrolaminar portion of the optic disc microcirculation.3–7 Risk factors include ocular factors, such as structural crowding of the optic disc and ocular hypertension, and systemic factors, such as diabetes mellitus (DM), systemic hypertension (HT), dyslipidemia (DLP), obstructive sleep apnea (OSA), and smoking.6–13
A diagnosis of acute NAION is made in the presence of a typical history of acute, painless visual loss, hyperemic optic disc swelling with peripapillary hemorrhages, and a small cup-to-disc (C/D) ratio of the fellow eye. Visual acuity (VA) and color vision may be normal if there is no loss of fixation. The most common pattern of visual field (VF) loss is an altitudinal defect, but any pattern may be present.14
Currently, no proven effective treatment for acute NAION is available.15 Therefore, the determination of prognosis is an important part of the therapeutic approaches of this condition. To the best of our knowledge, parameters with potential prognostic value for VA in patients with acute NAION in the Thai population have been evaluated in only one previous study.16 However, these did not include pRNFL thickness (pRNFLT), and potential predictors of VF were not evaluated. Therefore, in the present study, we aimed to evaluate the utility of pRNFLT for the prediction of visual outcomes, including VA and VF, in subjects with acute NAION.
Materials and Methods
This study was performed in accordance with the principles of the Declaration of Helsinki and was approved by the Institutional Review Board (IRB) of the Faculty of Medicine Ramathibodi Hospital, Mahidol University, Bangkok, Thailand (IRB number: COA. MURA2023/496), which waived the requirement for written informed consent from the subjects owing to the retrospective nature of the study. All the data collected were regarded as confidential and stored in our database. Electronic medical records were reviewed to identify all the subjects diagnosed with NAION from February 2011 to October 2022.
Subjects and Eyes Selection
We included subjects with NAION who met all of the following criteria: 1) they underwent an initial examination within 14 days of the onset of the condition; 2) both VA and VF were assessed, as well as pRNFLT, measured using optical coherence tomography (OCT) at the initial visit; and 3) they underwent assessment of both VA and VF at the 6-month follow-up visit. In subjects with bilateral sequential NAION, only the eye affected first was included in the study, and in those in whom both eyes developed NAION simultaneously, only the more severely affected eye was included. Furthermore, data regarding subsequent episodes of NAION in the same eye were not taken into consideration.
We excluded subjects with one or more of the following: 1) age at onset younger than 18 years and 2) treatment of NAION with systemic corticosteroids. Furthermore, eyes with one or more of the following were excluded: 1) presence of visually significant cataracts and/or diseases other than NAION that could affect VA and/or VF; 2) spherical refractive error outside the range of >5 diopter or greater than 2 diopter of astigmatism; 3) any intraocular surgery during the 6-month follow-up period; and 4) a second episode of NAION occurred in the same eye during the 6-month follow-up period.
Data Collection
Demographic data (sex, age at onset, underlying diseases (DM, HT, DLP, and OSA), and smoking), visual function parameters, including VA and VF, assessed at the initial visit, other ocular parameters assessed at the initial visit (intraocular pressure (IOP) and contralateral C/D ratio), pRNFLT measurements, the treatments, and the visual outcomes, including VA and VF, assessed at the 6-month follow-up visit, were reviewed.
VA was assessed using the Early Treatment Diabetic Retinopathy Study (ETDRS) chart. At the 6-month follow-up visit, the eyes were placed into two groups according to their VA: “favorable VA”, defined as VA better than or equal to 20/25, and “unfavorable VA”, defined as VA worse than 20/25.
VF was assessed using 24–2 SITA software (Humphrey Field Analyzer, Carl-Zeiss Meditec). A reliable VF assessment was defined as a VF examination that met all of the following conditions: fixation loss <20%, false positive error <33%, and false negative error <33%. We only recorded the VF findings for eyes for which reliable VF assessments had been made at both the initial and at 6-month follow-up visits. As a result, the VF findings for 30 eyes were included in the VF analysis. The visual field index (VFI) was used as a proxy for the severity of a VF defect (as the VF defect increased, the VFI percentage decreased). At the 6-month follow-up visit, the eyes were placed into two groups according to their VF: “favorable VF”, defined as VFI ≥90%, and “unfavorable VF”, defined as VFI <90%.
pRNFLT was measured using a Cirrus HD-OCT Model 4000 (Carl-Zeiss Meditec) at the initial visit. The optic nerve head cube 200×200 scan protocol was used. OCT images of low signal strength (<7) or with segmentation errors were excluded. The pRNFLT was measured both globally and separately in all four quadrants, therefore the pRNFLT parameters included global and each of the four quadrants (superior, inferior, nasal, and temporal) pRNFLT.
Regarding treatment, the use of aspirin was not analyzed, owing to a lack of evidence of its effectiveness for the treatment of NAION.17
Statistical Analysis
Normally distributed continuous data are expressed as mean ± standard deviation (SD) and non-normally distributed continuous data are expressed as median and interquartile range (IQR). The independent t-test or the Mann–Whitney U-test, as appropriate, was used to compare continuous datasets. Categorical datasets are expressed as frequency and percentage and were compared using the chi-square or Fisher’s exact test, as appropriate. For multivariate analysis, logistic regression was used, to simultaneously regress outcomes with datasets whose p-values in the univariate analysis were <0.1. Statistical analyses were performed using STATA software, version 18.0 (StataCorp LLC, College Station, TX, USA). Differences were reported with 95% confidence intervals (CIs). P <0.05 was considered statistically significant. The optimal cut-off values were identified using the maximum Youden’s index value.18
ETDRS VA values were converted to logarithm of the minimum angle of resolution (logMAR) values for statistical analysis. The VA categories of counting fingers, hand motion, light perception, and no light perception were converted to 2.6, 2.7, 2.8, and 2.9 logMAR, respectively.19,20
Results
Demographic Data, Visual Function Parameters and Other Ocular Parameters at the Initial Visit, pRNFLT Parameters, Treatments, and Visual Outcomes at the 6-Month Follow-Up Visit
We included data for 60 eyes of 60 subjects with acute NAION, and there were 30 eyes for which reliable VFI values were obtained at both the initial and at 6-month follow-up visits. Therefore, these 30 eyes were included in the VFI analysis. Of the 60 subjects, 29 (48.33%) were male, and the mean age at onset was 58.83 ± 9.52 years. HT was the most common underlying disease (42 subjects, 70.00%), followed by DLP (39 subjects, 65.00%), DM (29 subjects, 48.33%), and OSA (11 subjects, 18.33%). Eight of the subjects (13.33%) had a history of smoking.
At the initial visit, the median VA and mean VFI were 0.40 (0.40, 0.54) logMAR and 73.07% ± 6.73%, respectively. The mean IOP and median contralateral C/D ratio at the initial visit were 14.00 ± 2.97 mmHg and 0.15 (0.10, 0.20), respectively. Neither low signal strength (<7) nor segmentation errors characterized any of the OCT images of the 60 eyes. The pRNFLT parameters are provided in Table 1. None of the subjects underwent treatment.
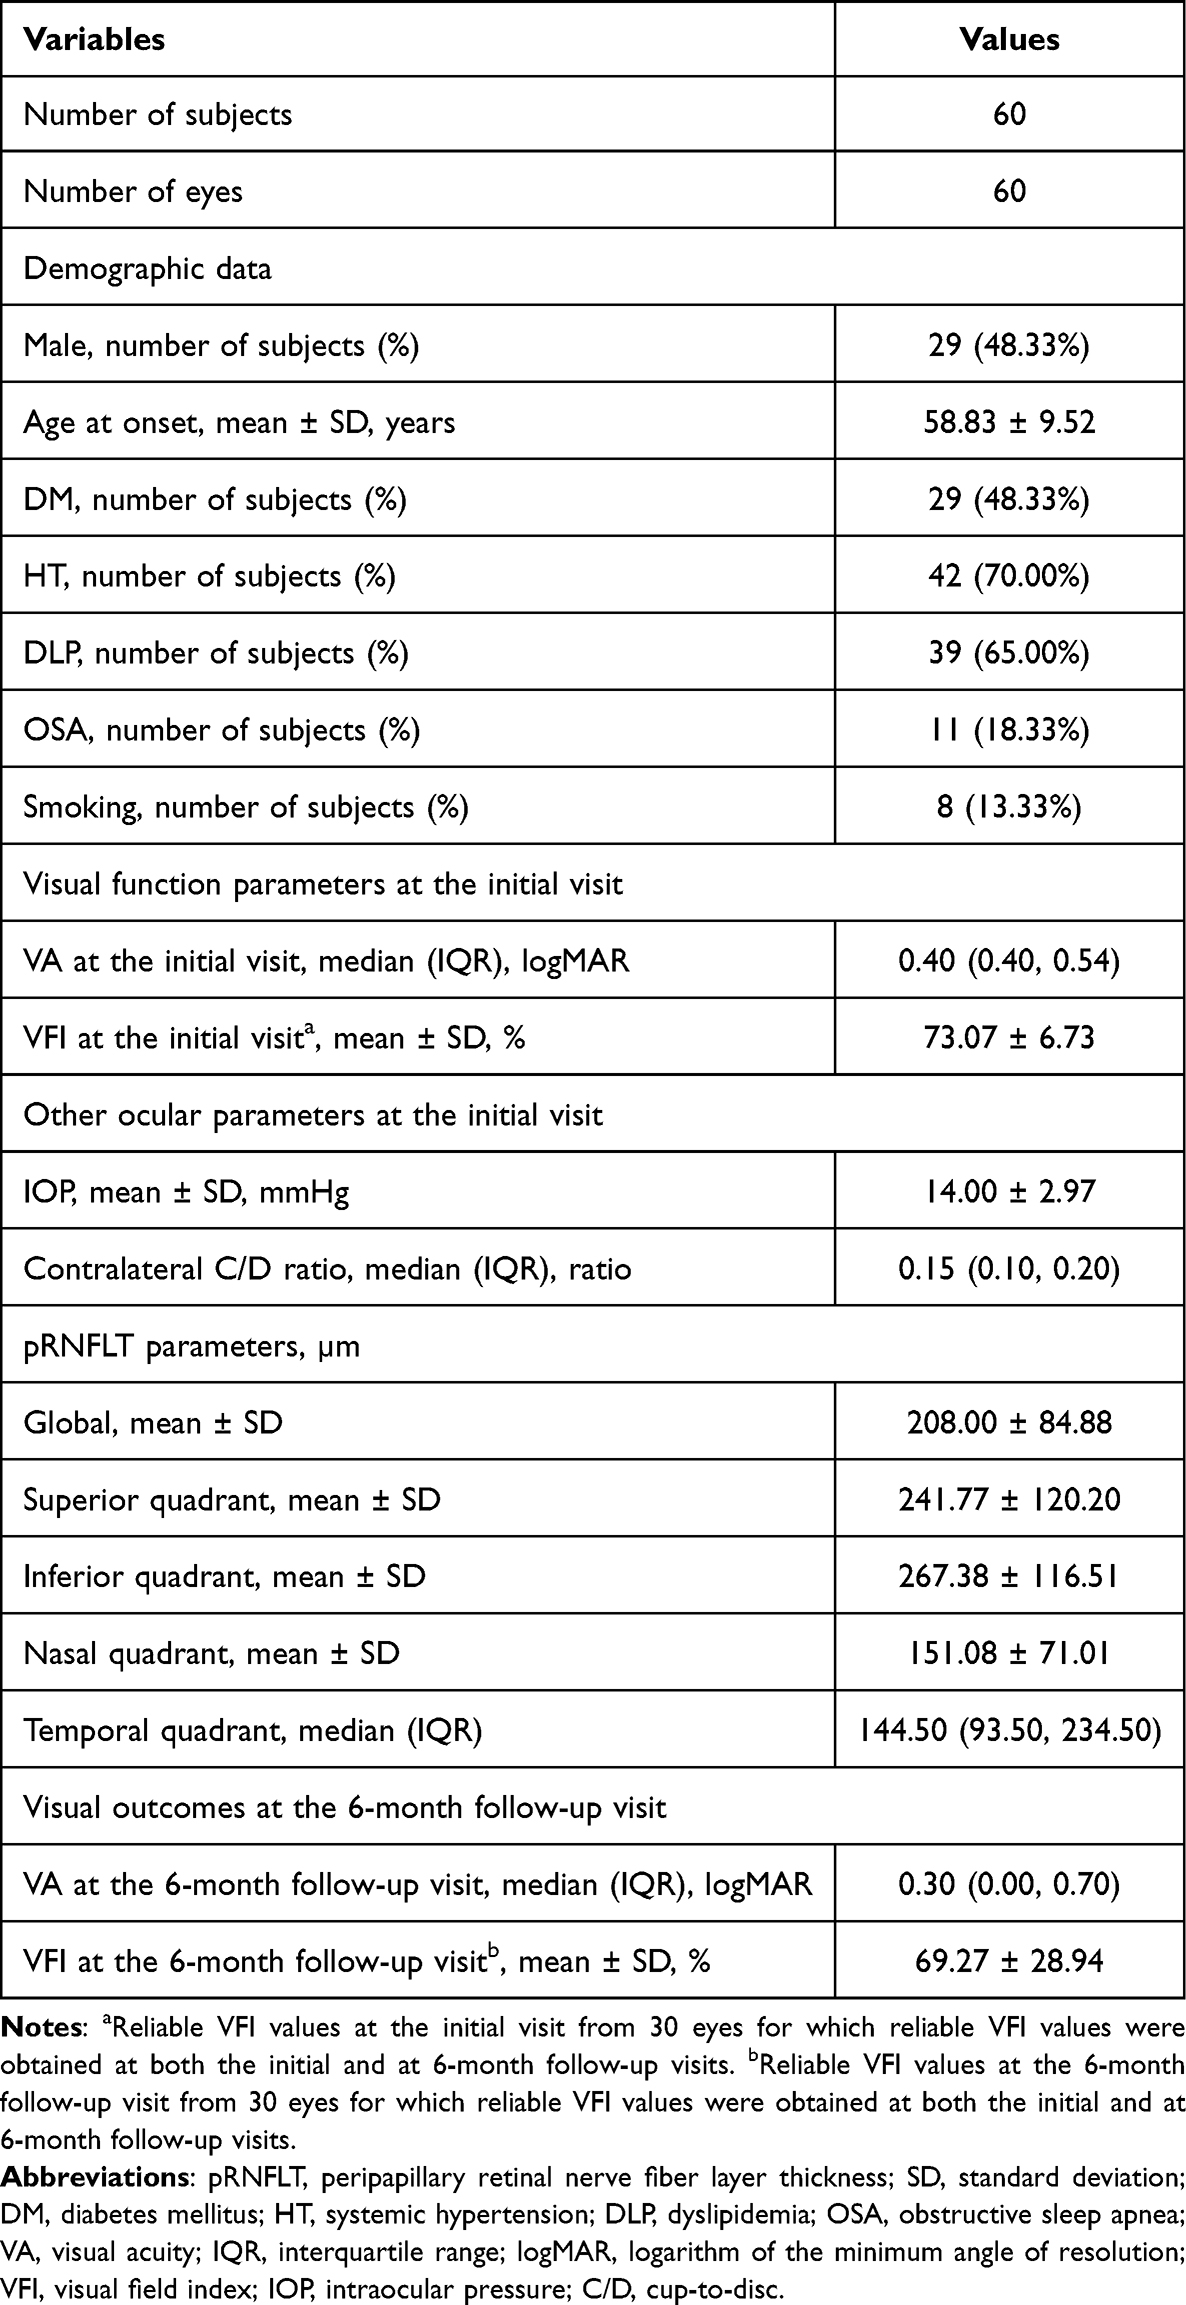 |
Table 1 Demographic Data, Visual Function Parameters and Other Ocular Parameters at the Initial Visit, pRNFLT Parameters, and Visual Outcomes at the 6-Month Follow-Up Visit |
At the 6-month follow-up visit, the median VA and mean VFI were 0.30 (0.00, 0.70) logMAR and 69.27% ± 28.94%, respectively.
The demographic data, visual function parameters and other ocular parameters at the initial visit, pRNFLT parameters, and visual outcomes at the 6-month follow-up visit are summarized in Table 1.
Association Between pRNFLT Parameters and VA at the 6-Month Follow-Up Visit
There were 22 eyes (36.67%) and 38 eyes (63.33%) in the favorable VA and unfavorable VA groups, respectively. Compared with the eyes in the unfavorable VA group, those in the favorable VA group had a higher proportion of the absence of DM (72.73% versus 39.47%, p = 0.013). No significant differences were found between the groups with respect to the other demographic data, the VA parameter at the initial visit, or the other ocular parameters at the initial visit (p ≥0.05). The pRNFLT parameters of the favorable VA group were significantly thinner than those of the unfavorable VA group globally and in all four quadrants, as shown in Table 2.
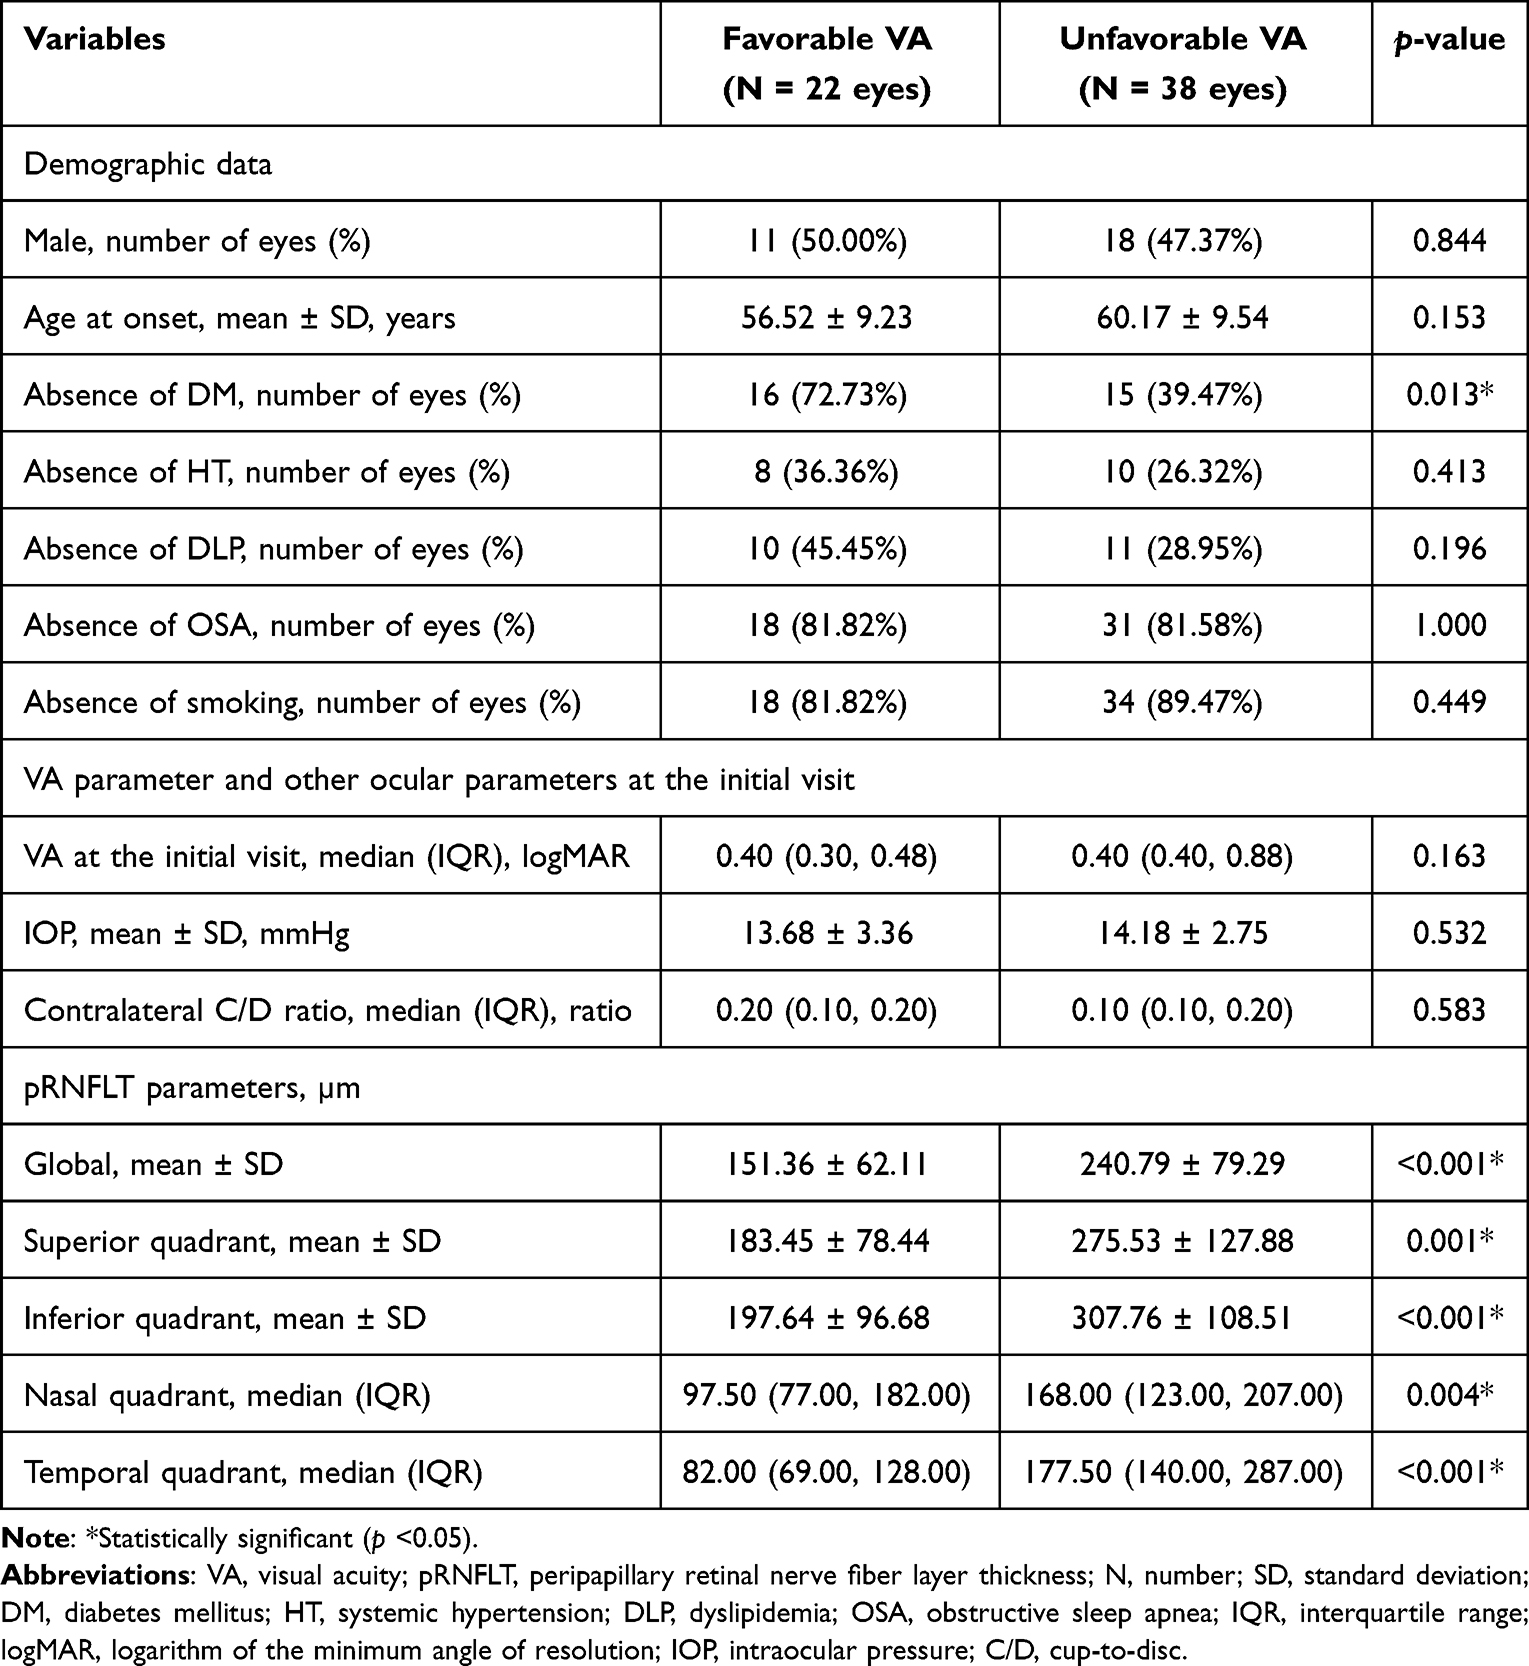 |
Table 2 Comparison of the Demographic Data, VA Parameter and Other Ocular Parameters at the Initial Visit, and pRNFLT Parameters for the Eyes with Favorable and Unfavorable VA |
The multivariate analysis showed that the absence of DM (odds ratio (OR) 6.55; p = 0.018), and thinner temporal-quadrant pRNFLT (OR 0.98; p = 0.042) were associated with favorable VA, as shown in Table 3.
 |
Table 3 Factors Associated with Favorable VA |
The optimal cut-off value of the temporal-quadrant pRNFLT for the prediction of favorable VA was found to be 128 µm (area under the curve (AUC) 0.839, 95% CI: 0.732–0.947). The sensitivity and specificity of this temporal-quadrant pRNFLT cut-off value were 77.27% and 84.21%, respectively.
Association Between pRNFLT Parameters and VF at the 6-Month Follow-Up Visit
Of the 30 eyes for which reliable VFI values were obtained at both the initial and at 6-month follow-up visits, 10 eyes (33.33%) and 20 eyes (66.67%) were in the favorable VF and unfavorable VF groups, respectively. There were no significant differences in the demographic data, the VF parameter at the initial visit, or the other ocular parameters at the initial visit between the two groups (p ≥0.05). The pRNFLT parameters of the favorable VF group were significantly thinner than those of the unfavorable VF group globally and in the superior and nasal quadrants, as shown in Table 4.
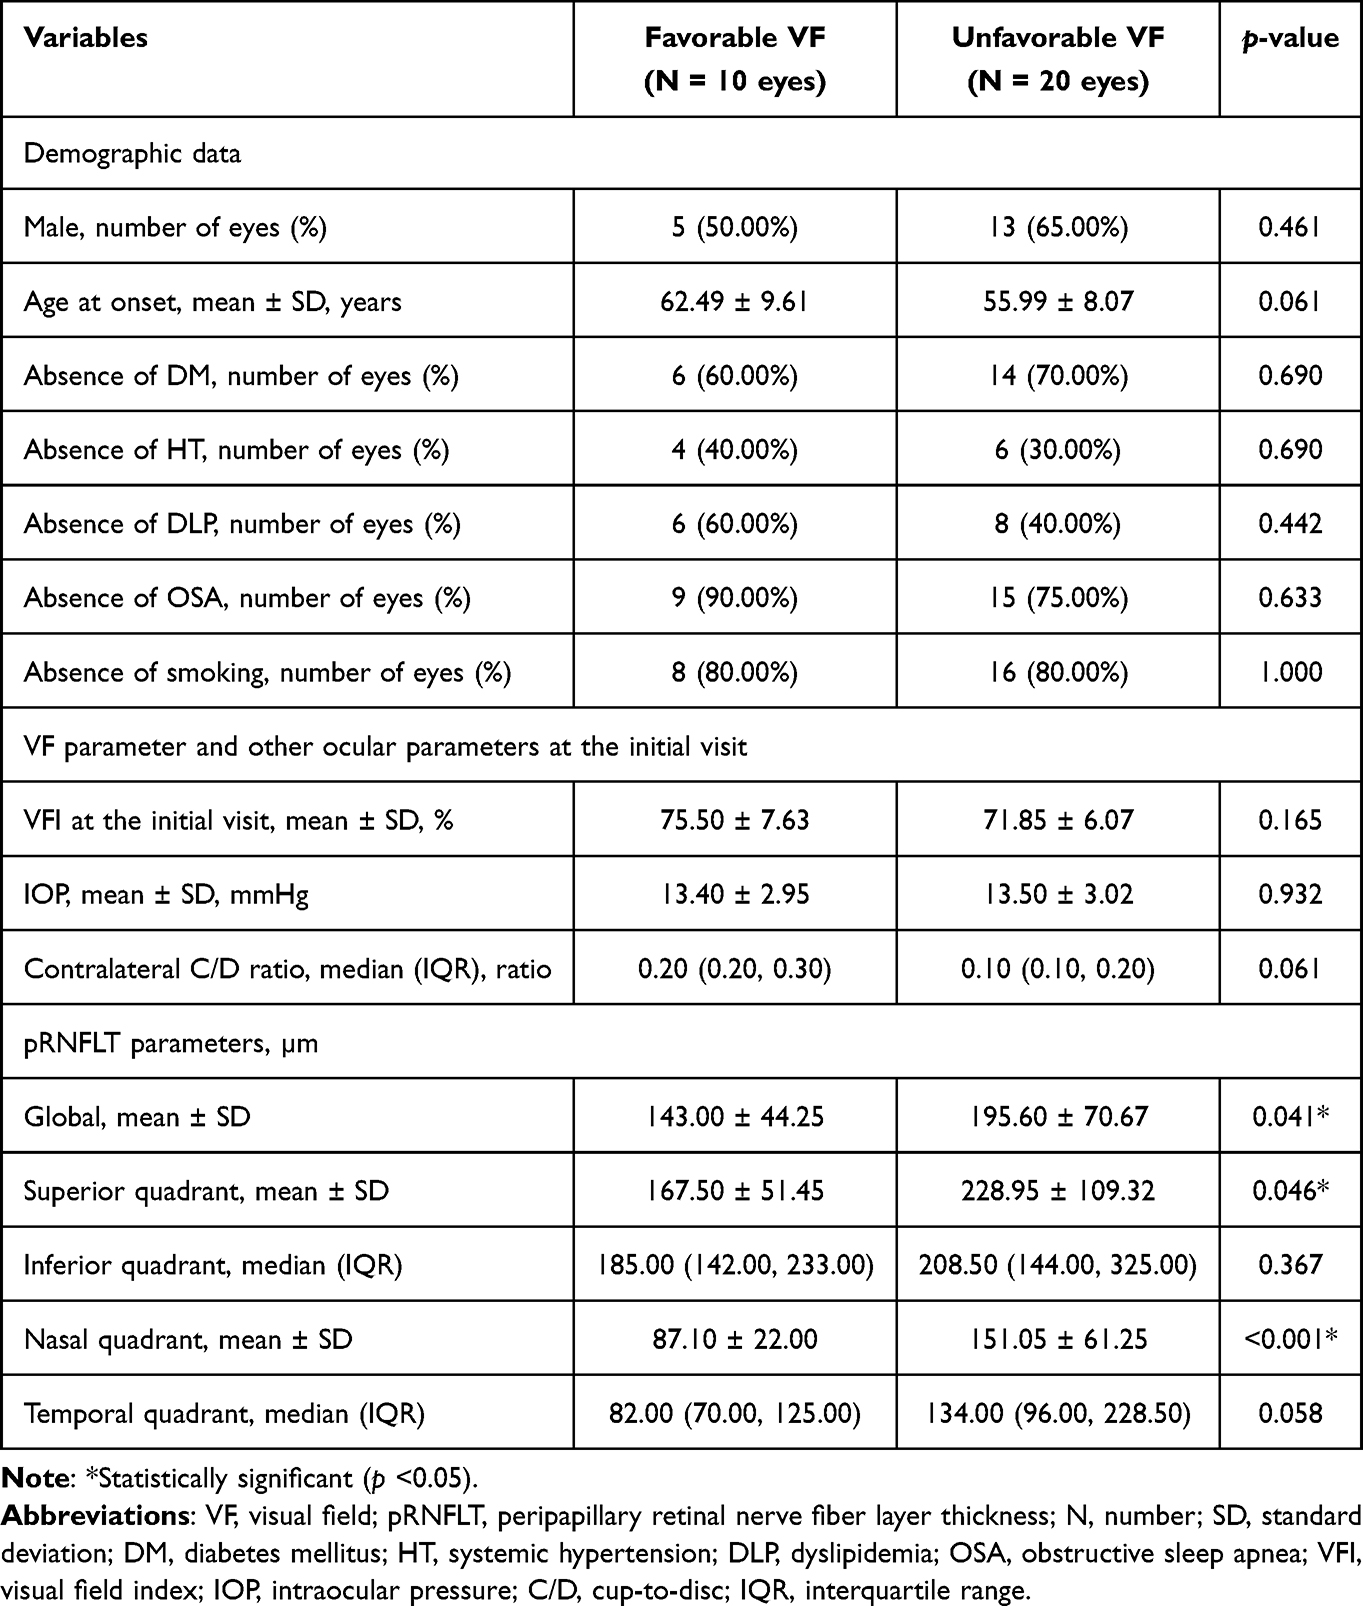 |
Table 4 Comparison of the Demographic Data, VF Parameter and Other Ocular Parameters at the Initial Visit, and pRNFLT Parameters for the Eyes with Favorable and Unfavorable VF |
The multivariate analysis showed that thinner nasal-quadrant pRNFLT (OR 0.97; p = 0.047) was associated with favorable VF, as shown in Table 5.
 |
Table 5 Factors Associated with Favorable VF |
The optimal cut-off value of the nasal-quadrant pRNFLT for the prediction of favorable VF was found to be 105 µm (AUC 0.780, 95% CI: 0.612–0.948). The sensitivity and specificity of this nasal-quadrant pRNFLT cut-off value were 90.00% and 70.00%, respectively.
Discussion
In the present study, we evaluated the utility of pRNFLT, both globally and separately in all four quadrants, for the prediction of visual outcomes, including VA and VF, in subjects with acute NAION. We found that the ability of pRNFLT to predict a favorable VA was best when measured in the temporal quadrant. Of the pRNFLT parameters, a thinner temporal-quadrant pRNFLT was the only parameter that was found to be associated with favorable VA.
We speculate that this finding can be explained by the temporal-quadrant pRNFLT being representative of the papillomacular bundle (PMB), and visual outcome (VA) deficit may depend on the severity of the damage sustained by the PMB. For example, the less severe is the damage to the PMB, and therefore the thinner is the temporal-quadrant pRNFLT, the less severe is the visual outcome (VA) deficit. In one retrospective study, in which only eyes with chronic NAION were studied, VA (logMAR) showed a strong negative correlation with the temporal-quadrant pRNFLT (µm), whereas there were no correlations between the global and other quadrants of pRNFLT and VA.21 This finding is consistent with the present finding that the temporal-quadrant pRNFLT may be a predictor of visual outcome (VA) in subjects with acute NAION. However, in the previous study, only eyes with chronic NAION were studied, and therefore there was a negative correlation between VA (logMAR) and the temporal-quadrant pRNFLT (µm).
Interestingly, we found that the absence of DM was associated with favorable VA, which is fairly similar to the results of a study of Kemchoknatee et al, in which only eyes with acute NAION were studied in Thailand and showed that the presence of DM is a predictor of a poor improvement in VA.16
We also found that the ability of pRNFLT to predict a favorable VF was best when measured in the nasal quadrant. Of the pRNFLT parameters, a thinner nasal-quadrant pRNFLT was the only parameter that was found to be associated with favorable VF. Papchenko et al found that of the pRNFLT parameters, the nasal-quadrant pRNFLT (µm) showed the highest positive correlation with the severity of the VF defect in eyes with chronic NAION, assessed using the total mean deviation (MD) (decibels (dB)).22 This finding is consistent with the present finding that the nasal-quadrant pRNFLT may be a predictor of visual outcome (VF) in subjects with acute NAION. However, in the previous study, only eyes with chronic NAION were studied, and therefore there was a positive correlation between the nasal-quadrant pRNFLT (µm) and the severity of the VF defect, assessed using the total MD (dB).
In the present study, we have established cut-off values of pRNFLT for the prediction of favorable VA and VF in the Thai population. These cut-off values could be used by ophthalmologists and neurologists to provide better information regarding the visual prognosis of patients, which is an important part of the therapeutic approaches of acute NAION, owing to the lack of proven effective treatments for acute NAION.
The present study had several strengths. First, to the best of our knowledge, this was the first study among the Thai population to identify associations between pRNFLT and visual outcomes in subjects with acute NAION. Moreover, it was also the first study among the Thai population to identify predictors of VF in such subjects. Second, the visual outcomes assessed included both VA and VF. Finally, we have identified optimal cut-off values of pRNFLT for the prediction of favorable VA and VF.
There were some limitations in the present study. First, we did not evaluate other aspects of visual function, such as contrast sensitivity. Second, we did not evaluate the vascular density of the optic disc using OCT angiography and the macular ganglion cell complex. Finally, visual outcomes were not assessed after the 6-month follow-up visit.
Conclusions
The pRNFLT is a clinically useful means of predicting visual outcomes in patients with acute NAION. A temporal-quadrant pRNFLT ≤128 µm and a nasal-quadrant pRNFLT ≤105 µm were found to predict favorable VA and VF at the 6-month follow-up visit, respectively.
Acknowledgments
The authors would like to thank Ms. Sasiporn Sitthisorn, Department of Clinical Epidemiology and Biostatistics, Faculty of Medicine Ramathibodi Hospital, Mahidol University, Bangkok, Thailand, for her advice regarding the statistical analysis. We also thank Mark Cleasby, PhD from Edanz for editing a draft of this manuscript.
Funding
There is no funding to report.
Disclosure
The authors declare that they have no competing interests in this work.
References
1. Hattenhauer MG, Leavitt JA, Hodge DO, et al. Incidence of nonarteritic anterior ischemic optic neuropathy. Am J Ophthalmol. 1997;123(1):103–107. doi:10.1016/S0002-9394(14)70999-7
2. Preechawat P, Bruce BB, Newman NJ, et al. Anterior ischemic optic neuropathy in patients younger than 50 years. Am J Ophthalmol. 2007;144(6):953–960. doi:10.1016/j.ajo.2007.07.031
3. Hayreh SS. Anterior ischaemic optic neuropathy. I. Terminology and pathogenesis. Br J Ophthalmol. 1974;58(12):955–963. doi:10.1136/bjo.58.12.955
4. Hayreh SS. Ischemic optic neuropathies - where are we now? Graefes Arch Clin Exp Ophthalmol. 2013;251(8):1873–1884. doi:10.1007/s00417-013-2399-z
5. Rizzo JF. Unraveling the enigma of nonarteritic anterior ischemic optic neuropathy. J Neuroophthalmol. 2019;39(4):529–544. doi:10.1097/WNO.0000000000000870
6. Miller NR, Arnold AC. Current concepts in the diagnosis, pathogenesis and management of nonarteritic anterior ischaemic optic neuropathy. Eye. 2015;29(1):65–79. doi:10.1038/eye.2014.144
7. Patil AD, Biousse V, Newman NJ. Ischemic optic neuropathies: current concepts. Ann Indian Acad Neurol. 2022;25(Suppl 2):567.
8. Kosanovic-Jakovic N, Ivanovic B, Milenkovic S, et al. Anterior ischemic optic neuropathy associated with metabolic syndrome. Arq Bras Oftalmol. 2008;71(1):62–66. doi:10.1590/S0004-27492008000100013
9. Liu B, Yu Y, Liu W, et al. Risk factors for non-arteritic anterior ischemic optic neuropathy: a large scale meta-analysis. Front Med Lausanne. 2021;8:618353. doi:10.3389/fmed.2021.618353
10. Chen T, Song D, Shan G, et al. The association between diabetes mellitus and nonarteritic anterior ischemic optic neuropathy: a systematic review and meta-analysis. PLoS One. 2013;8(9):e76653. doi:10.1371/journal.pone.0076653
11. Yang HK, Park SJ, Byun SJ, Park KH, Kim J-W, Hwang J-M. Obstructive sleep apnoea and increased risk of non-arteritic anterior ischaemic optic neuropathy. Br J Ophthalmol. 2019;103(8):1123–1128. doi:10.1136/bjophthalmol-2018-312910
12. Lee SSY, Nilagiri VK, Mackey DA. Sleep and eye disease: a review. Clin Exp Ophthalmol. 2022;50(3):334–344. doi:10.1111/ceo.14071
13. Chung SM, Gay CA, McCrary JA. Nonarteritic ischemic optic neuropathy. The impact of tobacco use. Ophthalmology. 1994;101(4):779–782. doi:10.1016/S0161-6420(94)31266-8
14. Hayreh SS, Zimmerman B. Visual field abnormalities in nonarteritic anterior ischemic optic neuropathy: their pattern and prevalence at initial examination. Arch Ophthalmol. 2005;123(11):1554–1562. doi:10.1001/archopht.123.11.1554
15. Salvetat ML, Pellegrini F, Spadea L, et al. Non-arteritic anterior ischemic optic neuropathy (NA-AION): a comprehensive overview. Vision. 2023;7(4):72. doi:10.3390/vision7040072
16. Kemchoknatee P, Singhakul C, Tangon D, et al. Factors associated with visual acuity in non-arteritic ischemic optic neuropathy patients: a five-year cross-sectional study. Cureus. 2022;14(9).
17. Botelho PJ, Johnson LN, Arnold AC. The effect of aspirin on the visual outcome of nonarteritic anterior ischemic optic neuropathy. Am J Ophthalmol. 1996;121(4):450–451. doi:10.1016/S0002-9394(14)70448-9
18. Hajian-Tilaki K. The choice of methods in determining the optimal cut-off value for quantitative diagnostic test evaluation. Stat Methods Med Res. 2018;27(8):2374–2383. doi:10.1177/0962280216680383
19. Grover S, Fishman GA, Anderson RJ, et al. Visual acuity impairment in patients with retinitis pigmentosa at age 45 years or older. Ophthalmology. 1999;106(9):1780–1785. doi:10.1016/S0161-6420(99)90342-1
20. McAnany JJ, Genead MA, Walia S, et al. Visual acuity changes in patients with leber congenital amaurosis and mutations in CEP290. JAMA Ophthalmol. 2013;131(2):178–182. doi:10.1001/2013.jamaophthalmol.354
21. Barbano L, Ziccardi L, Parisi V. Correlations between visual morphological, electrophysiological, and acuity changes in chronic non-arteritic ischemic optic neuropathy. Graefes Arch Clin Exp Ophthalmol. 2021;259(5):1297–1308. doi:10.1007/s00417-020-05023-w
22. Papchenko T, Grainger BT, Savino PJ, et al. Macular thickness predictive of visual field sensitivity in ischaemic optic neuropathy. Acta Ophthalmol. 2012;90(6):e463–e469. doi:10.1111/j.1755-3768.2012.02467.x
 © 2024 The Author(s). This work is published and licensed by Dove Medical Press Limited. The
full terms of this license are available at https://www.dovepress.com/terms
and incorporate the Creative Commons Attribution
- Non Commercial (unported, 3.0) License.
By accessing the work you hereby accept the Terms. Non-commercial uses of the work are permitted
without any further permission from Dove Medical Press Limited, provided the work is properly
attributed. For permission for commercial use of this work, please see paragraphs 4.2 and 5 of our Terms.
© 2024 The Author(s). This work is published and licensed by Dove Medical Press Limited. The
full terms of this license are available at https://www.dovepress.com/terms
and incorporate the Creative Commons Attribution
- Non Commercial (unported, 3.0) License.
By accessing the work you hereby accept the Terms. Non-commercial uses of the work are permitted
without any further permission from Dove Medical Press Limited, provided the work is properly
attributed. For permission for commercial use of this work, please see paragraphs 4.2 and 5 of our Terms.