Back to Journals » Clinical Ophthalmology » Volume 16
Peripapillary and Subfoveal Choroidal Thickness in Retinal Vein Occlusions
Authors Moleiro AF ![]() , Godinho G, Madeira C, Faria Pereira A
, Godinho G, Madeira C, Faria Pereira A ![]() , Brandão E, Falcão-Reis F, Beato JN
, Brandão E, Falcão-Reis F, Beato JN ![]() , Penas S
, Penas S
Received 28 June 2022
Accepted for publication 21 October 2022
Published 16 November 2022 Volume 2022:16 Pages 3775—3783
DOI https://doi.org/10.2147/OPTH.S379373
Checked for plagiarism Yes
Review by Single anonymous peer review
Peer reviewer comments 4
Editor who approved publication: Dr Scott Fraser
Ana Filipa Moleiro,1,2 Gonçalo Godinho,3 Carolina Madeira,4 Ana Faria Pereira,1 Elisete Brandão,1 Fernando Falcão-Reis,1,2 João Nuno Beato,1,2 Susana Penas1,2
1Department of Ophthalmology, Centro Hospitalar e Universitário de São João, Porto, Portugal; 2Department of Surgery and Physiology, Faculdade de Medicina da Universidade do Porto, Porto, Portugal; 3Department of Ophthalmology, Centro Hospitalar de Leiria, Leiria, Portugal; 4Department of Ophthalmology, Centro Hospitalar Gaia-Espinho, Gaia, Portugal
Correspondence: Ana Filipa Moleiro, Department of Ophthalmology, Centro Hospitalar e Universitário de São João, Alameda Hernani Monteiro, Porto, 4200-426, Portugal, Tel +351 915689259, Email [email protected]
Purpose: This work aimed to longitudinally assess the peripapillary (PPCT) and subfoveal (SFCT) choroidal thickness (CT), in patients diagnosed with central (CRVO) or branch retinal vein occlusions (BRVO), correlating SFCT with central macular thickness (CMT) and PPCT with peripapillary retinal nerve fiber layer thickness (pRNFL).
Patients and Methods: This was a retrospective longitudinal study of 71 eyes from 71 patients with treatment-naïve retinal vein occlusion (24 CRVO and 40 BRVO). Spectral-domain optical coherence tomography (SD-OCT, Spectralis HRA-OCT, Heidelberg) was used to measure PPCT, SFCT, pRNFL and CMT of the affected and fellow eyes at baseline (acute phase) and at 3 and 9 months post anti-VEGF treatment. IBM SPSS Statistics version 27.0 (IBM Corp., Armonk, NY, USA) was used for statistical analysis. A p-value ≤ 0.05 was considered statistically significant.
Results: Affected eyes presented a thicker baseline PPCT and SFCT compared to their fellow eyes both in CRVO and BRVO (p < 0.05). Both groups presented a significant decrease of PPCT in the affected eyes at 3 months compared to baseline (p < 0.05). At 9 months, compared to 3 months, PPCT remained stable (p > 0.05). Similarly, affected eyes’ SFCT significantly decreased at 3 months (p < 0.05) in both groups. At 9 months, compared to 3 months, SFCT decreased in the CRVO patients (p = 0.047) but remained stable in the BRVO patients (p = 0.850). No correIations between SFCT and CMT were seen at any timepoint in both groups (p > 0.05). PPCT correlates with pRNFL in CRVO at 3 months, although no other correlations were found during the follow-up. In BRVO, PPCT did not show any significant correlation with pRNFL.
Conclusion: Both in CRVO and BRVO eyes, PPCT and SFCT at diagnosis are significantly thicker compared to the fellow eye, suggesting a possible increase in CT immediately after the occlusion, which is followed by a decrease at an early follow-up stage.
Keywords: biomarkers, vascular retinal diseases, retinal vein occlusions, choroidal thickness, optical coherence tomography
A Letter to the Editor has been published for this article.
A Response to Letter by Dr Marino has been published for this article.
Introduction
Retinal vein occlusions are the second most prevalent retinal vascular pathology, after diabetic retinopathy,1,2 with a prevalence of 0.1–0.2% in the active population.3 Cardiovascular risk factors increase their incidence, particularly arterial hypertension (AHT).4 A pro-coagulant state is usually associated with the younger population.5 They are classified as central (CRVO) or branch retinal vein occlusions (BRVO), according to the site of obstruction to the blood flow, and their findings include vascular engorgement and stasis, intraretinal hemorrhages, cotton wool spots, and lipid exudation.6 Visual acuity (VA) may be decreased if macular edema develops, but also due to vitreous hemorrhage or macular ischemia.
The choroid is responsible for the highest blood flow per unit weight of any tissue in the body7 and provides metabolic support and thermoregulation for the retinal pigment epithelium (RPE) and the outer retinal layers. Several studies have evaluated the subfoveal choroid in retinal venous occlusions, seeking to relate the hypoxic stimulus and increased levels of vascular endothelial growth factors (VEGF) with the morphological changes in the vascular layer. The results, however, were not consistent, with some authors reporting greater subfoveal choroidal thickness (SFCT),8,9 and others finding no differences.10 Data on the peripapillary choroidal thickness (PPCT) in this pathology is scarce. A previous study reported no differences between the affected and the fellow-eyes in the acute phase, while showed a decrease in the affected eyes after 12 months.11 There are a lot of unanswered questions about the role of the choroid in the retinal venous occlusion phenomenon, and little is known about the choroid correlation to retinal thickness, namely the development of macular edema.
This study aims to evaluate PPCT and SFCT over time in patients with BRVO and CRVO after treatment, correlating PPCT with peripapillary retinal nerve fiber layer (pRNFL) and SFCT with central macular thickness (CMT).
Materials and Methods
This was a retrospective longitudinal observational study, performed in the Ophthalmology Department of São João University Hospital Center, a tertiary referral hospital in Porto, Portugal, including treatment-naive patients newly diagnosed with CRVO and BRVO. Patients were selected from a specifically created medical retinal outpatient clinic, targeted to study and treat vascular occlusions. All data were collected and reviewed at the center. A minimum follow-up of 3 months was required. This study was conducted under the tenets of the Declaration of Helsinki and was approved by the hospital Ethics Committee.
The following exclusion criteria were applied: prior retinal venous occlusion, intravitreal (IV) treatment with anti-VEGF, corticoid, or retinal laser; concomitant macular or choroidal pathologies; a history of uveitis; refractive error higher than 6 diopters of spherical equivalent in the affected or fellow-eye; poor image quality precluding the correct assignment of SD-OCT images.
Data were collected at three timelines: baseline (acute phase), 3, and 9 months of follow-up after treatment. Demographics and risk factors for RVO, such as AHT, dyslipidemia, diabetes mellitus (DM), and glaucoma were evaluated. Best-corrected VA (BCVA) was assessed using the ETDRS chart. Patients were all assessed by a retinal specialist (JB and SP), undergoing a treat-and-extend regimen with anti-angiogenic or corticosteroid agents according to their clinical findings.
All patients underwent a Spectral Domain – Optical Coherence Tomography (Spectralis; Heidelberg Engineering, Germany) examination with enhanced depth-imaging (EDI) technology, during the afternoon period (2 pm to 8 pm) during every visit. Both macular volume and peripapillary scans were performed. Images with poor quality were excluded. Two experienced masked observers reviewed the SD-OCT images. PPCT and SFCT were assessed in the affected and fellow eyes. SFCT was manually measured using the software caliper in a 6mm EDI horizontal scan, centered on the fovea (Figure 1). The PPCT measurement was performed based on previous descriptions,12 using an EDI 3.4-mm diameter peripapillary circle scan (comprising 100 averaged scans and centered on the optic disc) that has also been used for measurement of the peripapillary retinal nerve fiber layer (RNFL) thickness. Manual segmentation was performed. The outer border of the choroid was defined as the hyperreflective line of the inner surface of the sclera. The intern border was automatically defined by the Heidelberg software. If a clear line could not be detected, the outer choroidal border was defined as a smoothing line connecting the outer limits of the large choroidal vascular spaces. Measurements of this layer thickness were performed on the upper, nasal, lower, and temporal quadrants (Figure 2). The measurements obtained at these four locations were averaged as pPPCT. Inter-observer correlation coefficient was calculated to be 0.931 (95% Confidence Interval 0.892–0. 955). Data on pRNFL and CMT of the affected eye was evaluated, using the system’s automatic software.
 |
Figure 1 Schematic representation of macular choroidal thickness measurement. Choroidal Thickness was measured from the outer edge of the hyperreflective line, corresponding to the Retinal Pigment Epithelium, to the choroidal-scleral junction. Measurements were taken at the subfoveal level (yellow caliper). |
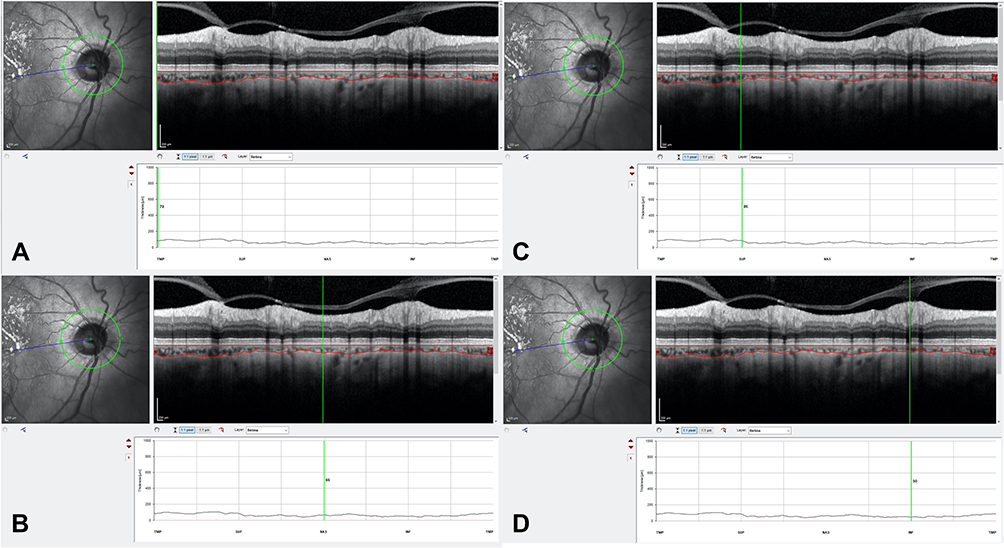 |
Figure 2 Measurement illustration of peripapillary choroidal thickness at 4 locations. Manual delineation of the inner (top red line) and outer choroidal (bottom red line) borders using eye-tracking software (Heidelberg Engineering). Measurement of choroidal thickness at 4 locations using image-processing software, illustrated with the green vertical lines. (A) Temporal choroidal thickness measurement; (B) Nasal choroidal thickness measurement; (C) Superior choroidal thickness measurement; (D) Inferior choroidal thickness measurement. |
The statistical analysis was performed using IBM SPSS Statistics, version 27.0 (IBM Corp., Armonk, NY, USA). The Shapiro–Wilk test and kurtosis and skewness evaluation verified the normal distribution of continuous variables. Continuous variables were represented as mean ± standard deviation when normally distributed or median and range for variables with non-normal distribution. Comparisons between independent groups were performed with the independent t-test when normality was confirmed, and with the Mann–Whitney test otherwise; comparisons over time and with the fellow-eye were performed using the paired sample t-test when normality was confirmed or the Wilcoxon test when normality was not present. Differences in the mean PPCT and SFCT between CRVO and BRVO patients were assessed by analysis of covariance (ANCOVA), adjusting for age. Categorical variables were reported as frequencies and percentages and the chi-square test was used for comparisons. Spearman’s rank correlation coefficient was used to describe the strength of association between two variables. Pearson correlation coefficient was applied to study possible correlations of PPCT with pRNFL and SFCT with CMT. A p-value of 0.05 or less was considered statistically significant.
Results
Sixty-four patients were included; 64 affected-eyes and 64 fellow-eyes were analyzed A total of 24 CRVO and 40 BRVO were evaluated. Age of the patients was statistically higher in BRVO patients (vs CRVO, p=0.008) (Table 1). No statistically significant differences were found related to sex (p=0.278) or different risk factors, namely AHT (p=0.063), DM (p=0.164), dyslipidemia (p=0.535), or the presence of glaucoma (p=0.239) between both groups (Table 1).
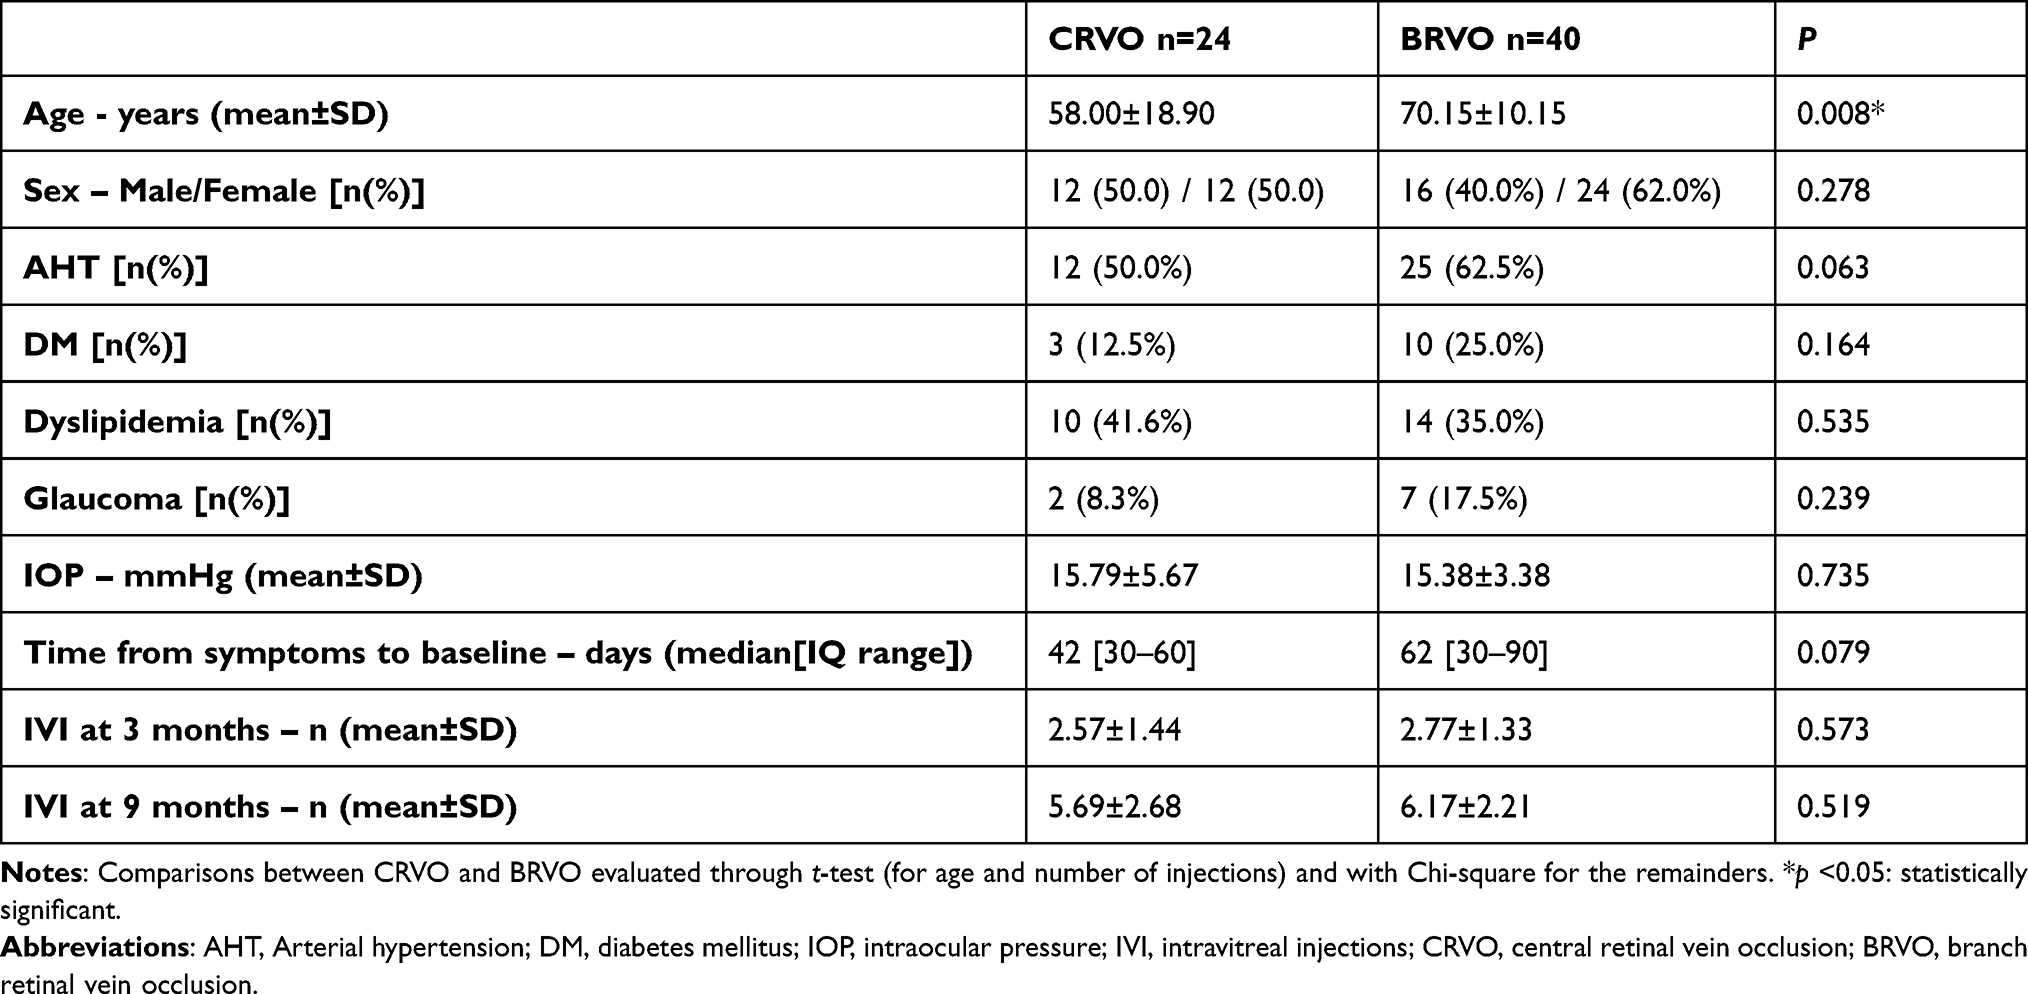 |
Table 1 Demographic and Clinical Data Comparison Between CRVO and BRVO |
A mean of 6.00±3.37 injections was performed during 9 months period - 98.1% anti-VEGF and 1.9% corticosteroid (Table 1). In the anti-VEGF sub-group of patients, more than 95% of the injections performed were from bevacizumab, the remaining from aflibercept.
Peripapillary Choroidal Thickness (PPCT)
In CRVO patients, affected eyes presented a significant thicker baseline PPCT compared to the fellow eyes (155.38±48.23µm vs 137.25±59.7µm, p=0.041), but no statistical differences were found at 3 and 9 months (p=0.357 and p=0.152, respectively). The PPCT in the affected eye presented a statistically significant decrease at 3 months compared to the baseline (p=0.002) but remained stable at 9 months (p=0.945). There were no statistically significant PPCT changes in the fellow-eye over time (p>0.05) (Table 2).
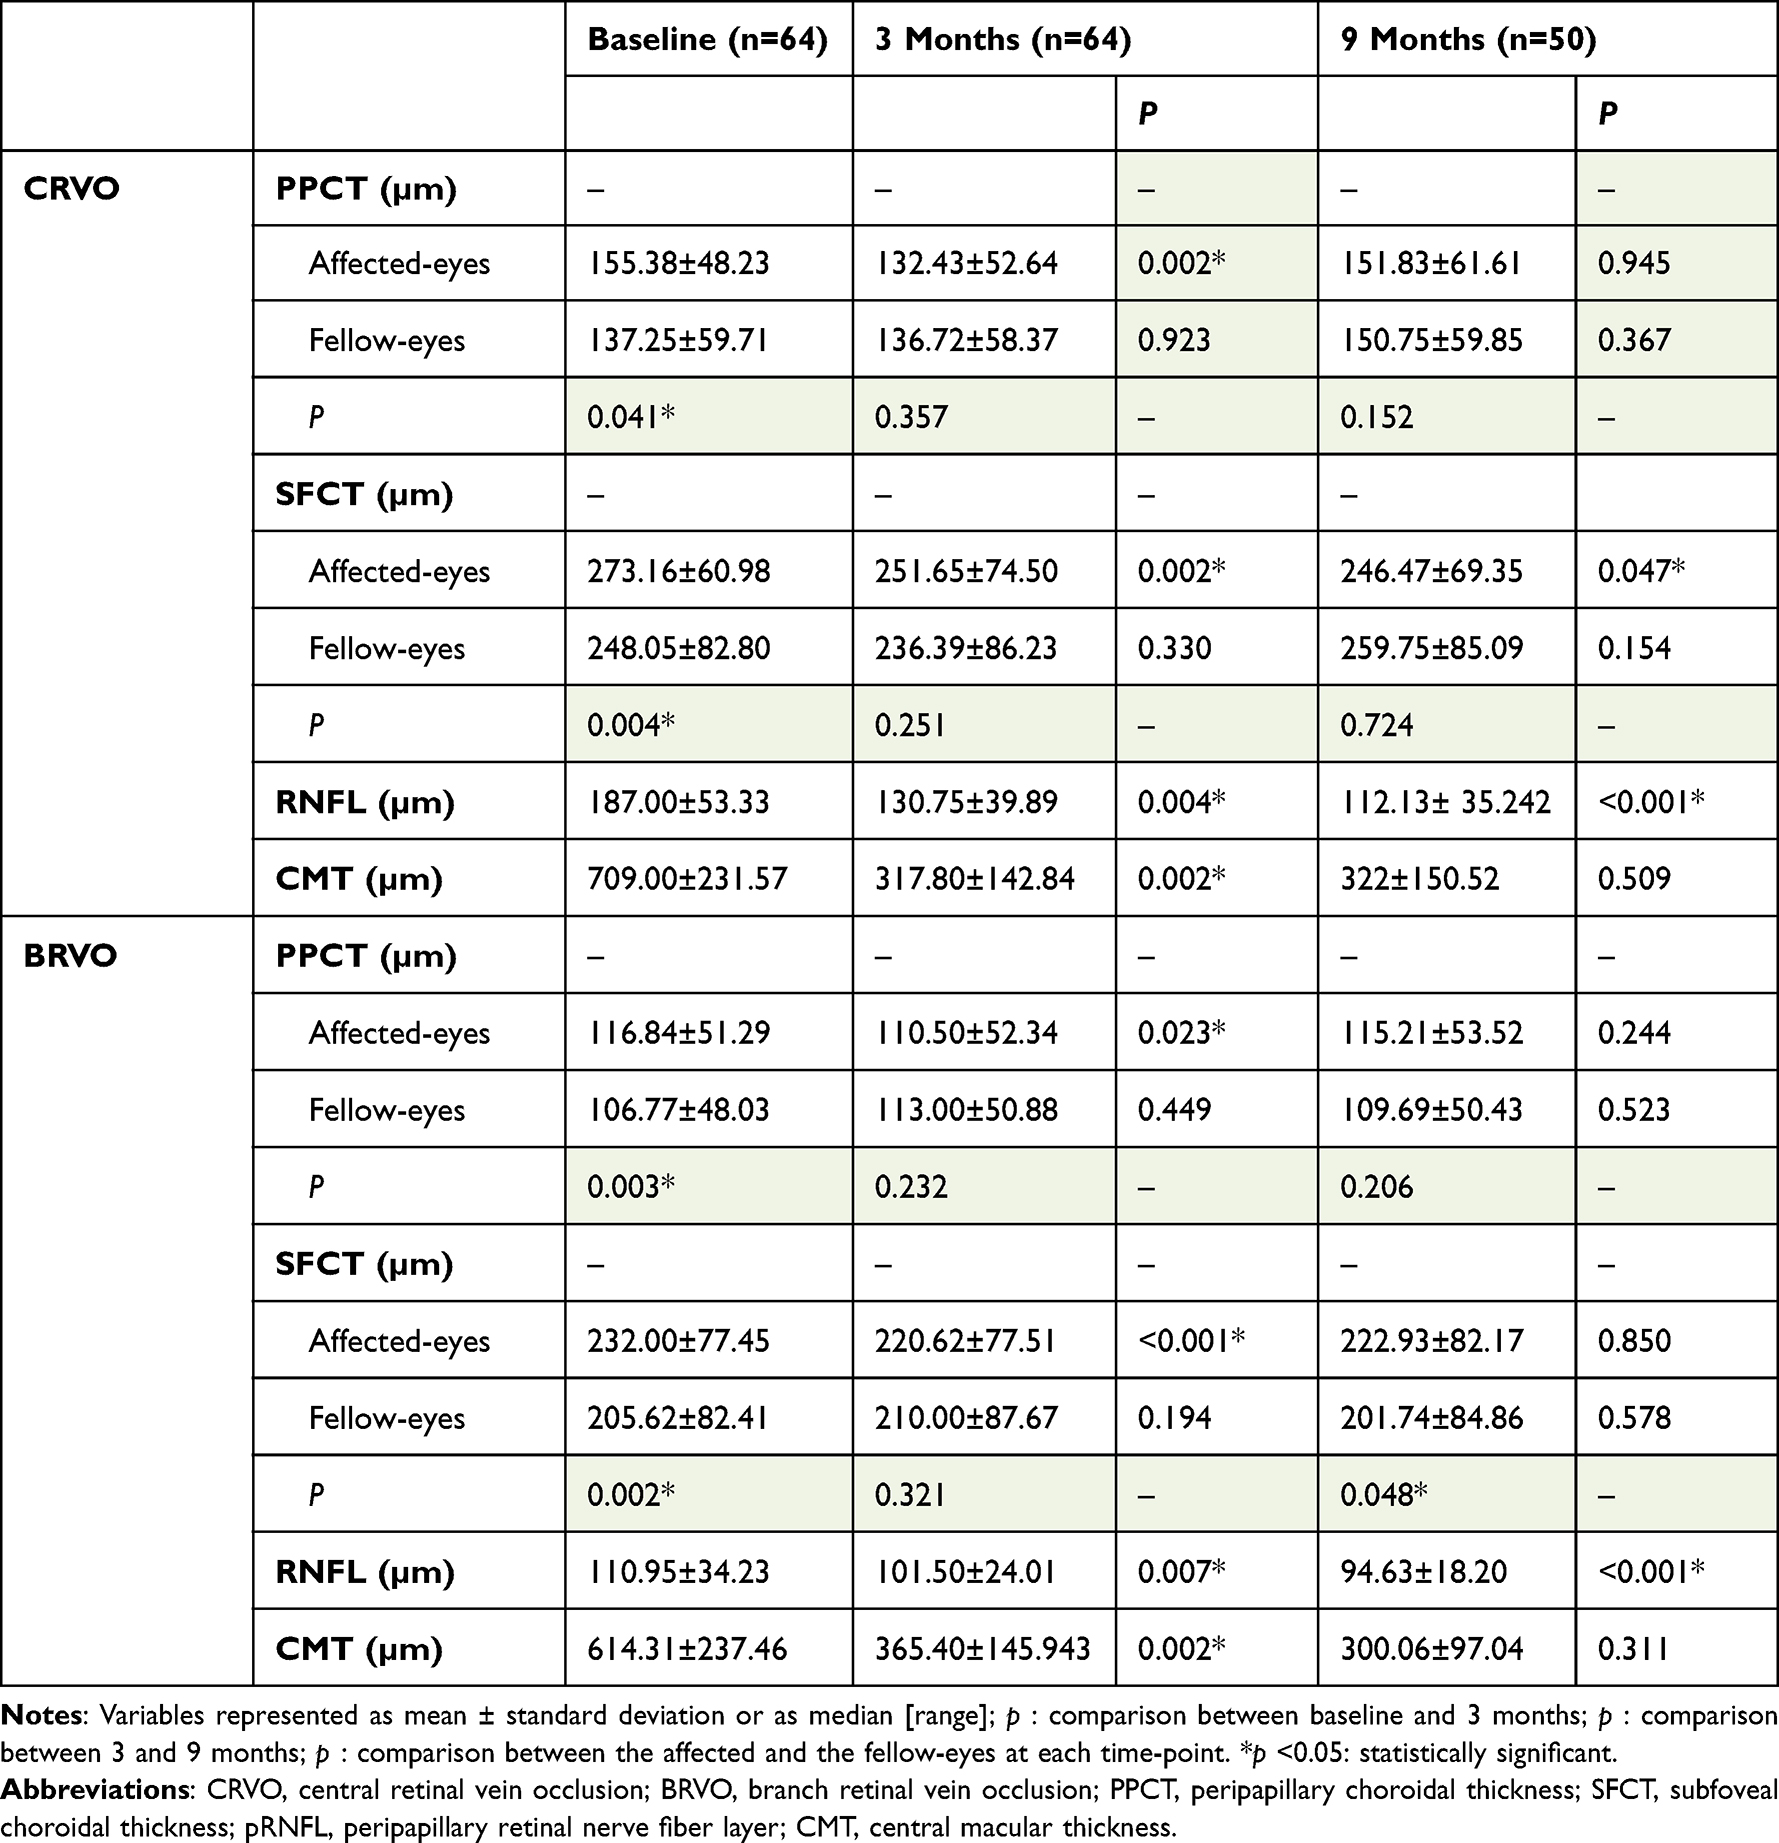 |
Table 2 SD-OCT Thickness Measurements During the Follow-Up in Patients with CRVO and BRVO |
In BRVO patients, affected eyes presented a statistically significant thicker baseline PPCT compared to the fellow eyes (116.84±51.29 µm vs 106.77±48.02 µm, p=0.003), but no statistical differences were found at 3 and 9 months (p=0.232 and p=0.206, respectively). The PPCT in the affected eyes presented a statistically significant decrease at 3 months compared to baseline (p=0.023), but remained stable afterward, at 9 months (p=0.244). There were also no significant PPCT changes in the fellow-eye over time (p>0.05) (Table 2).
Subfoveal Choroidal Thickness (SFCT)
In CRVO patients, affected eyes presented a significantly thicker baseline SFCT compared to the fellow eyes (273.16±60.98 µm vs 248.05±82.80 µm, p=0.004), but no statistically significant differences were found at 3 and 9 months (p=0.251 and p=0.724, respectively). The SFCT in the affected eyes presented a significant decrease in the first 3 months (p=0.002), and afterward, from 3 to 9 months (p=0.047). There were no significant SFCT changes in the fellow-eye over time (p>0.05) (Table 2).
In BRVO patients, affected eyes presented a significantly thicker baseline SFCT compared to the fellow eyes (232.00±77.45 µm vs 205.62±82.41 µm, p=0.002), and although there is no statistically significant differences between the affected and the fellow eyes at 3 months (p=0.321), PPCT is significantly thicker in the affected eyes at 9 months of follow-up (p=0.048). The SFCT in the affected eyes presented a statistically significant decrease at 3 months compared to the baseline (p<0.001), with no additional statistical change at 9 months (p=0.850). There were no significant SFCT changes in the fellow-eye overtime (p>0.05) (Table 2).
Peripapillary Retinal Nerve Fiber Layer (pRNFL)
In CRVO patients, the pRNFL of the affected eye was 187.00±53.33 µm at baseline and it was found to significantly decrease at 3 months (p=0.004) and, again, at 9 months (p<0.001). PPCT correlates with pRFFL at the baseline (r=0.389; p=0.01, Pearson coefficient correlation). No correlations were found between PPCT and pRNFL at 3 or 9 months (p>0.05, Pearson coefficient correlation).
In BRVO patients, the pRNFL of the affected eye was 110.95±34.23 µm at baseline, and significantly decreased at 3 months (p=0.007) and, again, at 9 months (p<0.001). No correlations were found between PPCT and pRNFL at any timepoint in BRVO (p>0.05, Pearson coefficient correlation).
Central Macular Thickness (CMT)
In CRVO patients, the CMT of the affected eye was 709.00±231.57 µm at baseline, significantly decreased at 3 months (p=0.002), with no further statistical change between 3 and 9 months (p=0.509). No correlations were found between SFCT and CMT at any time point (p>0.05).
In BRVO patients, the CMT of the affected eye was 614.31±237.46 µm at baseline and significantly decreased at 3 months (p=0.002), remaining stable between 3 and 9 months (p=0.311). No correlations were found between SFCT and CMT at any time point (p>0.05, Pearson correlation).
CRVO versus BRVO
Baseline PPCT of CRVO patients was significantly greater than in the BRVO subset of patients in both the affected and fellow eye (p=0.017 and p=0.014, respectively) (Table 3). At 3 months of follow-up, no statistically significant differences in PPCT were seen between CRVO and BRVO both in the affected and the fellow eye. Nevertheless, at 9 months, PPCT was significantly thicker in CRVO patients both in the affected and fellow eye (p=0.017 and p=0.001, respectively).
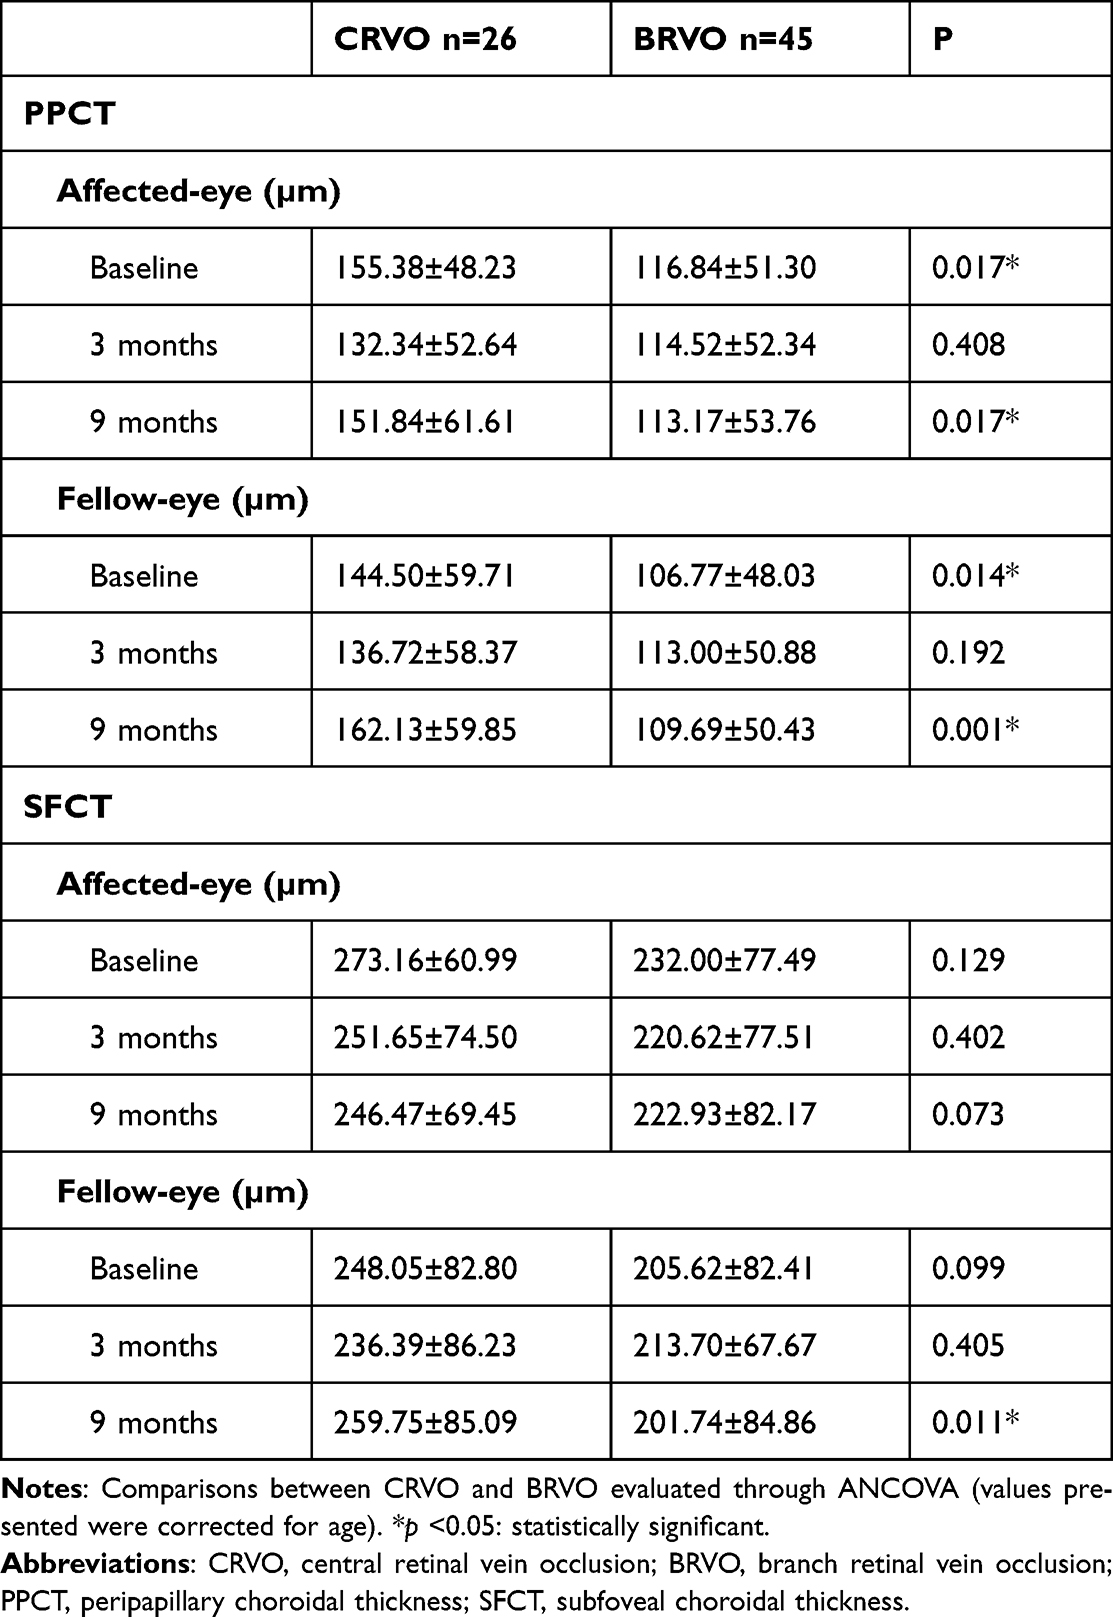 |
Table 3 Comparison of PPCT and SFCT Between CRVO and BRVO |
No statistically significant differences were found between CRVO and BRVO patients concerning the SFCT of both the affected and the fellow eye at baseline (p=0.129 and p=0.099, respectively). No significant differences were registered at 3 months, but a significantly thicker SFCT was found at 9 months on the CRVO fellow eyes compared to the BRVO fellow eyes. (Table 3).
Discussion
In our study, we found a significantly increased baseline PPCT and SFCT in the eyes affected with CRVO and BRVO when compared to their fellow unaffected eyes. Nevertheless, the choroidal thickness in the peripapillary and subfoveal location decreased significantly in the first 3 months after treatment. We also found that CRVO patients presented a statistically significant thicker peripapillary choroid at baseline compared to BRVO patients, both in the affected and unaffected eyes, but no statistically significant differences were found for the subfoveal choroid between both groups.
Retinal vein occlusions create a hypoxic environment that could increase the expression of intraocular VEGF. Subsequently, vascular hyperpermeability and dilation of the choroid could occur.13–16 We found that PPCT and SFCT of the affected eyes were statistically higher than in the fellow eyes after CRVO and BRVO. These findings agree with other studies that evaluated the SFCT after occlusions.17–20
Interestingly, in our study, after the acute event, there was a sudden statistically significant decrease in the PPCT and SFCT after anti-VEGF treatment, followed by a thickness stabilization in the remaining follow-up, both in CRVO and BRVO patients. These findings could be justified by a sudden decrease in the initial hypoxic stimulus, as well as by the repetitive use of anti-VEGF therapy throughout the time.18,19 Our findings corroborate previous data on the choroidal thickness variation after an occlusive event.11,20,21 On the contrary, PPCT and SFCT of the fellow eyes remained similar during the follow-up, and do not seem to be affected by the event. During the follow-up, the peripapillary and subfoveal choroidal responses were similar, strengthening the hypothesis of a generalized effect on the choroid due to the retinal occlusion event.
The CMT and pRNFL were higher after the acute event, as expected, in both groups due to the subsequent acute edema, decreasing along with the follow-up. pRNFL seems to correlate with PPCT at the baseline in BRVO, with a positive linear correlation. Nevertheless, no significant correlations were found during the following follow-up. Also, no correlations were found between PPCT and pRNFL or SFCT and CMT for CRVO eyes. As so, we believe that the retinal tissue’s response is not directly related to the choroid’s response. Similarly, we presume that the reduction of the hypoxic stimulus and the anti-VEGF therapy may act differently on the choroid and the retina during the follow-up, as they represent independent vascular structures.
CRVO patients presented a thicker PPCT at baseline than the BRVO group. Although we do not know the choroid status of the patients previous to the occlusion, we hypothesize that the thicker choroid in CRVO could indicate that CRVO leads to a higher ischemic insult, releasing more inflammatory mediators and VEGF and, consequently, promoting a higher increase in CT. However, during the follow-up period, no significant differences in PPCT were found between both groups, at least until 9 months post-treatment. Curiously, the SFCT, was similar in both groups throughout the entire follow-up, as previously described.20 Interestingly, the fellow eyes of CRVO patients also present higher PPCT, which could solely mean that this group of patients had a physiologically thicker choroid and that the occlusion would not be the cause of the difference between both groups.
We found no differences related to sex, AHT, DM, dyslipidemia, or the presence of glaucoma in patients with CRVO or BRVO. Additionally, we found no differences for IOP at baseline, time from symptoms onset to the first evaluation, and the total number of IV injections between both groups. Though no significant differences were found concerning age, since CRVO patients were significantly younger than BRVO patients, we performed another analysis comparing groups and adjusting for this parameter.
To the best of our knowledge, this was the first study evaluating sequentially PPCT and SFCT in more than two time points, both in CRVO and BRVO patients. Nevertheless, our study has some limitations. The short sample size and its retrospective observational nature are its major drawbacks. We also did not consider the presence of macular edema or the severity of retinal ischemia in the analysis. Moreover, we only included patients with good-quality OCT images. This may induce a selection data bias excluding the more severe occlusions from our analysis. Furthermore, choroidal thickness tends to variate with age, refractive error, and even daytime of measurement.22–24 In order to minimize these biases, although no age-specific groups were created, the comparisons were adjusted for this parameter, patients with spherical equivalent higher than 6D were excluded and patients’ assessment was performed between 2 pm and 8 pm.
Conclusion
In conclusion, in both CRVO and BRVO eyes, PPCT and SFCT are significantly thicker compared to the fellow eye, suggesting a possible increase in CT immediately after the occlusion, followed by a decrease at an early follow-up stage. Longer follow-up studies with larger samples could clarify the relation of choroidal thickness to the retinal vascular occlusive insult. However, this study shows that choroid may have a role in the pathophysiologic response of RVO. A further understanding of the relation between choroid thickness and retina response may provide an additional structural marker for predicting the prognosis of these patients.
Statements of Ethics
This research was done ethically and in accordance with the World Medical Association Declaration of Helsinki. Patients were treated according to the standard of care. No different approaches or treatments were performed. The Ethics Committee from São João Hospital approves retrospective review of the data when consented by the patients. Included data were anonymized. Patients were informed of the purpose of this study and agreed and consented to the use of their follow-up data for clinical research purposes.
Funding
This research received no specific grant from any funding agency in the public, commercial, or not-for-profit sectors.
Disclosure
Dr Susana Penas reports personal fees from Alimera, Bayer, Novartis, and Roche, outside the submitted work. The author reports no other conflicts of interest in this work.
References
1. Klein R, Klein BE, Moss SE, Meuer SM. The epidemiology of retinal vein occlusion: the Beaver Dam Eye Study. Trans Am Ophthalmol Soc. 2000;98:133–141.
2. Rogers S, McIntosh RL, Cheung N, et al. The prevalence of retinal vein occlusion: pooled data from population studies from the United States, Europe, Asia, and Australia. Ophthalmology. 2010;117(2):313–9.e1. doi:10.1016/j.ophtha.2009.07.017
3. Laouri M, Chen E, Looman M, Gallagher M. The burden of disease of retinal vein occlusion: review of the literature. Eye. 2011;25(8):981–988. doi:10.1038/eye.2011.92
4. Martínez F, Furió E, Fabiá MJ, et al. Risk factors associated with retinal vein occlusion. Int J Clin Pract. 2014;68(7):871–881. doi:10.1111/ijcp.12390
5. Fong AC, Schatz H. Central retinal vein occlusion in young adults. Surv Ophthalmol. 1993;37(6):393–417. doi:10.1016/0039-6257(93)90138-W
6. Ho M, Liu DT, Lam DS, Jonas JB. Retinal vein occlusions, from basics to the latest treatment. Retina. 2016;36(3):432–448. doi:10.1016/j.ajo.2013.04.008
7. Mrejen S, Spaide RF. Optical coherence tomography: imaging of the choroid and beyond. Surv Ophthalmol. 2013;58(5):387–429.
8. Tsuiki E, Suzuma K, Ueki R, Maekawa Y, Kitaoka T. Enhanced depth imaging optical coherence tomography of the choroid in central retinal vein occlusion. Am J Ophthalmol. 2013;156(3):543–547.
9. Lee EK, Han JM, Hyon JY, Yu HG. Changes in choroidal thickness after intravitreal dexamethasone implant injection in retinal vein occlusion. Br J Ophthalmol. 2015;99(11):1543–1549. doi:10.1136/bjophthalmol-2014-306417
10. Du KF, Xu L, Shao L, et al. Subfoveal choroidal thickness in retinal vein occlusion. Ophthalmology. 2013;120(12):2749–2750. doi:10.1016/j.ophtha.2013.08.031
11. Kang HM, Choi JH, Koh HJ, Lee CS, Lee SC. Significant reduction of peripapillary choroidal thickness in patients with unilateral branch retinal vein occlusion. Retina. 2018;38(1):72–78. doi:10.1097/IAE.0000000000001495
12. Jiang R, Wang YX, Wei WB, Xu L, Jonas JB. Peripapillary choroidal thickness in adult Chinese: the Beijing eye study. Invest Ophthalmol Vis Sci. 2015;56(6):4045–4052. doi:10.1167/iovs.15-16521
13. Pe’er J, Shweiki D, Itin A, Hemo I, Gnessin H, Keshet E. Hypoxia-induced expression of vascular endothelial growth factor by retinal cells is a common factor in neovascularizing ocular diseases. Lab Invest. 1995;72(6):638–645.
14. Marneros AG, Fan J, Yokoyama Y, et al. Vascular endothelial growth factor expression in the retinal pigment epithelium is essential for choriocapillaris development and visual function. Am J Pathol. 2005;167(5):1451–1459. doi:10.1016/S0002-9440(10)61231-X
15. Campochiaro PA, Hafiz G, Shah SM, et al. Ranibizumab for macular edema due to retinal vein occlusions: implication of VEGF as a critical stimulator. Mol Ther. 2008;16(4):791–799. doi:10.1038/mt.2008.10
16. Ach T, Hoeh AE, Schaal KB, Scheuerle AF, Dithmar S. Predictive factors for changes in macular edema in intravitreal bevacizumab therapy of retinal vein occlusion. Graefes Arch Clin Exp Ophthalmol. 2010;248(2):155–159. doi:10.1007/s00417-009-1167-6
17. Rayess N, Rahimy E, Ying GS, et al. Baseline choroidal thickness as a predictor for treatment outcomes in central retinal vein occlusion. Am J Ophthalmol. 2016;171:47–52. doi:10.1016/j.ajo.2016.08.026
18. Chung YK, Shin JA, Park YH. Choroidal volume in branch retinal vein occlusion before and after intravitreal anti-VEGF injection. Retina. 2015;35(6):1234–1239. doi:10.1097/IAE.0000000000000455
19. Okamoto M, Yamashita M, Sakamoto T, Ogata N. Choroidal blood flow and thickness as predictors for response to anti-vascular endothelial growth factor therapy in macular edema secondary to branch retinal vein occlusion. Retina. 2018;38(3):550–558. doi:10.1097/IAE.0000000000001566
20. Tang F, Xu F, Zhong H, et al. Comparison of subfoveal choroidal thickness in eyes with CRVO and BRVO. BMC Ophthalmol. 2019;19(1):133. doi:10.1186/s12886-019-1143-9
21. Lee NE, Kang HM, Choi JH, Koh HJ, Lee SC. Sectoral changes of the peripapillary choroidal thickness in patients with unilateral branch retinal vein occlusion. Int J Ophthalmol. 2019;12(3):472–479. doi:10.18240/ijo.2019.03.19
22. Lee SW, Yu SY, Seo KH, Kim ES, Kwak HW. Diurnal variation in choroidal thickness in relation to sex, axial length, and baseline choroidal thickness in healthy Korean subjects. Retina. 2014;34(2):385–393. doi:10.1097/IAE.0b013e3182993f29
23. Singh SR, Rasheed MA, Goud A, Sahoo NK, Vupparaboina KK, Chhablani J. Diurnal variation in subfoveal and peripapillary choroidal vascularity index in healthy eyes. Indian J Ophthalmol. 2019;67(10):1667–1672. doi:10.4103/ijo.IJO_2063_18
24. Wakatsuki Y, Shinojima A, Kawamura A, Yuzawa M. Correlation of aging and segmental choroidal thickness measurement using swept source optical coherence tomography in healthy eyes. PLoS One. 2015;10(12):e0144156. doi:10.1016/j.survophthal.2012.12.001
 © 2022 The Author(s). This work is published and licensed by Dove Medical Press Limited. The
full terms of this license are available at https://www.dovepress.com/terms
and incorporate the Creative Commons Attribution
- Non Commercial (unported, 3.0) License.
By accessing the work you hereby accept the Terms. Non-commercial uses of the work are permitted
without any further permission from Dove Medical Press Limited, provided the work is properly
attributed. For permission for commercial use of this work, please see paragraphs 4.2 and 5 of our Terms.
© 2022 The Author(s). This work is published and licensed by Dove Medical Press Limited. The
full terms of this license are available at https://www.dovepress.com/terms
and incorporate the Creative Commons Attribution
- Non Commercial (unported, 3.0) License.
By accessing the work you hereby accept the Terms. Non-commercial uses of the work are permitted
without any further permission from Dove Medical Press Limited, provided the work is properly
attributed. For permission for commercial use of this work, please see paragraphs 4.2 and 5 of our Terms.
Recommended articles
Subfoveal Choroidal Thickness After Successful Retinal Detachment Repair with Persistent Subretinal Fluid at the Macula
Mansour AM, Parodi MB, Uwaydat SH, Lima LH, Charbaji S, Casella AM, López-Guajardo L, Belotto S, Wu L, Schwartz SG, Smiddy WE, Hassoun MM, Pérez-Salvador García E, Mansour HA, Elnahry AG, Hamam RN
Clinical Ophthalmology 2025, 19:1847-1854
Published Date: 11 June 2025
Anti-Vascular Endothelial Growth Factor Combined with Dexamethasone Implant Therapy for Macular Edema: A Randomized Controlled Trial
Ma Y, Wang J, Yuan M, Zeng Z, Tan Y, Cao L, Sun X
Drug Design, Development and Therapy 2026, 20:587166
Published Date: 3 March 2026