Back to Journals » Hepatic Medicine: Evidence and Research » Volume 13
Perioperative Evolution of Sodium Levels in Cirrhotic Patients Undergoing Liver Transplantation: An Observational Cohort and Literature Review
Authors Zamberg I, Maillard J, Assouline B, Tomala S, Keli Barcelos G, Aldenkortt F, Mavrakanas T, Andres A, Schiffer E
Received 13 May 2021
Accepted for publication 8 July 2021
Published 7 August 2021 Volume 2021:13 Pages 71—82
DOI https://doi.org/10.2147/HMER.S320127
Checked for plagiarism Yes
Review by Single anonymous peer review
Peer reviewer comments 3
Editor who approved publication: Dr Gerry Lake-Bakaar
Ido Zamberg,1,2 Julien Maillard,1,* Benjamin Assouline,1,* Simon Tomala,1 Gleicy Keli-Barcelos,1 Florence Aldenkortt,1 Thomas Mavrakanas,2,3 Axel Andres,2,4 Eduardo Schiffer1,2
1Division of Anesthesiology, Department of Anesthesiology, Clinical Pharmacology, Intensive Care and Emergency Medicine, Geneva University Hospitals, Geneva, Switzerland; 2Faculty of Medicine University of Geneva, Geneva, Switzerland; 3Department of Medicine, McGill University Health Centre, Montreal, QC, Canada; 4Division of Transplantation, Department of Surgery, University Hospitals of Geneva, Geneva, Switzerland
*These authors contributed equally to this work
Correspondence: Eduardo Schiffer
Division of Anesthesiology, Department of Anesthesiology, Clinical Pharmacology, Intensive Care and Emergency Medicine, Geneva University Hospitals, Rue Gabrielle-Perret-Gentil 4, Geneva, CH-1205, Switzerland
Tel +41 22 372 30 60
Fax +41 22 372 76 90
Email [email protected]
Background & Aims: Hyponatremia is an important predictor of early death among cirrhotic patients in the orthotopic liver transplantation (OLT) waiting list. Evidence exists that prioritizing OLT waiting list according to the MELD score combined with plasma sodium concentration might prevent pre transplantation death. However, the evolution of plasma sodium concentrations during the perioperative period of OLT is not well known. We aimed to describe the evolution of perioperative sodium concentration during OLT and its relation to perioperative neurohormonal responses.
Methods: Twenty-seven consecutive cirrhotic patients who underwent OLT were prospectively included in the study over a period of 27 months. We studied the evolution of plasma sodium levels, the hemodynamics, the neurohormonal response and other biological markers during the perioperative period of OLT.
Results: Among study’s population, four patients had hyponatremia before OLT, all with Child cirrhosis. In patients with hyponatremia, plasmatic sodium reached normal levels during surgery, and sodium levels remained within normal ranges 1 day, 7 days, as well as 6 months after surgery for all patients. Creatinine clearance was decreased significantly during the perioperative period, while creatinine and cystatin C levels increased significantly. Neutrophil gelatinase-associated lipocalin (NGAL) and vasopressin levels did not change significantly in this period. Plasma renin activity, concentrations of norepinephrine and brain natriuretic peptide varied significantly during the perioperative period.
Conclusion: In our study, plasmatic sodium concentrations among hyponatremic cirrhotic patients undergoing OLT seem to reach normal levels after OLT and remain stable six months after surgery providing more evidence for the importance of sodium levels in prioritization of liver transplant candidates. Further investigation of rapid correction and stabilization of sodium levels after OLT, as observed in our study, would be of interest in order to fully understand the mechanisms involved in cirrhosis-related hyponatremia, its prognostic value and clinical implications.
Keywords: liver, transplantation, hyponatremia, cirrhosis, MELD score
Introduction
Patients with compensated cirrhosis have an imbalance of sodium excretion. While the glomerular filtration rate remains within normal values, an increased sodium tubular reabsorption decreases urinary sodium excretion. Following a sodium load, kidneys are incapable to excrete additional sodium overload. Activation of the mineralocorticoid receptor by aldosterone1,2 or cortisol (in patients with impaired 11β-hydroxysteroid dehydrogenase activity)3 would explain mentioned sodium reabsorption. In contrast to patients without end-stage liver disease who can excrete a solute free water overload, most cirrhotic patients with ascites cannot. The impaired solute-free water excretion is the consequence of increased secretion of arginine vasopressin from the neurohypophysis stimulated by arterial underfilling.1,4 In normal subjects, osmotic stimulus controls arginine vasopressin secretion while in patients with advanced cirrhosis, arterial underfilling by decreasing the stretch on arterial baroreceptors, overrides the osmotic stimulus and stimulates the synthesis and release of the hormone. In this group of patients who retain solute-free water in an amount disproportionate to sodium retention, hyponatremia occurs concomitantly to an increase in extracellular fluid volume. Additionally, patients with cirrhosis and ascites may develop liver-related renal dysfunction also known as hepatorenal syndrome5,6 which may result in acute kidney or chronic kidney disease.7
Low plasma sodium concentration is an important predictor of early death in cirrhotic patients on the waiting list for orthotopic liver transplantation (OLT)8–13 and is also associated with an increased number of complications following OLT regardless of the clinical condition causing hyponatremia.9,14,15 Whether the prognostic value of hyponatremia is due to the fact that it is a marker of the disease’s stage, its direct negative effects on several organs’ function or both is unknown.9 Kim et al16 had shown, through a retrospective analysis of adult candidates registered within the Organ Procurement and Transplantation Network in 2005 and 2006, that prioritizing OLT waiting list according to the MELD score combined with plasma sodium concentration could have prevented deaths within patients in the list. In addition, Sharma17 et al. have also shown an increase in survival rate related to hyponatremia among patients with MELD scores >11 providing more evidence to the importance natremia control in the pre-OLT period. Finally, evidence concerning the importance of hyponatremia in prioritizing OLT candidates resulted in the introduction of the MELD-Na score in 2016, which takes into account sodium levels in transplant allocation and have shown improved waitlist outcomes with significant benefits to hyponatremic patients.18
To be noted, rapid or overcorrection of hyponatremia may as well result in negative outcomes baring the risk of central pontine myelinolysis, a potentially life-threatening neurologic complication.19 Therefore, further understanding of sodium level evolution during the peri-operative period could provide more understanding and insights for hyponatremia-related treatment plans during OLT.
While it seems clear that hyponatremia is a risk factor for mortality in the pre-OLT period, the evolution of sodium levels and its relation to neurohormonal response during the perioperative period of OLT was not clearly investigated. In this observational cohort study, we monitored plasma sodium concentration and multiple biological markers including the neurohormonal response in the perioperative period of OLT in 27 consecutive patients who underwent OLT in our institution. Our aim was to describe the evolution of perioperative sodium concentration during OLT and its relation to perioperative neurohormonal responses.
Patients and Methods
Patient Selection
Twenty-seven consecutive patients (age 56 [23–65] years) were included in the study over a period of 27 months. Sample size correlates to the annual average number of liver transplantations in our institution. The ethics committee of our institution (Hôpitaux Universitaires de Genève, Geneva, Switzerland) approved the protocol and written informed consent was obtained from each patient at the time of inclusion in the waiting list.
The original study protocol was registered in the ISRCTN register (N° 43452247) with the objective to describe the renal and neurohormonal responses during liver transplantation. In the current paper, we performed an ad-hoc data analysis focusing on variations in serum sodium levels. In fact, there is increasing evidence showing the importance of hyponatremia as an independent predictor of mortality after listing for OLT,7–9,12,14 and as so, its potential value in prioritizing patients for OLT.
Preoperative Evaluation (PREOLT)
Patients were included at the time they were admitted in the waiting list for OLT. Assessment of liver disease was based on medical history, physical examination, laboratory tests, hemodynamic parameters, liver imaging and histology. The evolution of the disease during the waiting period was assessed every three months. PREOLT parameters were recorded during the last patient evaluation preceding OLT. Hyponatremia was defined by sodium levels <135 mmol/L as per standard definition.20
Anesthetic Management and Surgery
Anesthesia was induced with continuous infusion of midazolam, sulfentanyl, and atracurium with conformity to our institution’s protocol. Each patient has a radial artery catheter for continuous arterial blood pressure monitoring and blood sampling, a triple-lumen central venous catheter (HydrocathA, Ohmeda, Swindon, UK) for fluid perfusion and drug administration, and a flow-directed thermodilution pulmonary artery catheter (CCOmbo, Edwards Lifesciences, Irvine, CA, USA) for pulmonary artery pressure, mixed venous oxygen saturation (SvO2), and cardiac output measuring (Vigilance, Edwards Lifesciences, Irvine, CA, USA). Perioperative normothermia [35.5–37°C] was maintained with warming blankets. Following resection of the native liver, graft implantation was performed with end-to-end anastomosis. To avoid congestion of splanchnic organs, renal hypertension, and decreased venous return induced by the concomitant cross-clamping of portal vein and inferior vena cava, a bypass was placed according to the hemodynamic tolerance to portal and inferior vena cava clamping. Indications for porto-femoral to axillary vein bypass were a decreased (>30%) cardiac index or decrease in mixed-venous hemoglobin oxygen saturation below 70% when clamping both the portal vein and the inferior vena cava. The extracorporeal system included a nonocclusive centrifugal pump (model 540 Bio-Medicus, Medtronic, Kerkrade-West, Holland), heparin-coated tubings (Medtronic, Kerkrade-West, Holland) and catheters (Carmeda AB, Töby, Sweden).
Liver grafts that had been preserved at 4°C in University of Wisconsin solution were flushed after the completion of the lower caval anastomosis with 4% human albumin (ZLB Behring AG, Bern, Switzerland) to obtain potassium concentrations in the outflow perfusate that steadily decreased below 12 mmol/L. After upper caval and portal anastomosis, the graft was revascularized with portal flow and the veno-venous bypass terminated. Hepatic artery anastomosis followed by bile duct reconstruction was then performed.
To maintain stable hemodynamic parameters, crystalloids (Ringer lactate containing 6 g/L sodium salts) were infused at a rate of 5 to 10 mL/kg/hour to maintain the following criteria: heart rate <100 beats per min, mean arterial pressure >60 mmHg, right atrial pressure between 5 and 10 mmHg and pulmonary artery occlusion pressure between 8 and 14 mmHg. Red blood cells (in saline adenine glucose–mannitol solution) were transfused when serum hemoglobin concentration was ≤8 g/dL during surgery and ≤9 g/dL in the postoperative period. Fresh-frozen plasma was administered according to coagulation status as documented by thromboelastography and according to surgical clinical assessment of bleeding during surgery. Platelets were transfused during pre- and post-operative periods when platelets count decreased below 30,000 per μL. No other coagulation factors were administered, and no intraoperative blood salvage was used. All intravenous fluids except platelets were administered through a fluid warming device.
Hemodynamic Measurements and Blood Collection in the Perioperative Period
Blood samples (20 mL) and urine samples (5 mL) were collected 1 hour after induction of anesthesia (ANE sample), at the end of the anhepatic phase (ANH sample), one hour after graft reperfusion (POST1h sample), and in the ICU at 24 hours (POST24h sample) after liver reperfusion. At each time point, systemic and pulmonary hemodynamic parameters and urine flow were measured. The creatinine clearance was calculated according to the Cockcroft-Gault formula. Plasma Cystatin C was also measured in the perioperative period. Sodium excretion fraction was calculated according to following formula: FENA = ([urine sodium] x [plasma creatinine])/([plasma sodium] x [urine creatinine]). Sodium concentration was measured within plasma, serum and urine using indirect potentiometry.21
Hormone Measurements
Blood samples were collected into tubes containing ethylene diamine tetra acetic acid. Tubes were placed on ice and thereafter centrifuged for 15 min at 2000 g (2–8°C). Plasma samples were stored at −80°C until analysis.
Plasma renin activity was assessed at 37°C by direct radioimmunoassay measurement of angiotensin I production from endogenous substrates. In our institution, renin activity in supine position ranges from 0.23 to 1.55 ng/mL/hour. Free catecholamines were measured by liquid chromatography with amperometric detection. Blood (1 mL) was extracted on activated alumina at pH 8.6 and catecholamines were eluted in acidic media before injection into the chromatographic system. The detection limit was 10 pg/injection. Arginine vasopressin was determined by a radioimmunoassay after an extraction procedure using a reversed-phase column extraction according to the manufacturer’s instructions (Bühlmann Laboratories AG, Allschwil, Switzerland). Relative affinity of the vasopressin antiserum was given as follows: 100% for arginine vasopressin, 0.25% for lysine vasopressin, and 0.001% for oxytocin and vasotocin. The detection limits were 0.35 pg/mL or 0.32 pmol/L of plasma. Plasmatic NT-proBrain Natriuretic Peptide (pro-BNP) was assessed on Elecsys (Roche, Basel, Switzerland) and DXI (Beckman Coulter, Brea, CA, USA) auto-analyzers. NTpro-BNP <125 pg/mL is considered as normal values. Neutrophil gelatinase-associated lipocalin (NGAL) ELISA was performed in microwells coated with a monoclonal capture antibody to human NGAL. Bound NGAL was detected with a horseradish peroxi-dase (HRP)-conjugated monoclonal detection antibody and the assay was developed by incubation with a color-forming substrate. Kit 037, BioPorto Diagnostics, DK-2820 Gentofte, Denmark.
Postoperative Evaluation (POSTOLT)
Biological parameters were evaluated in all patients 1 hour, 24 hours and 6 months after OLT (POSTOLT).
Data Analysis
All 27 patients were included in the analysis. In the perioperative periods (ANE, ANH, POST1h, POST24h), variables were compared by MANOVA with repeated measurements using SAS JMP© version 14.0. Mauchly’s test of sphericity was then conducted to test for violation of sphericity. If the sphericity chi-square was significant p values were shown according to Greenhouse-Geisser (G-G) multivariate test. However, if sphericity chi-square was not significant p values shown were the univariate unadjusted values. Other variables were compared by a Student’s T-Test using Stata© Version 16.1.
Results
Characteristics of Patients and Surgery
Between August 2010 and November 2015, twenty-seven patients consisting of 22 males and 5 females who underwent OLT were included at our institution. Characteristics of patients are summarized in Table 1. The etiologies of cirrhosis were alcohol abuse (n = 9), hepatitis (n = 13), biliary (n = 2), and others (n = 3). Six patients had a Class A Cirrhosis as defined by the Child-Pugh classification,22 eight were classified as Class B, and 13 had a Class C Cirrhosis. Listing was done according to national transplant allocation criteria.23
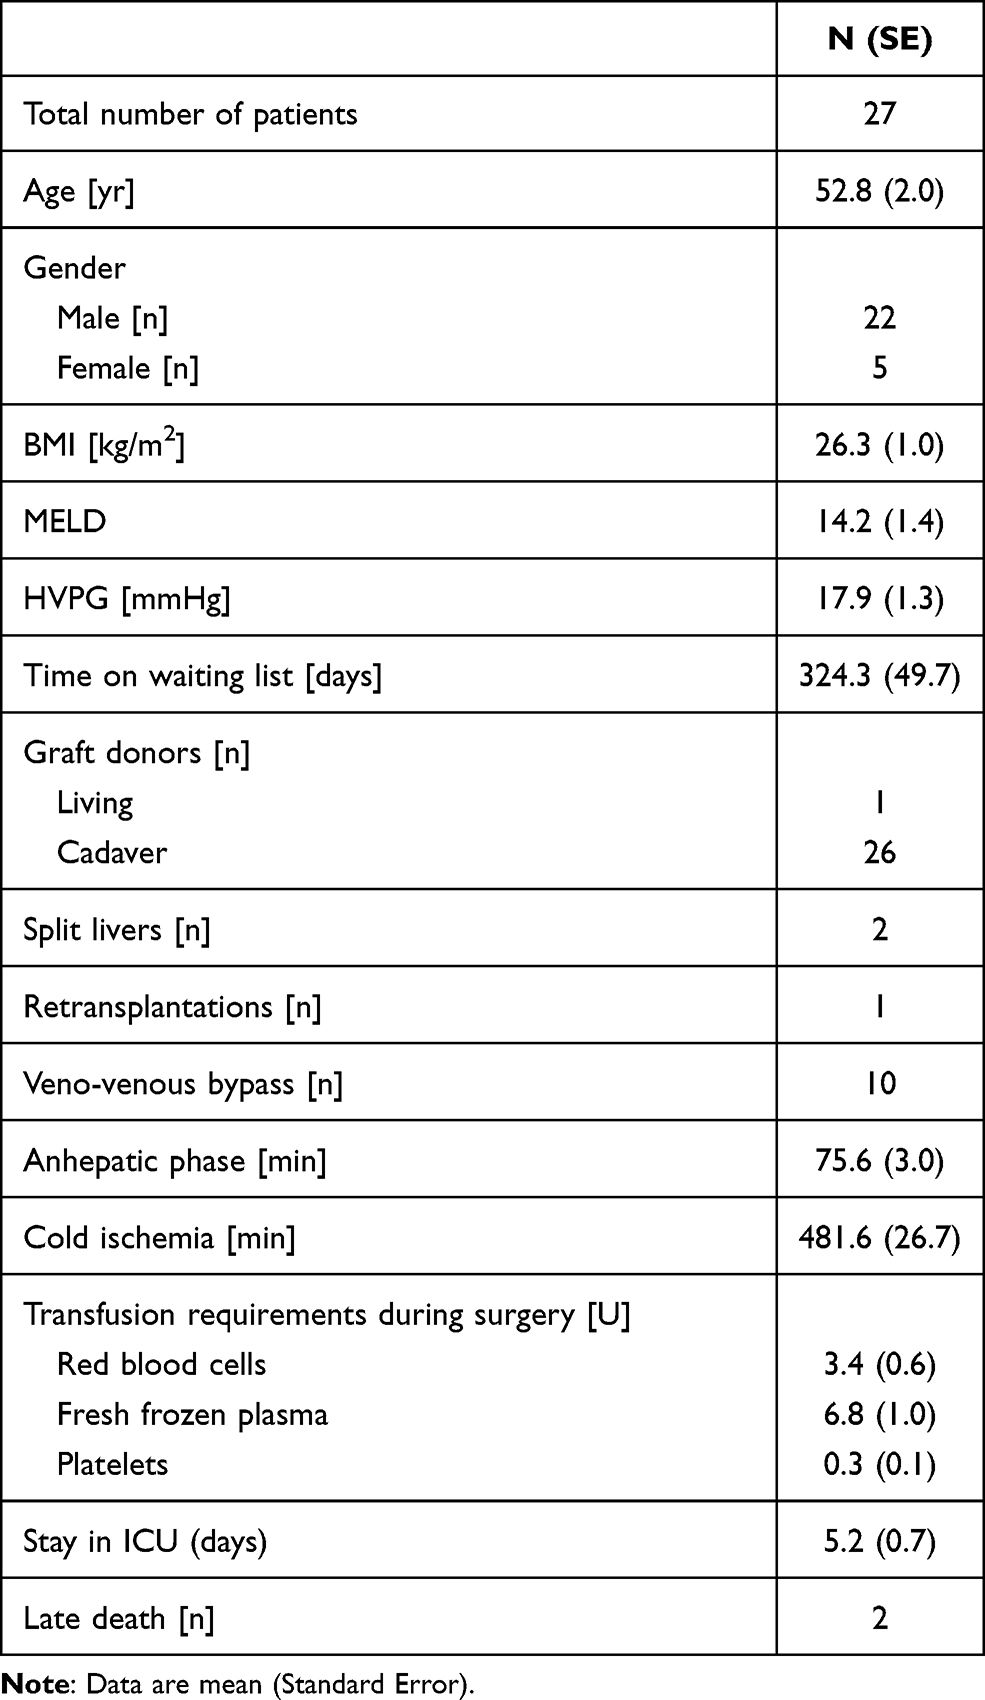 |
Table 1 Patients’ Characteristics and Surgical Intervention Related Information |
One patient obtained a living donor, and two had split livers. The remaining patients received whole cadaveric liver graft, including one for retransplantation. Among all patients, ten had venovenous bypass. Mean time spent on the waiting list was 343.3 days (SE = 49.7, Table 1). During surgery, the average length of the anhepatic phase and cold ischemia were 75.6 (SE = 3.0, Table 1.) minutes and 481.6 (SE = 26.7, Table 1) minutes, respectively. Red blood cells and platelet requirements are summarized in Table 1. One patient died during the study period. The mean time spent in ICU was 5.2 days (SE = 0.7, Table 1).
Plasma Sodium Concentration, Renal Function and OLT
Four patients had sodium levels <135 mmol/L in the preoperatory stage. All had a ChildC Cirrhosis. Interestingly, plasma sodium concentrations varied during the observation period and hyponatremia occurred concomitantly to complications (digestive hemorrhage, bacterial peritonitis and decompensated ascites) as illustrated for a single patient in Figure 1. During the perioperative surgical period, the sodium concentration varied and increased significantly (p < 0.01, Table 2, Figure 2A) and reached normal levels for all patients during the anhepatic phase. To be noted, correction of sodium levels in the preoperative stage among the four initially hyponatremic patients (Figure 3) was not associated with adverse outcomes. Specifically, no central pontine myelinolysis was observed. Six patients had a plasma sodium concentration lower than 135 mmol/L at day seven after OLT, within which three were the same patients who presented with hyponatremia before the surgery. At six months following OLT, sodium levels increased significantly (p = 0.01, Table 3) when compared to the pre-operatory period and only one patient had sodium levels <135 mmol/L. The latter was not associated with worst outcomes in the observation period.
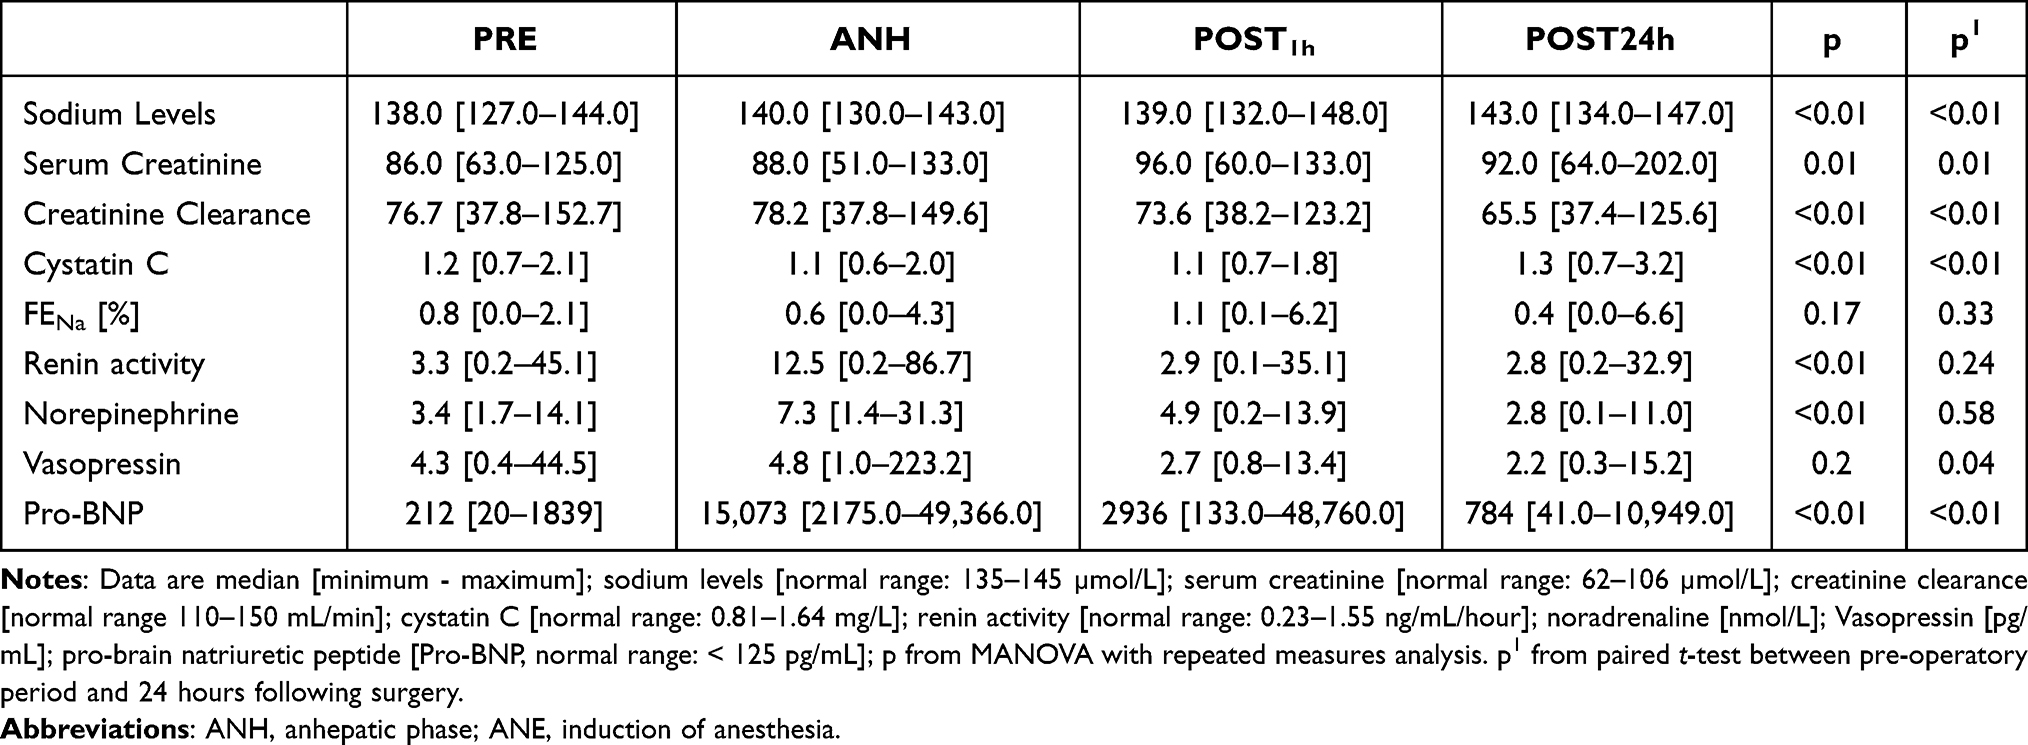 |
Table 2 Renal and Neurohormonal Responses During Surgery and 24 h After Graft Reperfusion |
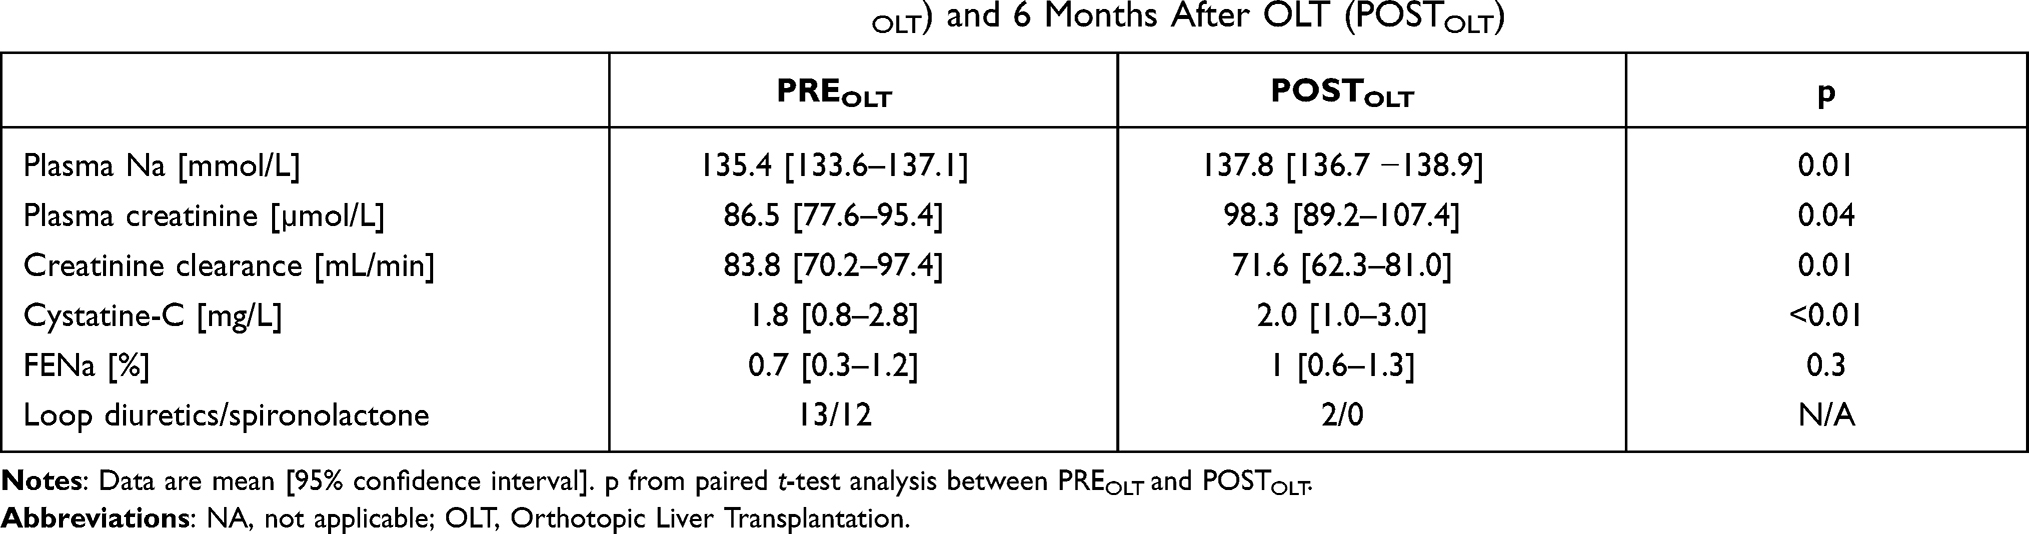 |
Table 3 Renal Function in the Preoperative Period (PREOLT) and 6 Months After OLT (POSTOLT) |
The fractional extraction of sodium did not significantly increase from the PREOLT to the POSTOLT periods (p = 0.3, Table 3). Serum creatinine levels as well as cystatin C levels increased significantly (p = 0.04 and p < 0.01, respectively, Table 2.) and creatinine clearance decreased significantly (p = 0.01, Table 2.) at six months following OLT as compared to the preoperatory period.
Systemic Hemodynamic and Biological Parameters in the Perioperative Period
Pulmonary and systemic hemodynamics were measured after induction of anesthesia (ANE), during the ANH, 1 hour (POST1h) and 24 hours (POST24h) after graft reperfusion and are summarized in Table 4. All parameters but the central venous pressure varied significantly during the perioperative period. Nevertheless, at the POST24h period, cardiac index, systemic vascular resistances as well as pulmonary vascular resistance values were similar to those in the ANE stage.
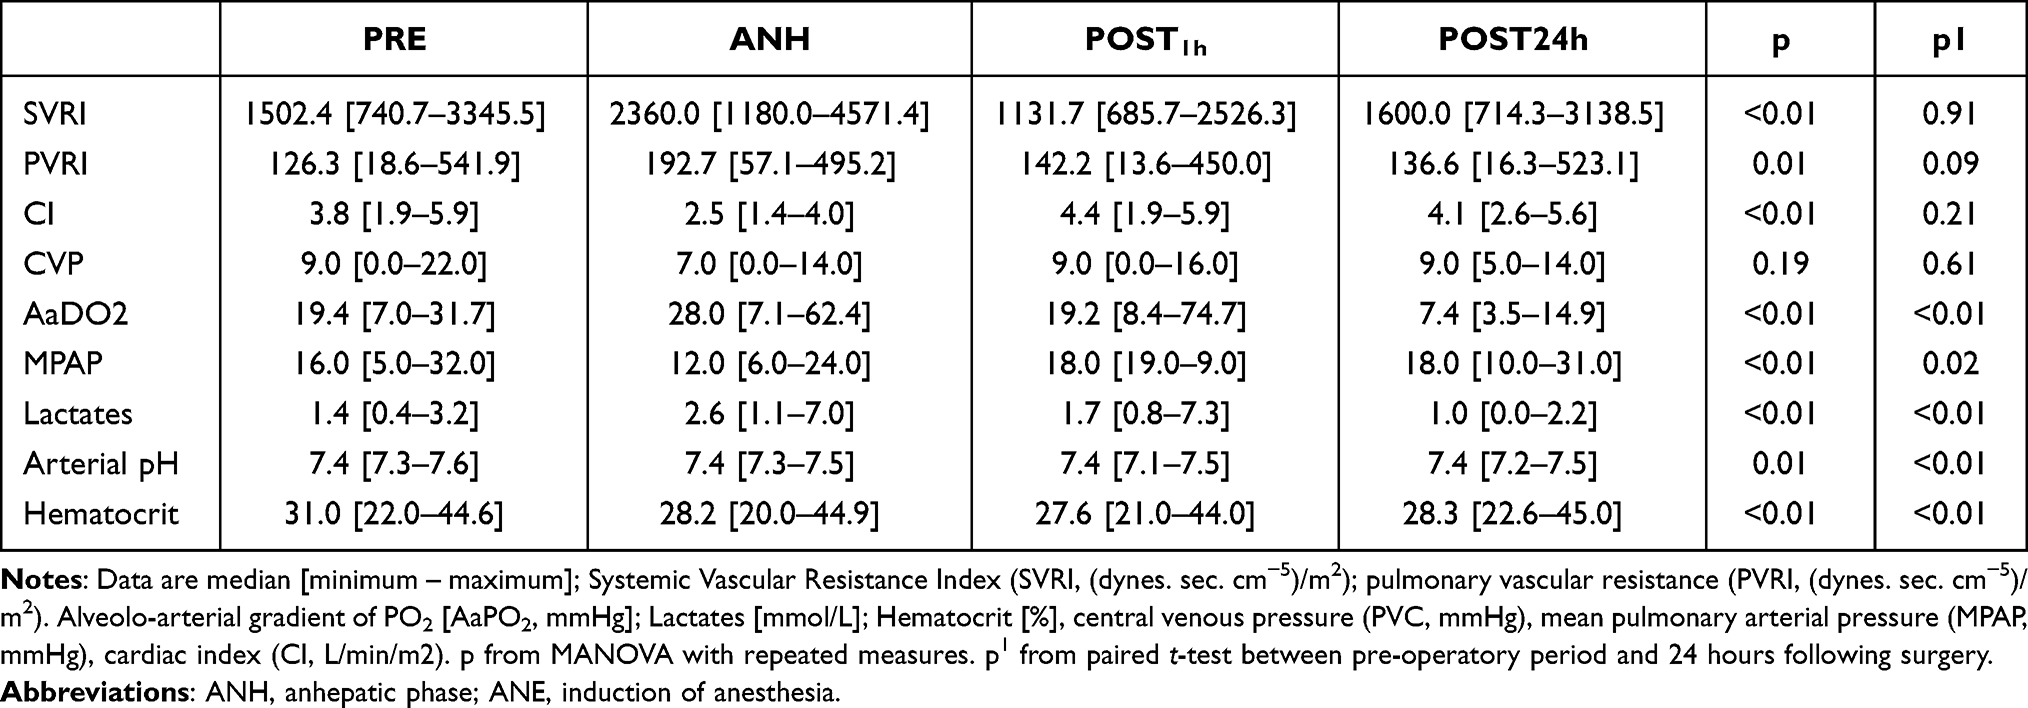 |
Table 4 Systemic and Pulmonary Hemodynamics and Additional Measurements During the Perioperative Period of OLT |
Renal and Neurohormonal Responses During Surgery and 24 h After Graft Reperfusion
During the perioperative period, plasma concentrations of both creatinine (p = 0.01, Table 2, Figure 2B) and cystatin C (p < 0.01, Table 2. Figure 2D) increased significantly, while creatinine clearance decreased significantly (p = 0.01, Table 2, Figure 2C). Neutrophil gelatinase-associated lipocalin (NGAL) levels did not change significantly between the ANH and the POST24h periods (240 [CI 95% 195–284] ng/mL vs 245 [CI 95% 179–311] ng/mL, p = 0.89).
The plasma renin activity and concentrations of norepinephrine, and brain natriuretic peptide varied significantly during the perioperative period (p < 0.01, Table 2) while vasopressin levels did not significantly change during surgery (p = 0.2, Table 2) though were significantly decreased 24 hours after surgery (p = 0.04, Table 2).
Discussion
Description of the perioperative evolution of sodium levels and neurohormonal response in patients with cirrhotic liver disease undergoing OLT was the main objective of our paper. All patients with hyponatremia before OLT had Child class C cirrhosis. Low plasma sodium levels were corrected during the pre-operative period, probably due to crystalloids infusion during transplantation surgery and remained within normal ranges 1 day, 7 days as well as 6 months after surgery. This correction was not associated with adverse outcomes within study’s observation period. Specifically, no central pontine myelinolysis was observed.
Mechanisms of Cirrhosis Related Hyponatremia
Hyponatremia in cirrhosis is primarily the result of solute-free water retention exceeding that of sodium.24 The proposed mechanism is splanchnic arterial vasodilatation leading to reduced systemic vascular resistance and the release of various neurohormones resulting in hypervolemic hyponatremia (Figure 4). The degree of activation of these neurohumoral mechanisms correlates directly to the degree of portal hypertension.25 Sodium concentration is therefore an important parameter to be considered before OLT.
Several studies emphasize the importance of sodium levels in the assessment for OLT priority within potential candidates. Hyponatremia <130 mmol/L was shown to be an independent predictor of mortality after listing, as lower sodium levels at inclusion in the waiting list were associated with 3- and 12-month decreased survival.8 A clear cutoff for the association between hyponatremia and survival after listing is not yet well defined and differ between studies: <135 mmol/L,13 <130 mmol/L,26 or 126 mmol/L27 respectively. The mortality risk might also be inversely correlated to the plasma sodium concentrations.16,28 Consequently, the MELD-derived score incorporating plasma sodium concentration and including hyponatremia as a priority criterion for OLT (MELD-Na) is currently being frequently used for allocation purposes.
Hyponatremia and OLT
The prevalence of hyponatremia in OLT candidates varies from 11% to 34%. It is 21.6% (cutoff at 130 mmol/L) or 49.4% (cutoff at 135 mmol/L) in the overall population of cirrhotic patients.29,30 In our study, hyponatremia was present in four patients (15%, cutoff at 135 mmol/L). None of the patients had a sodium concentration lower than 120 mmol/L. In the same way that serial MELD scores predict mortality better than a single value, serial measurements of plasma sodium could have a better predictive value than a single measurement.16 While awaiting OLT, hyponatremia is likely to fluctuate over time concomitantly with the complications of cirrhosis and the patient treatment.31,32 This fluctuation was reproduced in our study (as illustrated for a single patient in Figure 1). The number of acute aggravations and the ability to recover would probably be a factor of interest at the time of OLT listing and should be further studied. An increased risk of death is associated with a serum sodium concentration <126 mmol/L (6.5-fold increase) or <131 mmol/L (5-fold increase) measured at any time during the waiting period for OLT.28 In our study, a serum sodium concentration <131 mmol/L at the time of listing was not associated with an increased risk of death, strengthening the importance of serial sodium concentration measuring.
In addition, hyponatremia prior to OLT was associated with an increased 90-day postoperative mortality.14 Similarly, in patients with cirrhosis, hyponatremia at time of OLT (<130 mmol/L) was shown to increase the risk of postoperative neurologic disorders, infectious complications, and renal failure during the first month after OLT and reduced the 3-month survival rate.9 However, the post OLT outcome highly depends on donor characteristics, cardiovascular evolution during liver replacement, and surgical complications. For hyponatremic patients, sodium levels reached normal levels during OLT before the surgical anhepatic phase, reaching similar normal level during the pre-operative period (Figure 3). None of the patients experienced neurological complications due to this rapid correction of sodium concentration.
Sodium Levels Variations in the Peri-Operative Period
Few studies have focused on the fluctuations of sodium levels during and after OLT. Both Romanovski et al33 and Hudcova et al34 have shown that rapid correction of natremia after OLT in hyponatremic patients was associated with worse outcomes and complications in the post-operative period of OLT. Similarly, Park et al35 has found that major shift of natremia during OLT with liver donor was a risk factor for prolonged mechanical ventilation post transplantation.
In contrast, the study from Brandmann et al36 paying particular attention to the consequences of fluctuations in sodium levels in patient with hepatic encephalopathy before OLT showed that there was no influence on neurological outcome or length of stay in ICU. Leise et al.37 have even found that hyponatremia was not associated with worse outcomes unlike hypernatremia before OLT. In our study, natremia correction was equally not associated with negative neurological outcomes. To date, sodium levels are not systematically measured during OLT which may hold the risk for sodium level overcorrection in hyponatremic cirrhotic patients during the peri-operative stage. Clinical reasoning is therefore warranted and the need for perioperative sodium levels measurement should be discussed on a case-based level in order to prevent sodium levels related complications.
Another interesting observation of our study is that hyponatremia coexists with most complications of cirrhosis as previously reviewed by Schrier et al.1,4 The latter is illustrated in (Figure 1) showing correlation of hyponatremia with other cirrhosis-related complications in one patient. Activation of arterial baroreceptors occurs with low cardiac output (cirrhotic cardiomyopathy or decreased preload) as well as high cardiac output (septic-like syndrome/inflammation) and exacerbation of splanchnic vasodilatation with increased portal pressure.1,4,38 This unifying hypothesis further reinforces the usefulness of hyponatremia as a marker of disease severity. When serum sodium concentrations were measured over time in a single patient (Figure 1), hyponatremia was associated with decreased preload (digestive hemorrhage) or sepsis/inflammation (bacterial peritonitis). Recurrent ascites with hyponatremia frequently remains of unknown origin. Thus, besides rare neurological disorders induced by rapid modifications of serum sodium concentration, hyponatremia is likely to be a surrogate marker of either decreased preload, aggravation of cardiomyopathy, aggravation of liver disease (increased splanchnic vasodilatation), or occurrence of a septic-like syndrome through arterial underfilling. Guidelines have been published to treat episodes of hyponatremia in cirrhotic patients.26 However, treatment of acute complications of cirrhosis and OLT are likely to be the best therapies when hyponatremia occurs.39
In our study, normalization of serum sodium concentrations within the surgical period was unrelated to the systemic vascular resistance that remain unchanged during the perioperative period. Although portal blood flow immediately increases with graft placement, correction of the splanchnic arterial vasodilatation is usually observed only within 3 to 6 months after OLT.40 The systemic vascular resistance is unlikely to be reflected by the stimulation of arterial baroreceptors by arterial underfilling as previously shown by Rector et al.41 RW Schrier1,4 emphasizes that arterial underfilling should be assessed by the release of neurohormones. In the ANH phase of OLT, serum renin activity and concentrations of norepinephrine, vasopressin, and pro-BNP increased similarly (Table 2) as previously described.42 However, the unstable pre-operative conditions associated with a high neurohormonal response precludes correlating the normalization of serum sodium concentration to a decrease hormone release. Eyraud et al have already shown in 200243 that, in patients with normal liver function who had major hepatic resection with portal triad clamping and occlusion of the inferior vena cava below and above the liver, the sudden drop in venous return enhances the neurohormonal response to sustain the systemic hemodynamics. After unclamping, endogen catecholamines, vasopressin, renin and atrial natriuretic peptide return to baseline values within five minutes. These observations suggest that this acute neurohormonal response, which is similarly observed in our study, does not solely explain the progressive normalization of sodium levels observed after OLT.
Interestingly, both Creatinine and Cystatin-C levels varied during surgery and were significantly higher both 24 hours and 6 months after OLT. Recent studies show that Cystatin-C is a more sensitive indicator for renal impairment in cirrhotic patients than serum creatinine and creatinine clearance.44 Moreover, higher values of Cystatin-C were correlated with a more severe cirrhotic disease45 and has been shown to be an independent predictor of post OLT survival.46 Thus, routine Cystatin-C measurement might be of interest for early detection of kidney disease and as so, help prevent renal related complications in cirrhotic patients. In addition, the sensitivity of Cystatin-C for early detection of kidney disease in cirrhotic patients, its correlation with the severity of the disease and its prediction value for post OLT mortality could place the cystatin-C as an interesting factor in prioritizing patients in the OLT waiting list and should be further studied.
Strengths and Limitations
The strengths of our study include standardized and controlled data collection over fixed periods during and after surgery. This allowed to describe an accurate image of plasmatic, renal and neurohormonal changes in the peri-operative period. Another strength of the study is no loss to follow-up at 6 months.
Our study however has several limitations. The number of patients was limited and the number of patients with a very low natremia (only 3 out of 27 patients had sodium levels <130mmol/L) even smaller, the sample size however correlates to our institution’s annual average liver transplantations. Furthermore, the choice of using the Child-Pugh classification to assess severity of cirrhosis could be a matter of debate. Since the MELD score was adopted in 2002 to allocate priority to candidates, the mortality on the waiting list has decreased. The MELD score predicts the survival for patients with cirrhosis more accurately than the Child score. Interestingly, in patients with hyponatremia, the MELD-Na score might further decrease the 90-days mortality on the waiting list.14 However, to assess the severity of cirrhosis in our study, we chose the Child-Pugh score that reflects clinical symptoms (encephalopathy and ascites) better than the MELD score, which is based on the logarithmic transformation of bilirubin, creatinine, and INR.
Conclusions
In summary, hyponatremia at listing is now recognized as an independent factor of mortality within 90 days after OLT. Moreover, in OLT candidates with cirrhosis, episodes of hyponatremia are likely to be associated with disease complications and the importance of serial determination should be investigated. A score including sodium concentration variations may be an interesting parameter to consider before OLT. Interestingly, in our study, sodium levels were rapidly corrected after liver transplantation and remained stable without observed complications. Short- and long-term clinical outcomes and prognostic value of this correction in the post-operative period remain to be better understood. Finally, the fact that sodium levels remain stable after post-operative correction suggests that the peripheral baroreceptor response, which is driven by the degree of effective circulating volume, ie, the degree of peripheral and splanchnic vasodilatation might not be the sole mechanism implicated in hyponatremia associated with cirrhosis and further studies on the subject would be of interest.
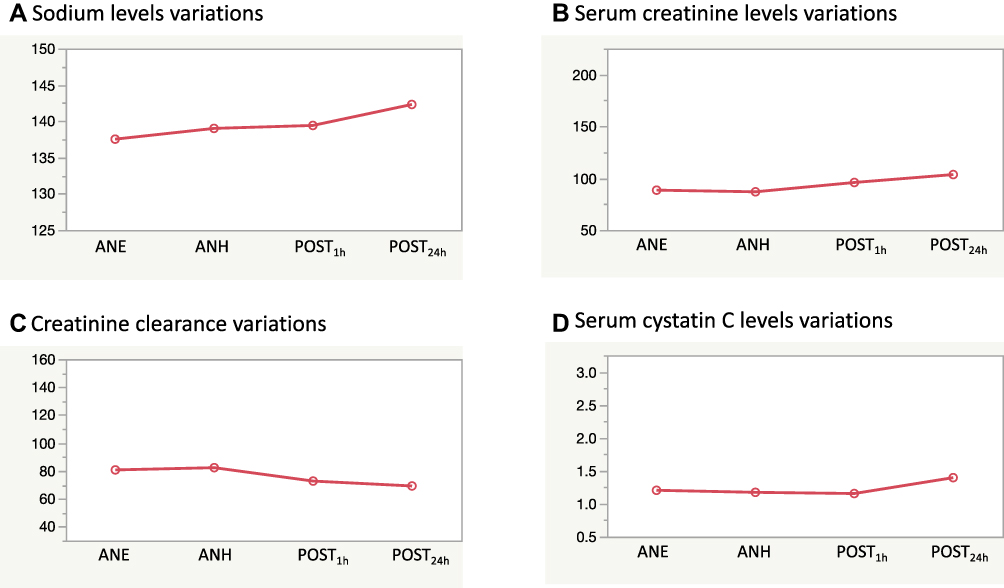 |
Figure 1 Perioperative variations in plasmatic sodium levels [mmol/L] (A), serum creatinine levels [mmol/L] (B), creatinine clearance (C) and cystatin C (D). |
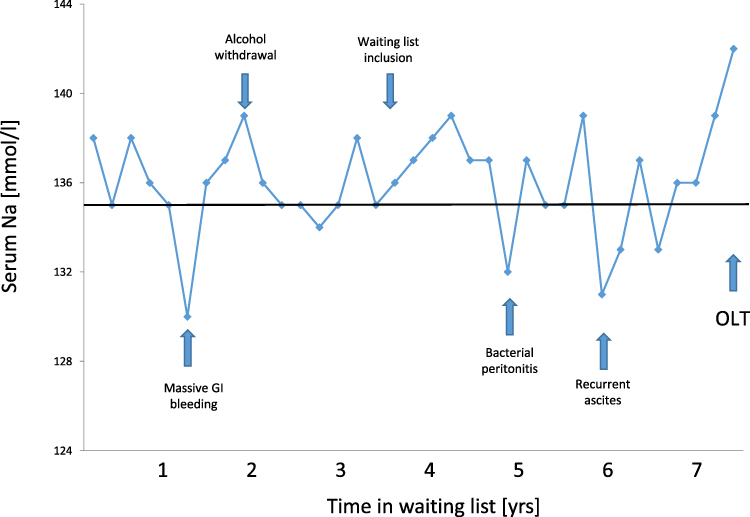 |
Figure 2 Serial determination of plasma sodium concentrations in a single patient. The PREOLT value of plasma sodium concentration was 136 mmol/L. Key events are marked in the figure using arrows. |
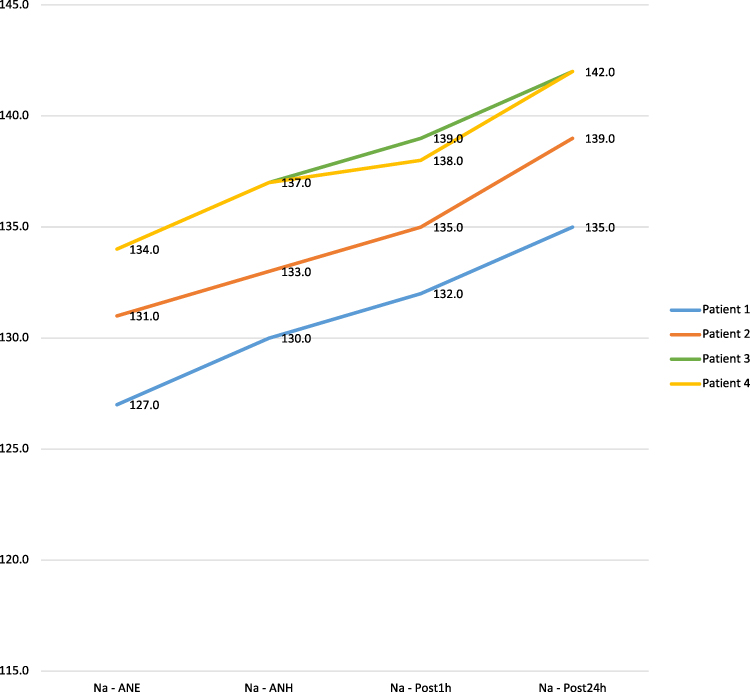 |
Figure 3 Sodium levels evolution during the perioperative phase of OLT for patients with pre-operative hyponatremia. |
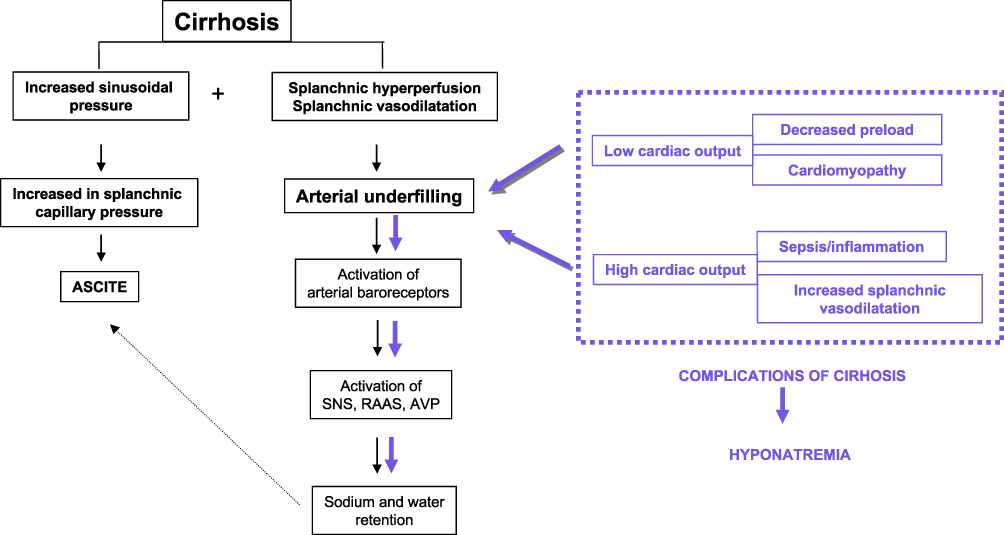 |
Figure 4 Pathophysiology of hyponatremia during the complications of cirrhosis. Abbreviations: SNS, sympathetic nervous system; RAAS, renin angiotensin aldosterone system; AVP, arginine vasopressin. |
Data Sharing Statement
The datasets used and/or analysed during the current study are available from the corresponding author on reasonable request.
Ethics Statement
The ethics committee of our institution (Hôpitaux Universitaires de Genève, Geneva, Switzerland) approved the protocol and written informed consent was obtained from each patient at the time of inclusion in the waiting list.
The study complies with the Declaration of Helsinki. All organs were donated voluntarily with written informed consent, and the study was conducted in accordance with the Declaration of Istanbul.
The study has been registered in the ISRCTN register (N° 43452247). Details can be found at https://www.isrctn.com/ISRCTN43452247?q=43452247andfilters=andsort=andoffset=1andtotalResults=1andpage=1andpageSize=10andsearchType=basic-search
Consent for Publication
All authors have approved the manuscript and agree with its submission.
Acknowledgments
We thank Prof. Martin Tramer for providing funding and to all of the Anesthesiology division in the University Hospitals of Geneva.
Author Contributions
All authors made substantial contributions to conception and design, acquisition of data, or analysis and interpretation of data; took part in drafting the article or revising it critically for important intellectual content; agreed to submit to the current journal; gave final approval of the version to be published; and agree to be accountable for all aspects of the work.
Funding
The project was funded by departmental funds of the anesthesiology service of the University Hospital of Geneva, Switzerland.
Disclosure
Dr Thomas Mavrakanas reports personal fees from Daiichi Sankyo, outside the submitted work. The authors report no other conflicts of interest in this work.
References
1. Schrier RW. Decreased effective blood volume in edematous disorders: what does this mean? J Am Soc Nephrol. 2007;18(7):2028–2031. doi:10.1681/ASN.2006111302
2. Gines P, Cárdenas A, Arroyo V, et al. Management of cirrhosis and ascites. N Engl J Med. 2004;350(16):1646–1654. doi:10.1056/NEJMra035021
3. Frey FJ. Impaired 11 beta-hydroxysteroid dehydrogenase contributes to renal sodium avidity in cirrhosis: hypothesis or fact? Hepatology. 2006;44(4):795–801. doi:10.1002/hep.21381
4. Schrier RW. Water and sodium retention in edematous disorders: role of vasopressin and aldosterone. Am J Med. 2006;119:S47–S53. doi:10.1016/j.amjmed.2006.05.007
5. Ruiz-del-Arbol L, Monescillo A, Arocena C, et al. Circulatory function and hepatorenal syndrome in cirrhosis. Hepatology. 2005;42(2):439–447. doi:10.1002/hep.20766
6. Cardenas A, Gines P. Therapy insight: management of hepatorenal syndrome. Nat Clin Pract Gastroenterol Hepatol. 2006;3(6):338–348. doi:10.1038/ncpgasthep0517
7. Angeli P, Garcia-Tsao G, Nadim MK, et al. News in pathophysiology, definition and classification of hepatorenal syndrome: a step beyond the International Club of Ascites (ICA) consensus document. J Hepatol. 2019;71(4):811–822. doi:10.1016/j.jhep.2019.07.002
8. Londono M-C, Cardenas A, Guevara M, et al. MELD score and serum sodium in the prediction of survival of patients with cirrhosis awaiting liver transplantation. Gut. 2007;56(9):1283–1290. doi:10.1136/gut.2006.102764
9. Londono MC, Guevara M, Rimola A, et al. Hyponatremia impairs early posttransplantation outcome in patients with cirrhosis undergoing liver transplantation. Gastroenterology. 2006;130(4):1135–1143. doi:10.1053/j.gastro.2006.02.017
10. Biggins SW, Kim WR, Terrault NA, et al. Evidence-based incorporation of serum sodium concentration into MELD. Gastroenterology. 2006;130(6):1652–1660. doi:10.1053/j.gastro.2006.02.010
11. Luca A, Angermayr B, Bertolini G, et al. An integrated MELD model including serum sodium and age improves the prediction of early mortality in patients with cirrhosis. Liver Transpl. 2007;13(8):1174–1180. doi:10.1002/lt.21197
12. Ruf AE, Kremers WK, Chavez LL, et al. Addition of serum sodium into the MELD score predicts waiting list mortality better than MELD alone. Liver Transpl. 2005;11(3):336–343. doi:10.1002/lt.20329
13. Heuman DM, Abou-Assi SG, Habib A, et al. Persistent ascites and low serum sodium identify patients with cirrhosis and low MELD scores who are at high risk for early death. Hepatology. 2004;40(4):802–810. doi:10.1002/hep.1840400409
14. Dawwas MF, Lewsey JD, Neuberger JM, et al. The impact of serum sodium concentration on mortality after liver transplantation: a cohort multicenter study. Liver Transpl. 2007;13(8):1115–1124. doi:10.1002/lt.21154
15. Mihaylov P, Nagai S, Ekser B, et al. Prognostic impact of peritransplant serum sodium concentrations in liver transplantation. Ann Transplant. 2019;24:418–425. doi:10.12659/AOT.914951
16. Kim WR, Biggins SW, Kremers WK, et al. Hyponatremia and mortality among patients on the liver-transplant waiting list. N Engl J Med. 2008;359(10):1018–1026. doi:10.1056/NEJMoa0801209
17. Sharma P, Schaubel DE, Goodrich NP, et al. Serum sodium and survival benefit of liver transplantation. Liver Transpl. 2015;21(3):308–313. doi:10.1002/lt.24063
18. Nagai S, Chau LC, Schilke RE, et al. Effects of allocating livers for transplantation based on model for end-stage liver disease–sodium scores on patient outcomes. Gastroenterology. 2018;155(5):1451–1462.e3. doi:10.1053/j.gastro.2018.07.025
19. Leise M, Cárdenas A. Hyponatremia in cirrhosis: implications for liver transplantation. Liver Transpl. 2018;24(11):1612–1621. doi:10.1002/lt.25327
20. Upadhyay A, Jaber BL, Madias NE. Incidence and prevalence of hyponatremia. Am J Med. 2006;119(Suppl 7):S30–S35. doi:10.1016/j.amjmed.2006.05.005
21. Burnett RW, Covington AK, Fogh-Andersen N, et al. Use of ion-selective electrodes for blood-electrolyte analysis. Recommendations for nomenclature, definitions and conventions. International Federation of Clinical Chemistry and Laboratory Medicine (IFCC). Scientific Division Working Group on selective electrodes. Clin Chem Lab Med. 2000;38(4):363–370.
22. Child CG, Turcotte JG. Surgery and portal hypertension. In: Major Problems in Clinical Surgery. 1964:1.
23. Burra P, Samuel D, Sundaram V, et al. Limitations of current liver donor allocation systems and the impact of newer indications for liver transplantation. J Hepatol. 2021;75(Suppl 1):S178–S190. doi:10.1016/j.jhep.2021.01.007
24. Grouzmann E, Fathi M, Gillet M, et al. Disappearance rate of catecholamines, total metanephrines, and neuropeptide Y from the plasma of patients after resection of pheochromocytoma. Clin Chem. 2001;47(6):1075–1082. doi:10.1093/clinchem/47.6.1075
25. Garcia-Tsao G. The transjugular intrahepatic portosystemic shunt for the management of cirrhotic refractory ascites. Nat Clin Pract Gastroenterol Hepatol. 2006;3(7):380–389. doi:10.1038/ncpgasthep0523
26. Gines P, Berl T, Bernardi M, et al. Hyponatremia in cirrhosis: from pathogenesis to treatment. Hepatology. 1998;28(3):851–864. doi:10.1002/hep.510280337
27. Huo TI, Lee SD, Lin HC. Selecting an optimal prognostic system for liver cirrhosis: the model for end-stage liver disease and beyond. Liver Int. 2008;28(5):606–613. doi:10.1111/j.1478-3231.2008.01727.x
28. Biggins SW, Rodriguez HJ, Bacchetti P, et al. Serum sodium predicts mortality in patients listed for liver transplantation. Hepatology. 2005;41(1):32–39. doi:10.1002/hep.20517
29. Gaglio P, Marfo K, Chiodo J
30. Angeli P, Wong F, Watson H, et al. Hyponatremia in cirrhosis: results of a patient population survey. Hepatology. 2006;44(6):1535–1542. doi:10.1002/hep.21412
31. Kim JH, Lee JS, Lee SH, et al. The association between the serum sodium level and the severity of complications in liver cirrhosis. Korean J Intern Med. 2009;24(2):106–112. doi:10.3904/kjim.2009.24.2.106
32. Barakat AA, Metwaly AA, Nasr FM, et al. Impact of hyponatremia on frequency of complications in patients with decompensated liver cirrhosis. Electron Physician. 2015;7(6):1349–1358.
33. Romanovsky A, Azevedo LCP, Meeberg G, et al. Serum sodium shift in hyponatremic patients undergoing liver transplantation: a retrospective cohort study. Ren Fail. 2015;37(1):37–44. doi:10.3109/0886022X.2014.975102
34. Hudcova J, Ruthazer R, Bonney I, et al. Sodium homeostasis during liver transplantation and correlation with outcomes. Anesth Analg. 2014;119(6):1420–1428. doi:10.1213/ANE.0000000000000415
35. Park C, Kim D, Choi J, et al. Intraoperative changes in hyponatremia as a risk factor for prolonged mechanical ventilation after living donor liver transplantation. Transplant Proc. 2010;42(9):3612–3616. doi:10.1016/j.transproceed.2010.06.039
36. Brandman D, Biggins SW, Hameed B, et al. Pretransplant severe hepatic encephalopathy, peritransplant sodium and post-liver transplantation morbidity and mortality. Liver Int. 2012;32(1):158–164. doi:10.1111/j.1478-3231.2011.02618.x
37. Leise MD, Yun BC, Larson JJ, et al. Effect of the pretransplant serum sodium concentration on outcomes following liver transplantation. Liver Transpl. 2014;20(6):687–697. doi:10.1002/lt.23860
38. Ripoll C, Yotti R, Bermejo J, et al. The heart in liver transplantation. J Hepatol. 2011;54(4):810–822. doi:10.1016/j.jhep.2010.11.003
39. Verbalis JG, Goldsmith SR, Greenberg A, et al. Hyponatremia treatment guidelines 2007: expert panel recommendations. Am J Med. 2007;120(Suppl 11):S1–21. doi:10.1016/j.amjmed.2007.09.001
40. Bolognesi M, Sacerdoti D, Bombonato G, et al. Change in portal flow after liver transplantation: effect on hepatic arterial resistance indices and role of spleen size. Hepatology. 2002;35(3):601–608. doi:10.1053/jhep.2002.31352
41. Rector WG
42. Acosta F, Diaz J, Sansano T, et al. Evolution of the plasma concentration of norepinephrine in cirrhotic patients during liver transplantation. Transplant Proc. 2000;32(8):2659–2660. doi:10.1016/S0041-1345(00)01829-7
43. Eyraud D, Richard O, Borie DC, et al. Hemodynamic and hormonal responses to the sudden interruption of caval flow: insights from a prospective study of hepatic vascular exclusion during major liver resections. Anesth Analg. 2002;95(5):1173–8, table of contents. doi:10.1097/00000539-200211000-00008
44. Wang D, Feng J-F, Wang A-Q, et al. Role of cystatin C and glomerular filtration rate in diagnosis of kidney impairment in hepatic cirrhosis patients. Medicine. 2017;96(20):e6949. doi:10.1097/MD.0000000000006949
45. Stulic M, Culafic D, Obrenovic R, et al. The clinical importance of cystatin C and hepatic artery resistive index in liver cirrhosis. Medicina. 2018;54(3):37.
46. Ding Y, Wu T, Zhang W, et al. Pretransplant renal function evaluated by serum cystatin C was associated with mortality after liver transplantation: a single-center experience. Ann Transl Med. 2019;7(11):243. doi:10.21037/atm.2019.05.22
 © 2021 The Author(s). This work is published and licensed by Dove Medical Press Limited. The
full terms of this license are available at https://www.dovepress.com/terms
and incorporate the Creative Commons Attribution
- Non Commercial (unported, 3.0) License.
By accessing the work you hereby accept the Terms. Non-commercial uses of the work are permitted
without any further permission from Dove Medical Press Limited, provided the work is properly
attributed. For permission for commercial use of this work, please see paragraphs 4.2 and 5 of our Terms.
© 2021 The Author(s). This work is published and licensed by Dove Medical Press Limited. The
full terms of this license are available at https://www.dovepress.com/terms
and incorporate the Creative Commons Attribution
- Non Commercial (unported, 3.0) License.
By accessing the work you hereby accept the Terms. Non-commercial uses of the work are permitted
without any further permission from Dove Medical Press Limited, provided the work is properly
attributed. For permission for commercial use of this work, please see paragraphs 4.2 and 5 of our Terms.