Back to Journals » Risk Management and Healthcare Policy » Volume 13
Performance of Comprehensive Risk Adjustment for the Prediction of In-Hospital Events Using Administrative Healthcare Data: The Queralt Indices
Authors Monterde D ![]() , Cainzos-Achirica M, Cossio-Gil Y
, Cainzos-Achirica M, Cossio-Gil Y ![]() , García-Eroles L, Pérez-Sust P
, García-Eroles L, Pérez-Sust P ![]() , Arrufat M
, Arrufat M ![]() , Calle C
, Calle C ![]() , Comin-Colet J
, Comin-Colet J ![]() , Velasco C
, Velasco C ![]()
Received 23 August 2019
Accepted for publication 17 January 2020
Published 26 March 2020 Volume 2020:13 Pages 271—283
DOI https://doi.org/10.2147/RMHP.S228415
Checked for plagiarism Yes
Review by Single anonymous peer review
Peer reviewer comments 2
Editor who approved publication: Dr Kent Rondeau
Video abstract presented by Warren Meredith.
Views: 502
David Monterde,1 Miguel Cainzos-Achirica,2,3 Yolima Cossio-Gil,4,5 Luis García-Eroles,6 Pol Pérez-Sust,7 Miquel Arrufat,1 Candela Calle,8 Josep Comin-Colet,3,9 César Velasco4,5
1Catalan Institute of Health, Barcelona, Spain; 2Johns Hopkins Ciccarone Center for the Prevention of Cardiovascular Disease, Johns Hopkins Medical Institutions, Baltimore, MD, USA; 3Bellvitge University Hospital, L’Hospitalet de Llobregat, Barcelona, Spain; 4Vall d’Hebron Hospital, Barcelona, Spain; 5Vall d’Hebron Research Institute (VHIR), Barcelona, Spain; 6Catalan Health Service, Barcelona, Spain; 7Catalan Health Department, Barcelona, Spain; 8Catalan Institute of Oncology (ICO), Barcelona, Spain; 9University of Barcelona, Barcelona, Spain
Correspondence: David Monterde
Department of Statistics, Information Systems, Catalan Institute of Health, Gran via De Les Corts Catalanes 587, Barcelona 08007, Spain
Tel +34 934824642
Email [email protected]
Background: Accurate risk adjustment is crucial for healthcare management and benchmarking.
Purpose: We aimed to compare the performance of classic comorbidity functions (Charlson’s and Elixhauser’s), of the All Patients Refined Diagnosis Related Groups (APR-DRG), and of the Queralt Indices, a family of novel, comprehensive comorbidity indices for the prediction of key clinical outcomes in hospitalized patients.
Material and Methods: We conducted an observational, retrospective cohort study using administrative healthcare data from 156,459 hospital discharges in Catalonia (Spain) during 2018. Study outcomes were in-hospital death, long hospital stay, and intensive care unit (ICU) stay. We evaluated the performance of the following indices: Charlson’s and Elixhauser’s functions, Queralt’s Index for secondary hospital discharge diagnoses (Queralt DxS), the overall Queralt’s Index, which includes pre-existing comorbidities, in-hospital complications, and principal discharge diagnosis (Queralt Dx), and the APR-DRG. Discriminative ability was evaluated using the area under the curve (AUC), and measures of goodness of fit were also computed. Subgroup analyses were conducted by principal discharge diagnosis, by age, and type of admission.
Results: Queralt DxS provided relevant risk adjustment information in a larger number of patients compared to Charlson’s and Elixhauser’s functions, and outperformed both for the prediction of the 3 study outcomes. Queralt Dx also outperformed Charlson’s and Elixhauser’s indices, and yielded superior predictive ability and goodness of fit compared to APR-DRG (AUC for in-hospital death 0.95 for Queralt Dx, 0.77– 0.93 for all other indices; for ICU stay 0.84 for Queralt Dx, 0.73– 0.83 for all other indices). The performance of Queralt DxS was at least as good as that of the APR-DRG in most principal discharge diagnosis subgroups.
Conclusion: Our findings suggest that risk adjustment should go beyond pre-existing comorbidities and include principal discharge diagnoses and in-hospital complications. Validation of comprehensive risk adjustment tools such as the Queralt indices in other settings is needed.
Keywords: benchmarking, case-mix, comorbidity, discrimination, multimorbidity, Queralt’s indices, risk
Introduction
Accurate risk adjustment is crucial in fields such as healthcare management, benchmarking and research. This has direct implications for the evaluation of health policies and interventions, the allocation of healthcare resources, and healthcare quality.1,2 In the current epidemiological era of non-communicable chronic diseases becoming pandemic,3 accurate risk adjustment has become particularly challenging, with a large proportion of hospitalized patients being elderly. Patients now often have multiple concurrent conditions,4 and frequently develop complications during a hospital stay.5,6
Comorbidity indices such as Charlson’s7 or Elixhauser’s8 have been widely used as standard methods for risk adjustment in a number of settings.1,9,10 Importantly, although “comorbidities” and “risk” are often used as synonym terms, these actually refer to different concepts, the former being only one of the components of the latter.11 In this context, comorbidity-only indices such as Charlson’s or Elixhauser’s may fail to fully capture a patient’s risk, and more comprehensive tools may be needed.
We have recently developed the Queralt Indices, a family of risk measurements for hospitalized patients, which combine and weigh more than 2100 relevant acute and chronic diagnosis codes, as compared to Charlson’s index, which includes 17 pre-specified chronic diseases, or Elixhauser’s, which originally combined 30. The Queralt Indices allow integrating information from pre-existing comorbidities, in-hospital complications and principal discharge diagnoses.
The aim of the present study was to compare the performance of classic comorbidity-based functions such as Charlson’s and Elixhauser’s, of a more comprehensive comorbidity index (Queralt’s Index for secondary hospital discharge diagnoses, which excludes in-hospital complications; “Queralt DxS”), of the comprehensive Queralt’s Index for any hospital discharge diagnoses (which includes pre-existing comorbidities, in-hospital complications, and principal discharge diagnosis; “Queralt Dx”), and of the All Patients Refined Diagnosis Related Groups (APR-DRG), which also capture information on medical procedures. We compared these tools in terms of their ability to predict key clinical outcomes in hospitalized patients.
Materials and Methods
Setting and Data Source
The present study was conducted in Catalonia (Spain), a Mediterranean, European region with more than 7 million inhabitants, 81% of whom live in urban municipalities. The Catalan Institute of Health (ICS) is the largest public healthcare provider and serves 75% of those insured in Catalonia.
For the present analysis we used the ICS population-based, administrative healthcare database. This database captures information on medical diagnoses generated in 8 Catalan public hospitals. Medical diagnoses are coded in the database using the International Classification of Diseases, 10th Revision, Clinical Modification (ICD-10-CM) system.12
Study Design and Study Population
This was an observational, retrospective cohort study. The unit of analysis was hospital discharge, and we included all hospital discharges (either home or dead) registered in the ICS database between January 1st and December 31st, 2018. Only standard hospital stays were included in the analyses (ie, hospital stays for major ambulatory surgical interventions and other procedures were excluded). A same patient could contribute several hospital discharges during the study period.
Computation of the Queralt Indices
Information on medical diagnoses (including preexisting comorbidities, primary discharge diagnosis, and in-hospital complications [defined as any non-principal discharge diagnosis not present on admission]), was obtained from hospital discharge reports using definitions based on ICD-10-CM. In the ICS database, secondary discharge diagnoses not present on admission are flagged as in-hospital complications, as compared to secondary discharge diagnoses already present on admission (i.e., preexisting comorbidities).
The Queralt family of indices currently includes three simple measures for principal discharge diagnosis (Queralt DxP), pre-existing comorbidities (Queralt DxS), and in-hospital complications (Queralt DxC), respectively, and a comprehensive index combining all of them (Queralt Dx). Specifically, the development of the Queralt DxS index was based on a highly computational statistical algorithm, consisting of two differentiated parts: 1) identification of significant diagnosis codes groups, and 2) weighing the effect of each of them. The number of significant diagnosis codes groups identified was 2572, of which 2119 obtained a non-zero weight.
In this report we present the results for the Queralt DxS and Queralt Dx indices, as likely the currently two most relevant measures within the Queralt family.
Computation of Other Measures
As comorbidity-only measures, we calculated Charlson’s7 and Elixhauser’s8 indices, using all the information available on secondary diagnoses coded in the hospital discharge reports. Charlson’s index combines and weighs a pre-specified set of 17 chronic conditions present on admission,7 while Elixhauser’s uses a set of 30 comorbidities defined as conditions present on admission and unrelated to the principal discharge diagnosis. Specifically, we used Quan’s version of both indices,13 and van Walraven’s update to calculate the weights in Elixhauser’s measure.14
As case-mix measures, we computed the APR-DRG Severity level, and the APR-DRG Risk level (version 35).15
Study Outcomes
Three outcomes of interest were defined: in-hospital death, occurrence of a hospital stay lasting >14 days, and need for a stay in the intensive care unit (ICU). In-hospital deaths (from any cause) and stays in the ICU are identified automatically and recorded exhaustively in the ICS database, for all patients and hospital stays. Length of hospital stay was calculated (in days) based on the hospital discharge and hospital admission dates, both of which are recorded systematically in the database. The cut-point of 14 days (as a proxy of a long in-hospital stay) was defined based on the 90th percentile of the distribution of length of hospital stays in our area.
Statistical Analyses
The unit of analysis was hospital discharge. Demographic characteristics and the frequency of recorded conditions were described using number and proportion (%). We also described the number and % of hospital discharges in which each of the three study outcomes were present.
To understand the number of hospitalizations in which each comorbidity index might provide useful information for risk adjustment purposes, we calculated and plotted the proportion of hospitalizations in which no discharge diagnosis codes were considered relevant by a given index according to Charlson’s, Elixhauser’s and Queralt DxS indices, respectively. Results were presented stratified by age.
To compare the different measures in terms of their discriminative ability, we built logistic regression models for each of the three study outcomes as dependent variables, using each of the indices as independent variables. Models were adjusted for age, sex, type of admission (unplanned, planned), and center, as follows:
- Model 0 (basic model): Age, Sex, Admission Type, Center
- Model 1: Model 0, Charlson’s
- Model 2: Model 0, Elixhauser’s
- Model 3: Model 0, APR-DRG Severity level
- Model 4: Model 0, APR-DRG Risk level
- Model 5: Model 0, Queralt DxS
- Model 6 (Queralt Dx): Model 0, Queralt DxP, Queralt DxS, Queralt DxC
For each of these regression models, we computed the following measures of discrimination and goodness of fit: the area under the receiver operating characteristic (ROC) curve (AUC),16 Akaike’s information criterion (AIC),17 the Bayesian information criterion (BIC),18 and Brier’s score.19 For the ROC analyses, we computed 95% confidence intervals (CIs) using De Long’s method,20 and plotted the ROC curves of each of the indices for each of the study outcomes.
Subgroup analyses were also conducted, assessing the performance of these measures specifically in individuals with a principal discharge diagnosis of selected types of cancer (colon, pancreatic, lung cancer, leukemias), cardiovascular disease (CVD; acute myocardial infarction, cardiac arrhythmias, heart failure, acute cerebrovascular disease), and respiratory conditions (pneumonia, influenza, acute bronchitis, chronic obstructive pulmonary disease and bronchiectasis). Conditions were grouped using the Clinical Classifications Software coding system, which groups ICD-10 codes.21 Additional subgroup analyses were conducted among young (0 to 29 years) and older (≥60 years) patients, as well as by type of admission (planned, unplanned). Also, a sensitivity analysis excluding delivery-related hospitalizations was conducted.
In order to prevent overfitting by age, specifically for APR-DRG we also built regression models excluding age as covariate, as follows:
- Model 7: Sex + Admission Type + Center + APR-DRG Severity level
- Model 8: Sex + Admission Type + Center + APR-DRG Risk level
All analyses were conducted using R software, version 3.5.3.22 R’s statistical package Comorbidity was used for the calculation of Charlson’s and Elixhauser’s indices.23
Results
Study Population and Characteristics
We included 156,459 hospital discharges occurring between January 1st and December 31st, 2018 (Table 1). The majority of patients were men (51.6%), and most were 60 years of age or older (53.5%). The vast majority of hospital admissions were unplanned (67.1%), and heart failure was the most frequent principal discharge diagnosis (N=5008) among the conditions evaluated.
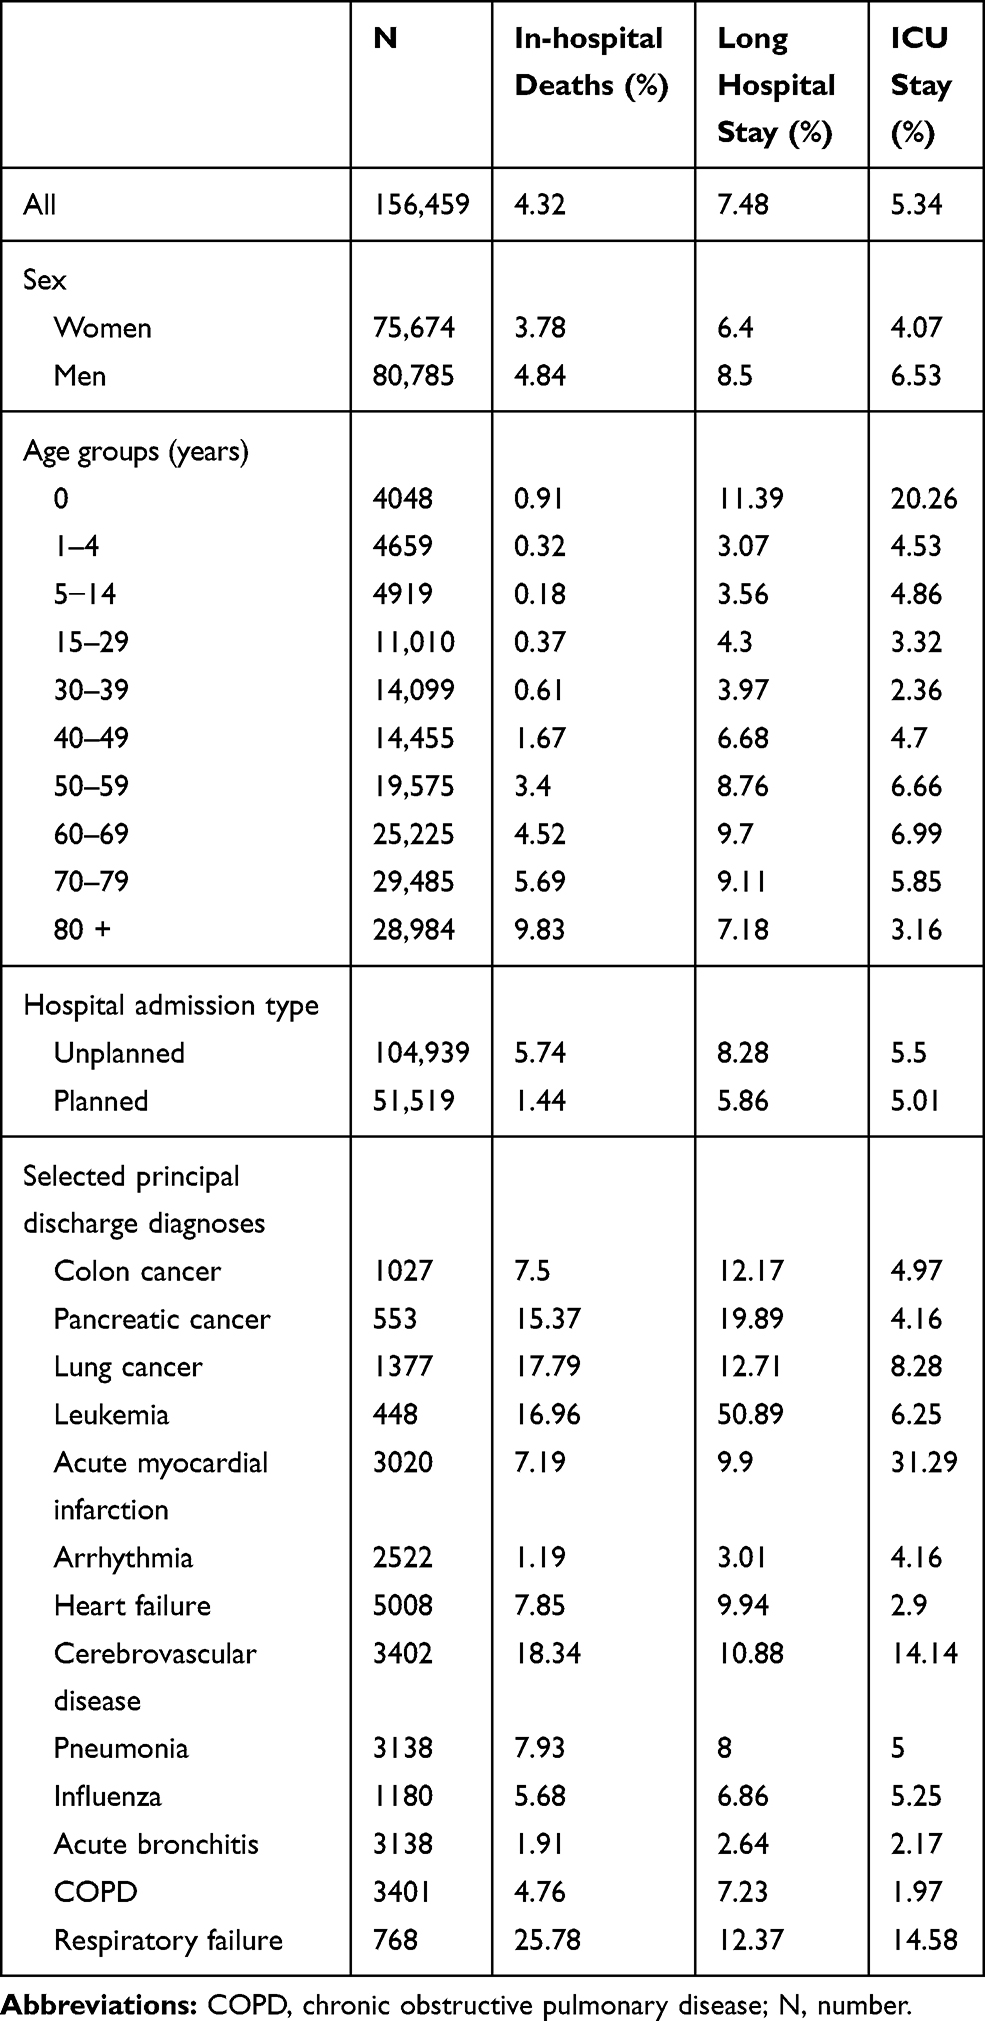 |
Table 1 Number and Characteristics of the Hospital Discharges Included in the Study |
Study Outcomes
Table 1 also presents the frequency of each of the three study outcomes. Overall, 4.3% hospitalizations resulted in an in-hospital death, 7.5% lasted more than 14 days, and 5.3% included an ICU stay. Men had higher in-hospital mortality than women, their hospital stays were longer, and needed ICU stays more often. In-hospital mortality increased with age, with a high of 9.8% for patients 80 years or older; conversely, long hospital stays were more frequent in newborns. Unplanned stays were associated with higher in-hospital mortality and with longer stays. The highest in-hospital mortality was observed in patients with respiratory failure as their principal diagnosis, followed by patients with cerebrovascular disease and patients with cancer.
Relevant Hospital Discharge Diagnoses by Comorbidity Index
Figure 1 displays the number of hospitalizations in which no discharge diagnoses were considered relevant for risk-adjustment purposes according to Charlson’s, Elixhauser’s and Queralt DxS indices, respectively. The number of these hospitalizations was very high using Charlson’s and Elixhauser’s, especially at young ages. Conversely, this number was much lower using the Queralt DxS index, particularly in younger patients, and was almost zero in elderly individuals.
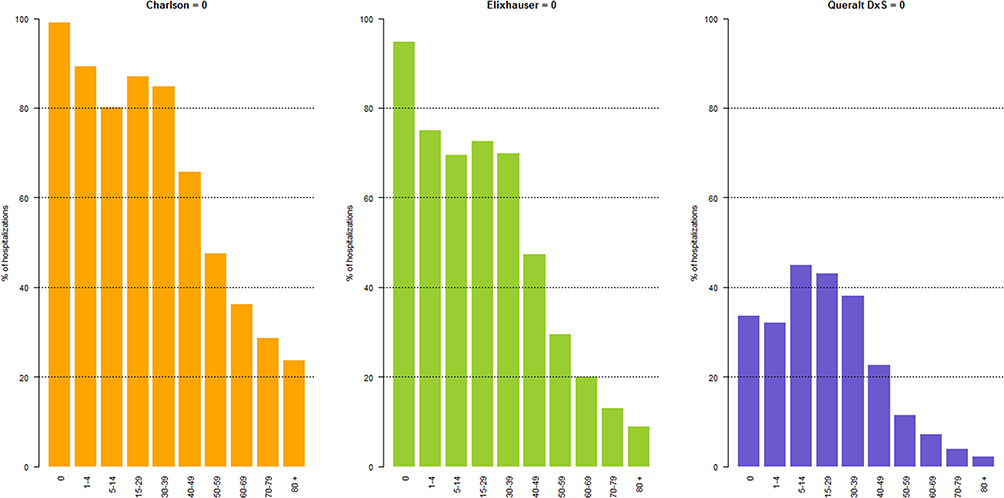 |
Figure 1 Proportion of hospital discharges with no relevant diagnoses for risk-adjustment purposes according to each comorbidity index, stratified by age. |
Prediction of in-Hospital Death
Among comorbidity-only measures, Elixhauser’s index showed a better performance for the prediction of in-hospital death, in terms of AUC, than Charlson’s. Nevertheless, the Queralt DxS index showed the best discriminative ability among the 3 measures (Table 2, and Figure 2).
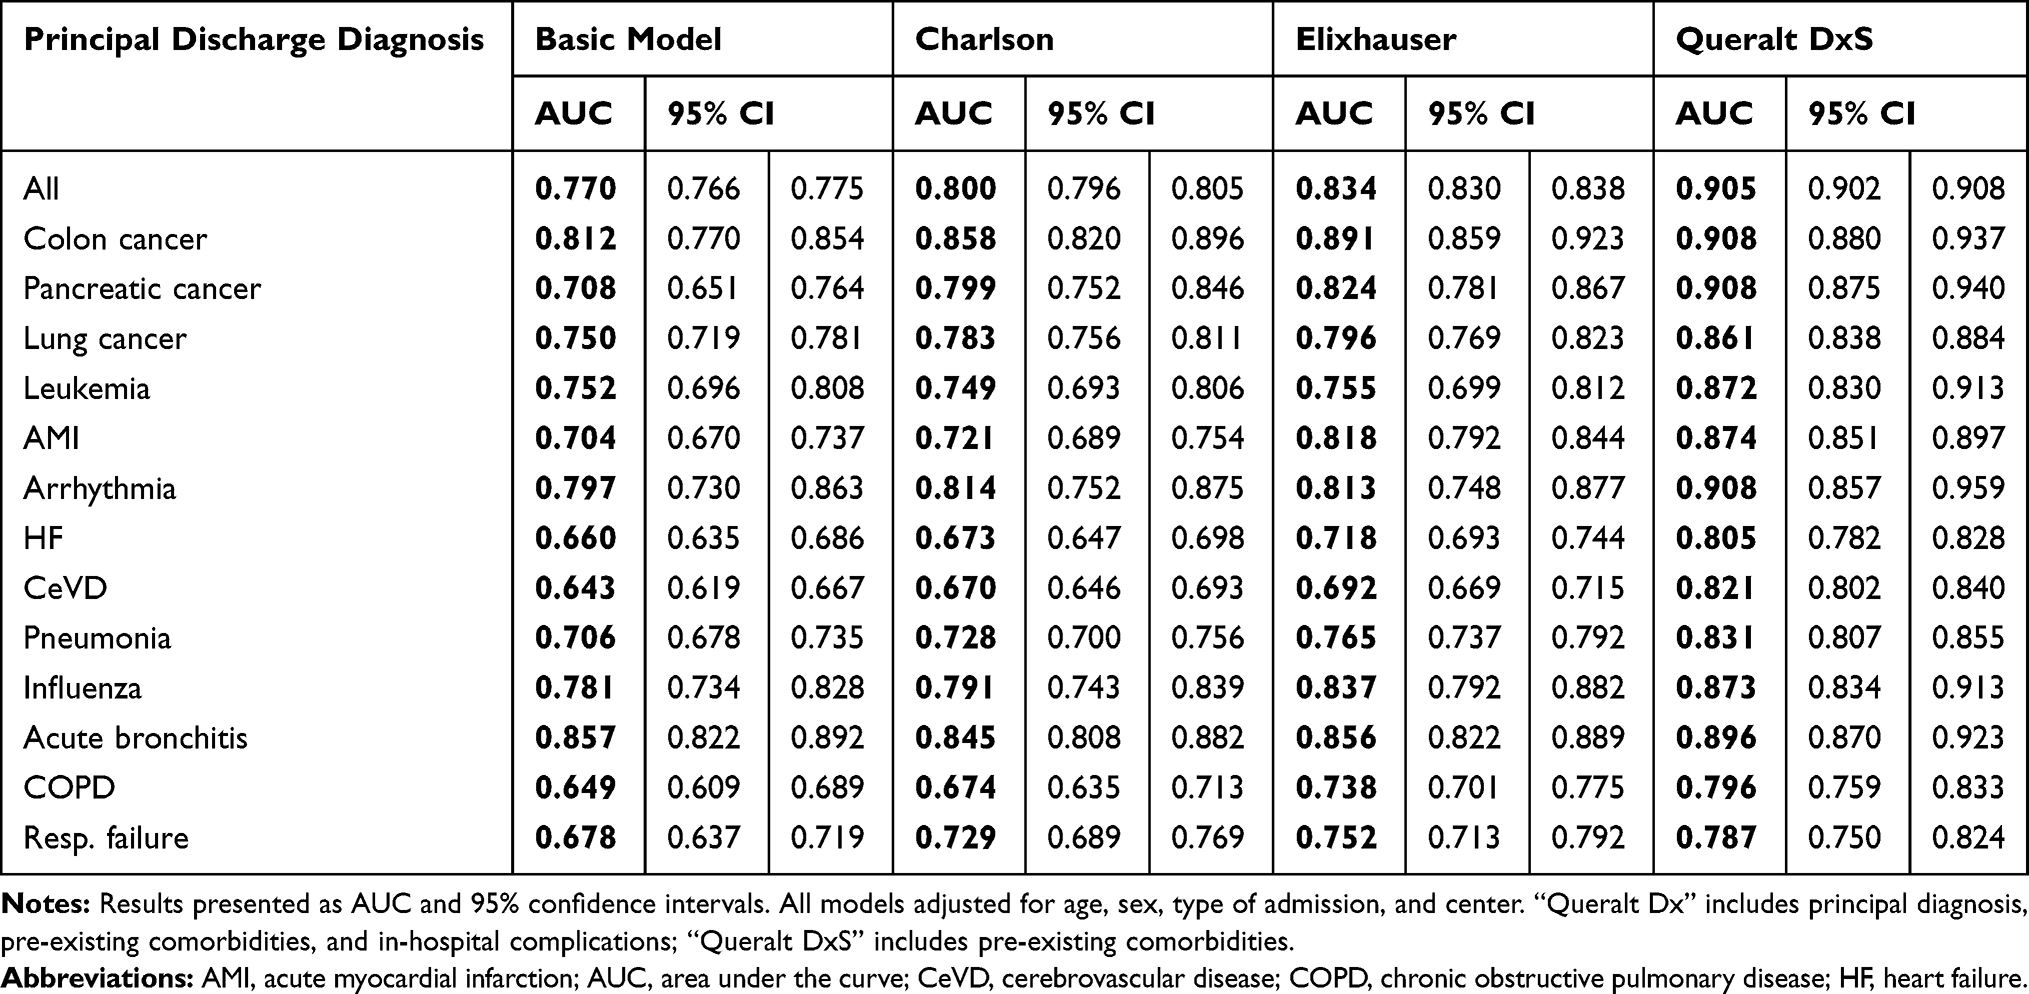 |
Table 2 In-Hospital Death: AUC Analysis for Comorbidity-Only Measures |
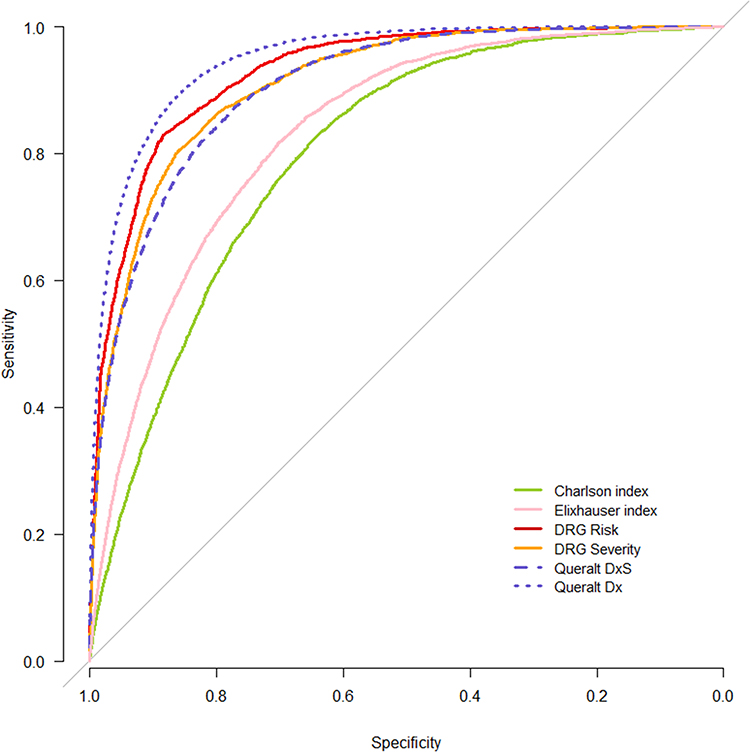 |
Figure 2 ROC curves for the prediction of in-hospital death, all hospital discharges. Queralt Dx includes principal diagnosis, pre-existing comorbidities, and in-hospital complications; Queralt DxS includes pre-existing comorbidities. Abbreviations: APR-DRG, All Patients Refined Diagnosis Related Groups; ICU, intensive care unit; ROC, receiver operating characteristic. |
When both comorbidity-only and more comprehensive risk adjustment measures were considered, the Queralt Dx index was superior to the APR-DRG, and both outperformed comorbidity-only measures (Tables 2 and 3, and Figure 2).
 |
Table 3 In-Hospital Death: AUC Analysis for APR-DRG Measures and the Queralt Dx Index |
The same trends were true in goodness-of-fit analyses in terms of AIC (Table S1), BIC (Table S2), and Brier’s score (Table S3), with the Queralt DxS consistently showing the best performance among comorbidity-based measures, and the Queralt Dx showing the best goodness-of-fit for the prediction of in-hospital death when all measures were considered.
Consistent findings were also observed in AUC subgroup analyses by discharge diagnosis –patients with a primary discharge diagnosis of selected types of cancer, CVD, and respiratory conditions, respectively (Tables 2 and 3). Nevertheless, 95% CIs were wider than in the overall analysis.
Prediction of Length of Hospital Stay >14 Days
As for in-hospital death, in AUC analyses for the prediction of long hospital stay Elixhauser’s index showed a better performance than Charlson’s. Nonetheless, the Queralt DxS index showed the best discriminative ability among the three comorbidity-only measures (Table 4, and Figure 3).
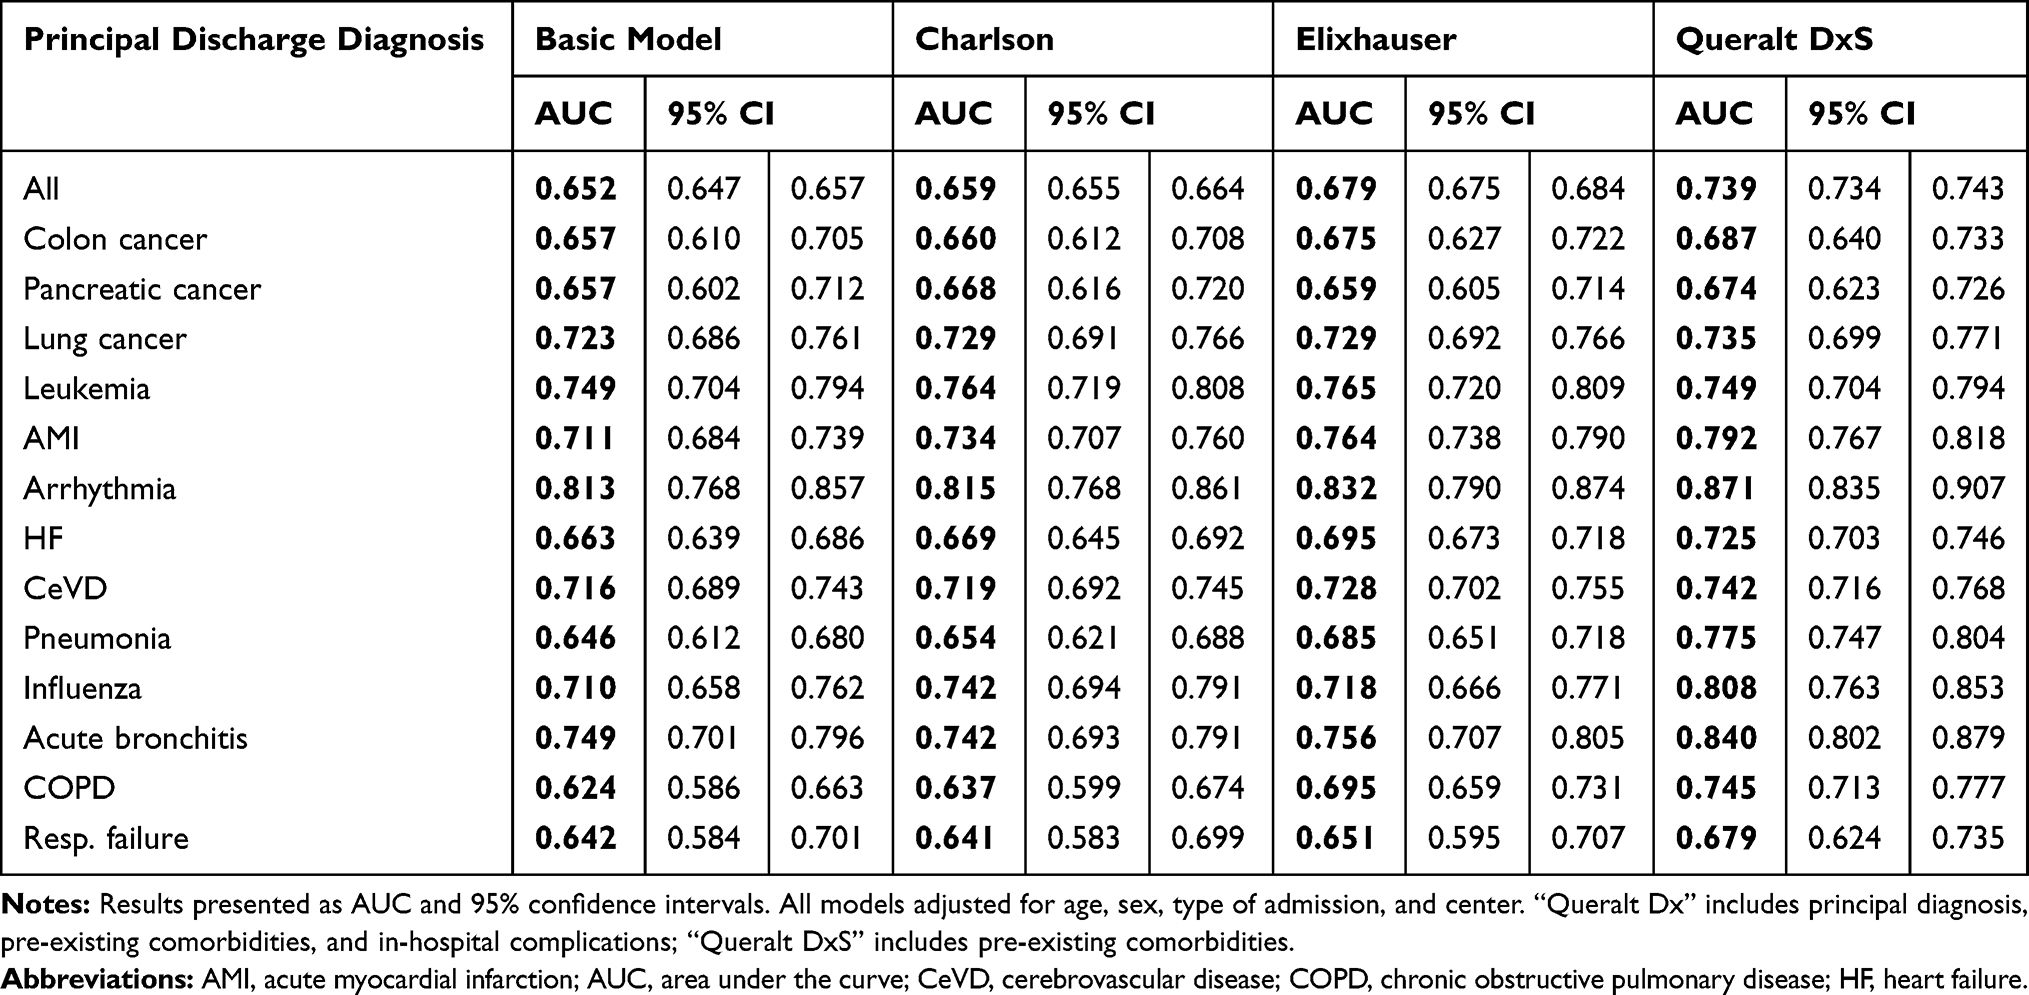 |
Table 4 Length of In-Hospital Stay >14 Days: AUC Analysis for Comorbidity-Only Measures |
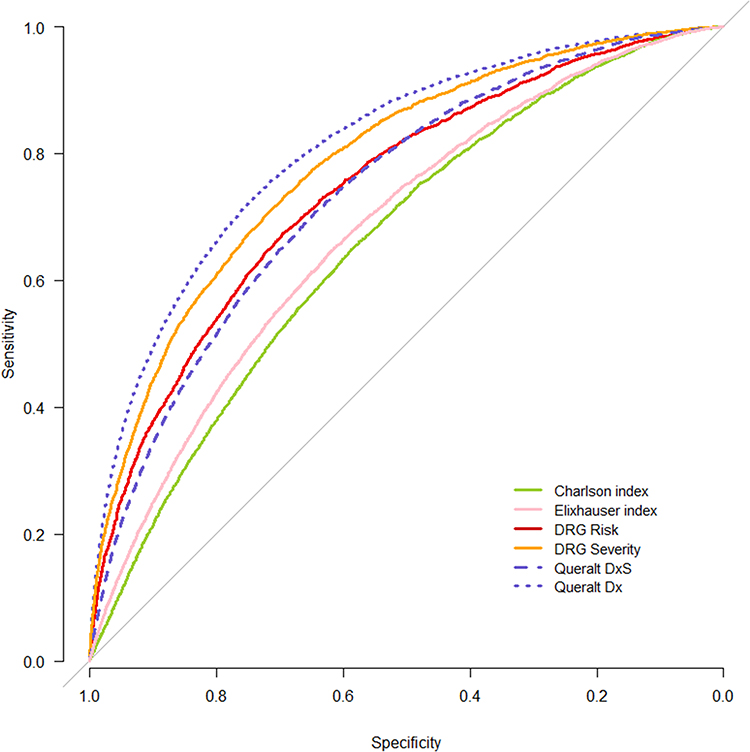 |
Figure 3 ROC curves for the prediction of length of stay >14 days, all hospital discharges. Queralt Dx includes principal diagnosis, pre-existing comorbidities, and in-hospital complications; Queralt DxS includes pre-existing comorbidities. Abbreviations: APR-DRG, All Patients Refined Diagnosis Related Groups; ICU, intensive care unit; ROC, receiver operating characteristic. |
When both comorbidity-only and more comprehensive risk adjustment tools were considered, the Queralt Dx index showed once again the best discriminative ability, with both Queralt Dx and APR-DRG outperforming that of comorbidity-only measures (Tables 4 and 5, and Figure 3). The same was true in terms of goodness-of-fit analyses, including AIC (Table S4), BIC (Table S5) and Brier’s score (Table S6) calculations.
 |
Table 5 Length of In-Hospital Stay >14 Days: AUC Analysis for APR-DRG Measures and the Queralt Dx Index |
Similar trends were observed in AUC analyses by principal discharge diagnosis (Tables 4 and 5), although 95% CIs were once again wider than in the overall analysis. The only exception to this was observed in the subgroup of patients with a principal discharge diagnosis of leukemia, in which Charlson’s and Elixhauser’s indices showed a better performance than the Queralt DxS. Nonetheless, in these patients Queralt Dx also showed the best performance.
Prediction of ICU Stay
As for the other study outcomes, in AUC analyses the Queralt DxS showed once again a better discriminative ability for the prediction of ICU stay than Charlson’s and Elixhauser’s indices (Table 6), and the Queralt Dx showed the best performance across all measures (Tables 6 and 7, and Figure 4). The same was true in AIC (Table S7), BIC (Table S8) and Brier’s score (Table S9) goodness-of-fit analyses.
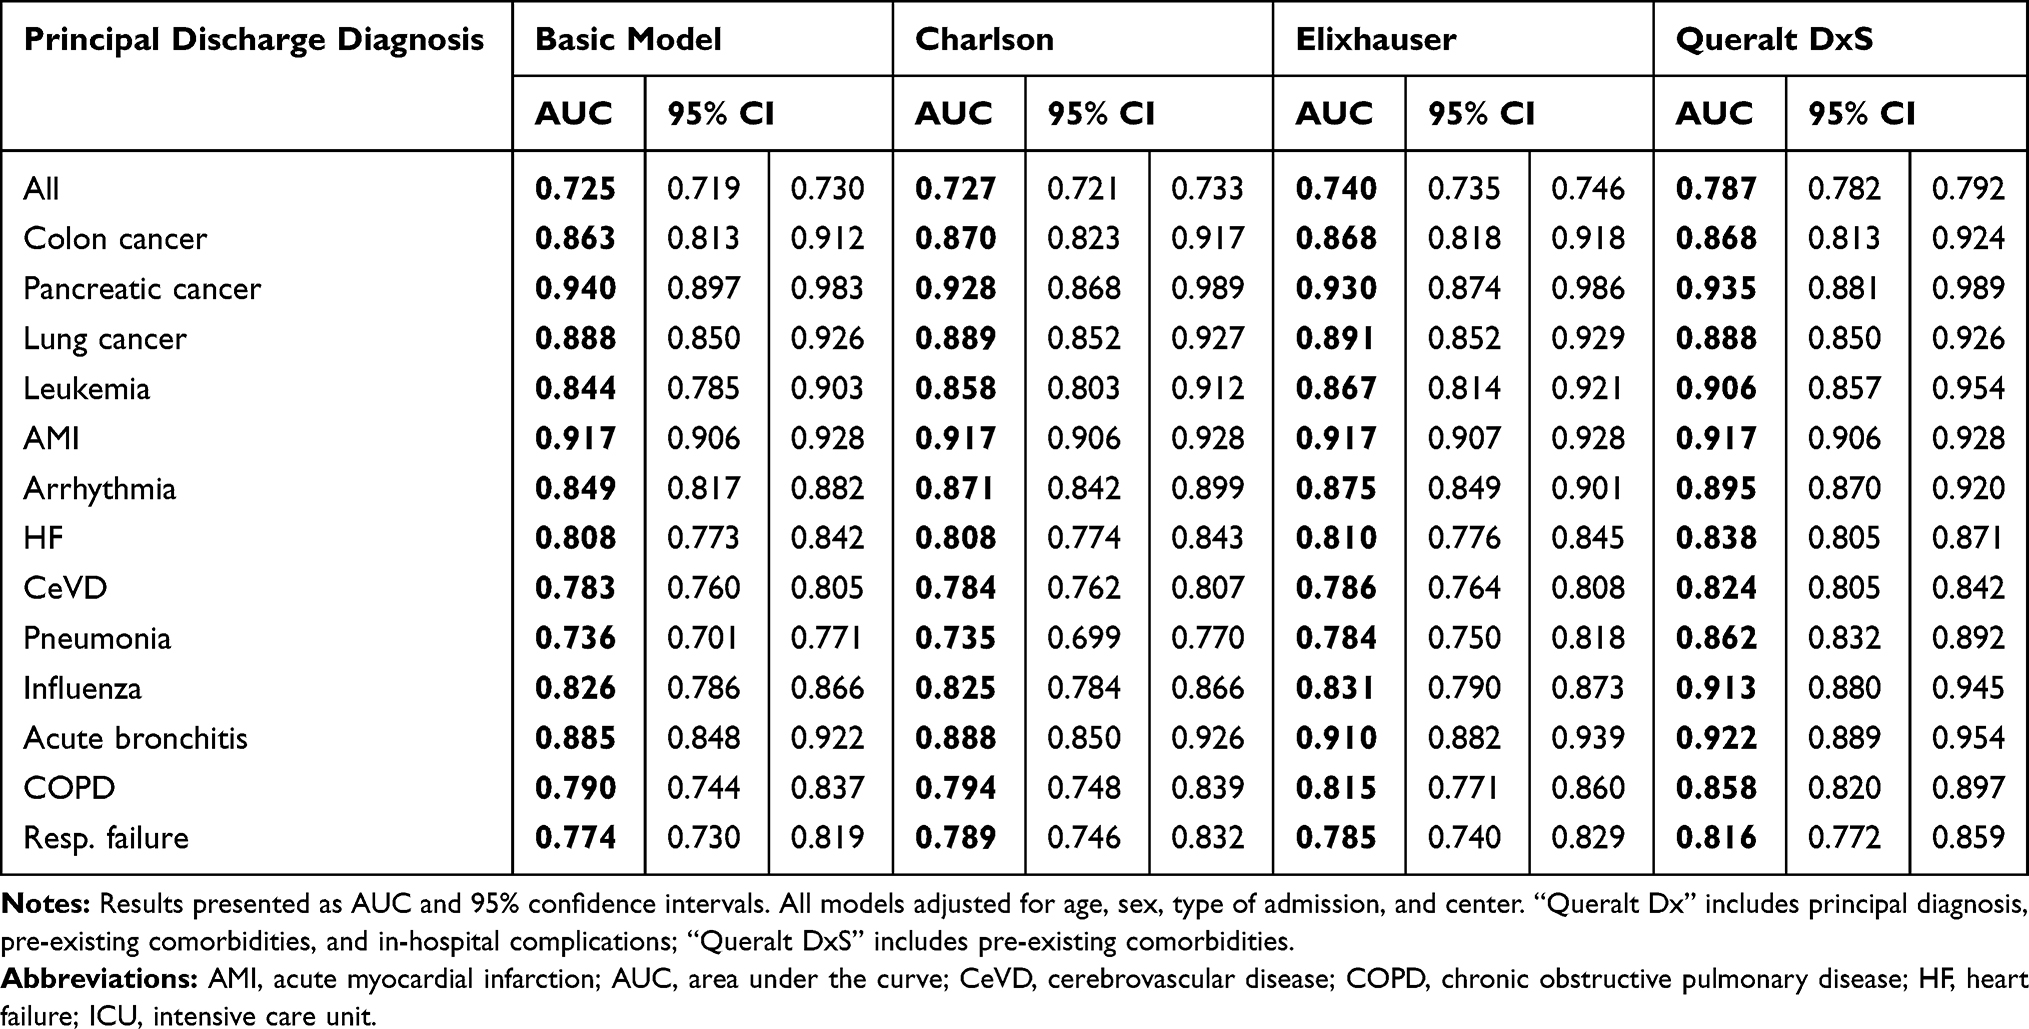 |
Table 6 ICU Stay: AUC Analysis for Comorbidity-Only Measures |
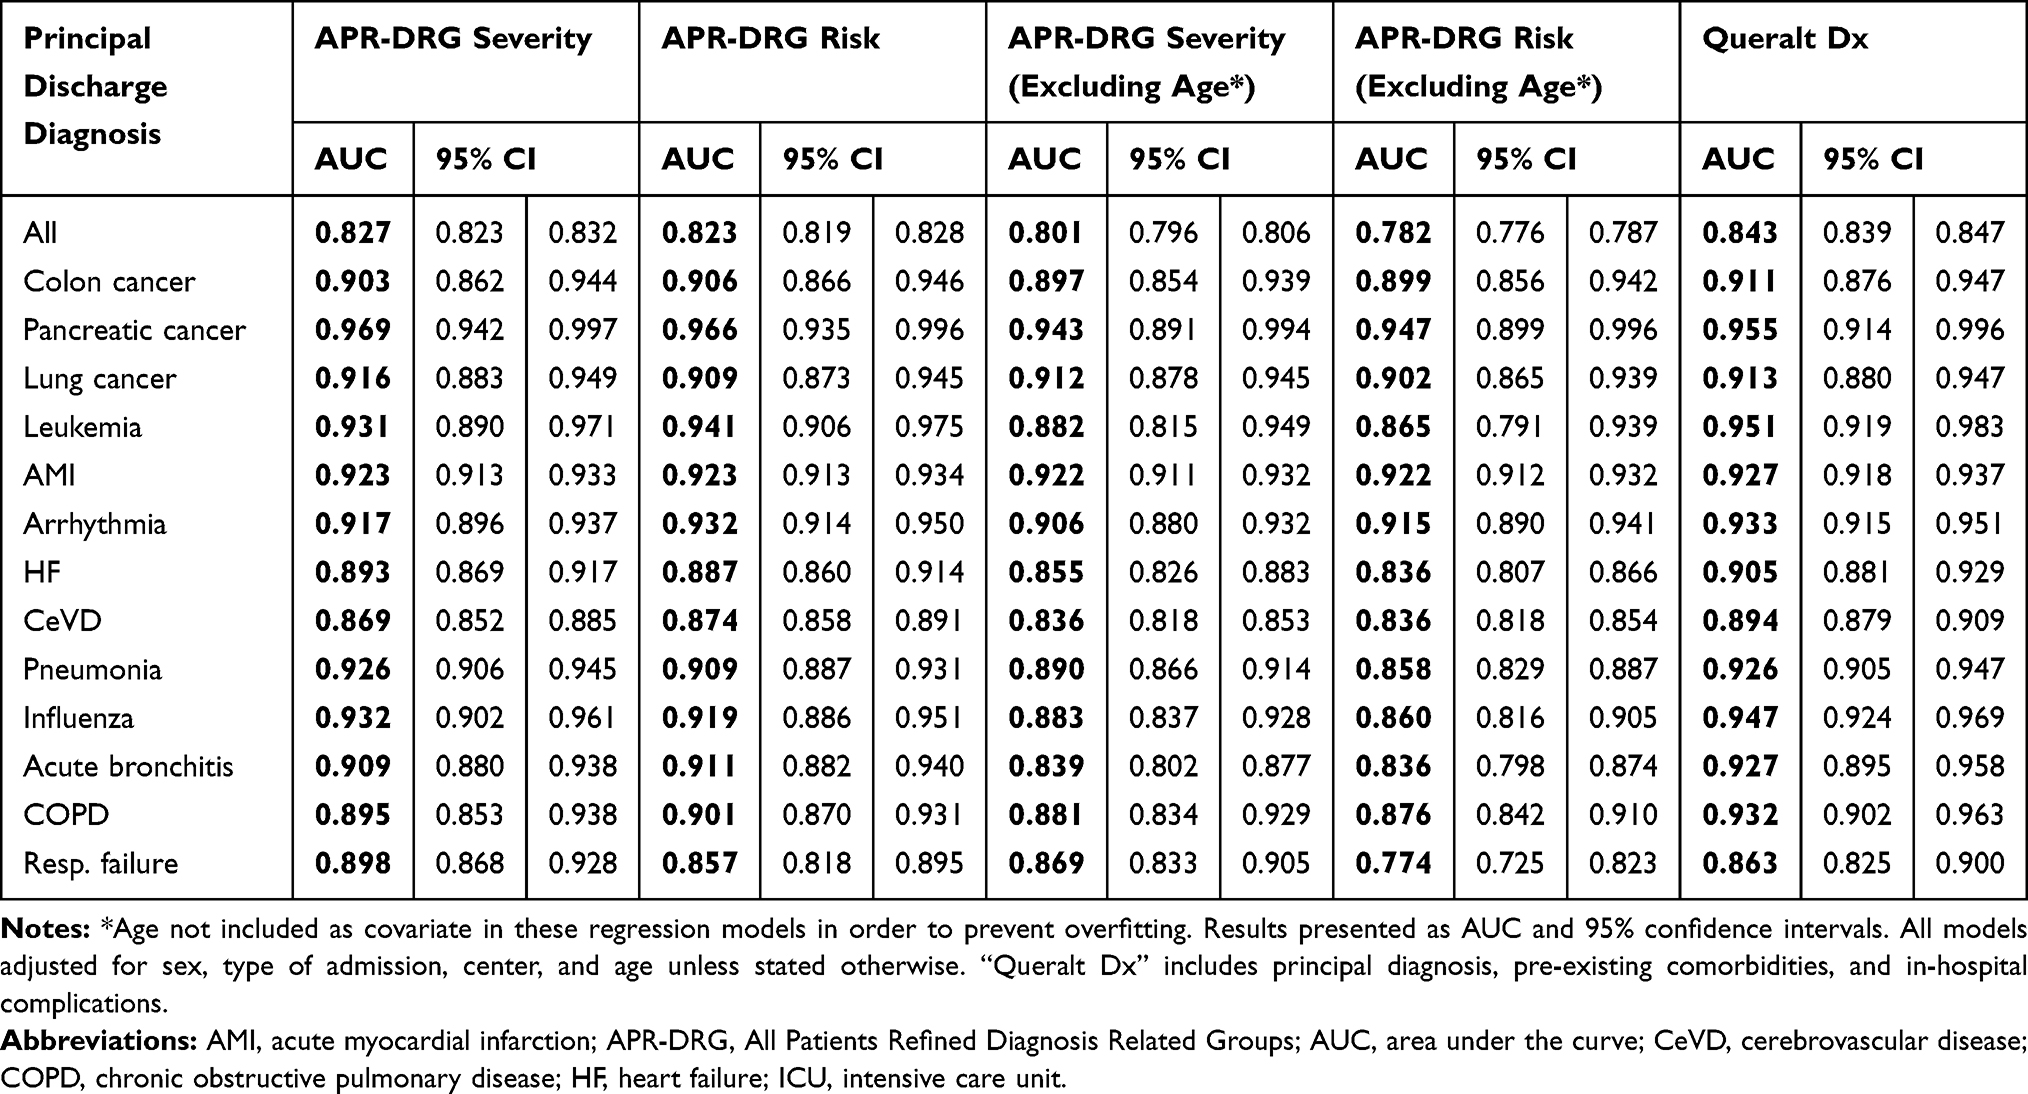 |
Table 7 ICU Stay: AUC Analysis for APR-DRG Measures and the Queralt Dx Index |
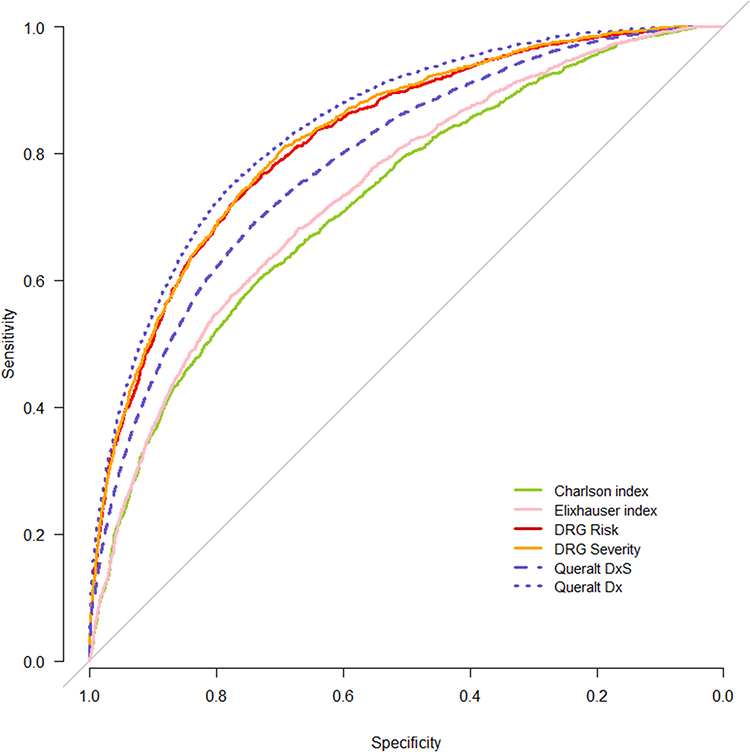 |
Figure 4 ROC curves for the prediction of ICU stay, all hospital discharges. Queralt Dx includes principal diagnosis, pre-existing comorbidities, and in-hospital complications; Queralt DxS includes pre-existing comorbidities. Abbreviations: APR-DRG, All Patients Refined Diagnosis Related Groups; ICU, intensive care unit; ROC, receiver operating characteristic. |
Similar trends were observed in AUC analyses by principal discharge diagnosis (Tables 6 and 7). The exceptions to this were observed in the subgroups of patients with a principal discharge diagnosis of lung cancer and acute myocardial infarction, in which the performance of Queralt DxS was similar to that of the basic model. Nevertheless, in these patients Queralt Dx improved the performance of Charlson’s and Elixhauser’s indices, and had a similar predictive ability as models using APR-DRG.
Consistent results were also observed in subgroup analyses by age and by type of hospitalization, as well as in a sensitivity analysis excluding delivery-related hospitalizations (Table S10).
Discussion
In a population-based analysis including 156,459 hospital discharges from the general population of Catalonia occurring during 2018, a comprehensive comorbidity index (the Queralt DxS) provided relevant risk adjustment information in a larger number of patients compared to the more parsimonious Charlson’s and Elixhauser’s functions, in all age groups. Consistent with this, the Queralt DxS index outperformed the former for the prediction of in-hospital death, long in-hospital stay, and need for ICU stay in hospitalized patients. In addition, incorporation of information on principal discharge diagnoses and in-hospital complications (the Queralt Dx index) outperformed Charlson’s and Elixhauser’s indices even further, and yielded superior overall predictive ability compared to the APR-DRG. The results of several subgroup and sensitivity analyses were consistent with the overall study findings, highlighting the applicability of the Queralt Indices to different patient subgroups and types of hospitalization. The present findings have important implications for improving current risk-adjustment paradigms.
Of note, the Queralt Indices are intended to be a comprehensive family of indices to be used for risk adjustment purposes, rather than for accurate prediction of specific outcomes. For this reason, while it would have been appropiate to exclude, for example, planned hospitalizations when developing a model intended to predict the risk of in-hospital death among urgent hospitalizations, because our aim was to develop and evaluate a risk adjustment measure, we included all types of hospitalization. Consistent with this aim, the models adjusting for each of these risk adjustment tools were compared in terms of their discrimination ability (AUC), rather than their callibration. In the models, key potential confounders (age and type of hospitalization) were adjusted for. Also, to address concerns for potential bias resulting from the inclusion of delivery-related hospitalizations, a sensitivity analysis excluding these was conducted. The results were consistent with those of the main analysis.
In our study, Elixhauser’s outperformed Charlson’s index for the prediction of the 3 study outcomes. This is consistent with prior studies,24,25 and is likely the consequence of the former being a more comprehensive measure of chronic comorbidities than the latter. Our results would support prioritizing Elixhauser’s over Charlson’s index for risk adjustment purposes.
The Queralt DxS index provided relevant risk adjustment information in a much larger number of patients than Charlson’s and Elixhauser’s indices. This was particularly true in younger patients, and is likely explained by the larger number of diagnoses considered relevant by Queralt functions – more than 2100, including both acute and chronic processes – compared to the other indices, which combine very few, exclusively chronic conditions. This likely limits their ability to fully capture a patient’s comorbidity burden. Moreover, the Queralt DxS showed improved predictive ability compared to Charlson’s and Elixhauser’s, which have been two of the gold-standards of comorbidity-based risk adjustment for years.26,27 Therefore, the Queralt DxS index may allow for a more granular comorbidity-based risk adjustment, even within relevant disease groups. This may be relevant for example in patients with heart failure, who may be very heterogeneous in terms of their risk of events.28
In addition, we also observed that inclusion, as part of the risk adjustment strategy, of information on principal discharge diagnoses and on in-hospital complications (the Queralt Dx index) improved discriminative ability and goodness-of-fit even further. This yielded results that outperformed those from the Queralt DxS, and were superior to those from gold-standard case-mix measures such as the APR-DRG. These findings provide support to the notion that risk adjustment should not only consider pre-existing comorbidities, but go beyond those, and incorporate these other features, which also impact a patient’s risk of events.11
The present findings have important implications for current risk adjustment paradigms. In fields in which such adjustment is done retrospectively (e.g., benchmarking), comprehensive comorbidity indices and even more comprehensive tools capturing the whole in-hospital clinical process (i.e., also including principal discharge diagnosis and in-hospital complications) provide an invaluable opportunity to improve current standards beyond strategies based on parsimonious, comorbidity-only indices. In the era of electronic medical records and of widespread use of automated disease coding systems in hospital discharge reports, comprehensive risk adjustment measures such as Queralt’s can be computed easily and automatically, using readily available information. This has the potential to inform healthcare managers and researchers more accurately.
In terms of clinical risk prediction, because the Queralt Dx index uses information generated during the hospitalization, it would be expected to have limited utility for risk assessment on admission. Nonetheless, and although this is not the main purpose of these tools, the Queralt DxS index, which is solely based on pre-existing comorbidities, appears as a potentially valuable tool to identify patients at higher odds of dying, having a long in-hospital stay, or needing an ICU stay during the index hospitalization; more accurately than with traditional tools such as Charlson’s or Elixhauser’s indices. Moreover, it is possible that risk estimations based on comprehensive information generated during preceding hospitalizations (e.g., the Queralt Dx index) could have a value in clinical risk prediction in subsequent in-hospital stays. Nonetheless, further studies are needed to test this hypothesis.
Study Limitations
Some limitations are worth discussing. First, we used an administrative healthcare database to develop the Queralt indices, as well as to conduct the present comparative analysis. Administrative databases are known to have intrinsic limitations when used for research purposes, including the potential for under-recording of medical conditions, or the limited validity of some diagnosis codes, among others.29,30 Nonetheless, in the last decade the quality of this kind of data has improved markedly, including in Catalonia, where the ICS database is considered a high quality research tool.4,31,32
Second, external validation analyses testing the performance of the Queralt indices in other populations and settings are needed to better understand its potential generalizability. Importantly, although Queralt’s indices have been developed using data from 8 large public hospitals of Catalonia, they are flexible, i.e., adaptable to other geographical settings, through the identification and weighing of conditions strongly associated with key outcomes (in-hospital death, length of stay, need for ICU stay, healthcare cost, or other outcomes) within a given setting. The software is available online for research purposes, at no cost.33 Importantly, the Queralt Dx index may perform better in databases such as ICS’s in which pre-existing comorbidities and complications developed during the hospital stay can be differentiated.
Third, in Elixhauser’s index secondary diagnoses related to the principal diagnosis are typically not considered by the score. However, in our analysis we allowed these to be included. This may have overestimated the discriminative ability of Elixhauser’s index, yielding a conservative bias when comparing the performance of the Queralt indices specifically to Elixhauser’s.
Finally, the definition of long hospital stay (as >14 days), although based on the general distribution of duration of hospital stays in our area, may not be completely meaningful in specific subgroups of patients, particularly those with acute, short-duration processes.
Conclusions
Exhaustive comorbidity indices including multiple acute and chronic conditions may have a better performance for risk assessment than often used tools such as Charlson’s and Elixhauser’s. Moreover, our analyses suggest that risk adjustment should go beyond pre-existing comorbidities and include information on principal discharge diagnoses and in-hospital complications. In the era of electronic medical records and of widespread use of automated disease coding systems in hospitalized patients, our findings have important implications for current risk adjustment paradigms, for which exhaustive, comprehensive, automated tools such as the Queralt indices may provide an invaluable, inexpensive opportunity to improve risk adjustment. Validation of these tools in other settings is needed to better understand their generalizability.
Abbreviations
AIC, Akaike’s information criterion; APR-DRG, All Patients Refined Diagnosis Related Groups; AUC, area under the receiver-operator characteristic curve; BIC, Bayesian information criterion; CCS, Clinical Classifications Software; CI, confidence interval; CVD, cardiovascular disease; DRG, Diagnosis Related Groups; ICD-10-CM, International Classification of Diseases, 10th Revision, Clinical Modification; ICS, Catalan Institute of Health (Institut Catala de Salut); ICU, intensive care unit; Queralt DxS, Queralt’s Index for secondary hospital discharge diagnoses, excluding in-hospital, complications; Queralt Dx, Queralt’s Index for secondary hospital discharge diagnoses, including in-hospital complications; ROC, receiver operating characteristic.
Ethics Approval and Informed Consent
The study was approved by the ethics in research committee of the Bellvitge Biomedical Research Institute (IDIBELL). This was a retrospective study, and de-identified data was used. For these reasons, request of written informed consent was not deemed necessary.
Acknowledgments
The authors would like to thank Drs. Josep Maria Argimon, Vicenç Martinez Ibañez, Ana Ochoa de Echagüen Aguilar, and Jordi Trelis Navarro for their valuable support for the development of the Queralt indices.
Author Contributions
All authors made substantial contributions to conception and design, acquisition of data, or analysis and interpretation of data; took part in drafting the article or revising it critically for important intellectual content; gave final approval of the version to be published; and agree to be accountable for all aspects of the work.
Disclosure
David Monterde declares that he is the developer of a software tool that can be used to compute the Queralt Index in clinical, management and research settings. The tool is available online at no cost. Dr Josep Comin-Colet reports grants, personal fees, non-financial support from Vifor Pharma, grants, personal fees from Novartis, grants, personal fees, non-financial support from Orion Pharma, outside the submitted work. The authors declare that they have no other conflicts of interest relevant to the content of this manuscript.
References
1. Schneeweiss S, Maclure M. Use of comorbidity scores for control of confounding in studies using administrative databases. Int J Epidemiol. 2000;29:891–898. doi:10.1093/ije/29.5.891
2. Austin SR, Wong YN, Uzzo RG, Beck JR, Egleston BL. Why summary comorbidity measures such as the charlson comorbidity index and elixhauser score work. Med Care. 2015;53:e65–e72. doi:10.1097/MLR.0b013e318297429c
3. Susser M, Susser E. Choosing a future for epidemiology: I. Eras and paradigms. Am J Public Health. 1996;86:668–673. doi:10.2105/AJPH.86.5.668
4. Farré N, Vela E, Clèries M, et al. Real world heart failure epidemiology and outcome: a population-based analysis of 88,195 patients. PLoS One. 2017;12:e0172745. doi:10.1371/journal.pone.0172745
5. De Jong L, van Rijckevorsel VAJIM, Raats JW, Klem TMAL, Kuijper TM, Roukema GR. Delirium after hip hemiarthroplasty for proximal femoral fractures in elderly patients: risk factors and clinical outcomes. Clin Interv Aging. 2019;14:427–435. doi:10.2147/CIA.S189760
6. Giuliano KK, Baker D, Quinn B. The epidemiology of nonventilator hospital-acquired pneumonia in the United States. Am J Infect Control. 2018;46:322–327. doi:10.1016/j.ajic.2017.09.005
7. Charlson ME, Pompei P, Ales KL, MacKenzie CR. A new method of classifying prognostic comorbidity in longitudinal studies: development and validation. J Chronic Dis. 1987;40:373–383. doi:10.1016/0021-9681(87)90171-8
8. Elixhauser A, Steiner C, Harris DR, Coffey RM. Comorbidity measures for use with administrative data. Med Care. 1998;36:8–27. doi:10.1097/00005650-199801000-00004
9. Stavem K, Hoel H, Skjaker SA, Haagensen R. Charlson comorbidity index derived from chart review or administrative data: agreement and prediction of mortality in intensive care patients. Clin Epidemiol. 2017;9:311–320. doi:10.2147/CLEP.S133624
10. de Groot V, Beckerman H, Lankhorst GJ, Bouter LM. How to measure comorbidity: a critical review of available methods. J Clin Epidemiol. 2003;56:221–229. doi:10.1016/S0895-4356(02)00585-1
11. Ording AG, Sørensen HT. Concepts of comorbidities, multiple morbidities, complications, and their clinical epidemiologic analogs. Clin Epidemiol. 2013;5:199–203. doi:10.2147/CLEP.S45305
12. Centers for Disease Control and Prevention. National Center for Health Statistics. International Classification of Diseases, Tenth Revision, Clinical Modification (ICD-10-CM). Available from: https://www.cdc.gov/nchs/icd/icd10cm.htm. Accessed June 6, 2019.
13. Quan H, Li B, Couris CM, et al. Updating and validating the charlson comorbidity index and score for risk adjustment in hospital discharge abstracts using data from 6 countries. Am J Epidemiol. 2011;173:676–682. doi:10.1093/aje/kwq433
14. van Walraven C, Austin PC, Jennings A, Quan H, Forster AJ. A modification of the Elixhauser comorbidity measures into a point system for hospital death using administrative data. Med Care. 2009;47:626–633. doi:10.1097/MLR.0b013e31819432e5
15. Averill RF, Goldfield N, Hughes JS, et al. All Patient Refined Diagnosis Related Groups (APR - DRGs): methodology overview. Available from: https://www.hcup-us.ahrq.gov/db/nation/nis/grp031_aprdrg_meth_ovrview.pdf.
16. Steyerberg EW, Vickers AJ, Cook NR, et al. Assessing the performance of prediction models: a framework for traditional and novel measures. Epidemiology. 2010;21:128–138. doi:10.1097/EDE.0b013e3181c30fb2
17. Akaike H. A new look at the statistical model identification. IEEE Trans Automat Contr. 1974;19:716–723. doi:10.1109/TAC.1974.1100705
18. Schwarz C. Estimating the dimension of a model. Ann Stat. 1978;6:461–464. doi:10.1214/aos/1176344136
19. Brier G. Verification of forecasts expressed in terms of probability. Mon Weather Rev. 1950;78:1–3. doi:10.1175/1520-0493(1950)078<0001:VOFEIT>2.0.CO;2
20. DeLong ER, DeLong DM, Clarke-Pearson DL. Comparing the areas under two or more correlated receiver operating characteristic curves: a nonparametric approach. Biometrics. 1988;44:837–845. doi:10.2307/2531595
21. Clinical Classifications Software (CCS) for the ICD-10-CM/PCS. Available from: https://www.hcup-us.ahrq.gov/toolssoftware/ccs10/ccs_dx_icd10cm_2018_1.zip.
22. R Core Team. A Language and Environment for Statistical Computing. Vienna, Austria; 2014. Available from: https://www.r-project.org/.
23. CRAN - Package comorbidity - The R Project for Statistical Computing. Available from: https://cran.r-project.org/web/packages/comorbidity/index.html.
24. Lieffers JR, Baracos VE, Winget M, Fassbender K. A comparison of charlson and elixhauser comorbidity measures to predict colorectal cancer survival using administrative health data. Cancer. 2011;117:1957–1965. doi:10.1002/cncr.25653
25. Gutacker N, Bloor K, Cookson R. Comparing the performance of the Charlson/Deyo and Elixhauser comorbidity measures across five European countries and three conditions. Eur J Public Health. 2015;25:15–20. doi:10.1093/eurpub/cku221
26. Sharabiani MTA, Aylin P, Bottle A. Systematic review of comorbidity indices for administrative data. Med Care. 2012;50:1109–1118. doi:10.1097/MLR.0b013e31825f64d0
27. Moltó A, Dougados M. Comorbidity indices. Clin Exp Rheumatol. 2014;32:
28. Ahmad T, Pencina MJ, Schulte PJ, et al. Clinical implications of chronic heart failure phenotypes defined by cluster analysis. J Am Coll Cardiol. 2014;64:1765–1774. doi:10.1016/j.jacc.2014.07.979
29. Suissa S, Garbe E. Primer: administrative health databases in observational studies of drug effects–advantages and disadvantages. Sami suissa Primer Nat Clin Pract Rheumatol. 2007;3:725–732. doi:10.1038/ncprheum0652
30. Scott IA. Hope, hype and harms of big data. Intern Med J. 2019;49:126–129. doi:10.1111/imj.2019.49.issue-1
31. Ramos R, Comas-Cufí M, Martí-Lluch R, et al. Statins for primary prevention of cardiovascular events and mortality in old and very old adults with and without type 2 diabetes: retrospective cohort study. BMJ. 2018;362:k3359. doi:10.1136/bmj.k3359
32. Ramos R, Balló E, Marrugat J, et al. Validity for use in research on vascular diseases of the SIDIAP (Information System for the Development of Research in Primary Care): the EMMA study. Rev Esp Cardiol (Engl Ed). 2012;65:29–37. doi:10.1016/j.recesp.2011.07.017
33. Institut Catala de Salut. Projecte de Queralt. Available from: http://ics.gencat.cat/ca/assistencia/coneixement-assistencial/Projecte-de-Queralt/.
 © 2020 The Author(s). This work is published and licensed by Dove Medical Press Limited. The
full terms of this license are available at https://www.dovepress.com/terms
and incorporate the Creative Commons Attribution
- Non Commercial (unported, 3.0) License.
By accessing the work you hereby accept the Terms. Non-commercial uses of the work are permitted
without any further permission from Dove Medical Press Limited, provided the work is properly
attributed. For permission for commercial use of this work, please see paragraphs 4.2 and 5 of our Terms.
© 2020 The Author(s). This work is published and licensed by Dove Medical Press Limited. The
full terms of this license are available at https://www.dovepress.com/terms
and incorporate the Creative Commons Attribution
- Non Commercial (unported, 3.0) License.
By accessing the work you hereby accept the Terms. Non-commercial uses of the work are permitted
without any further permission from Dove Medical Press Limited, provided the work is properly
attributed. For permission for commercial use of this work, please see paragraphs 4.2 and 5 of our Terms.