Back to Journals » International Journal of Nanomedicine » Volume 18
Pentapeptide cRGDfK-Surface Engineered Nanostructured Lipid Carriers as an Efficient Tool for Targeted Delivery of Tyrosine Kinase Inhibitor for Battling Hepatocellular Carcinoma
Authors Deepak P, Kumar P, Pandey P ![]() , Arya DK, Jaiswal S, Kumar A
, Arya DK, Jaiswal S, Kumar A ![]() , Sonkar AB, Ali D, Alarifi S
, Sonkar AB, Ali D, Alarifi S ![]() , Ramar M
, Ramar M ![]() , Rajinikanth PS
, Rajinikanth PS ![]()
Received 23 September 2023
Accepted for publication 7 November 2023
Published 28 November 2023 Volume 2023:18 Pages 7021—7046
DOI https://doi.org/10.2147/IJN.S438307
Checked for plagiarism Yes
Review by Single anonymous peer review
Peer reviewer comments 2
Editor who approved publication: Prof. Dr. RDK Misra
Payal Deepak,1 Praveen Kumar,2,3 Prashant Pandey,1 Dilip Kumar Arya,1 Shweta Jaiswal,1 Anand Kumar,1 Archana Bharti Sonkar,1 Daoud Ali,4 Saud Alarifi,4 Mohankumar Ramar,5 P S Rajinikanth1
1Department of Pharmaceutical Sciences, Babasaheb Bhimrao Ambedkar University, Lucknow, Uttar Pradesh, India; 2Department of Pharmacy, Indira Gandhi National Tribal University, Amarkantak, Madhya Pradesh, India; 3S.D College of Pharmacy and Vocational Studies, Muzaffarnagar, Uttar Pradesh, India; 4Department of Zoology, College of Science, King Saud University, Riyadh, 11451, Saudi Arabia; 5Department of Pharmacology and Toxicology, School of Pharmacy, University of Connecticut, Storrs, CT, 02903, USA
Correspondence: P S Rajinikanth, Department of Pharmaceutical Sciences Babasaheb Bhimrao Ambedkar University, Lucknow, Uttar Pradesh, 226025, India, Email [email protected]
Background: Antitumor research aims to efficiently target hepatocarcinoma cells (HCC) for drug delivery. Nanostructured lipid carriers (NLCs) are promising for active tumour targeting. Cell-penetrating peptides are feasible ligands for targeted cancer treatment.
Methods: In this study, we optimized gefitinib-loaded NLCs (GF-NLC) for HCC treatment. The NLCs contained cholesterol, oleic acid, Pluronic F-68, and Phospholipon 90G. The NLC surface was functionalized to enhance targeting with the cRGDfK-pentapeptide, which binds to the αvβ 3 integrin receptor overexpressed on hepatocarcinoma cells.
Results: GF-NLC formulation was thoroughly characterized for various parameters using differential scanning calorimetry and X-ray diffraction analysis. In-vitro and in-vivo studies on the HepG2 cell line showed cRGDfK@GF-NLC’s superiority over GF-NLC and free gefitinib. cRGDfK@GF-NLC exhibited significantly higher cytotoxicity, growth inhibition, and cellular internalization. Biodistribution studies demonstrated enhanced tumour site accumulation without organ toxicity. The findings highlight cRGDfK@GF-NLC as a highly efficient carrier for targeted drug delivery, surpassing non-functionalized NLCs. These functionalized NLCs offer promising prospects for improving hepatocarcinoma therapy outcomes by specifically targeting HCC cells.
Conclusion: Based on these findings, cRGDfK@GF-NLC holds immense potential as a highly efficient carrier for targeted drug delivery of anticancer agents, surpassing the capabilities of non-functionalized NLCs. This research opens up new avenues for effective treatment strategies in hepatocarcinoma.
Keywords: nanostructured lipid carrier, αvβ 3 integrin receptor, cRGDfK-pentapeptide, hepatocellular carcinoma, tumour targeting
Graphical Abstract:

Introduction
The worldwide prevalence of liver cancer continues to rise, posing a global health problem. By 2025, it is anticipated that yearly incidences of liver cancer will exceed 1 million. By 2040, liver cancer is projected by the World Health Organization to cause the deaths of over 1.3 million individuals. Hepatocellular carcinoma (HCC) is the primary subtype of liver cancer, constituting 90% of cases.1
There are few available systemic treatments e.g., targeted therapies and immunotherapies for advanced HCC but they may be limited in advanced cases. Systemic therapy, particularly with standard cytotoxic drugs, is frequently unsuccessful. Sorafenib and Lenvatinib are the two drugs that the FDA has approved for use as first-line therapies in the treatment of advanced HCC. However, the difficulty in obtaining these medications in underdeveloped nations ensures that HCC continues to severely limit clinical applicability and highlights the need for novel therapies. Nonetheless, during the past three years, the fast development of molecular targeted treatments has drastically altered the landscape of advanced HCC therapy.2,3
Traditional chemotherapeutic agents for HCC treatment had broad modes of action, such as cytostatic or cytotoxic, and were thus non-targeted along with severe side effects. Drug resistance and hostile effects are problems that might arise while using conventional chemotherapeutic drugs like doxorubicin, cisplatin, and 5-fluorouracil. So, tailored therapeutics like tyrosine kinase inhibitors (TKIs) have resulted in a notable advancement.4,5
Gefitinib is a low molecular weight (Mol. Wt. 446.9) anilinoquinazoline structural basis compound.6 As a tyrosine kinase inhibitor of the epithelial growth factor receptor (EGFR), gefitinib inhibits the proliferation, invasion, and metastasis of tumour cells while increasing their death rate. The fundamental mechanism is that it can suppress the activation of mitogen-activated protein kinase (MAPK) by locking down the signal transmission through competitive binding of Mg-ATP located on the catalytic domain of EGFR-TK, hence triggering apoptosis in cancer cells.7,8
The potential of NLCs as alternative colloidal drug carriers is receiving significant attention. NLCs are generally considered to be second-generation solid lipid nanoparticles (SLNs), and they transport the drug without changing the drug’s composition in any way.9–12
The lipidic component of NLCs consists of a combination of solid and liquid lipids, as opposed to solid lipids alone in SLNs. The addition of liquid lipids converts the completely crystalline structure of SLNs into an imperfect amorphous structure, allowing for a larger drug-loading capacity. Thus, boosting drug loading efficiency and formulation stability by decreasing drug ejection.13 After intravenous administration, the NLC can be passively targeted to the liver and spleen due to its hydrophobic surface. Additionally, NLCs can be manipulated with antibodies or ligands to selectively target tumour tissue.14,15
Active and passive targeting are the two approaches that have been developed in recent years to enhance the therapeutic efficacy of HCC therapy. Due to their diminutive size, nanoscale drug delivery systems can passively target and enter solid tumours, where they are then retained there. However, active targeting is necessary to guarantee that the particles are taken up by the intended cells. Nanotechnology at the surface, is key to this goal. Targeting molecules, which are identified at the location of the tumour, are included in the delivery system to raise the drug’s concentration at targeted cells.16
Since RGD is a potent tumour-targeting ligand, nano-carriers that are conjugated with RGD may be able to efficiently identify and attack tumour cells. Since it is well established that most cancer cell types have overexpressed integrin receptors, surface modification of NLC with integrin targeting ligands (RGD peptides) is an appealing method.17 cRGDfK is a pentapeptide with the highest affinity for the integrin protein receptors that are frequently overexpressed on the liver’s surface. It plays a role in regulating both cell-cell and cell-extracellular matrix interactions, facilitating the simultaneous targeting of different tumour cells as well as angiogenic endothelial cells. In recent years, the field of αvβ3 integrin-mediated bioactive tumour targeting has earned considerable interest.
αvβ3 integrins are expressed by diverse tumour cells, such as HCC cells, breast cancer cells, and lung cancer cells, and have been linked to tumour progression and metastasis. According to literature, the targeting ligand c(RGDfK) offers advantages in terms of endocytosis due to its small molecular weight. Furthermore, its ability to undergo various chemical reactions without being deactivated by other target molecules enhances its potential as a therapeutic agent.18,19Figure 1 represents the anti-cancer mechanism of non-functionalized NLC and functionalized NLC working on HCC cancer cells. In our previous work, we prepared liposome and the surface was functionalized with c(RGDfK) for active targeted delivery of gefitinib for liver targeting. The result was confirmed that anti-cancer activity and targeting ability of the surface functionalized formulation greatly enhanced in in-vitro and in-vivo studies.20
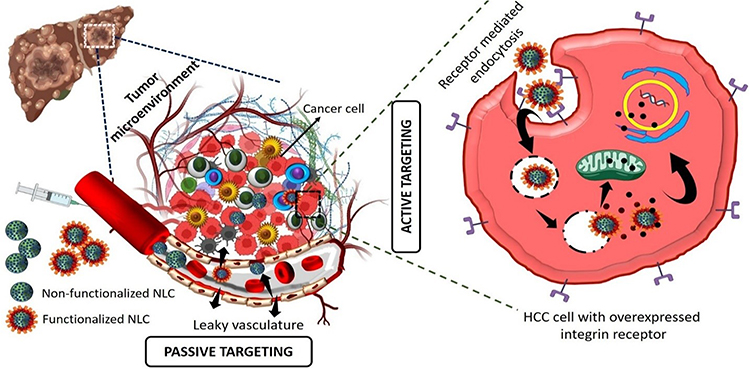 |
Figure 1 Schematic diagram of anti-cancer mechanism of non-functionalized NLC and functionalized NLC working on HCC cancer cells. |
In the current work, we attempt to developed c(RGDfK)-surface functionalized NLCs loaded with gefitinib to target the integrin receptor overexpressed on HCC cells. NLCs were synthesized using the melt emulsification and ultrasonication technique, and the optimal formulation was determined using the Box Behnken design (BBD). The targeting ligand was attached to the surface of nanocarriers by conjugating cRGDfK and DSPE-PEG2000-COOH to minimize the drug toxicity, accomplish tumour targeting and boost therapeutic activity. The particle size (PS), shape, surface morphology, zeta potential (ZP), particle size distribution, entrapment efficiency (EE), drug loading (DL), and in-vitro release pattern of the optimized NLC batch were assessed. Additionally, pharmacokinetic studies, organ biodistribution, histopathological analysis, and oxidative stress marker estimation were performed to assess in-vivo therapeutic efficacy for treating HCC. Moreover, a cytotoxicity study using a MTT assay and cellular uptake of developed NLCs were done against the HepG2 cell line.
Material and Methods
Materials
Gefitinib was obtained as a kind gift from Hetero Drugs Ltd. Hyderabad, India. Cholesterol, Oleic acid, Pluronic F68, 1-Ethyl-3-[3-dimethylaminopropyl] carbodiimide hydrochloride (EDC), sulfo-N-hydroxy succinimide (sulfo-NHS), Triton X-100 were purchased from Sigma-Aldrich (St. Louis, MO, USA). 1.2-distearoyl-sn-glycero-3-phosphoethanol amine-N- [carboxy (polyethylene glycol)-2000] (Na+ salt) (DSPE-PEG2000-COOH) was procured from Avanti polar lipids, Inc. USA. cRGDfK was purchased from APExBIO Technology (Houston, USA). Phospholipon 90G was received as a generous gift sample from Lipoid® (GmbH) Germany.
MTT (3-(4,5-dimethylthiazol-2-yl)-2,5-diphenyl tetrazolium bromide) dye, DAPI (4′,6-diamidino-2-phenylindole, dihydrochloride) dye and FITC (fluorescein isothiocyanate) dye were obtained from Sigma-Aldrich, St. Louis, MO, USA. DMEM (Dulbecco’s modified Eagle’s medium) and FBS (foetal bovine serum) were purchased from Himedia, Mumbai.
IL-2 (RAB0288) and IL-6 (RAB0311) pro-inflammatory cytokines were obtained from Sigma Aldrich, Bengaluru, India. IL-1β (GX-3930-E1) was obtained from Genetix Biotech Asia Pvt. Ltd., New Delhi, India, whereas caspase-9 (ITER0804) was obtained from Geno Technology Inc., Noida, India.
Dialysis membrane (M. Wt. cut off between 12,500 and 14,000 daltons) was acquired from Himedia, Mumbai. Thermo Fisher Scientific Pvt. Ltd., India, supplied the 25 mm (0.2 μm) membrane filters and all other chemicals of analytical quality. In-house deionized water was utilized to conduct the entire experimental work.
Methodology
Development of Gefitinib-Loaded NLC (GF-NLC)
All the GF-loaded NLC batches were prepared by solvent-emulsification and evaporation method followed by ultrasonication with slight modification as reported previously.21,22 Briefly, considering Table 1, different ratio of cholesterol and OA (85:15, 80:20 and 75:25 %w/w) and 50 mg (w/v) Phospholipon 90G (PL-90G) were completely dissolved into ethanol (2.5 mL) at 60°C. A required amount of the drug (30 mg) was dissolved in ethanol (0.5 mL) and added to the lipidic mixture. During the second step, the aqueous phase was prepared by dissolving Pluronic F-68 (PF-68) in distilled water using a magnetic stirrer. The temperature of the aqueous phase was carefully maintained at the same level as the molten lipid phase to avoid recrystallization while stirring. In the final step, the lipid phase was dispersed into an aqueous phase containing different concentrations (0.5–1.5% w/v) of surfactant PF-68 at a temperature of 60°C. The mixture was stirred using a magnetic stirrer at 900 rpm for 15 minutes. Subsequently, the resulting pre-emulsion was subjected to ultrasonication using a probe sonicator at an amplitude of 40% for a duration of 3–9 minutes, resulting in the formation of an oil-in-water (o/w) nanoemulsion. To remove the solvent, the obtained nanoemulsion was stirred at room temperature and a speed of 500 rpm for 3 hours. Figure 2 shows the schematic illustration of development of GF-NLC and cRGDfK@GF-NLC.
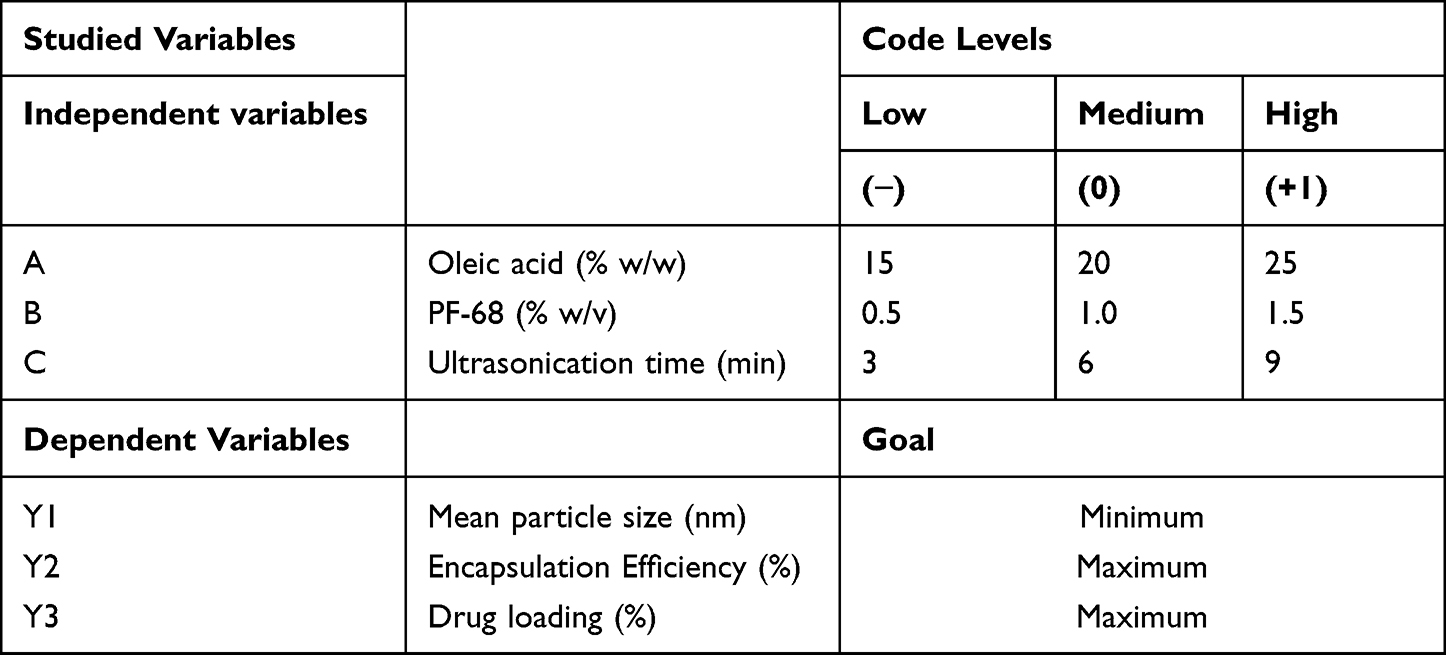 |
Table 1 Development of GF-NLCs by Solvent-Emulsification and Evaporation Method Followed by Ultrasonication: Variables and Their Levels for Box-Behnken Design |
 |
Figure 2 Schematic illustration of preparation method of (A) non-functionalized NLC (GF-NLC), (B) functionalized NLC (cRGDfK@GF-NLC) and (C) representative structure of cRGDfK@GF-NLC. |
Lyophilization of the Developed NLCs
Suspensions of non-functionalized NLCs and functionalized NLCs were lyophilized so that they could be re-dispersed in a stable and facile manner. As a cryoprotectant, 10% w/v mannitol was added to the NLCs preparation. In a freeze-dryer (Lyolab 3000, Heto, India), samples were lyophilized at −80 °C for 24 hour after being pre-frozen for 12 hour at −20 °C. Lastly, the powders were reconstituted with distilled water.23
Optimization of GF-NLC by Box-Behnken Experimental Design
To optimize the formulation of GF-NLCs, a Box-Behnken design (BBD) was employed, utilizing a three-factor, three-level design. Design-Expert® software (Trial version 13.0) was utilized for this purpose. The factors, or independent variables, chosen for optimization were the concentration of liquid lipid (X1), surfactant (X2), and ultrasonication time (X3), each set at low (−1), medium (0), and high (+1) levels, respectively. A total of 15 experimental trials were generated based on this design and evaluated for particle size (Y1), percentage entrapment efficiency (Y2), and percentage drug loading (Y3) as the dependent or response variables. The design matrix, including the different combinations of factors and the corresponding response values, is presented in Table 1. By employing a quadratic polynomial model, the cause-and-effect relationship between the independent and dependent variables was determined through mathematical modelling. Mathematical optimization with the desirability function and graphical optimization with an overlay plot were used to determine the best possible optimal formulation.
Development of cRGDfK-Surface Functionalized NLCs (cRGDfK@GF-NLC)
Conjugation of pentapeptide to optimized NLC (F11) was accomplished via carbodiimide reaction between an amine group of peptides and a carboxylic group of DSPE–PEG2000–COOH by using activation of EDC/NHS chemistry as stated by the previously reported method with slight modification.24,25 Briefly, the optimized NLC formulation containing cholesterol, oleic acid, PF-68 and PL-90G in the optimized ratio was decided for cRGDfK conjugation. The ratio of DSPE-PEG2000-COOH to cRGDfK used in the formulation was 1:2 on a molar basis. For 5 mL NLC formulation, 75 mg (w/v) of cholesterol, 25 mg (w/v) of oleic acid and 50 mg (w/v) of PL-90G along with 40 μL of DSPE–PEG2000–COOH (0.2 mM), 10 μL of EDC (200 mM), and 10 μL of NHS (200 mM) were added to the ethanolic solution and vortex until it got clear. DSPE–PEG2000–COOH was used as a linker, and EDC/sulfo-NHS were used as a coupling agent or catalyst. The above lipidic solution was added dropwise into a PF-68 containing aqueous phase (12 mL) under a magnetic stirrer (900 RPM) and incubated for 30 minutes at room temperature. After 30-minute, 0.4 mM solution of cRGDfK which was prepared in phosphate buffer saline (PBS), pH 7.4 was added dropwise with moderate stirring (500 rpm). The resulting reaction mixture was kept aside under gentle stirring overnight at room temperature to achieve the conjugation. The excess quantity of unreacted cRGDfK peptide was separated through a dialysis membrane (MW. 12,000 Dalton, Himedia, India) against distilled water.
Physicochemical Characterization of GF-NLC and cRGDfK@GF-NLC
FTIR and 1H NMR spectroscopy: The FTIR spectra of pure GF, cholesterol, oleic acid, PL-90G, PF-68 and the physical mixture of Chol/PL-90G, Chol/PL-90G/PF-68 and GF/Chol/PL-90G/PF-68 were examined to check the intermolecular interactions between the components consisting of GF-loaded NLC. Furthermore, blank and GF loaded NLC formulations (non-functionalized and surface functionalized both) were observed and recorded by using an FT-IR spectrophotometer (Nicolet 6700, Thermo Scientific, USA). All the FTIR data were examined in the 4000 cm−1 to 400 cm−1 spectral region. Origin Pro Lab 2021 software was used to analyse and graph the data.
1H-NMR (FT-NMR, Bruker Avance 400) analysis was performed to verify the conjugation between the cRGDfK peptide and the DSPE-PEG2000-COOH. Chemical shifts (δ) were measured as parts per million/ppm after dissolving the samples (10 mg) in DMSO-d6. An internal standard of tetramethyl silane (TMS) was used in the study.
Particle Size (PS), Polydispersity Index (PDI), Zeta Potential (ZP) and Surface Morphology
The mean particle size, PDI, and ZP of each formulation run was measured by the Differential light scattering (DLS) method via NanoPlus-3, zeta/nanoparticle analyser (Yokohama/Japan). Prior to measurement, the samples were diluted with ultra-purified water at a ratio of 1:5 to achieve a slight opalescence. All measurements were conducted in triplicate, and the results were reported as the mean ± standard deviation (SD).
Surface morphology and shape of developed GF-NLC and cRGDfK@GF-NLC were examined by using SEM (JEOL 6490 LB, Tokyo, Japan) and TEM (TECNAI 200 kV) technique. The samples were prepared according to the previously reported protocol and the photomicrographs were captured at an ambient temperature by using TEM Fei, Electron Optics.26
Differential Scanning Calorimetry (DSC)
The physical state of GF inside the GF-NLC and cRGDfK@GF-NLC was determined by DSC (Setaram, LABSYS DSC 131, 700 °C). The samples (5–10 mg) were purged at a flow rate of 10 mL/min with dry nitrogen. The rate of heat addition was 10 °C min−1. The sample was scanned from the range of 20 °C to 350 °C.
Powder X‑Ray Diffraction (P-XRD) Analysis
The X-ray diffractometer (D8 Advance Eco, Bruker, Germany) equipped with a copper anode (Cu Kα radiation, 30 mA, 40 kV, λ=1.54 Å) was employed to examine the crystalline structure of pure GF, GF-NLC, and cRGDfK@GF-NLC (lyophilized with 10% w/v mannitol). The data acquisition involved scanning the samples in the 2θ (diffraction angle) range of 2°-80 °C at ambient temperature. The measurements were typically performed with a step width of 0.04° and a detector resolution. A scanning rate of 2°/min was utilized during the data collection process.
Encapsulation Efficiency (EE) and Drug Loading (DL) Determination
The % EE of developed GF-NLC and cRGDfK@GF-NLC were calculated by indirect method.21,27 For this, a 1.5 mL of NLCs preparation was centrifuged (15,000 RPM) at 4 °C for 30 min to measuring the amount of free GF in the dispersion. The free GF amount remained in the supernatant was calculated by using UV–Vis Spectrophotometer (Labtronics LT-2910) at 254 nm. A 0.22 μm membrane filter (Thermo Fisher Scientific Pvt. Ltd., India) was used to purify samples before analysis. Each test was conducted in triplicate and obtained values were expressed as mean± SD. The percentage entrapment efficiency (% EE) and percentage drug loading (% DL) of the prepared NLCs were determined using the following formula:


In-vitro Drug Release Profile
The dialysis bag diffusion method under sink conditions was used to calculate the in-vitro percent drug release of GF-NLC and cRGDfK@GF-NLC. For the release studies, a dialysis bag (M.W. 12,500 Dalton) with an average pore size of 2.4 nm was used which was activated by soaking it for 24 h in release media containing pH 7.4 PBS. In brief, the drug-loaded NLC dispersions (2 mL) were introduced into a dialysis bag and carefully sealed at both ends. The filled dialysis bag was then suspended in a 200 mL beaker containing 100 mL of pH 7.4 PBS at a controlled temperature of 37 ± 1°C. The system was subjected to mechanical agitation at 100 rpm for a duration of 48 hours. At specified time intervals, 2 mL of aliquots were taken out and refilled with the fresh release media in order to keep the sink condition constant. Prior to analysis, all the reserved samples were filtered by using a syringe filter (0.45 μm). Finally, using a UV spectrophotometer (Labtronics LT 2910) set to 254 nm, the amount of GF from GF-NLC and cRGDfK@GF-NLC was calculated. A plot of percent cumulative GF release was constructed against the time (hour).28
Blood Compatibility Assay
To evaluate the potential haemolytic toxicity, the spectrophotometric analysis was employed to measure the haemoglobin content in the supernatant of the centrifuged suspension of red blood cells (RBCs). Briefly, blood sample was collected from the healthy male Wistar rat in a prefilled K2-EDTA (anticoagulant) microcentrifuge tubes (MCT) via retro-orbital plexus puncture method. Obtained blood was centrifuged for 15 min at 3000 RPM to isolate the RBCs. The settled RBC pellet was gently washed four to five times with PBS (7.4) to remove serum proteins and debris. The clear supernatant was carefully discarded and make the 10% haematocrit solution with PBS. 100 μL of haematocrit solution was mixed with 900 μL of GF, GF-NLC and cRGDfK@GF-NLC at a different concentration in separate tube for assessing the percentage of haemolysis. All the samples were incubated at 37°C for 30 min following the centrifugation at 3000 RPM for 15 min. Finally, the haemoglobin release in obtained supernatant was assessed via UV-visible spectrophotometer (Labtronics LT 2910) at 540 nm λmax. 1% Triton X100 and PBS (7.4 pH) was taken as a positive control, and a negative control, respectively.29,30 All the experiment was done in triplicate, and the data were expressed as mean± SD.
The following formula was used to calculate the percent haemolysis.
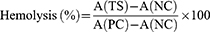
Where A (TS) denotes the mean absorbance of the supernatant of the test sample (RBC with GF/GF-NLCs/cRGDfK@GF-NLC), A (NC) and A (PC) are the mean absorbance of the supernatant of negative control and positive control, respectively.
In-Vitro Anticancer Activity Study on HepG2 Cell Line
MTT Assay for Cytotoxicity Study
The MTT assay was conducted using a HepG2 cell line obtained from the National Centre for Cell Science (NCCS) in Pune, India. The MTT [3-(4,5-di-methylthiazol-2-yl)-2,5-diphenyl tetrazolium bromide] assay is a widely accepted colorimetric assay used to quantify the enzymatic activity of living cells by observing the purple colour produced when MTT is reduced. Cytotoxic substances would cause metabolic dysfunction.
Briefly, HepG2 cells were cultured in 96-well cell culture plates at a density of 1×10⁴ cells/well. The culture medium used was Dulbecco’s Modified Eagle Medium (DMEM) supplemented with 1% v/v antibiotic solution (penicillin and streptomycin) and 10% v/v foetal bovine serum (FBS). For the next 24 hours, the cells were exposed to 5% (v/v) CO2, 95% (v/v) air, and 95% relative humidity (RH) at 37 ± 2°C temperature. Freshly prepared solutions of free GF, developed GF-NLC, and cRGDfK@GF-NLC samples in DMSO were applied at concentrations ranging from 5 to 25 μg/mL. Following a 4-hour incubation at 37°C, each well of the plate was supplemented with 20 μL of MTT (5 mg/mL) solution. This addition facilitated the conversion of MTT into purple-coloured formazan crystals by viable cells, leading to a noticeable reduction in their numbers. In order to solubilize the formazan crystal, 100 μL of DMSO was mixed to each well. The half-maximal inhibitory concentration (IC50) of free GF and the developed NLC (non-functionalized and functionalized both) were calculated based on the absorbance measurement at 540 nm.22,31
Cellular Internalization Ability Study
Both FITC-NLC and cRGDfK@FITC-NLC were fluorescently tagged with the green fluorescent dye fluorescein isothiocyanate (FITC). These FITC-tagged NLC were prepared in the same way as GF-NLC and cRGDfK@GF-NLC, with the exception that FITC dye was loaded in place of GF during the NLC development process.
Briefly, HepG2 cells were seeded in a 96-well culture plate at a density of 1×10⁴ cells/well. The cells were then incubated with FITC-NLC and cRGDfK@FITC-NLC at 37 °C in a 5% CO2/95% air atmosphere until they reached 70% confluence, as indicated by the presence of fluorescent tracers. Following incubation, the cells were fixed with 4% w/v paraformaldehyde solution for 30 minutes, followed by three washes with ice-cold PBS. Similarly, the cell nuclei were stained with DAPI (2 mg/mL) dye by incubating the cells with the dye for 30 minutes, followed by three washes in ice-cold PBS to remove any unbound dye. After that, a glass slide was used to mount the cells so that they could be imaged under an inverted laser scanning confocal microscope.32
In-vivo Animal Study
Animal Testing Ethics Declaration
The Male Wistar experimental rats were acquired from Veterinary & Animal Sciences (LUVAS), Hisar, Disease Free Small Animal House (DFSAH), India and were housed in a laboratory. All animal treatments conform to ethical standards. The institutional animal ethics Committee (IAEC) of SD College of Pharmacy & vocational studies, Muzaffarnagar approved the animal experimentation procedure (Approval No. SDCOP&VS/AH/CPCSEA/02/14). All the experiments involving animals followed the National Institutes of Health’s Guide for the Care and Use of Laboratory Animals (NIH Publication No. 18–23, 1985).
Experimental Design
In-vivo animal study was conducted on Male Wistar rats weighing 180–230 g which were randomly categorized into five groups. All the rats were housed in a controlled laboratory environment (25 ± 2°C, 60 ± 5% RH, 12 hour dark/light cycles), fed standard pellets with free access to clean and fresh water ad libitum. Prior to the study, all rats were acclimatised for seven days. The experiment protocol was followed precisely as outlined in Table 2.
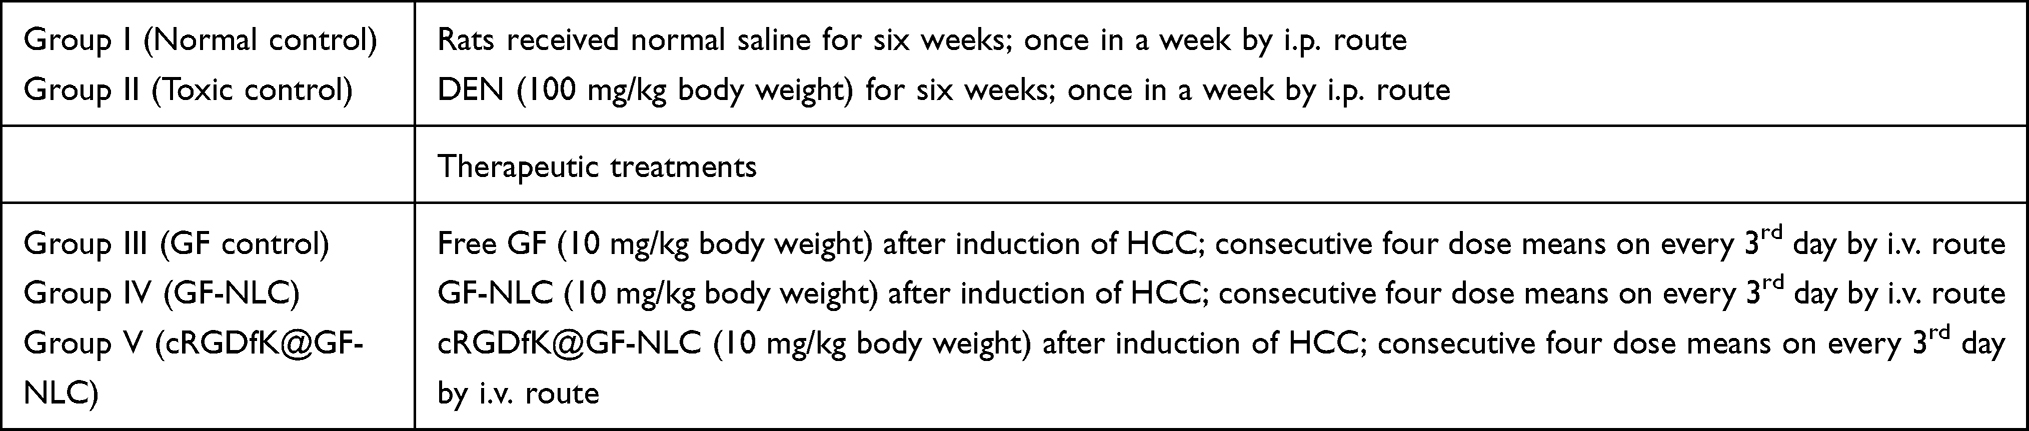 |
Table 2 Experimental Groups Used in the in-vivo Animal Study to Assess the Outcome of Therapeutic Treatment in DEN Induced HCC Wistar Rats |
Body Weight Variation, Liver Index, Tumor Burden and Tumor Incidence Measurement
On the initial day and final day (sacrifice day), the body weight of each rat was recorded, and a graph was drawn to analyse the weight change of each group over the duration of the experiment. Absolute liver weights were divided by animal body weights to calculate liver index. Tumour burden and tumour incidence number were describing the percent of number of nodules per liver and percentage of rat carrying tumour during the study respectively.
Pharmacokinetic (PK) Study
Eighteen healthy adult male Wistar rats, which were fasted for 12 hour before the experiment, were used for the PK study. All the animals were randomly categorized into three groups named as GF (Group I), GF-NLC (Group II), and cRGDfK@GF-NLC (Group III). A single i.v. injection of the respective formulations (10 mg/kg) were administered to each group animal. A blood sample (0.5 mL) was collected via retro-orbital plexus at predefined time intervals (0.25, 0.5, 1, 2, 4, 8, 12, 24, and 48 hour) and stored in a microcentrifuge tube coated with potassium EDTA (10% w/v). Subsequently, the tubes were centrifuged (3000 RPM) for 10 min, and the plasma was separated, it was stored at −20 °C for further analysis. To construct the standard plot of GF in plasma, 100 μL blank plasma was mixed with 100 μL standard working solutions of different concentrations in methanol, vortex it and centrifuged for 30 min (15000 RPM). Following centrifugation, the transparent solution in the centrifuge concentrator was evaporated, and the resulting residue was dissolved in 200 μL of methanol. Afterwards, the samples were passed through a 0.22-μm membrane filter and subjected to drug content analysis using a previously validated RP-HPLC method with minor adjustments, as mentioned in the references.9,33 The analysis involved utilizing a C18 column and a mobile phase consisting of a combination of ACN, methanol, and water (70:20:10) at a flow rate of 1 mL/min. To determine the pharmacokinetic parameters, a non-compartmental analysis model was employed, and the calculations were performed using PK solver software, an add-in for Microsoft Excel (Version 2.0).
In-vivo Organ Biodistribution Study
Biodistribution studies were conducted to evaluate the targeting ability of pure GF, GF-NLC, and cRGDfK@GF-NLC to the tumour site. Rats with DEN-induced HCC were administered an intravenous (i.v.) injection of GF-suspension and the prepared formulations at an equivalent dose of 10 mg/kg via the tail vein. To examine their biodistribution, the animals were sacrificed at specific time intervals (4, 12, 24, and 48 hours), and organs such as the liver, lung, kidney, heart, and spleen were extracted for analysis. All the organs were rinsed in normal saline to get rid of any lingering sticky tissues, and then they were frozen at −20°C for future research. Prior to biodistribution analysis, tissue samples were accurately measured and weighed, and homogenates were prepared by combining 250 mg of tissue with 1 mL of methanol and centrifuging at 15,000 RPM for 20 minutes. All homogenates were made at 40C to prevent sample deterioration. The obtained supernatant was then reconstituted in methanol after being dehydrated. Using the validated HPLC method, the concentration of GF in different organs was determined.7,34
Histopathological Examination
For the study, immediately following isolation, a 10% formaldehyde solution was used to fix the tissues. Various concentrations of ethanol were used to dehydrate the liver samples, which were then subjected to xylene and finally embedded in paraffin. These H&E-stained slides were cut at a thickness of 5 µm and examined under a 40X magnification light microscope for morphological changes.35
Assessment of Oxidative Stress Marker and Lipid Profile in Blood Serum
To determine oxidative stress markers, liver tissue was weighed accurately (10% w/v) and homogenized with 0.15 M KCl at 4°C. After centrifuging the sample at 15,000 RPM for 15 minutes, the supernatant was collected for analysis. Subsequently, the levels of oxidative stress markers including superoxide dismutase (SOD), catalase (CAT), glutathione (GSH), and thiobarbituric acid reactive substances (TBARS), were measured following established protocols.36,37
For the evaluation of total cholesterol (TC), triglycerides (TG), and high-density lipoprotein (HDL), a lipid profiling kit sourced from Avecon Healthcare Pvt. Ltd. in Haryana, India, was utilized. Additionally, the levels of low-density lipoprotein (LDL) and very low-density lipoprotein (VLDL) were determined using the Friedewald formula, which is expressed as follows:


Assessment of Various Enzyme Markers
To analyse the enzyme levels, blood serum samples were required. Commercially available kits were employed to quantify the levels of alanine aminotransferase (ALT), alkaline phosphatase (ALP), and aspartate aminotransferase (AST).
In-vivo Biosafety Evaluation
All rats were euthanized after receiving four consecutives i.v. dose (10 mg/kg), and their major organs (liver, heart, spleen, lung, and kidney) were removed, paraformaldehyde-fixed, sliced, and haematoxylin- and eosin-stained for analysis (H&E). Image J software detected images of tissue sections.22
Assessment of Proinflammatory Cytokines by ELISA
Hepatic tissue was analysed for increased levels of pro-inflammatory cytokines using commercially available ELISA kits following manufacturer’s instructions. Caspase-9 activity was also measured using ELISA according to the manufacturer’s instructions.
Stability Studies
The stability study of developed NLCs was performed as per the ICH guidelines at 25°C ± 2°C/60% relative humidity (RH) ± 5%RH for their PS, %EE and %DL characteristics for 3 months.
Statistical Analysis
The mean ± standard deviation was used to sum up the numerical data. GraphPad Prism (version 8.0) statistical software was used to conduct statistical analysis. The in vitro and in vivo studies were evaluated using ANOVA (one-way and two-way) followed by Dunnett and Tukey’s multiple-comparison tests as suggested by the Graph Pad prism software. **** (p < 0.0001), *** (p < 0.001) both represent a highly significant level, ** represents a high significance level (p < 0.01) and * represents a significant level (p < 0.05) compared with the DEN control group.
Result and Discussion
Optimization of GF Loaded NLC by Box Behnken Design (BBD)
The role of the formulation variables, such as oleic acid, surfactant PF-68, ultrasonication time, and their interactions, were studied using the response surface method (RSM). The Design expert software generated a design matrix based on data from 15 experimental runs. The confirmatory GF loaded NLC formulation was developed in triplicate and compared to the predicted response in order to validate the data generated from the box Behnken experimental design space. The measured value of dependent variables of the various trial formulations was fitted into the model milieu, and a quadratic polynomial model was found to be the best-fitting model. The results of the 15 runs of GF loaded NLCs formulations and their relevant responses are shown in Table 3.
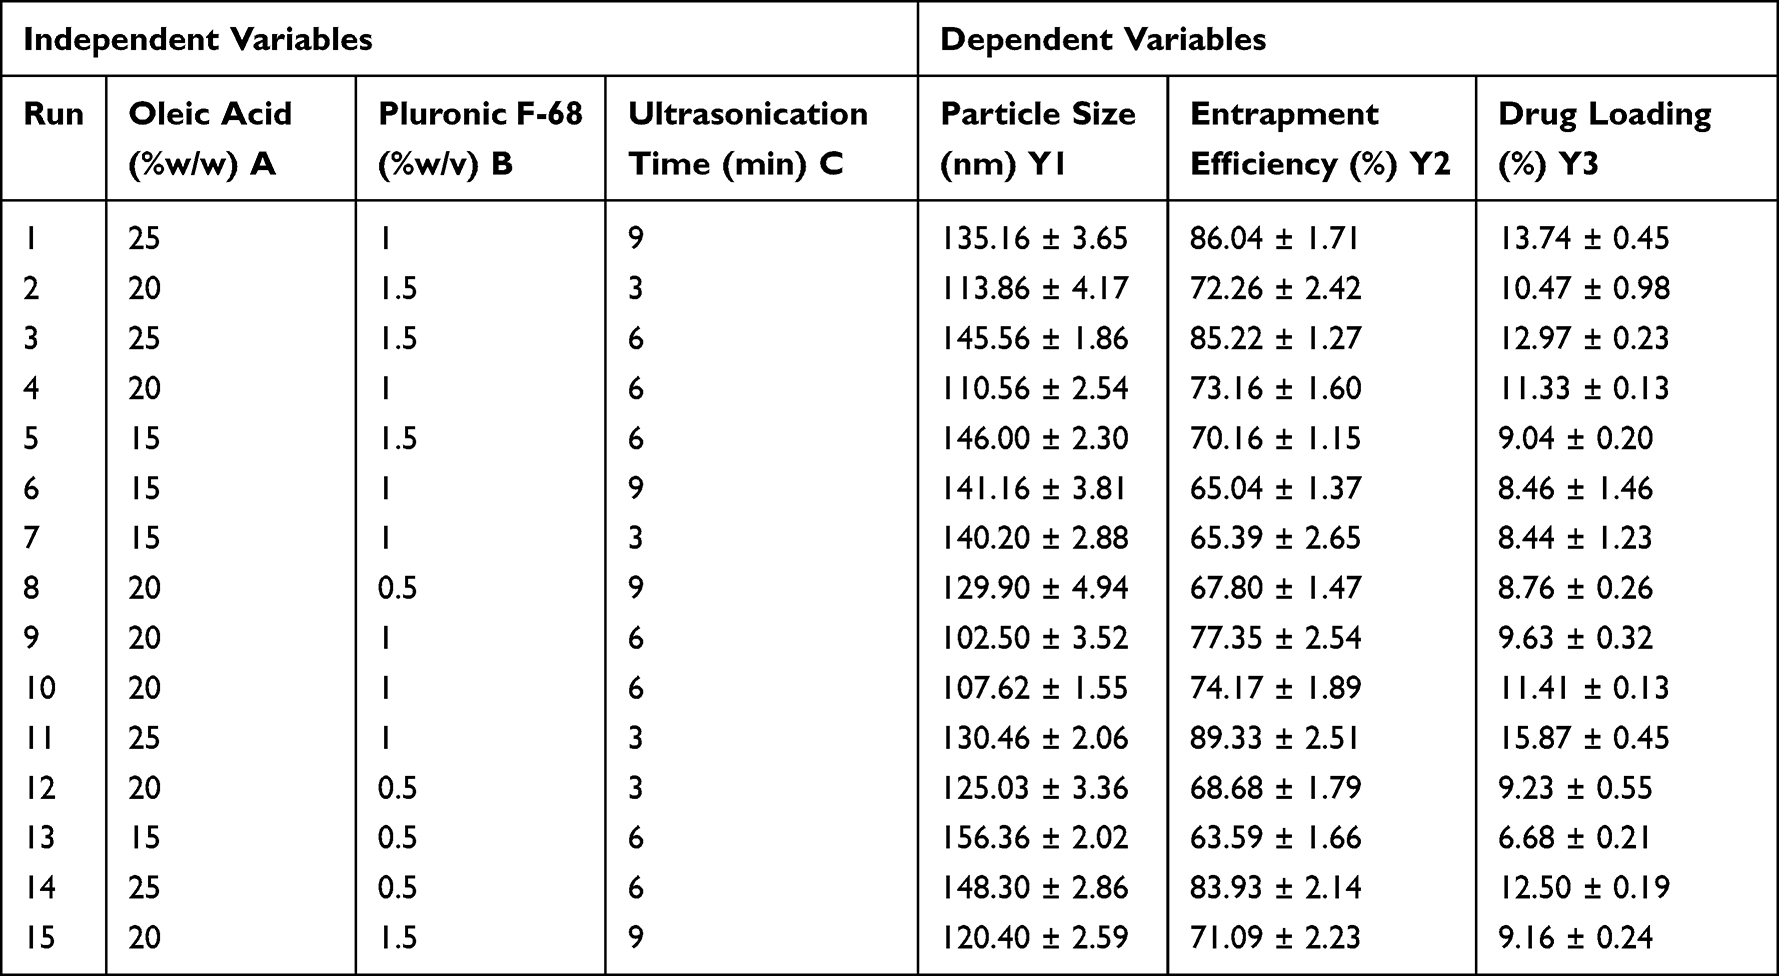 |
Table 3 Box–Behnken Experimental Runs of GF-NLC with Experimental Value of Particle Size (Y1), % Entrapment Efficiency (Y2), and % Drug Loading (Y3) |
Impact of Independent Variables on the Particle Size (Response Y1)
Figure 3A–C and Table 3 illustrate the impact of each independent variable on PS of developed GF-NLC. Based on the results, the PS of each of the prepared formulations ranged from 102.50 ± 3.52 nm to 156.36 ± 2.02 nm.
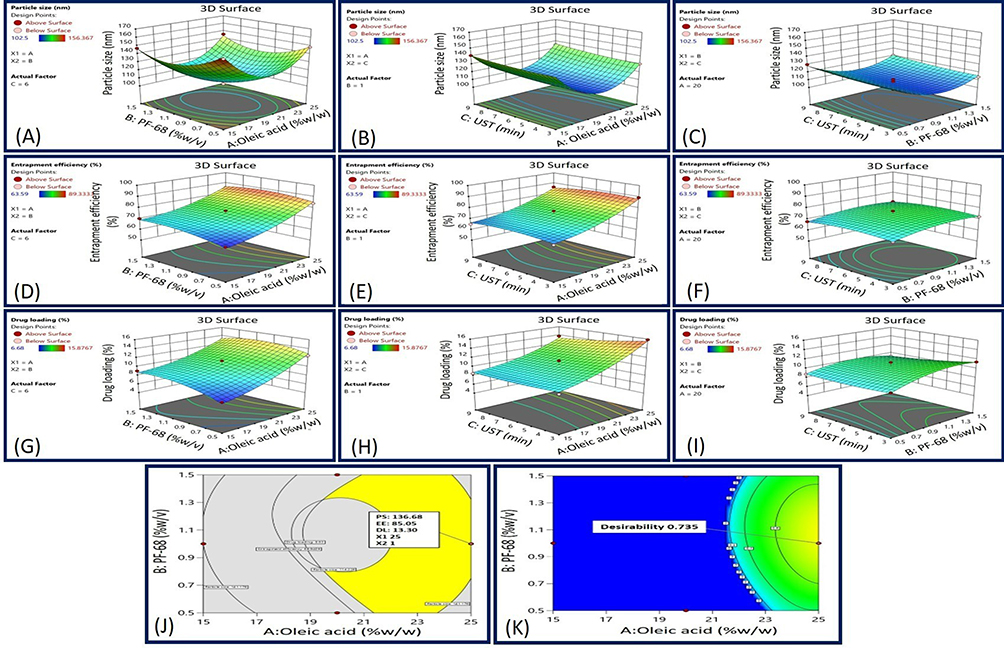 |
Figure 3 3D surface response plot representing (A) the impact of Oleic acid and PF-68 concentrations on PS, (B) the impact of Oleic acid concentration and UST on PS, (C) the impact of PF-68 concentration and UST on PS, (D) the impact of Oleic acid and PF-68 concentrations on EE, (E) the impact of Oleic acid concentration and UST on EE, (F) the impact of PF-68 concentration and UST on EE, (G) the impact of Oleic acid and PF-68 concentrations on DL, (H) the impact of Oleic acid concentration and UST on DL, (I) the impact of PF-68 concentration and UST on DL, (J) overlay plot, and (K) desirability graph. |
The RSM generated polynomial regression equation for PS with respect to A, B and C are as follows:

Where, A is the oleic acid content, B is the concentration of surfactant PF-68 and C is the ultrasonication time.
For the above quadratic equation, the plus (+) and minus (-) both the signs indicated the direction of the change in response as a function of the factors. The significant impact of oleic acid, PF-68 and ultrasonication time on PS was revealed by One-way ANOVA for the Quadratic model (p-value < 0.05). With a P-value of 0.5826 for lack of fit, model terms were insignificant. According to fit statistics, adjusted R2 and predicted R2 values were found to be 0.9436 and 0.7999, respectively, ensuring that the difference of less than 0.2.
Based on the above polynomial equation, it was concluded that PS of NLC decreased as the oleic acid content increased from 15% to 20%. The decreased core viscosity and increased fluidity of NLC may have contributed to this phenomenon. As a result, the surface tension of the particles continued to decrease, and more fine particles were formed. Though, increasing the oleic acid content further disrupted the NLCs’ protective wall, leading to their clustering and subsequent enlargement.
On increasing the PF-68 concentration, the PS decreased initially and then slightly increased. This is likely due to the fact that at low PF-68 concentration, there may not be enough surfactant molecules occur to entirely cover the surfaces of the newly formed particles. To prevent the aggregation of individual particles and improve stability, it is anticipated that increasing the initial surfactant concentration will reduce interfacial tension and create steric hindrance on the surface of NLC. However, further increases in surfactant concentration can cause excess surfactant molecules to deposit on the NLC surface, resulting in a slight increase in size. Conversely, the ultrasonication time (factor C) did not have a significant impact on PS. A slight decrease in size was observed with longer ultrasonication times, approaching the central value.38–40
Impact of Independent Variables on the Percent Entrapment Efficiency (Response Y2)
The impact of different GF-NLC variables on percent EE can be seen in Figure 3D–F and Table 3. The %EE of developed GF-NLC batches were varied from 63.59 ± 1.66% to 89.33 ± 2.50%. The RSM generated polynomial regression equation for PS with respect to A, B and C are as follows:

Where, A is the oleic acid content, B is the concentration of surfactant PF-68 and C is the ultrasonication time.
One-way ANOVA results for the Quadratic model exposed the significant effect of oleic acid content, PF-68 concentration and ultrasonication time on percent EE (p-value < 0.05). Lack of fit was found to be insignificant with an F-value of 0.83 related to the pure error. The 3D surface response plot (Figure 3D–F) revealed a significant increment in %EE with increasing the oleic acid content. Most likely, this is because of the creation of many imperfections in the NLCs structure which provides more space to the drug entrapment.38
Furthermore, an increase in % EE was found by increasing the PF-68 concentration and ultrasonication time initially and later decreased. Increasing the concentration of surfactant can enhance the distribution of the drug and promote its solubilization in both the lipid and aqueous phases. But on further increment, the lipid matrix may become saturated and drug escapes the matrix which led to the decrement in EE.41 Furthermore, ultrasonication (UST) aided the migration of drug molecules from the aqueous phase to the lipid matrix, enhancing drug entrapment. However, excessive or prolonged UST could potentially lead to the release of loosely bound drugs.42
Impact of Independent Variables on the Percent Drug Loading (Response Y3)
The %DL in the GF-loaded NLC is significantly influenced by all the formulation variables. % drug loading of the developed formulations was varied from 6.68 ± 0.21%-15.87 ± 0.45%. The overall effect of GF-NLC variables (A, B and C) on the %DL can be understood by the RSM generated quadratic equation given below:

The significant impact of oleic acid content, PF-68 concentration, and ultrasonication time on percent DL was revealed by One-way ANOVA for the Quadratic model (p˂0.050). In fit statistics, adjusted R2 and predicted R2 values were found to be 0.9128 and 0.7403, respectively, ensuring that the difference of less than 0.2. Lack of Fit F-value of 0.53 indicates the lack of fit is insignificant relative to the pure error. On increasing the oleic acid content, percent drug loading was increased significantly due to massive disruptions of crystal order which offers the ample space for loading the drug in the NLCs.22 In contrast, PF-68 surfactant concentration and ultrasonication time resulted in an increased percent drug loading up to a certain limit and then declined. Higher PF-68 concentration potentially boosts partitioning and solubilization of drug in lipid matrix. However, as the lipid matrix saturates, drug escapes and percent drug loading decreases. Moreover, the application of UST enhanced drug loading by facilitating the transfer of drug molecules from the aqueous phase into the lipid matrix. However, excessive or prolonged ultrasonication could potentially result in the release of drugs that were only loosely bound.42
Optimization and Point Prediction Through Desirability and Overlay Plot
In order to achieve the desired outcome ie, minimum PS, maximum % EEand % DL, the formulation was optimized using both desirability and overlay plot criteria. Desirability function and the obtained observed values of optimized GF-NLC via overlay plot are displayed in Figure 3J and K), respectively. The optimized GF-NLC specifications were PS 114.22 nm to 141.17 nm, EE 68.94% to 89.33%, and DL 9.63% to 15.87%. These standards led to the selection of 25% w/w oleic acid, 1% PF-68 and 9 min ultrasonication time. Based on these standards, the optimized GF-NLC formulation was developed.
Physicochemical Characterization of GF-NLC and cRGDfK@GF-NLC
Confirmation of Surface Functionalization Conjugation via FTIR and 1H-NMR
Carbodiimide reaction between DSPE-PEG2000-COOH and the cRGDfK designated for the development of the cRGDfK@GF-NLC. The FTIR and 1H-NMR results confirmed that cRGDfK was successfully conjugated to DSPE-PEG2000-COOH on the NLC surface. Figure 4A displays the FT-IR spectra of the individual excipients and the physical mixtures used in the NLC preparation. Likewise, Figure 4B represents the FT-IR spectra of pure GF, GF-NLC, B-NLC, cRGDfK@B-NLC, GF-NLC with linker and cRGDfK@GF-NLC. The FT-IR spectrum of pure GF exhibits an absorption peak at 1623 cm-1, which corresponds to the stretching vibrations of C=N. Additionally, peaks observed at 1025 cm−1 and 1118 cm-1 are attributed to the stretching vibrations of C-F and C-O, respectively.43 The presence of the DSPE-PEG2000-COOH group on the NLC surface was revealed by the characteristic absorption peak at 1728 cm−1 and 1656 cm−1 due to of C=O of ester and acid, respectively, in the GF-NLC/Linker spectra. An amide bond (O=C-NH) was formed between the carboxylic group of DSPE-PEG2000-COOH and the amine group of cRGDfK peptide, as evidenced by a new absorption band at 1646 cm−1 /1649 cm−1 and at 1438 cm−1 characterised by C=O stretching and N-H bending vibration in the blank and GF loaded surface functionalized NLC (Figure 4B).17
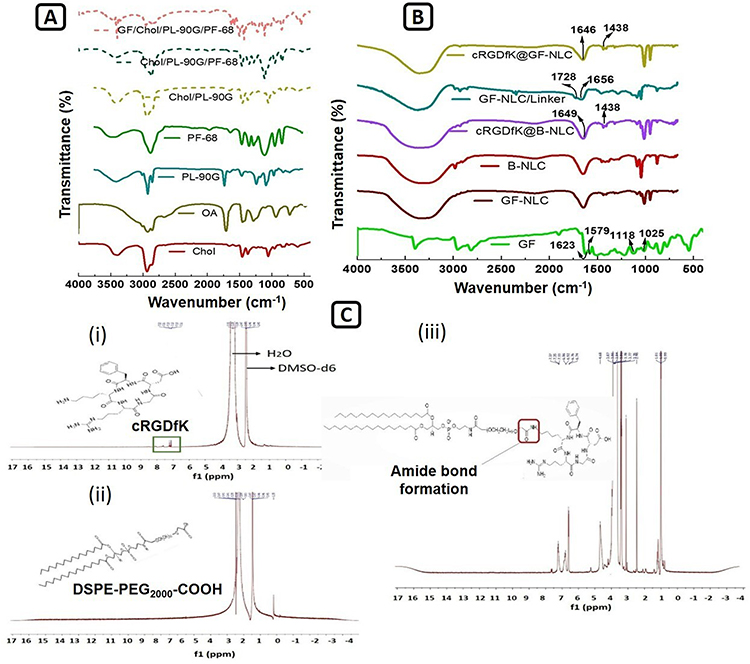 |
Figure 4 FT-IR spectra of Cholesterol, Oleic acid, Phospholipon 90G, PF-68 and the physical mixture of Chol/PL-90G, Chol/PL-90G/PF-68 and GF/Chol/PL-90G/PF-68 (A), Pure GF, GF-NLC, B-NLC#, cRGDfK@B-NLC#, GF-NLC with Linker and cRGDfK@GF-NLC (B), and 1H-NMR Spectra of (i) cRGDfK peptide, (ii) DSPE-PEG2000-COOH and (iii) DSPE-PEG-cRGDfK conjugate presenting amide bond formation (C). (#B denotes the term blank means formulation without drug). |
1H-NMR spectra of cRGDfK, DSPE-PEG2000-COOH, and the conjugate DSPE-PEG2000-cRGDfK are displayed in Figure 4C. Peptide benzene rings and secondary amides (C-NH) showed a chemical shift of 7.11–8.5 ppm in Figure 4C (i). Figure 4C (ii) provides evidence that the proton peaks at 1.19 and 3.53 ppm can be attributed to the DSPE and -CH2 protons of the PEG component in DSPE-PEG2000-COOH. Furthermore, the chemical shift observed between 6.84 and 7.71 ppm in Figure 4C (iii) confirms the chemical conjugation of DSPE-PEG2000-COOH with the benzene ring and secondary amide (C-NH) of the cRGDfK peptide. In addition, DMSO-d6 and water were identified independently via their characteristic peaks at 2.42 and 3.24 ppm as reported in previous study.44
Particle Size (PS), Polydispersity Index (PDI), Zeta Potential (ZP) and Surface Morphology
According to the DLS results, the PS values of the GF-NLC and cRGDfK@GF-NLC were 137.83 ± 5.55 nm, 140.66 ± 2.17 nm, and their respective PDIs were 0.243 ± 0.09 and 0.166 ± 0.07. The PDI value below 0.3 indicated that the developed formulation was monodispersed. Furthermore, the NLC functionalized with cRGDfK on the surface exhibited a marginal increase in PS in comparison to the non-functionalized NLC. These findings proved that the developed NLCs were effective at delivering drug by exploiting their increased permeability and retention effect. Both GF-NLC and cRGDfK@GF-NLC had negative ZP of −26.22 ± 4.01 mV and −31.76 ± 5.21, respectively (Figure 5E and F).
 |
Figure 5 The SEM micrograph of GF-NLC at magnification of X150 (A), the TEM micrograph of GF-NLC after dilution (B), the SEM micrograph of cRGDfK@GF-NLC at magnification of X500 (C), the TEM micrograph of cRGDfK@GF-NLC after dilution (D), PS intensity distribution and mobility distribution/ZP of GF-NLC (E), and PS intensity distribution and mobility distribution/ZP of cRGDfK@GF-NLC (F), scale bar (100 nm). |
The SEM and TEM micrograph showed that the NLCs were round and had a smooth exterior. cRGDfK@GF-NLC, had a distinct, surface-functionalized layer, as seen in TEM and SEM micrographs (Figure 5A–D). All the particles were in the nanometres sized.
Differential Scanning Calorimetry (DSC)
The differential scanning calorimetry (DSC) thermograms for pure GF, GF-NLC, and cRGDfK@GF-NLC are illustrated in Figure 6A. The melting point of pure GF, as shown by the thermogram, was determined to be 195.83 °C, with an associated enthalpy of 132.58 J/g (the starting and ending temperatures were 194.27 and 198.26 °C, respectively). Though, no GF melting peak was found in GF-NLC and cRGDfK@GF-NLC. This could mean that no GF escaped from the NLC system (both non-functionalized and functionalized), suggesting that the GF was successfully entrapped within the carrier system.43 Moreover, the addition of mannitol caused an additional sharp melting peak at 165.57 °C to be seen in both the formulations ie, GF-NLC and cRGDfK@GF-NLC. It was noted that mannitol (10% w/v) was used to lyophilized the developed NLC, prior to DSC analysis.
 |
Figure 6 DSC thermogram of the pure GF, GF-NLC and cRGDfK@GF-NLC (A), and XRD pattern of pure GF and the developed blank NLC (B-NLC), GF-NLC and cRGDfK@GF-NLC (B). |
P-XRD Analysis
The diffraction patterns of pure GF, lyophilized B-NLC, GF-NLC and cRGDfK@GF-NLC are illustrated in Figure 6B. As previously reported in the literature,45,46 pure GF is highly crystalline and exhibits a remarkably high intense peak at 15.95, 19.45, 22.6, 24.37, 26.38 and 26.49. However, the characteristic GF peak was either significantly attenuated or completely absent in the GF-NLC and cRGDfK@GF-NLC, demonstrating substantial entrapment of GF inside the lipid core of the developed NLC in the amorphous form. The Figure 6B, showed that the pattern of GF-NLCs was not significantly different from that of B-NLCs, suggesting that GF’s inclusion did not alter the intrinsic properties of NLCs.
Entrapment Efficiency (EE) and Drug Loading (DL) Determination
The observed % EE and % DL of GF-NLC and cRGDfK@GF-NLC were found to be 81.59 ± 8.02%, 79.21 ± 4.78% and 12.75 ± 6.35%, 11.25 ± 4.85%, respectively. Whereas, the predicted % EE and % DL values of developed GF-NLC obtained by the BBD were 85.05% and 13.30% respectively, which showed a slight variation from the observed value. Since there was no statistically significant difference between the % EE and % DL of cRGDfK@GF-NLC and GF-NLC, we can conclude that the addition of cRGDfK on non-functionalized NLC did not alter these parameters (Figure 7A).
 |
Figure 7 Physico-chemical characterization of B-NLC, GF-loaded NLC, cRGDfK@B-NLC and cRGDfK@GF-NLC (A), comparative in-vitro drug release study of GF-suspension, GF-NLC and cRGDfK@GF-NLC at pH 7.4 in PBS (B), and percent haemolysis measurement of the developed NLC at various concentration (C). ***Represents P<0.001 and considered as highly significant. |
In-vitro GF Release Profile
Figure 7B illustrates the release profile of GF from GF-suspension, GF-NLC, and cRGDfK@GF-NLC in PBS (at 7.4 pH). The release curve exhibited an initial burst of drug followed by a sustained release. For 48 hours, GF-suspension, GF-NLC, and cRGDfK@GF-NLC each showed a release of 95.63 ± 4.04%, 83.91 ± 11.24% and 75.10 ± 5.21%, respectively. According to the findings, approximately 80% of GF was released from the GF-suspension, whereas approximately 40% of GF was released from the GF-NLC and cRGDfK@GF-NLC within 4 hours, followed by the slow and prolong release pattern up to 48 hours. The observed burst effect in release studies can typically be attributed to the presence of unencapsulated drug on the surface of NLC. Additionally, the sustained release patterns of NLC can be attributed to the release of drug particles from the NLC core, as they partition between the aqueous phase and the lipid matrix, while also considering the barrier function of the interfacial membrane. According to the diffusion studies, the amount of GF that can diffuse across the functionalized NLC surface is curtailed owing to the presence of cRGDfK. To evaluate the release kinetics, data obtained from the in-vitro GF release study were fitted to various kinetic models. Table 4 reveals that the Korsmeyer-Peppas model provided the best fit to the release data, as measured by the strength of their respective correlation coefficients (R2). This finding is evident that Fickian diffusion was the key driving force behind the transport of GF from the GF-NLC and cRGDfK@GF-NLC.43,47
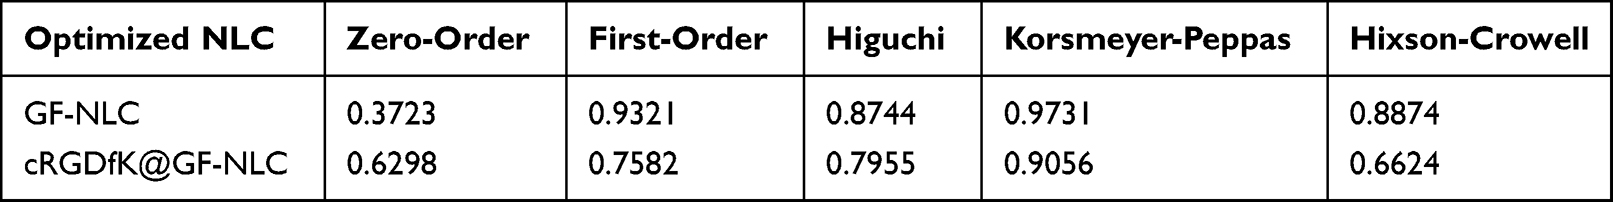 |
Table 4 Correlation Coefficients (R2) for Various Kinetic Models to Fix the Best Fit by Using DD Solver Software |
Blood Compatibility Assay
To ensure the safest possible intravenous administration (i.v.), haemolysis of the GF-loaded NLC (Non-functionalized and functionalized both) was studied. Haemolysis was thought to indicate irritation of RBC by developed formulation, an issue of critical importance for reliable in vivo drug delivery. According to the results, shown in Figure 7C, the haemolytic behaviour appears to be concentration-dependent, with higher concentrations leading to more haemolysis. The developed functionalized NLC showed an excellent hemocompatibility, as evidenced by the significantly lower haemolysis (2.37 ± 0.22%) on erythrocytes at the higher concentration of 0.5 mg/mL when compared to gefitinib drug and GF-NLC. The significance level was determined through a two-way analysis of variance (ANOVA) and subsequently confirmed using the Dunette’s multiple-comparison test.
MTT Assay for Cytotoxicity Study
Cytotoxicity studies were conducted with both blank NLC and GF-loaded NLC (both non-functionalized and functionalized) at 5–25 μg/mL concentration to ascertain the impact of target ligand cRGDfK on HepG2 cell lines. Based on the findings, blank NLC and blank cRGDfK-surface functionalized NLC showed nearly 9.02 ± 2.21% and 12.23 ± 0.62% growth inhibition respectively, across all conditions studied as shown in Figure 8C, indicating that the non-toxic nature of the formulations with HepG2 cells. With no change to the percent cell growth inhibition, the NLC system is a promising choice for GF delivery, validating the optimised delivery system’s favourable safety profile. In contrast, GF-loaded non-functionalized and cRGDfK-surface functionalized NLC had a substantial effect on the percentage of growth inhibition. A linear relationship between GF, GF-NLC, and cRGDfK@GF-NLC concentrations and growth inhibition was observed. The obtained results revealed the percent growth inhibition of free GF, GF-NLC and cRGDfK@GF-NLC found to be 30.12 ±2.03%, 49.24 ± 1.96% and 58.48 ± 5.48%, respectively.
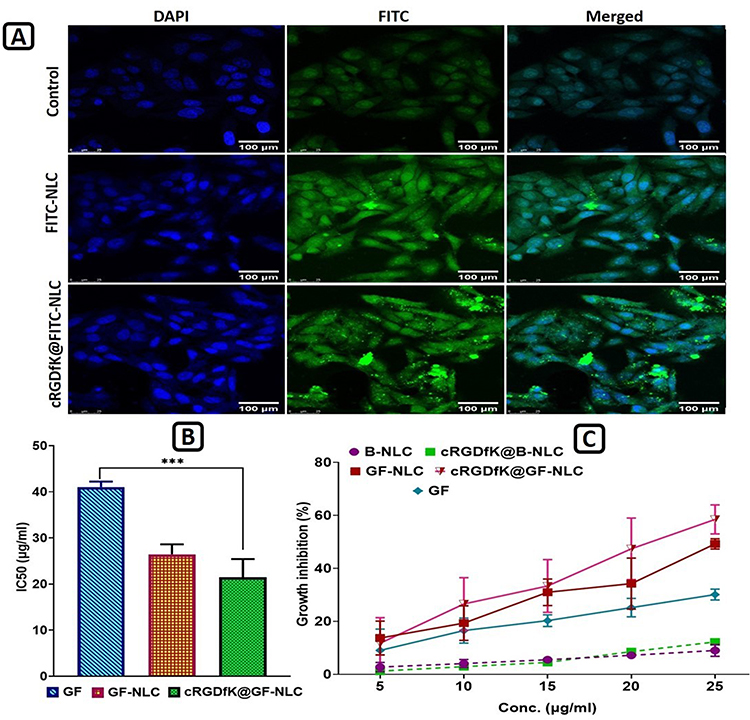 |
Figure 8 Confocal laser scanning microscopy (CLSM) images showing cellular internalization of FITC-NLC and cRGDfK@FITC-NLC into cultured HepG2 cells (A), IC50 values of Gefitinib (GF), GF-NLC and cRGDfK@GF-NLC (B), and growth inhibition percentage graph of B-NLC, cRGDfK@B-NLC, GF-NLC, cRGDfK@GF-NLC and free GF-drug over the period of 72 h (C). (B denotes the term blank means formulation without active compound). All the data are expressed as mean ±SD (n=3). P value˂0.001 is represented by ***And indicates highly significant data. Scale bar (100 μm). |
The half-maximal inhibitory concentration (IC50) values for free GF, GF-NLC and cRGDfK@GF-NLC were found to be 41.05 ± 1.16, 26.43 ± 2.17 and 21.47 ± 3.93 μg/mL respectively, indicating that NLCs have significantly greater antitumor activity than free GF-drug.
Cellular Internalization Ability Study
Evaluation of the targeting effect of cRGDfK-surface functionalized NLC can be accomplished by monitoring their internalisation into cells via Confocal laser scanning microscopy (CLSM). Compared to FITC-NLC, cRGDfK@FITC-NLC exhibited greater cellular internalisation after 8 hours of incubation as shown in Figure 8A. HepG2 cells, on the other hand, showed almost no fluorescence after being incubated in PBS. Endocytosis mediated by αvβ3-integrins receptors was responsible for the increased internalisation of cRGDfK-surface functionalized NLC, suggesting the involvement of interactions between the cRGDfK group and its receptor. Treatment of Hep G2 cells with non-functionalized-NLC and cRGDfK-surface functionalized-NLC led to a damaged nucleus and split, clustered chromatin, as indicated by DAPI staining. Compared to cells treated with non-functionalized NLC, cells treated with cRGDfK-functionalized NLC displayed notable increases in nuclear splitting, nuclear chromatin condensation, and the formation of apoptotic bodies.
In-vivo Animal Study
Evaluation of Hepatic Physiological Parameters
Several physiological parameters such as animal body weight, weight variation, rat liver weight, liver index, tumour burden, and tumour incidence number were assessed to evaluate the therapeutic efficacy of GF, GF-NLC, and cRGDfK@GF-NLC. Figure 9F demonstrates that in the DEN control group, both liver weight and body weight variation in rats were significantly higher compared to the normal control group. However, treatment with GF, GF-NLC, and cRGDfK@GF-NLC restored normal body weight fluctuations. Figure 9D reveals a noticeable enlargement of rat liver after treated with DEN for six weeks. Moreover, compared to the GF, GF-NLC treated group, the cRGDfK@GF-NLC treated group showed a significant decrease in liver weight. DEN alone increased the liver index by 266.67 ± 0.57%, while GF-NLC and cRGDfK@GF-NLC increased it by 109.65 ± 0.14% and 100.12 ± 0.21%, respectively, compared to the normal control group at the end of the study. These findings suggested that cRGDfK@GF-NLC curtailed DEN-induced liver enlargement significantly.
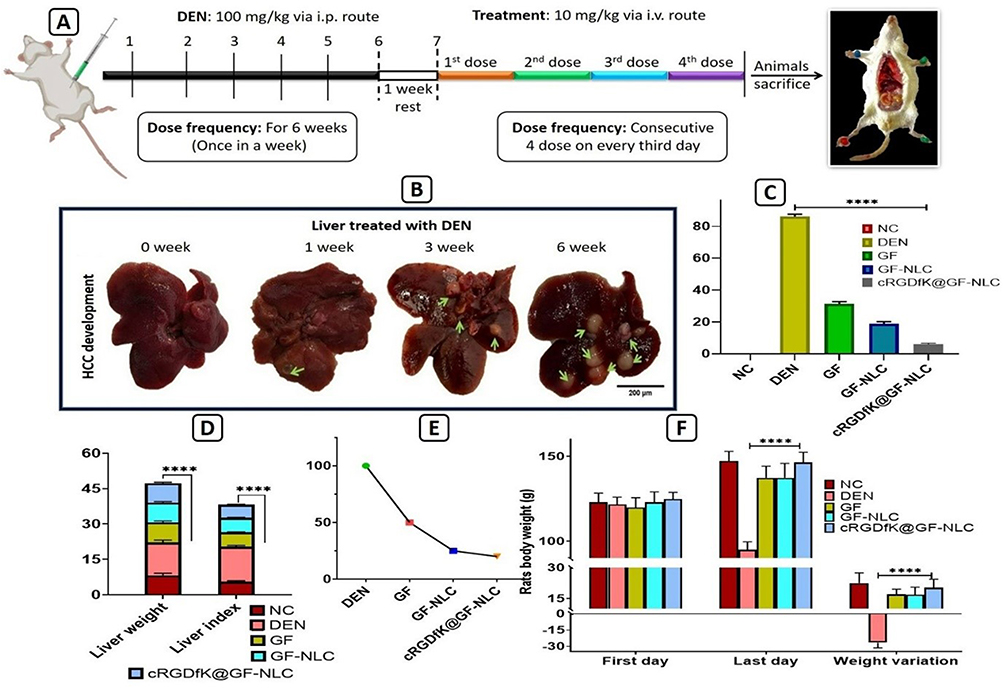 |
Figure 9 Experimental protocol for in-vivo animal study (A), development of HCC after i.p. administration of DEN in rats till the six weeks (B), % tumour burden (C), liver weight and liver index (D), % tumour incidence in DEN induced HCC rats (E), and weight variation analysis before and after the treatment of GF, GF-NLC and cRGDfK@GF-NLC in DEN-induced HCC rats (F). All the data are represented as mean ±SD (n=3), statistical significance is tested by Tukey’s multiple comparisons tests where four asterisks (****) denotes highly significant P ˂0.0001, scale bar (200 μm). |
Pharmacokinetic (PK) Study
Figure 10 (i) displays the chromatogram of GF showing retention time (RT) 4.181 at 254 nm through HPLC & Figure 10 (ii) displays the pharmacokinetic profiles of the developed GF-NLC, cRGDfK@GF-NLC formulation, and GF suspension after i.v. administration. Table 5 articulates the pharmacokinetic parameters. The plasma concentrations of GF in rats treated with GF-NLC and cRGDfK@GF-NLC formulation were consistently higher than in rats treated with GF suspension across all time points. Table 5, demonstrate that the half-lives (t1/2) for GF suspension, GF-NLC and cRGDfK@GF-NLC were 7.66±1.70, 11.07±3.57 and 14.69 ±4.94 hour respectively. PK studies showed that the plasma distribution of cRGDfK@GF-NLC was roughly four times higher than that of GF-NLC, as measured by the area under the concentration-time curve (AUC). It is possible that the nanoformulation’ enhanced permeation and retention (EPR) in the tumour microenvironment is the reason of the longer half-life and higher AUC.
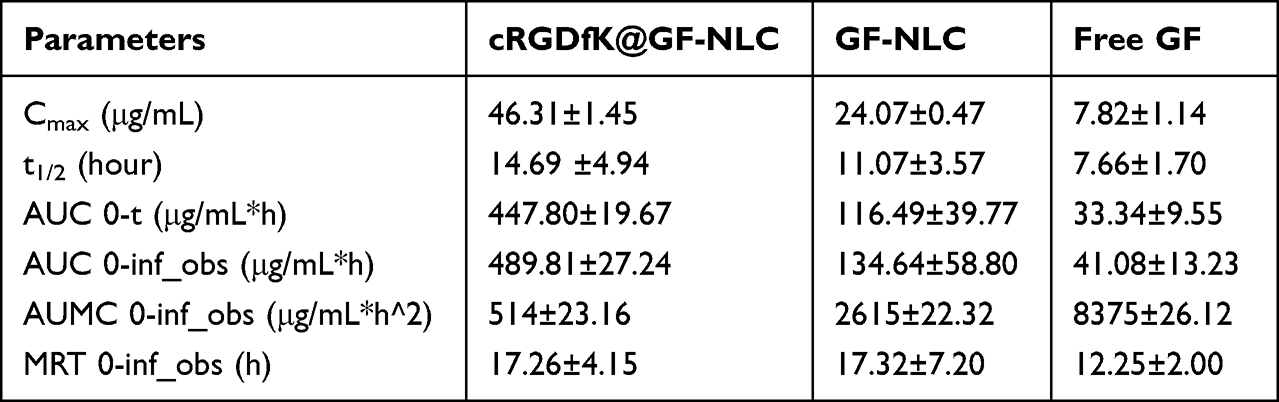 |
Table 5 Pharmacokinetic Parameters of Free GF Suspension, GF-NLC and cRGDfK@GF-NLC as Obtained by PK Solver Software (All the Values are Expressed as Mean ±SD) |
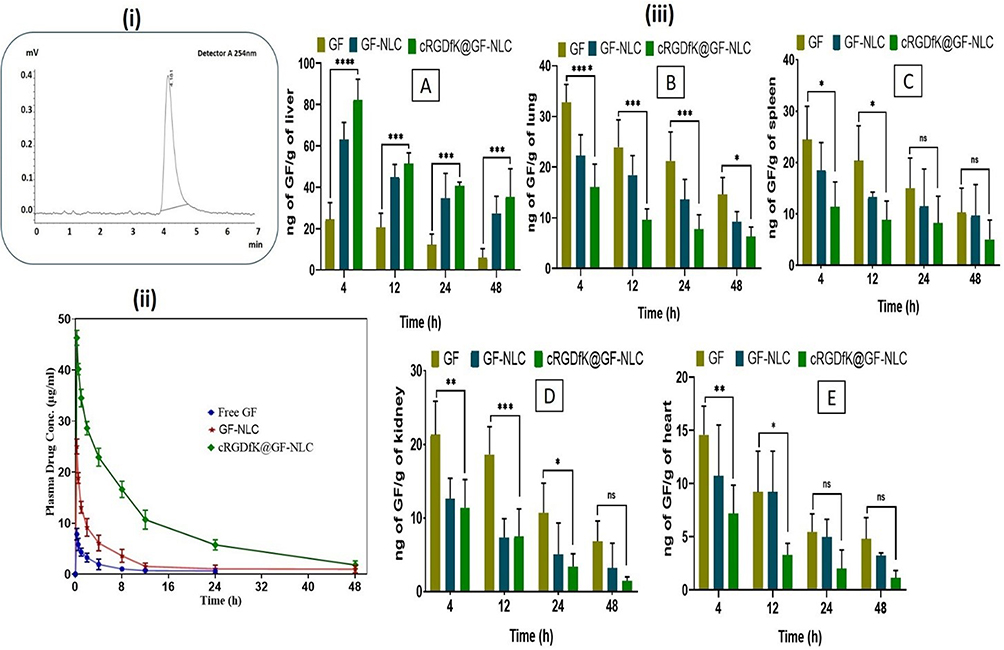 |
Figure 10 Chromatogram of GF showing retention time/RT 4.181 at 254 nm through RP-HPLC (i), Plasma drug concentration vs time profile at determined time points following a single i.v. injection of GF, GF-NLC and cRGDfK@GF-NLC (ii), Biodistribution data of GF and developed non-functionalized and functionalized NLC in various organs like liver (A), lung (B), spleen (C), kidney (D), and heart (E), (iii). All the data given as Mean ± SD (n = 3) ****(p < 0.0001), ***(p < 0.001), **(p <0.01) and *(p < 0.05) compared with the GF control group. |
Furthermore, the administration of GF-NLC and cRGDfK@GF-NLC resulted in a noteworthy increase in both the Area under the mean curve (AUMC) and the mean residence time (MRT) after 48 hours, when compared to the use of free GF suspension. Based on these findings, GF-NLC and cRGDfK-functionalized GF-NLC were significant better compared to free GF suspension after 48 hours. The increased duration of drug presence in the body and higher values of t1/2 observed for GF-NLC and cRGDfK@GF-NLC indicate that these formulations exhibit controlled release properties. This leads to enhanced bioavailability of GF and allows for potential dosage reduction. The incorporation of DSPE-PEG2000-COOH and cRGDfK-pentapeptide on the surface of the functionalized formulation, cRGDfK@GF-NLC, is likely responsible for the improved values of Cmax, t1/2, AUC, AUMC, and MRT when compared to GF-NLC.
In-vivo Organ Biodistribution Study
Figure 10 (iii A-E) provides a comparative analysis of the distribution of GF in various organs, allowing for a better understanding of its biodistribution. The study demonstrated that cRGDfK@GF-NLC treated group had a peak concentration of 82.36 ± 9.88 ng/g in liver at 4 hour post treatment. The concentration steadily declined over the next 48 hours, reaching a final value of 35.41 13.57 ng/g of liver. However, in the GF-NLC treated group, the concentration of GF in the liver tissue decreased from an initial value of 63.23 8.31 ng/g of liver at 4 hour to a value of 27.28 8.32 ng/g of liver at 48 hour as can be seen in Figure 10 (iiiA) The surface-functionalized NLC was more active than the GF-treated group over the time periods studied. This was likely due to the former’s greater GF accumulation. Enhanced cancer tissue targeting has been linked to an increase in GF accumulation in the liver.
The surface functionalization via cRGDfK-pentapeptide is likely responsible for the interaction between cRGDfK@-GF-NLC and αvβ3-integrin receptor overexpressed on HCC cells, which prolongs GF’s ability to retain cRGDfK-surface functionalized NLC in tumour sites for 48 hours.
Histopathological Examination
Histopathology was used to examine the cellular and morphological changes in the liver tissues. The macroscopical alterations in DEN-induced rat liver after the treatments are shown in Figure 11 (A). In contrast, Figure 11B (1a-5a) showed that the number of cancerous nodules dramatically decreased in the cRGDfK@GF-NLC treated group compared to the normal control group. Kupffer cells (K) with numerous nuclei were found in abundance during the histopathological examination of the NC group. Hepatic tissues from DEN control group, in contrast, showed tumour anaplastic cells, tumour vacuoles, ruptured liver cells (RC), and abnormal hepatic architecture. The microscopic examination of liver tissues revealed a notable improvement in their overall microscopic appearance with the administration of cRGDfK@GF-NLC, followed by GF-NLC and free GF.
 |
Figure 11 Comparative macroscopical alterations in DEN-induced rat liver, before and after the treatment (A), showing histopathological changes (40X, scale bar 50 μm) (B) (1a-5a), which present 3-dimensional image reconstruction and software-based analysis dataset of constructs representing scores. This analysis was performed using ImageJ software from NIH and involved thresholding of stained zones in H&E images, followed by pixel vs intensity determination. Sub-panels (1b-5b) represent the results as interactive surface plots, while sub-panels (1c-5c) show log-histogram analysis. |
Assessment of Oxidative Stress Marker and Lipid Profile in Blood Serum
The levels of GSH and SOD showed a significant decrease (p < 0.001) following DEN administration, whereas the levels of MDA and CAT (measured as the disappearance of H2O2/min/μg of protein) were elevated in the DEN control group compared to the NC group. Treatment with either developed GF-NLC or cRGDfK@GF-NLC, significantly decreased these parameters, with hepatic SOD and GSH activities peaking in the latter and being significantly higher (p < 0.001) than in the DEN control group (Figure 12A and 12B).
 |
Figure 12 Impact of free GF, GF-NLC and cRGDfK@GF-NLC on DEN induced level of oxidative stress marker in liver tissue (A) GSH, (B) SOD, (C) MDA, (D) CAT and (E) is the change in the lipid profile after GF, GF-NLC and cRGDfK@GF-NLC treatment in DEN induced rat blood serum. All the data presented in the experiment as Mean±S.D. P<0.05, 0.001 and 0.0001 represented by *, *** and **** respectively. |
Furthermore, SOD and GSH levels in cRGDfK@GF-NLC were also found to be roughly 1.5 and 1.2 times higher than in free GF, respectively. The production of MDA was approximately 2.5 times higher in the DEN group compared to the NC group. After treatment with GF, GF-NLC, and cRGDfK@GF-NLC, MDA production was significantly (p < 0.001) reduced. As can be seen in the Figure 12C and 12D) after treatment with cRGDfK@GF-NLC, MDA and CAT levels were decreased by a factor of 3 and 1.3, respectively.
The DEN control group exhibited increased levels of triglycerides, cholesterol, low-density lipoprotein, and very low-density lipoprotein in the serum lipid profiles compared to the NC group. Conversely, HDL levels were significantly lower in the DEN control group (20.34 ± 6.91 mg/dl) compared to the NC group (59.17 ± 3.30 mg/dl).
As can be seen in Figure 12E, when cRGDfK@GF-NLC was administered intravenously, it normalised TC and TG levels while reducing LDL and VLDL by 67% and 34%, respectively. Serum HDL levels returned to normal first in groups treated with cRGDfK@GF-NLC, then in those treated with GF-NLC, and finally in those treated with free GF.
Assessment of Enzyme Markers
In DEN-induced HCC, the plasma membrane undergoes changes that result in the release of cytosolic content into the external environment. This leads to a significant increase in the levels of blood enzymes such as alanine aminotransferase (ALT) and aspartate aminotransferase (AST) in DEN-induced animals. The spike in enzyme levels can be attributed to an increase in the permeability of the plasma membrane. Due to its essential role in maintaining the stability of the plasma membrane, alterations in ALP signal a failure in membrane function.42 Enzyme markers ALP, ALT, and AST were all significantly elevated in the DEN control groups compared to those of the normal control group as shown in Figure 13 (ii). Enzyme markers were significantly (p < 0.001) regained to normal levels in the cRGDfK@GF-NLC and GF-NLC treatment groups compared to the free GF treatment groups. The effect of cRGDfK@GF-NLC was more noticeable than that of GF alone and GF-NLC. Therefore, the protective activity of cRGDfK@GF-NLC was demonstrated by the return of liver enzyme levels to near normal following treatment of the damaged liver with cRGDfK@GF-NLC.
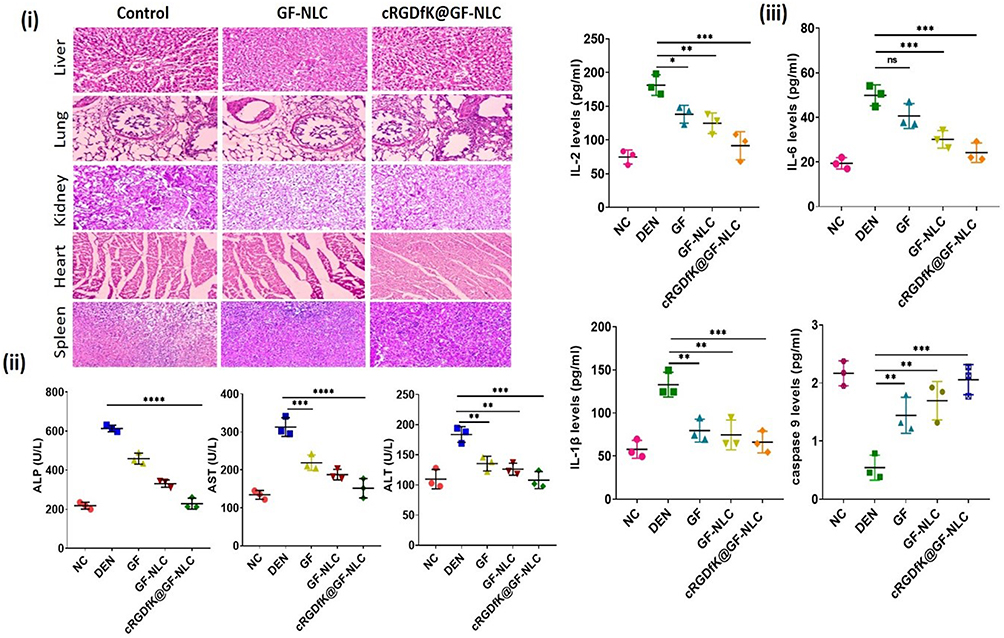 |
Figure 13 H&E staining of the liver, lung, kidney, spleen, and heart after treatment with GF-NLC and cRGDfK@GF-NLC against control for in-vivo biosafety evaluation (i), Impact of free GF, GF-NLC and cRGDfK@GF-NLC on hepatic enzyme levels of ALP, AST, ALT in blood serum (ii), Impact of free GF, GF-NLC and cRGDfK@GF-NLC on the proinflammatory cytokines and apoptotic initiator IL-2, IL-6, IL-1β, caspase 9 level (iii). The data is presented as Mean ± S.D., and the level of statistical significance is indicated by asterisks *, **, ***, and **** represent p-values of < 0.05, < 0.01, < 0.001, and < 0.0001, respectively. |
In-Vivo Biosafety Evaluation
Using H&E staining, we further assessed the in-vivo safety of the developed NLC formulations (both non-functionalized and functionalized) in Wistar rats. Toxicity to vital organs is a persistent issue that prevents the widespread use of nanoformulation containing anticancer drug or agents in clinical practice. The liver, lungs, kidneys, heart, and spleen were all analysed histopathologically to see if the GF-NLC and cRGDfK@GF-NLC were harmful. There were no obvious histological changes in the major organs of GF-NLC, cRGDfK@GF-NLC, or saline-treated rats as shown in Figure 13 (i). Both groups’ major organs appeared almost healthy, with no signs of inflammation or injury visible in the images. Thankfully, GF-NLC and cRGDfK@GF-NLC are well tolerated and biocompatible at therapeutic doses.
Impact of Developed GF-NLC and cRGDfK@GF-NLC on Proinflammatory Cytokines and Apoptotic Initiator
In this study, ELISA was employed to determine the levels of proinflammatory cytokines (IL-2, IL-6, and IL-1β) and the apoptotic signal initiator (caspase-9) in the blood serum. The objective was to examine the effects of free GF, GF-NLC, and cRGDfK@GF-NLC on inflammatory and apoptotic events associated with cancer. Serum cytokines play a pivotal role in the development and advancement of inflammation and cancer.48 Whereas, caspase-9 has been shown to inhibit tumour development by initiating intrinsic apoptosis in response to oxidative stress and abnormal cell proliferation.49
Figure 13 (iii) illustrated a notable increase in the levels of IL-2, IL-6, and IL-1β, while the level of caspase-9 was significantly reduced (approximately 4-fold) in the DEN control group. After being treated with free GF, GF-NLC and cRGDfK@GF-NLC these inflammatory cytokines were reduced to a certain level whereas caspase 9 levels were increased significantly (p < 0.001) restored to normal levels.50 This finding, though, was most pronounced in the cRGDfK@GF-NLC treatment group as compared to the GF-NLC and free GF drug. We found that cRGDfK@GF-NLC surpassed both non-functionalized NLC and free GF in terms of its restorative potential.
Stability Studies
The stability study of GF-NLC and cRGDfK@GF-NLC was performed, and their results have been shown in Table 6. It may be evidenced from Table 6 that after 1, 2 and 3 months, there was not any significant changes in PS, EE (%) and DL (%) of formulated NLCs.
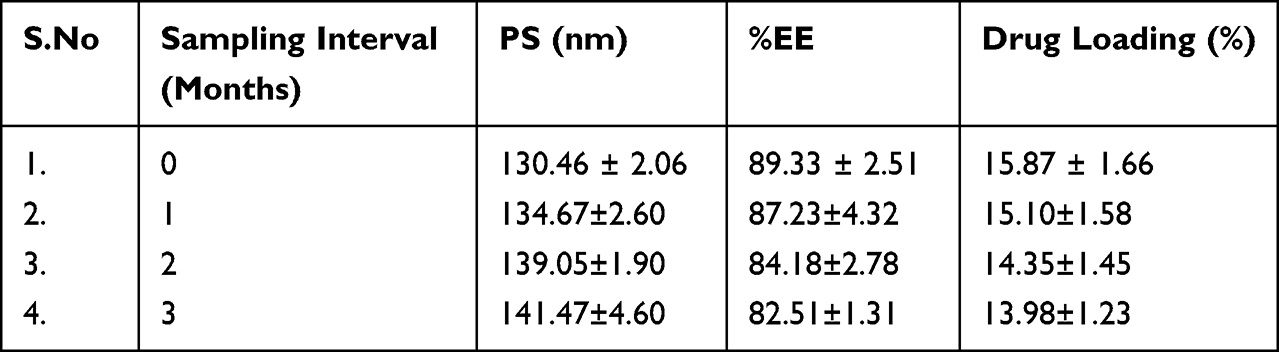 |
Table 6 Stability Study Data (in Respect of PS, %EE and Drug Loading) of cRGDfK@GF-NLC for 3 Months at 25 ±2°C |
Conclusion
In this research, we demonstrate that the EPR effect is complemented by active-targeting endocytosis mechanism, allowing the novel nanocarrier derived on cRGDfK-pentapeptide to selectively target the HCC. Based on the in-vitro cytotoxicity study, anticancer activity of cRGDfK-surface functionalized GF-NLC was found to be significantly higher than that of non-functionalized GF-NLC. Cellular internalisation analysis proved that cRGDfK@GF-NLC accumulated preferentially in HepG2 cells due to strong affinity of cRGDfK-peptide to the overexpressed αvβ3 receptor on HCC. In the in-vivo studies, a significant difference was observed in the effectiveness of cRGDfK-conjugated NLC and non-functionalized NLC in inhibiting tumour growth. Liver marker enzymes (ALT, AST, ALP) were significantly reduced in HCC-bearing rats treated with cRGDfK@GF-NLC compared to the DEN control group. As a result of their roles as anti-oxidative stress markers, pro-inflammatory cytokines, and apoptosis initiators, cRGDfK@GF-NLC therapy helps mitigate liver damage. The results of in vitro and in vivo experiments confirming their primary effects of enhancing drug efficacy provided strong support for their use. This leads us to believe that cRGDfK-surface functionalized NLC for the GF delivery is a desirable and potent vehicle for the treatment of HCC.
Acknowledgment
The author would like to acknowledge the Institutional Animal Ethics Committee (IAEC) of SD College of Pharmacy & vocational studies, Muzaffarnagar, Uttar Pradesh, India (Approval No. SDCOP&VS/AH/CPCSEA/02/14) for providing animal approval. The authors would also like to acknowledge to University Sophisticated Instrumentation Center (USIC), Babasaheb Bhimrao Ambedkar University (A Central University), Lucknow for providing SEM and other analytical facility.
Author Contributions
All authors made a significant contribution to the work reported, whether that is in the conception, study design, execution, acquisition of data, analysis and interpretation, or in all these areas; took part in drafting, revising or critically reviewing the article; gave final approval of the version to be published; have agreed on the journal to which the article has been submitted; and agree to be accountable for all aspects of the work.
Funding
The authors would like to thank UGC-NFSC (Award Letter No. F.82-1/2018 (SA-III)) for the research work. The authors also would like to acknowledge to DST-SERB (EEQ/2019/000429) for financial help for this work. This research was supported by Researchers Supporting Project number (RSP2023R27), King Saud University, Riyadh, Saudi Arabia.
Disclosure
The authors declare that they have no known competing financial interests or personal relationships that could have appeared to influence the work reported in this paper.
References
1. Llovet JM, Kelley RK, Villanueva A., et al. Hepatocellular carcinoma. Nat Rev Dis Prim. 2021;7(1):6. doi:10.1038/s41572-020-00240-3
2. Zhang H, Zhang W, Jiang L, et al. Recent advances in systemic therapy for hepatocellular carcinoma. Biomar Res. 2022;10(1):3. doi:10.1186/s40364-021-00350-4
3. Zhu J, Huang Y, Zhang J, et al. Formulation, preparation and evaluation of nanostructured lipid carrier containing naringin and coix seed oil for anti-tumor application based on “unification of medicines and excipients”. Drug Des Devel Ther. 2020;14:1481–1491. doi:10.2147/DDDT.S236997
4. Elsegood CL, Tirnitz‐Parker JE, Olynyk JK, et al. Immune checkpoint inhibition: prospects for prevention and therapy of hepatocellular carcinoma. Clin Trans Immunol. 2017;6(11):e161. doi:10.1038/cti.2017.47
5. Foroughi-Nia B, Barar J, Memar MY, et al. Progresses in polymeric nanoparticles for delivery of tyrosine kinase inhibitors. Life Sci. 2021;278:119642. doi:10.1016/j.lfs.2021.119642
6. Höpfner M, Sutter AP, Huether A, et al. Targeting the epidermal growth factor receptor by gefitinib for treatment of hepatocellular carcinoma. J Hepatol. 2004;41(6):1008–1016. doi:10.1016/j.jhep.2004.08.024
7. Shi Y, Su C, Cui W, et al. Gefitinib loaded folate decorated bovine serum albumin conjugated carboxymethyl-beta-cyclodextrin nanoparticles enhance drug delivery and attenuate autophagy in folate receptor-positive cancer cells. J Nanobiotechnology. 2014;12(1):43. doi:10.1186/s12951-014-0043-7
8. Sordella R, Bell DW, Haber DA, et al. Gefitinib-sensitizing EGFR mutations in lung cancer activate anti-apoptotic pathways. Science. 2004;305(5687):1163–1167. doi:10.1126/science.1101637
9. Soni K, Rizwanullah M, Kohli K. Development and optimization of sulforaphane-loaded nanostructured lipid carriers by the Box-Behnken design for improved oral efficacy against cancer: in vitro, ex vivo and in vivo assessments. Artif Cells, Nanomed Biotechnol. 2018;46(sup1):15–31. doi:10.1080/21691401.2017.1408124
10. Deepak P, Siddalingam R, Kumar P, et al. Gene based nanocarrier delivery for the treatment of hepatocellular carcinoma. J Drug Deliv Sci Technol. 2020;59:101837. doi:10.1016/j.jddst.2020.101837
11. Pandey P, Gupta PC, Yadav S. Solid lipid nanoparticle: a potential approach in drug delivery system. Eur J Pharm Med Res. 2018;5(9):225–236.
12. Rajinikanth PS, Chellian J Development and evaluation of nanostructured lipid carrier-based hydrogel for topical delivery of 5-fluorouracil. Int J Nanomedicine. 2016 Oct 5:5067–5077.
13. Mahmoud K, Swidan S, El-Nabarawi M, et al. Lipid based nanoparticles as a novel treatment modality for hepatocellular carcinoma: a comprehensive review on targeting and recent advances. J Nanobiotechnology. 2022;20(1):109. doi:10.1186/s12951-022-01309-9
14. Zhu X, Deng X, Lu C, et al. SPIO-loaded nanostructured lipid carriers as liver-targeted molecular T2-weighted MRI contrast agent. Quant Imaging Med Surg. 2018;8(8):770–780. doi:10.21037/qims.2018.09.03
15. Pandey P, Kumar Arya D, Kumar Ramar M, et al. Engineered nanomaterials as an effective tool for HER2+ breast cancer therapy. Drug Discov Today. 2022;27(9):2526–2540. doi:10.1016/j.drudis.2022.06.007
16. Sun S, Shang E, Ju A, et al. Tumor-targeted hyaluronic acid-mPEG modified nanostructured lipid carriers for cantharidin delivery: an in vivo and in vitro study. Fitoterapia. 2021;155:105033. doi:10.1016/j.fitote.2021.105033
17. Kebebe D, Wu Y, Zhang B, et al. Dimeric c(RGD) peptide conjugated nanostructured lipid carriers for efficient delivery of Gambogic acid to breast cancer. Int J Nanomedicine. 2019;14:6179–6195. doi:10.2147/IJN.S202424
18. Wang Y, Hu W, Ding B, et al. cRGD mediated redox and pH dual responsive poly(amidoamine) dendrimer-poly(ethylene glycol) conjugates for efficiently intracellular antitumor drug delivery. Colloids Surf B Biointerfaces. 2020;194:111195. doi:10.1016/j.colsurfb.2020.111195
19. Liu J, Wu M, Pan Y, et al. Biodegradable nanoscale coordination polymers for targeted tumor combination therapy with oxidative stress amplification. Adv Funct Mat. 2020;30(13):1908865.
20. Deepak P, Kumar P, Arya DK, et al. PS. C (RGDfK) anchored surface manipulated liposome for tumor-targeted Tyrosine Kinase Inhibitor (TKI) delivery to potentiate liver anticancer activity. Int J Pharm. 2023 Jun 26:123160
21. Emami J, Rezazadeh M, Varshosaz J, et al. Formulation of LDL targeted nanostructured lipid carriers loaded with paclitaxel: a detailed study of preparation, freeze drying condition, and in vitro cytotoxicity. J Nanomater. 2012;2012:358782. doi:10.1155/2012/358782
22. Emami J, Yousefian H, Sadeghi H. Targeted nanostructured lipid carrier for brain delivery of artemisinin: design, preparation, characterization, optimization and cell toxicity. J Pharm Pharm Sci. 2018;21(1s):225s–241s. doi:10.18433/jpps30117
23. Sharma M, Mehta I. Surface stabilized atorvastatin nanocrystals with improved bioavailability, safety and antihyperlipidemic potential. Sci Rep. 2019;9(1):16105. doi:10.1038/s41598-019-52645-0
24. Huang R, Li J, Kebebe D, et al. Cell penetrating peptides functionalized gambogic acid-nanostructured lipid carrier for cancer treatment. Drug Deliv. 2018;25(1):757–765. doi:10.1080/10717544.2018.1446474
25. Managuli RS, Wang JT-W, Faruqu FM, et al. Surface engineered nanoliposomal platform for selective lymphatic uptake of asenapine maleate: in vitro and in vivo studies. Mater Sci Eng. 2020;109:110620. doi:10.1016/j.msec.2019.110620
26. Parashar P, Rathor M, Dwivedi M, et al. Hyaluronic acid decorated naringenin nanoparticles: appraisal of chemopreventive and curative potential for lung cancer. Pharmaceutics. 2018;10(1):33. doi:10.3390/pharmaceutics10010033
27. Jagwani S, Jalalpure S, Dhamecha D, et al. Pharmacokinetic and pharmacodynamic evaluation of resveratrol loaded cationic liposomes for targeting hepatocellular carcinoma. ACS Biomat Sci Eng. 2020;6(9):4969–4984. doi:10.1021/acsbiomaterials.0c00429
28. Zhou Q, Fu Z. In vitro and in vivo study of a novel liposome-mediated dual drug delivery for synergistic lung cancer therapy via oral administration. Onco Targets Ther. 2020;13:12695–12703. doi:10.2147/OTT.S276837
29. Jadhav K, Deore S, Dhamecha D, et al. Phytosynthesis of silver nanoparticles: characterization, biocompatibility studies, and anticancer activity. ACS Biomater Sci Eng. 2018;4(3):892–899. doi:10.1021/acsbiomaterials.7b00707
30. Kesharwani P, Md S, Alhakamy NA, et al. QbD enabled azacitidine loaded liposomal nanoformulation and its in vitro evaluation. Polymers. 2021;13(2):250. doi:10.3390/polym13020250
31. Kesharwani P, Tekade RK, Gajbhiye V, et al. Cancer targeting potential of some ligand-anchored poly(propylene imine) dendrimers: a comparison. Nanomedicine. 2011;7(3):295–304. doi:10.1016/j.nano.2010.10.010
32. Li Y, Tan X, Liu X, et al. Enhanced anticancer effect of doxorubicin by TPGS-coated liposomes with Bcl-2 siRNA-Corona for dual suppression of drug resistance. Asian J Pharm Sci. 2020;15(5):646–660. doi:10.1016/j.ajps.2019.10.003
33. Yugui F, Wang H, Sun D, et al. Nasopharyngeal cancer combination chemoradiation therapy based on folic acid modified, gefitinib and yttrium 90 co-loaded, core-shell structured lipid-polymer hybrid nanoparticles. Biomed Pharmacother. 2019;114:108820. doi:10.1016/j.biopha.2019.108820
34. Chen L-J, Yang C-X, Yan X-P. Liposome-coated persistent luminescence nanoparticles as luminescence trackable drug carrier for chemotherapy. Anal Chem. 2017;89(13):6936–6939. doi:10.1021/acs.analchem.7b01397
35. Kumar P, Agarwal A, Singh AK, et al. Antineoplastic properties of zafirlukast against hepatocellular carcinoma via activation of mitochondrial mediated apoptosis. Regul Toxicol Pharmacol. 2019;109:104489. doi:10.1016/j.yrtph.2019.104489
36. Kumar V, Bhatt P, Rahman M, et al. Fabrication, optimization, and characterization of umbelliferone β-D-galactopyranoside-loaded PLGA nanoparticles in treatment of hepatocellular carcinoma: in vitro and in vivo studies. Int J Nanomedicine. 2017;12:6747–6758. doi:10.2147/IJN.S136629
37. Pandey P, Rahman M, Bhatt PC, et al. Implication of nano-antioxidant therapy for treatment of hepatocellular carcinoma using PLGA nanoparticles of rutin. Nanomedicine. 2018;13(8):849–870. doi:10.2217/nnm-2017-0306
38. Andalib S, Varshosaz J, Hassanzadeh F, et al. Optimization of LDL targeted nanostructured lipid carriers of 5-FU by a full factorial design. Adv Biomed Res. 2012;1(1):45. doi:10.4103/2277-9175.100147
39. Dewangan HK. Optimization, Evaluation and Delivery of Genistein Loaded Long Circulating Nanostructured Lipid Carriers for Treatment of Cancer Melanoma Cells. Research Square; 2022.
40. Agrawal M, Saraf S, Pradhan M, et al. Design and optimization of curcumin loaded nano lipid carrier system using Box-Behnken design. Biomed Pharmacother. 2021;141:111919. doi:10.1016/j.biopha.2021.111919
41. Qadir A, Aqil M, Ali A, et al. Nanostructured lipidic carriers for dual drug delivery in the management of psoriasis: systematic optimization, dermatokinetic and preclinical evaluation. J Drug Deliv Sci Technol. 2020;57:101775. doi:10.1016/j.jddst.2020.101775
42. Rahman M, Al-Ghamdi SA, Alharbi KS, et al. Ganoderic acid loaded nano-lipidic carriers improvise treatment of hepatocellular carcinoma. Drug Deliv. 2019;26(1):782–793. doi:10.1080/10717544.2019.1606865
43. Li X, Wang J, Li S, et al. Development and evaluation of multifunctional poly(Lactic-co-glycolic acid) nanoparticles embedded in carboxymethyl β-glucan porous microcapsules as a novel drug delivery system for gefitinib. Pharmaceutics. 2019;11(9):469. doi:10.3390/pharmaceutics11090469
44. Jiao J, Wu H, Chen F, et al. Delivery of coumarin-containing all- trans retinoic acid derivatives via targeted nanoparticles encapsulating indocyanine green for chemo/photothermal/photodynamic therapy of breast cancer. New J Chem. 2018;42(11):8805–8814. doi:10.1039/C8NJ00578H
45. Phillip Lee YH, Sathigari S, Jean Lin Y-J, et al. Gefitinib–cyclodextrin inclusion complexes: physico-chemical characterization and dissolution studies. Drug Dev Ind Pharm. 2009;35(9):1113–1120. doi:10.1080/03639040902783074
46. Chen W, Di Carlo C, Devery D, et al. Fabrication and characterization of gefitinib-releasing polyurethane foam as a coating for drug-eluting stent in the treatment of bronchotracheal cancer. Int J Pharm. 2018;548(2):803–811. doi:10.1016/j.ijpharm.2017.10.026
47. Makeen HA, Mohan S, Al-Kasim MA, et al. Gefitinib loaded nanostructured lipid carriers: characterization, evaluation and anti-human colon cancer activity in vitro. Drug Deliv. 2020;27(1):622–631. doi:10.1080/10717544.2020.1754526
48. Wu H, Li N, Jin R, et al. Cytokine levels contribute to the pathogenesis of minimal hepatic encephalopathy in patients with hepatocellular carcinoma via STAT3 activation. Sci Rep. 2016;6(1):18528. doi:10.1038/srep18528
49. Avrutsky MI, Troy CM. Caspase-9: a multimodal therapeutic target with diverse cellular expression in human disease. 2021;12.
50. Keshari AK, Singh AK, Kumar U, et al. 5H-benzo[h]thiazolo[2,3-b]quinazolines ameliorate NDEA-induced hepatocellular carcinogenesis in rats through IL-6 downregulation along with oxidative and metabolic stress reduction. Drug Des Devel Ther. 2017;11:2981–2995. doi:10.2147/DDDT.S143075
 © 2023 The Author(s). This work is published and licensed by Dove Medical Press Limited. The
full terms of this license are available at https://www.dovepress.com/terms
and incorporate the Creative Commons Attribution
- Non Commercial (unported, 3.0) License.
By accessing the work you hereby accept the Terms. Non-commercial uses of the work are permitted
without any further permission from Dove Medical Press Limited, provided the work is properly
attributed. For permission for commercial use of this work, please see paragraphs 4.2 and 5 of our Terms.
© 2023 The Author(s). This work is published and licensed by Dove Medical Press Limited. The
full terms of this license are available at https://www.dovepress.com/terms
and incorporate the Creative Commons Attribution
- Non Commercial (unported, 3.0) License.
By accessing the work you hereby accept the Terms. Non-commercial uses of the work are permitted
without any further permission from Dove Medical Press Limited, provided the work is properly
attributed. For permission for commercial use of this work, please see paragraphs 4.2 and 5 of our Terms.