
Back to Journals » Diabetes, Metabolic Syndrome and Obesity » Volume 18
PEDF Alleviates Diabetic Renal Fibrosis by Degrading Kidney Ectopic Fat Deposition and Inhibiting Metabolic Reprogramming of Renal Tubular Epithelial Cells

Received 27 May 2025
Accepted for publication 6 November 2025
Published 14 November 2025 Volume 2025:18 Pages 4211—4227
DOI https://doi.org/10.2147/DMSO.S536576
Checked for plagiarism Yes
Review by Single anonymous peer review
Peer reviewer comments 2
Editor who approved publication: Dr Rebecca Baqiyyah Conway
Tuohua Mao,1 Yingying Bi,2 Yan Bao1
1Department of Endocrinology, Renmin Hospital of Wuhan University, Wuhan, People’s Republic of China; 2Renmin Hospital of Wuhan University, Wuhan, People’s Republic of China
Correspondence: Yingying Bi, Renmin Hospital of Wuhan University, Wuhan, People’s Republic of China, Email [email protected] Yan Bao, Department of Endocrinology, Renmin Hospital of Wuhan University, Wuhan, People’s Republic of China, Email [email protected]
Background: The pathogenesis of diabetic nephropathy (DKD) remains unclear; however, existing literature suggests that ectopic fat deposition and metabolic reprogramming contribute to the development of diabetic renal fibrosis. Our previous studies have demonstrated that pigment epithelium-derived factor (PEDF) can alleviate diabetic renal fibrosis.
Methods: In this study, db/db mice were utilized as animal models to simulate type 2 diabetic nephropathy, and human proximal tubular epithelial cells (HK-2) cultured under conditions of high glucose and high palmitic acid were employed for in vitro analysis to investigate the mechanism through which PEDF improves diabetic renal fibrosis.
Results: The results revealed that implanting the PEDF gene via AAV9 effectively improved renal function and blood lipid levels in db/db mice, and alleviated renal tubular injury, urinary albumin excretion, renal ectopic fat accumulation, and renal fibrosis in these mice. The protein expressions in renal peroxisomes and mitochondria could be up-regulated by PEDF, leading to enhanced β-oxidation of fatty acids in db/db mice. This effect was associated with the up-regulation of the ATGL-PPARα pathway and the down-regulation of the HIF-1α-HK2 pathway. It was observed that PEDF effectively mitigated lipid deposition and transdifferentiation of HK-2 cells by activating the ATGL-PPARα pathway, while concurrently inhibiting HIF-1α-HK2 pathway and glycolysis. Furthermore, PEDF facilitated fatty acid β-oxidation in both mitochondria and peroxisomes of HK-2 cells through the ATGL-PPARα pathway.
Conclusion: PEDF can reduce abnormal renal fat accumulation and regulate metabolic reprogramming of renal tubular epithelial cells, thereby alleviating diabetic renal fibrosis.
Keywords: PEDF, diabetic renal fibrosis, kidney ectopic fat deposition, metabolic reprogramming
Introduction
Diabetic kidney disease (DKD) is the main cause of chronic kidney disease and end-stage renal disease worldwide.1 More and more studies suggest that ectopic fat deposition may be involved in the pathogenesis of DKD through various ways.2,3 Ectopic fat deposition can cause diabetic kidney injury, and its mechanism is related to insulin resistance, down-regulated expression of peroxidase proliferator-activated receptor-α (PPARα), and up-regulated expression of cholesterol regulatory element binding protein (SREBP).4,5
β oxidation of free fatty acid (FFA) in mitochondria and peroxidase is the main energy source of kidney, especially the proximal tubule epithelial cells with high energy consumption. Reducing FFA oxidation and energy supply can cause insufficient ATP production and lipid deposition, and then lead to increased urinary protein and renal interstitial fibrosis.6 Renal tubule epithelial cells showed obvious plasticity and phenotypic transformation in renal tubule interstitial fibrosis.7 During renal injury, fatty acid oxidation in renal tubular epithelial cells is down-regulated, and glycolysis is up-regulated to compensate for the reduced fatty acid oxidation, resulting in reprogramming of energy metabolism.8–10
PEDF (encoded by the gene Serpinf1) is a secreted glycoprotein that can induce retinoblastoma cells to differentiate into mature neurons.11 PEDF can play a protective role in DKD through its antioxidant and antifibrotic properties.12–14 One of the receptors of PEDF is lipotriglyceride lipase (ATGL), PEDF can promote the degradation of triglyceride in cardiomyocytes through ATGL.15 ATGL is a rate-limiting enzyme in the first step of triglyceride catabolism. The free fatty acids released by ATGL can not only increase the oxidizable substrate, but also bind and activate PPARα, and activate fatty acid β oxidation and oxidative phosphorylation of peroxisome and mitochondria through PPARα and PGC1α.16–18 Our study found that renal PEDF and ATGL expressions were simultaneously reduced in DKD patients, accompanied by renal ectopic fat deposition.19 PEDF can significantly reduce the lactic acid content and extracellular acidification rate of myocardial cells after glucose and oxygen deprivation, suggesting that the protective effect of PEDF on infarcted myocardium is partly achieved by inhibiting glycolysis.20 In view of the favorable impact of PEDF on delaying the progression of DKD, in conjunction with the aforementioned literature reports, we propose the following scientific inquiries: Can PEDF enhance ectopic fat degradation within the diabetic kidney to generate free fatty acids via its receptor ATGL? Can PEDF stimulate β-oxidation of fatty acids in both mitochondria and peroxisomes through the ATGL-PPARα pathway? Additionally, can PEDF inhibit glycolysis? Can PEDF inhibit metabolic reprogramming of renal tubular epithelial cells to ameliorate diabetic renal fibrosis? Therefore, this study utilized db/db mice as an animal model for type 2 diabetic nephropathy and human proximal tubular epithelial cells (HK-2) as the subject of in vitro investigation to elucidate the role and mechanism of PEDF in mitigating ectopic fat deposition and regulating metabolic reprogramming of tubular epithelial cells, thereby alleviating diabetic renal fibrosis.
Materials and Methods
Animal Experiments
Six-week-old male db/db and control db/m mice were obtained from the Experimental Animal Center of Wuhan University. After a two-week acclimation period, db/db mice with comparable blood glucose and body weight were randomly assigned to four groups (n=10 each): (1) db/m group (normal control); (2) db/db group (untreated control); (3) db/db+GFP group (received tail vein injection of AAV-GFP); (4) db/db+PEDF group (received tail vein injection of AAV9-Serpinf1). All injections were 1×10¹² vg of the respective AAV in 200 μL saline. Mice were housed under standard pathogen-free conditions with a 12h light/dark cycle. Body weight, random blood glucose, and food intake were monitored weekly. After 16 weeks, the mice were humanely euthanized under isoflurane anesthesia. All procedures were approved by the Animal Ethics Committee of Renmin Hospital of Wuhan University (No. 20211203) and followed the NIH Guide for the Care and Use of Laboratory Animals.
Blood Sample Collection and Biochemical Analyses
Blood samples were collected from the ocular vein into K3EDTA-containing tubes. After clotting at room temperature for 1 hour, serum was separated by centrifugation at 3500 rpm for 15 minutes and stored at −80°C. Serum levels of total cholesterol (TC), triglycerides (TG), and creatinine (Cr) were subsequently measured by the Clinical Laboratory Department of Renmin Hospital of Wuhan University.
Urinary Biochemistry
Following the 16-week intervention, mice underwent 24-hour urine collection in metabolic cages. Analyses included measurements of urinary albumin, creatinine, and N-acetyl-β-D-glucosaminidase (NAG), along with calculation of the albumin-to-creatinine ratio (ACR).
Histology Examination
Kidney tissue paraffin sections were subjected to Periodic Acid-Schiff (PAS) and Sirius red staining according to standard protocols. Briefly, PAS staining involved oxidation with 1% periodic acid followed by Schiff’s reagent. Sirius red staining was performed using celestite blue and saturated picric acid solutions. Stained sections were imaged by microscopy and quantitatively analyzed with ImageJ software.
Transmission Electron Microscopy
To visualize mitochondrial ultrastructure, renal tissue patches were fixed in 2.5% glutaraldehyde, dehydrated, and embedded in Epon. Ultrathin sections on nickel meshes were then stained with uranyl acetate and lead citrate and imaged by electron microscopy.
Immunohistochemistry
To detect ADRP, deparaffinized kidney sections underwent peroxidase blockade with 3% H2O2 and antigen retrieval using EDTA (pH 9.0). After incubation with the primary antibody (Servicebio, GB115593-100; 1:200, Wuhan, China) at 4°C overnight, antigens were visualized using an HRP-conjugated secondary antibody with DAB substrate. Sections were counterstained with hematoxylin and examined microscopically.
Fluorescence in situ Hybridization (FISH)
Paraffin-embedded kidney sections were subjected to FISH using a Cy3-labeled HIF-1α probe (5’-CUUCAGACUCUUUGCUUCGCC-3’) following proteinase K digestion. The protocol included prehybridization at 78°C, hybridization, and a stringent saline-sodium citrate buffer wash at 43°C. Images were finally acquired by confocal microscopy.
Cell Culture
HK-2 (GDC0152) cells were purchased from the China Center for Type Culture Collection and incubated in DMEM/F12 (SH30261.01, Hyclone, Utah, USA) containing 10% fetal bovine serum (SH30088.03, Hyclone, Utah, USA) and 1% Penicillin-Streptomycin Liquid (BL505A, Biosharp, Hefei, China) with 5% CO2 at 37°C. HK-2 cells incubated with 30mM glucose (HG) and 0.25mM palmitic acid (PA) were used as an in vitro model of diabetes (HGPA).
siRNA Transfection
HK-2 cells at 60–70% confluence were transfected with 100 pmol of siRNA using Lipo8000(C0533-1.5mL, Beyotime, Shanghai, China). The medium was replaced after 24h, and cells were cultured for another 24h before Western blot analysis confirmed knockdown efficiency. The PEDF siRNA sequences used were: sense, 5′-GCAGUGGGUAACAAAGUUUTT-3′; antisense, 5′-AAACUUUGUUACCCACUGCTT-3′.
Cell Treatment
Section 1: PEDF Efficacy
Cells at 50–60% confluence were divided into: (1) Control; (2) HGPA; (3) HGPA+PEDF (100ng/mL, HY-P70498A, MedChemExpress, New Jersey, USA). PEDF was added to group 3, followed 1h later by HGPA in groups 2–3. Cultures were maintained for 24h.
Section 2: Effect of PEDF on Fatty Acid β-Oxidation
Cells were divided into: (1) Control; (2) HGPA; (3) HGPA+PEDF; (4) HGPA+PEDF+Atglistatin (10uM,15 HY-15859, MedChemExpress, New Jersey, USA); (5) HGPA+PEDF+GW6471 (25uM, S2798, Selleck, Houston, USA). At 50–60% confluence, inhibitors were added to groups 4–5. PEDF was added 1h later to groups 3–5, followed by HGPA addition 2h post-inhibitors. Culture continued for 24h.
Section 3: Effect of PEDF on Glycolysis
Part 1 - Groups included: (1) Control; (2) HGPA; (3) HGPA+PEDF; (4) HGPA+FG4592 (10uM,21 HY-13426, MedChemExpress, New Jersey, USA); (5) HGPA+PEDF+FG4592.
Dosing Sequence Matched Section 2
Part 2 - Following transfection, groups were: (1) Control; (2) HGPA; (3) HGPA+PEDF; (4) HGPA+si-NC; (5) HGPA+si-PEDF; (6) HGPA+si-PEDF+Echinomycin (1nM, HY-106101, MedChemExpress, New Jersey, USA). At 24h post-transfection, PEDF was added to group 3 and Echinomycin to group 6. HGPA was added 2h later (except control) with continued culture for 24h.
Immunofluorescence Staining
COX IV (AF5468; Affinity; 1:200, Jiangsu, China) and ABCD3 (DF8315; Affinity; 1:200, Jiangsu, China) antibodies were used to detect mitochondria and peroxisomes in kidney sections. HIF-1α (20,960-1-AP; Proteintech; 1:500, Chicago, USA) was used to detect HIF-1α nuclear translocation in HK-2 cells. Each was maintained at 4°C for 24h. Subsequently, cy3-labeled secondary antibodies were stored at 37°C for 1h, followed by incubation with DAPI for 10min.
Oil Red O Staining
Kidney frozen sections embedded in OCT compound (G6059-110ML, Servebio, Wuhan, China) were sectioned at 8μm and stained with 0.5% Oil Red O (G1015, Servebio, Wuhan, China) for 30min to visualize lipid droplets. Nuclei were counterstained with hematoxylin. Separately, HK-2 cells on climbing slides were fixed with 4% paraformaldehyde at 60–70% confluence. Following permeabilization, cells were stained with Oil Red O for 15min, differentiated in 60% isopropanol, and nuclei were stained with hematoxylin. All samples were imaged by light microscopy.
Real- Time Energy Metabolism Assessed in HK-2 Cells
HK-2 cells were resuspended in prewarmed Seahorse XF Assay Medium (103575–100, Seahorse Bioscience, North Billerica, USA) and seeded at 500 tubules/50µL/well onto XFe24 cell culture microplates (102342–100, Seahorse Bioscience, North Billerica, USA). Control wells contained 50µL of medium only. Plates were centrifuged at 200g for 1min and incubated in a CO2-free incubator for 30min. After tubule sedimentation, 130µL of preheated assay buffer was added, followed by a further 15–20min incubation. Mitochondrial and glycolytic stress were analyzed using the XF Cell Mito Stress Test (103015–100, Seahorse Bioscience, North Billerica, USA) and XF Glycolysis Stress Test (103020–100, Seahorse Bioscience, North Billerica, USA) kits, respectively, on a Seahorse XFe24 analyzer.
Extracellular Lactic Acid Measurement
Six-well plates were finely intervened according to the corresponding group, and the medium was collected on the second day after intervention for detection using the Lactic Acid assay kit (A019-2-1, Nanjing Jiancheng Bioengineering Institute, Nanjing, China).
Western Blot
Renal tissue and total cellular proteins were extracted on ice with RIPA lysates containing phenylmethanesulfonyl fluoride (PMSF) and phosphatase inhibitors. The cleavage products were collected after centrifugation at 12,000r for 15min at 4°C. In addition, the proteins in the nucleus were extracted using the nuclear protein extraction kit (P0027; Beyotime, Shanghai, China), and the operation was performed according to the instruction. The proteins were heated with 5× loading buffer at 100°C for 10min and then separated by sodium dodecyl sulfate-polyacrylamide gel electrophoresis (SDS-PAGE) on gradient gels. After the proteins were electro-transferred to the PVDF membranes, the PVDF membranes were blocked with 5% non-fat milk for 2h, and then incubated with the primary antibody overnight in a 4°C: primary antibodies were purchased from Abcam (PEDF, E-cadherin and α-SMA) and Proteintech (TGF-β1, PGC1α, CPT1A, PPARα, ATGL, HK2, HIF-1α, ACOX1, Lamin A and β-actin). Then, HRP-labeled sheep anti-rabbit and sheep anti-mouse secondary antibodies (1:3000; Servicebio, Wuhan, China) for 1h at room temperature. Imaging was performed using ECL developer (G2014-100ML, Servicebio, Wuhan, China). Lamin A and β-actin protein were used as endogenous control. Protein expression levels were quantified using Image-J software. Western blot was repeated at least three times to verify the results.
RT-qPCR
Total RNA was extracted from each cell group using total RNA extraction reagent (G3013, Servicebio, Wuhan, China), and then cDNA was synthesized by reverse transcription using SweScript All-in-One-strand RT SuperMix (G3337-50; Servicebio, Wuhan, China). Quantitative real-time polymerase chain reaction (qRT-PCR) was performed using 2× Universal Blue SYBR Green qPCR Master Mix (G3326-05; Servicebio, Wuhan, China) on a QuantStudio 3 real-time PCR system (Applied biosisytem ViiA 7 Dx, Waltham, MA). The RT-qPCR assay was repeated eight times to verify the results. The primers sequences are shown in Table 1.
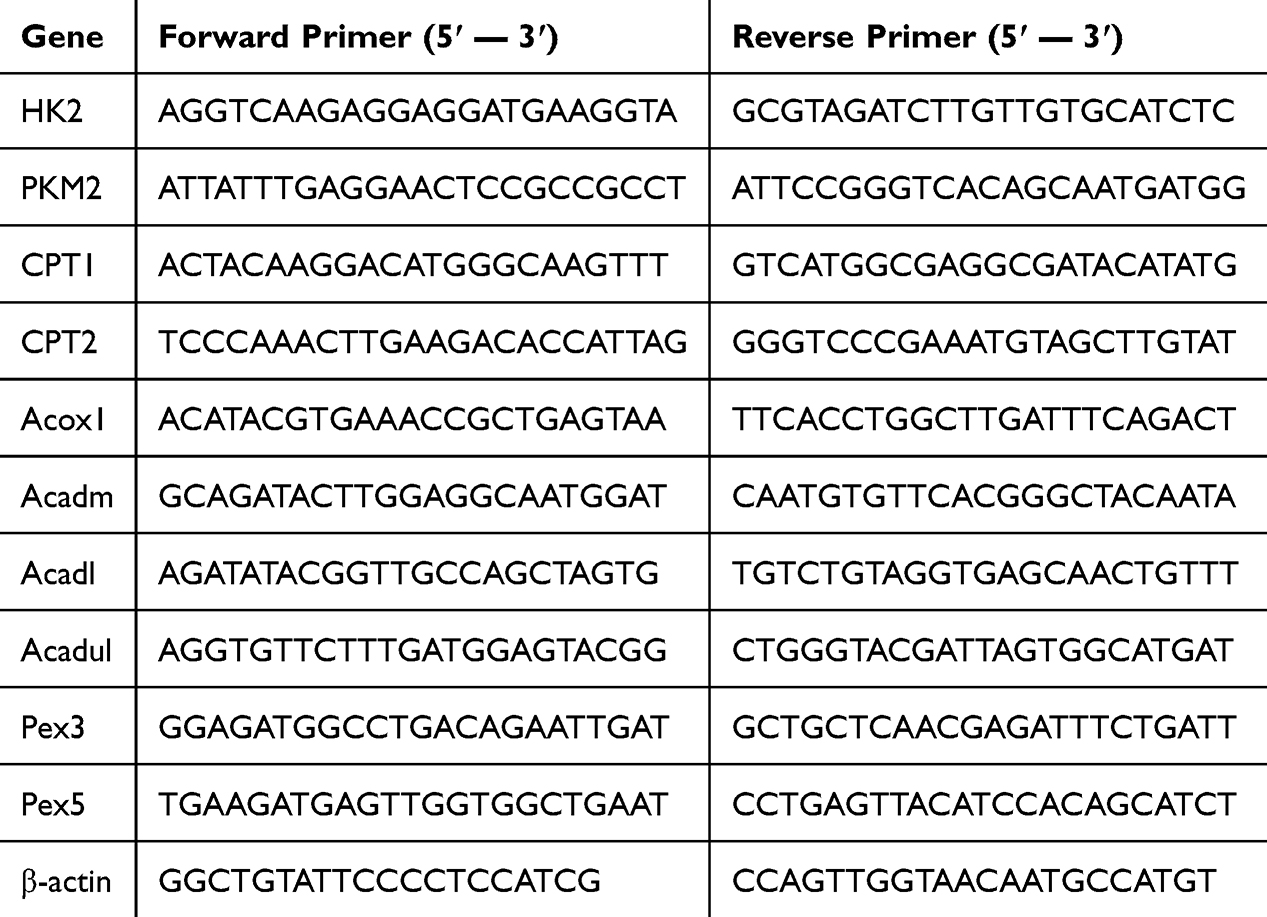 |
Table 1 Polymerase Chain Reaction Primers Used in This Study |
Statistical Analysis
Statistical analyses were performed using GraphPad Prism 8.0.1 software (SanDiego, CA, USA). All data were expressed as the mean±SEM (standard error). One-way ANOVA followed by Bonferroni’s post hoc test was used for multiple comparisons. Statistical significance was set at p<0.05.
Results
PEDF Improved Renal Function and Blood Lipid in Db/Db Mice, and Alleviated Renal Tubule Injury and Urinary Albumin in Db/Db Mice
We used 8-week-old mice for the experiment and euthanized them after 16 weeks of intervention to obtain samples (Figure 1A). Western blot analysis was employed to assess the expression of PEDF protein in the renal cortex of mice. In comparison to the db/m group, there was a reduction in PEDF protein expression in the kidneys of db/db mice, whereas injection of AAV9 carrying the PEDF gene through the tail vein resulted in an increase in PEDF protein expression in the kidneys of db/db+PEDF mice. The intervention proved successful (Figure 1B and C). In order to assess the impact of PEDF on weight, blood glucose levels, and food intake in mice, we conducted weekly monitoring of these parameters. However, our findings indicated that PEDF intervention did not yield any significant effects on weight, blood glucose levels, or food intake in mice (Figure 1D–F). Urinary N-acetyl-β-glucosaminidase (NAG) is a well-established biomarker for renal tubular injury, as it is an acidic hydrolase found in the cytosol of proximal tubule epithelial cells. Elevated levels of urinary NAG are indicative of renal tubular damage. In addition to routine measurement of creatinine, total cholesterol (TC), triglyceride (TG), and urinary albumin/creatinine ratio (ACR), urine NAG levels were also assessed. Our findings revealed that compared to the db/m group, the db/db group exhibited elevated blood creatinine, urine NAG, blood TC, blood TG, and ACR levels; however, these indices were decreased in the db/db+PEDF group (Figure 1G–K). Based on these results, it can be concluded that PEDF improved renal function and lipid profiles in db/db mice while mitigating renal tubule injury and urinary albumin excretion.
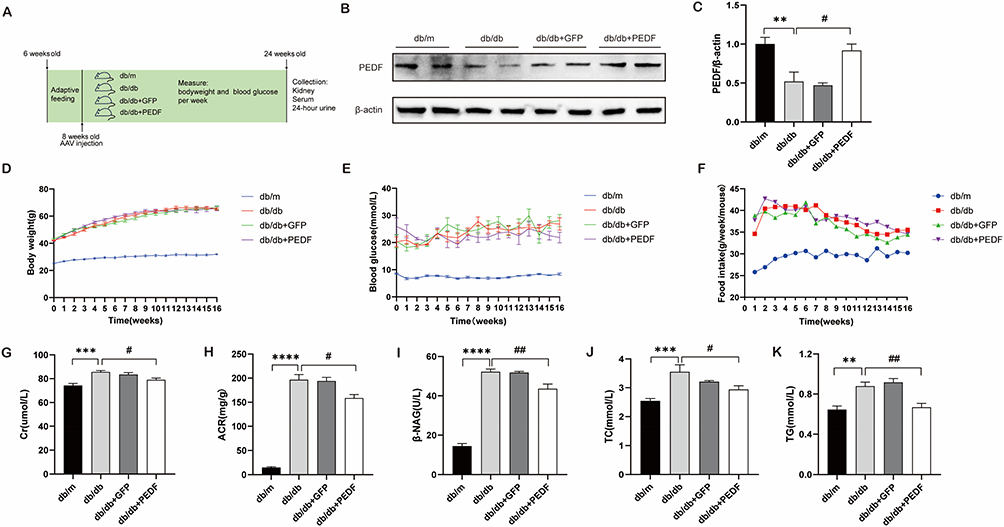 |
Figure 1 Body weight, blood glucose and food intake of mice in each group (n=10). PEDF improved renal function and blood lipid of db/db mice, and alleviated renal tubule injury and urinary albumin of db/db mice. (A) Schematic diagram of the mice experiment. (B) The expression of PEDF protein in mice renal cortex was detected by Western blot. (C) Histogram quantization results of PEDF/β-actin gray values. (D) Body weight. (E) Blood glucose. (F) Food intake. (G) Serum creatinine (Cr). (H) Urinary albumin/creatinine ratio (ACR). (I) Urine N-acetyl-beta-glucosaminase (NAG). (J) Total blood cholesterol (TC). (K) Blood triglyceride (TG). Data are expressed as mean±SEM. “*” compared with db/m group, **P<0.01, ***P<0.001, ****P<0.0001, “#” compared with db/db group, #P<0.05, ##P<0.01. |
PEDF Mitigated Renal Fibrosis in Db/Db Mice
To assess the extent of renal fibrosis, kidney tissue sections were subjected to routine PAS staining and Sirius red staining (Figure 2A–H). Western blot analysis was employed to determine the expression levels of transforming growth factor-β1 (TGF-β1) and α-smooth muscle actin (α-SMA) protein, which serve as indicators for renal cortical fibrosis in mice (Figure 2J). By performing PAS staining, we observed dilatation of the glomerular mesangial matrix and tubulointerstitial damage in the kidneys of db/db mice. However, intervention with PEDF mitigated these changes (Figure 2A–D). In comparison to the db/m group mice, those in the db/db group exhibited an increase not only in the area of Sirius red collagen within their kidneys (Figure 2E and F), but also in the expression levels of TGF-β1 and α-SMA proteins (Figure 2J–L). This indicated that renal fibrosis was present in 24-week-old db/db diabetic mice. Interestingly, compared to mice in the db/db group, those treated with PEDF showed a reduction in Sirius red stained collagen area within their kidneys (Figure 2F–I), as well as a decrease in TGF-β1 and α-SMA protein expression levels (Figure 2J–L). These findings suggested that PEDF has potential for reducing kidney tissue fibrosis in db/db diabetic mice.
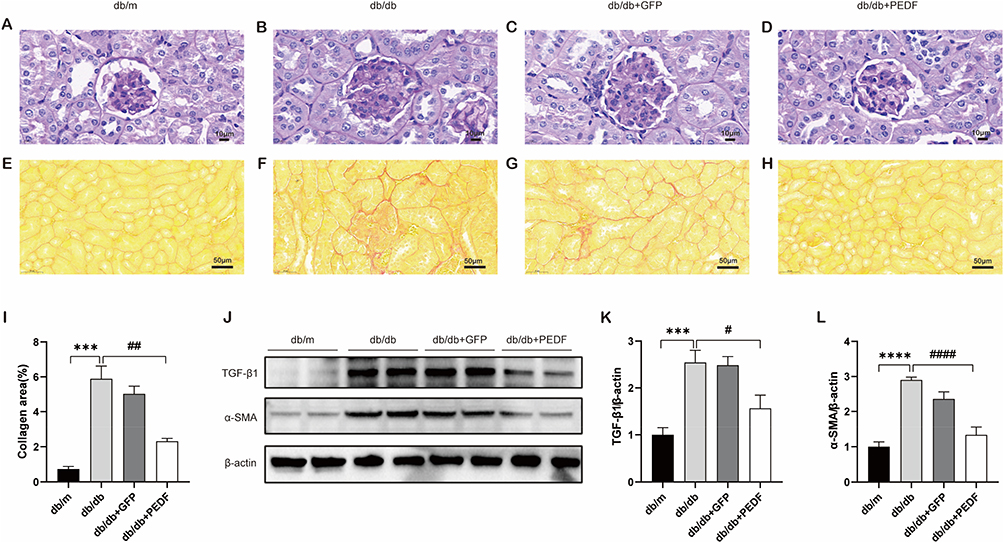 |
Figure 2 PEDF alleviated renal fibrosis in db/db mice. (A–D) PAS staining of mice kidney. (E–H) Sirius red staining of mice kidney. (I) Statistical analysis of collagen area of mice kidney stained with Sirius red. (J) The expressions of transforming growth factor-β1 (TGF-β1) and α-smooth muscle actin (α-SMA) protein, the indicators of renal cortical fibrosis in mice, were detected by Western blot. (K) Histogram quantized analysis results of TGF-β1/β-actin gray value. (L) Histogram quantized analysis results of α-SMA/β-actin gray values. Data are expressed as mean±SEM. “*” compared with db/m group, ***P<0.001, ****P<0.0001, “#” compared with db/db group, #P<0.05, ##P<0.01, ####P<0.0001. |
PEDF Suppressed Renal Ectopic Fat Accumulation in Db/Db Mice
To assess lipid deposition in mice kidneys, we performed oil red staining, electron microscopy observation, and adipose differentiation related protein (ADRP) immunohistochemical staining on kidney sections (Figure 3A). We observed high expression of ADRP in the renal tubules of db/db diabetic mice, along with evidence of lipid droplet deposition through oil red O staining and electron microscopy analysis within the renal tubular epithelial cells of these mice (Figure 3A–C). However, treatment with PEDF resulted in reduced expression of ADRP within the renal tubules of db/db mice. Furthermore, oil red O staining and electron microscopy confirmed a decrease in lipid droplet deposition within renal tubule cells following PEDF intervention, indicating that PEDF has the ability to inhibit ectopic lipid accumulation in the kidneys of db/db mice (Figure 3A–C).
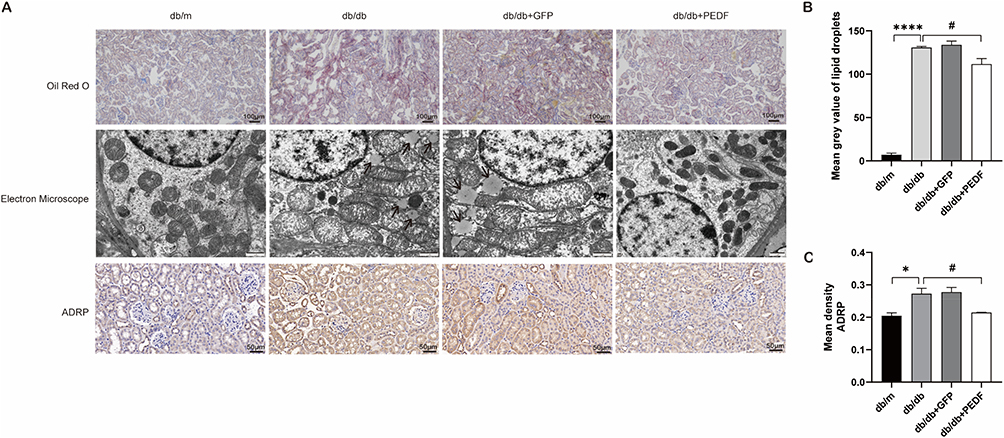 |
Figure 3 PEDF inhibited renal ectopic fat deposition in db/db mice. (A) Mice kidney sections were stained with oil red, and electron microscopy revealed the presence of lipid droplets (indicated by black arrows). Immunohistochemical staining for adipose differentiation associated protein (ADRP) was also performed. (B) Quantitative statistical analysis of the gray value of mice kidney oil red stained fat drops. (C) Statistical analysis of mean optical density (AOD) of mice kidney ADRP staining. Data are expressed as mean±SEM. “*” compared with db/m group, *P<0.05, ****P<0.0001, “#” compared with db/db group, #P<0.05. |
PEDF Upregulated Renal Protein Expression of Peroxisomal and Enhanced Fatty Acid β-Oxidation in Db/Db Mice
β-oxidation within the peroxisome is responsible for metabolizing almost entirely ultra-long chain fatty acids. Peroxisome acyl-CoA oxidase 1 (ACOX1), located in the matrix of the peroxisome, serves as the rate-limiting enzyme for β-oxidation by desaturating acetyl-CoA to form 2-trans-enol-CoA. We conducted immunofluorescence staining for ATP-Binding Cassette Subfamily D Member 3 (ABCD3) on sections of mice kidney (Figure 4A), and detected the expression of ACOX1 protein in the renal cortex of mice using Western blot analysis (Figure 4C). Our findings revealed a decrease in ABCD3 immunofluorescence staining and ACOX1 protein expression in the db/db group compared to the db/m group, indicating impaired renal peroxisomal fatty acid oxidation in diabetic mice. Furthermore, we observed that PEDF administration increased both ABCD3 immunofluorescence staining and ACOX1 protein expression in the kidneys of db/db mice (Figure 4A–D), suggesting that PEDF can enhance peroxisome proliferation and promote fatty acid β-oxidation within renal peroxisomes.
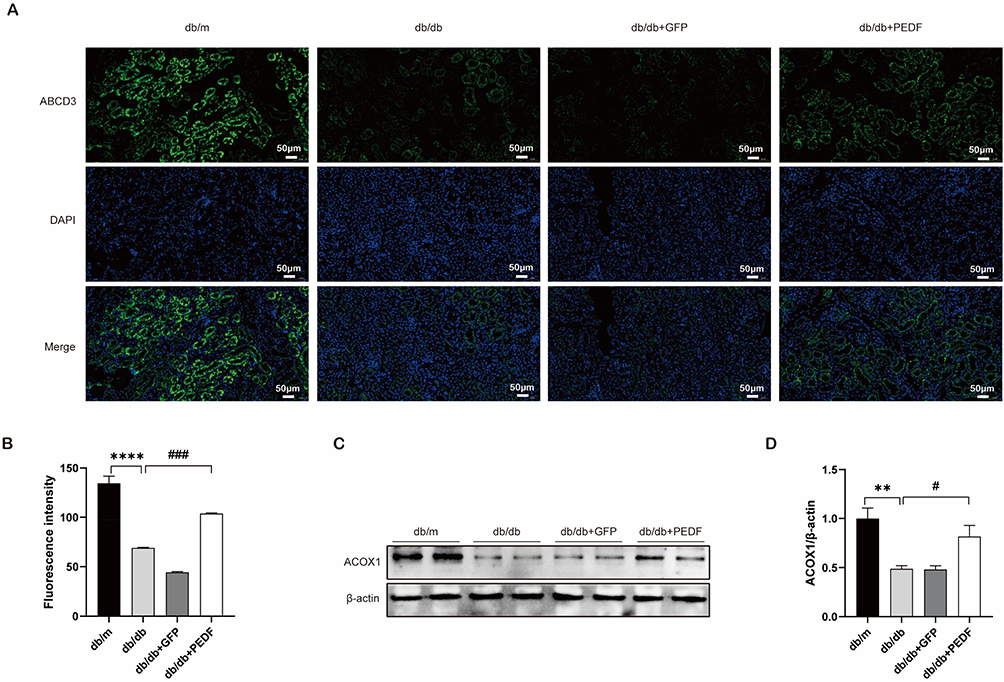 |
Figure 4 PEDF increased renal protein expression of peroxisomal and fatty acid β oxidation in db/db mice. (A) Mice renal peroxisome membrane protein ATP-binding cassette sub-family D member 3 (ABCD3) immunofluorescence staining. (B) Analysis of the average fluorescence intensity of ABCD3 immunofluorescence staining. (C) The expression of peroxidase acyl-CoA oxidase-1 (ACOX1) protein in renal cortex was detected by Western blot. (D) Histogram quantized analysis results of ACOX1/β-actin gray values. Data are expressed as mean±SEM. “*” compared with db/m group, **P<0.01, ****P<0.0001, “#” compared with db/db group, #P<0.05, ###P<0.001. |
PEDF Enhanced the Protein Expression and Fatty Acid β-Oxidation of Kidney Mitochondria in Db/Db Mice
Cytochrome C oxidase IV subtype (COX IV) plays a crucial role in the assembly and function of the mitochondrial respiratory chain. Carnitine palmitoyltransferase 1A (CPT1A) acts as a rate-limiting factor for allowing long-chain fatty acids to enter mitochondria for β-oxidation. Immunofluorescence staining for COX IV was performed on mice kidney sections (Figure 5A), while Western blot analysis was used to detect CPT1A protein expression in mice kidney cortex (Figure 5C). Compared with db/m group mice, both COX IV immunofluorescence staining and CPT1A protein expression were decreased in kidneys of db/db group mice, indicating weakened mitochondrial fatty acid oxidation in diabetic kidneys. However, treatment with PEDF increased both COX IV immunofluorescence staining and CPT1A protein expression in kidneys of db/db mice (Figure 5A–D). These findings suggested that PEDF can enhance renal mitochondrial biogenesis and promote fatty acid β-oxidation in db/db mice.
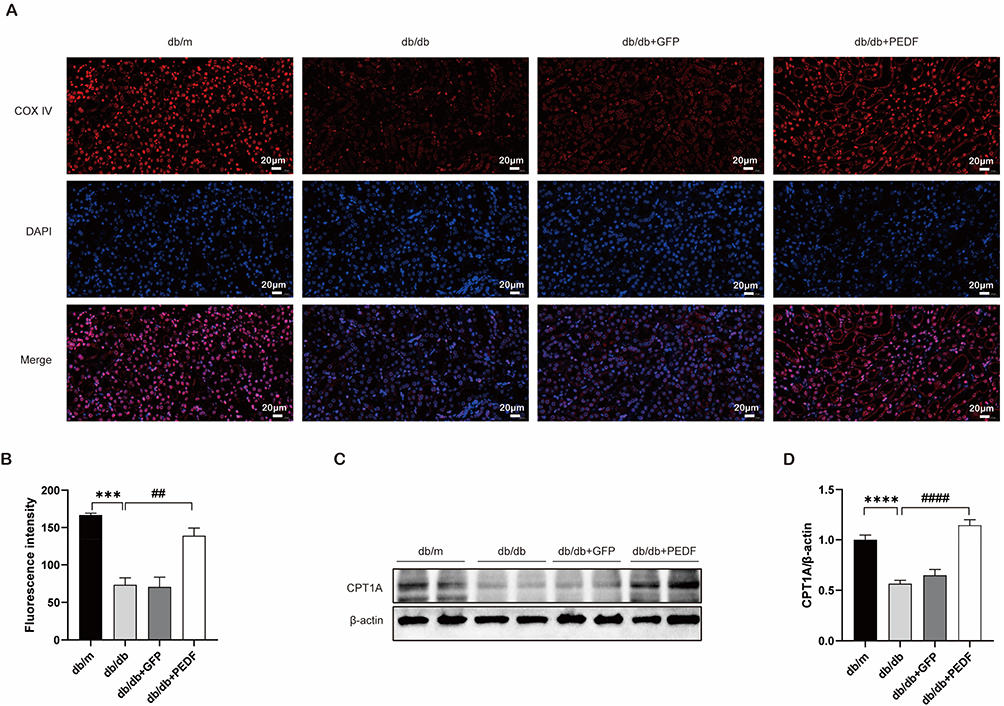 |
Figure 5 PEDF increased renal protein expression of mitochondrial and fatty acid β oxidation in db/db mice. (A) Immunofluorescence staining of kidney cytochrome C oxidase IV subtype (COX IV). (B) Analysis of mean fluorescence intensity of COX IV immunofluorescence staining. (C) The expression of carnitine palmitoyl transferase 1A (CPT1A) protein in renal cortex was detected by Western blot. (D) Histogram quantized analysis results of CPT1A/β-actin gray values. Data are expressed as mean±SEM. “*” compared with db/m group, ***P<0.001, ****P<0.0001, “#” compared with db/db group, ##P<0.01, ####P<0.0001. |
PEDF Upregulated the Expression of the ATGL-PPARα Pathway and Downregulated the Expression of the HIF1α-HK2 Pathway in the Kidneys of Db/Db Mice
In situ hybridization was employed to detect hypoxia-inducible factor-1α (HIF-1α) mRNA expression in mice kidneys (Figure 6A), while Western blot analysis was used to assess peroxisome proliferator-activated receptor-γcoactivator 1α (PGC1α), peroxisome proliferator-activated receptor-α (PPARα), ATGL, and hexokinase 2 (HK2) protein levels in mice renal cortex (Figure 6C). We observed elevated HIF-1α mRNA expression in renal tubules of db/db group mice, whereas PGC1α, PPARα, and ATGL protein levels were decreased, and HK2 protein level was increased in the renal cortex of db/db group mice (Figure 6A–G). Treatment with PEDF reduced HIF-1α mRNA and HK2 protein expression while increasing PGC1α, PPARα, and ATGL protein levels in the renal cortex of db/db mice (Figure 6A–G).
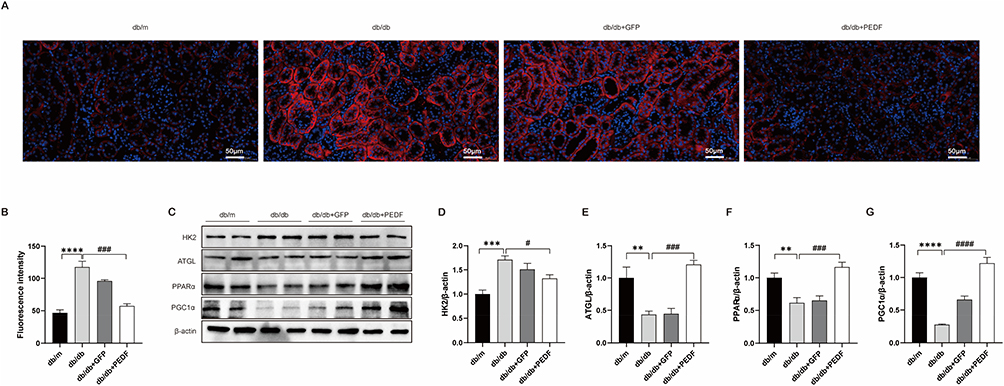 |
Figure 6 PEDF increased the expression of ATGL-PPARα pathway in kidney of db/db mice and inhibited the expression of HIF1α-HK2 pathway. (A) The mRNA expression of hypoxia-inducible factor-1 α (HIF-1α) was detected using in situ hybridization. (B) Analysis of mean fluorescence intensity of HIF-1α mRNA expression. (C) The expressions of peroxisome proliferator-activated receptor-γ coactivator 1α (PGC1α), peroxisome proliferator-activated receptor-α (PPARα), adipotriglyceride lipase (ATGL) and hexokinase-2 (HK2) proteins in renal cortex of mice were detected by Western blot assay. (D) Histogram quantized analysis results of HK-2 /β-actin gray values. (E) Histogram quantized analysis results of ATGL/β-actin gray values. (F) Histogram quantized analysis results of PPARα/β-actin gray values. (G) Histogram quantized analysis results of PGC1α/β-actin gray values. Data are expressed as mean±SEM. “*” compared with db/m group, **P<0.01, ***P<0.001, ****P<0.0001, “#” compared with db/db group, #P<0.05, ###P<0.001, ####P<0.0001. |
PEDF Mitigated Lipid Deposition and Transdifferentiation of Human Proximal Renal Tubular Epithelial Cells (HK-2) Induced by High Glucose and High Palmitic Acid via the ATGL-PPARα Pathway
In order to simulate diabetes, HK-2 cells were cultured under high glucose and palmitic acid conditions. Following PEDF intervention, oil red staining was performed on the cells (Figure 7A). Western blot analysis was conducted to assess the protein levels of ATGL, TGF-β1, E-Cadherin, and α-SMA in HK-2 cells (Figure 7C and E). After treatment with high glucose and high palmitic acid, we observed a decrease in the expression of ATGL in HK-2 cells, accompanied by an increase in the expression of TGF-β1 and α-SMA, as well as a decrease in the expression of E-Cadherin (Figure 7C–H). These findings suggested that high glucose and high palmitic acid can induce lipid deposition and transdifferentiation of renal tubular epithelial cells. However, upon intervention with PEDF, we observed an increase in the expression of ATGL in HK-2 cells, leading to a reduction in lipid droplet deposition (Figure 7A–D). Additionally, there was a decrease in the expression of TGF-β1 and α-SMA along with an increase in E-Cadherin expression (Figure 7E–H). Therefore, it is suggested that PEDF has the potential to mitigate lipid deposition and transdifferentiation induced by high glucose and high palmitic acid. In order to ascertain the mechanism by which PEDF exerts its effects, we introduced the ATGL inhibitor Atglistatin or PPARα antagonist GW6471 as probes for detecting relevant indicators. Interestingly, we observed a complete abrogation of the protective effect of PEDF in this experimental setting. These findings strongly suggested that PEDF mitigated lipid deposition and transdifferentiation in HK-2 cells induced by high glucose and high palmitic acid through activation of the ATGL-PPARα pathway.
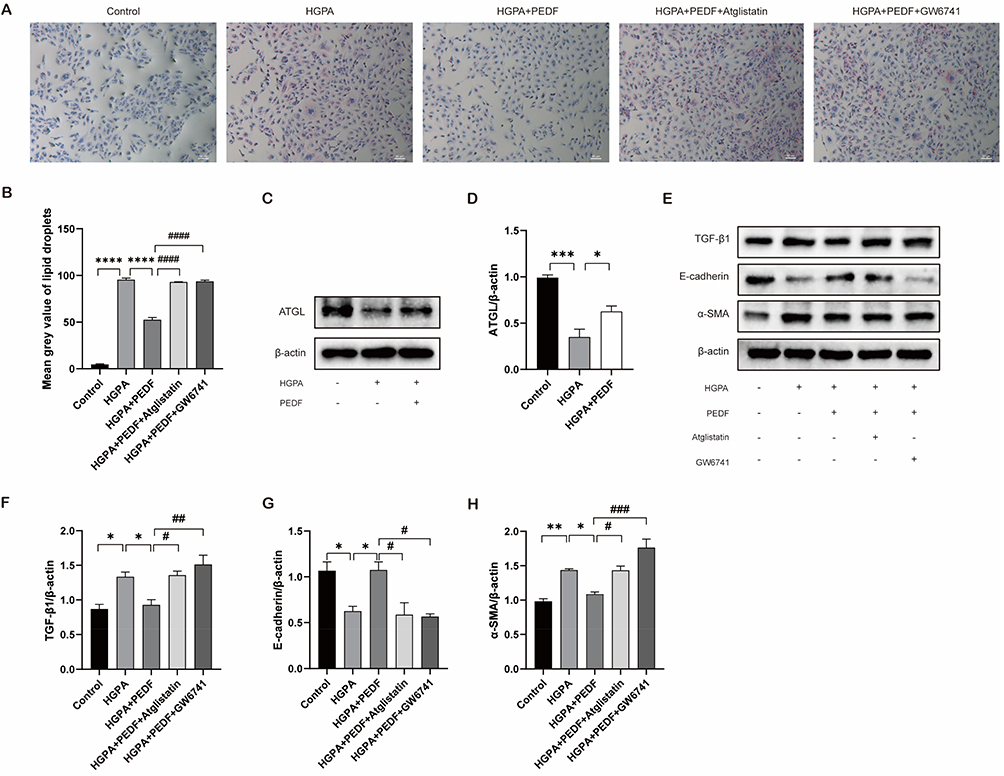 |
Figure 7 PEDF alleviated lipid deposition and transdifferentiation of human proximal renal tubular epithelial cells (HK-2) induced by high glucose and high palmitic acid via ATGL-PPARα pathway. (A) Oil red staining of HK-2 cells in each group. (B) Quantitative statistical analysis of the gray value of HK-2 cell oil red stained lipid drops. (C) The expression of ATGL protein in HK-2 cells was detected by Western blot. (D) Histogram quantized analysis results of ATGL/β-actin gray values. (E) The expressions of TGF-β1, E-cadherin and α-SMA in HK-2 cells were detected by Western blot. (F) Histogram quantized analysis results of TGF-β1/β-actin gray value. (G) Histogram quantized analysis results of gray values of E-Cadherin/β-actin. (H) Histogram quantized analysis results of α-SMA/β-actin gray values. HGPA stands for high sugar and high palmitic acid, Atglistatin is an ATGL inhibitor, GW6471 is a PPARα antagonist. Data are expressed as mean±SEM. “*” compared with HGPA group, *P<0.05, **P<0.01, ***P<0.001, ****P<0.0001, “#” compared with HGPA + PEDF group, #P<0.05, ##P<0.01, ###P<0.001, ####P<0.0001. |
The Presence of PEDF in HK-2 Cells Cultured with High Glucose and Palmitic Acid Enhanced Fatty Acid βoxidation in Both Mitochondria and Peroxisomes Through the ATGL-PPARα Pathway
The expression of genes associated with mitochondrial and peroxisomal fatty acid β-oxidation in HK-2 cells were assessed using RT-qPCR, while the protein levels of PGC1α, PPARα, ACOX1, and CPT1A were determined by Western blot analysis. Our findings revealed a reduction in both mitochondrial and peroxisome fatty acid β-oxidation related genes (Figure 8A and B), as well as decreased protein expressions of PGC1α, PPARα, ACOX1, and CPT1A (Figure 8C–G) following treatment of HK-2 cells with high glucose and palmitic acid. These results indicated that high sugar and palmitic acid exert inhibitory effects on fatty acid β-oxidation in HK-2 cells. However, following PEDF intervention, there was an increase in the expression of genes related to mitochondrial and peroxisomal fatty acid β-oxidation (Figure 8A and B), as well as elevated protein levels of PGC1α, PPARα, ACOX1, and CPT1A (Figure 8C–G). These findings suggested that PEDF can enhance the oxidation of fatty acids in HK-2 cells cultured with high glucose and palmitic acid. Nevertheless, when ATGL inhibitor Atglistatin or PPARα antagonist GW6471 were added, the protective effect of PEDF disappeared. This indicated that PEDF promotes fatty acid β-oxidation in mitochondria and peroxisomes of HK-2 cells cultured with high glucose and palmitic acid through the ATGL-PPARα pathway.
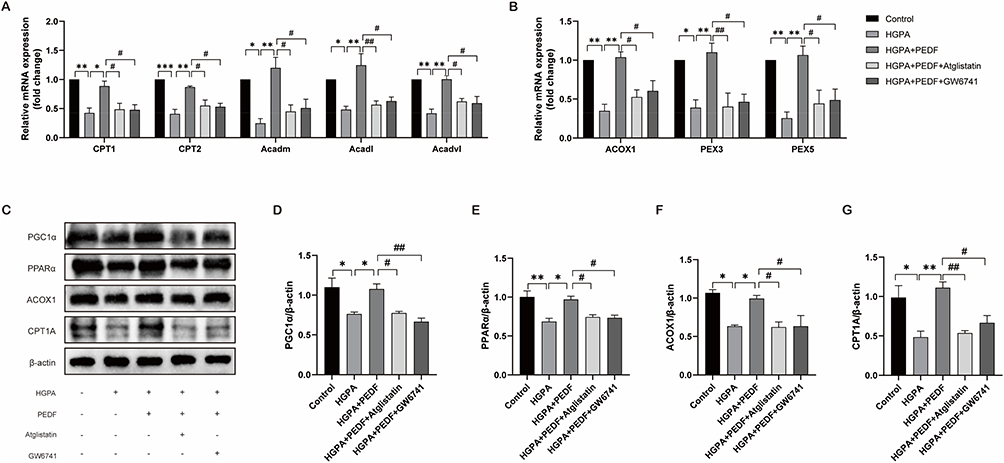 |
Figure 8 PEDF increased fatty acid β oxidation in mitochondria and peroxisome of HK-2 cells cultured with high glucose and palmitic acid through ATGL-PPARα pathway. (A) RT-qPCR was used to detect the expression of mitochondrial fatty acid β oxidation related genes in HK-2 cells. (B) The expression of peroxisome fatty acid β oxidation related genes in HK-2 cells was detected by RT-qPCR. (C) Western blot assay was used to detect the expression of PGC1α, PPARα, ACOX1 and CPT1A in HK-2 cells. (D) Histogram quantized analysis results of PGC1α/β-actin gray values. (E) Histogram quantized analysis results of PPARα/β-actin gray values. (F) Histogram quantized analysis results of ACOX1/β-actin gray values. (G) Histogram quantized analysis results of CPT1A/β-actin gray values. HGPA stands for high sugar and high palmitic acid, Atglistatin is an ATGL inhibitor, GW6471 is a PPARα antagonist. Data are expressed as mean±SEM. “*” compared with HGPA group, *P<0.05, **P<0.01, ***P<0.001, “#” compared with HGPA + PEDF group, #P<0.05, ##P<0.01. |
PEDF Inhibited Metabolic Reprogramming in HK-2 Cells Induced by High Glucose and High Palmitic Acid
HIF-1α immunofluorescence staining was performed on HK-2 cells, and it was found that HIF-1α expression increased in HK-2 cells under high glucose and high palmitic acid conditions, and decreased following PEDF intervention (Figure 9A). To detect changes in energy metabolism of HK-2 cells, we measured oxygen consumption rate (OCR) and extracellular acidification rate (ECAR) of HK-2 cells using Seahorse Energy metabolism analyzer. The presence of high glucose and high palmitic acid, as well as PEDF, did not significantly impact the basic respiration of HK-2 cells. However, high glucose and high palmitic acid led to a reduction in ATP synthesis, maximal oxygen consumption, and respiratory potential of HK-2 cells. Conversely, PEDF increased these parameters when cultured with high glucose and high palmitic acid (Figure 9B and D–G). Additionally, elevated glucose levels combined with high palmitic acid enhanced both basal glycolysis capacity and glycolysis capacity in HK-2 cells. On the other hand, PEDF decreased these capacities when cultured with high glucose and high palmitic acid (Figure 9C, H and I).
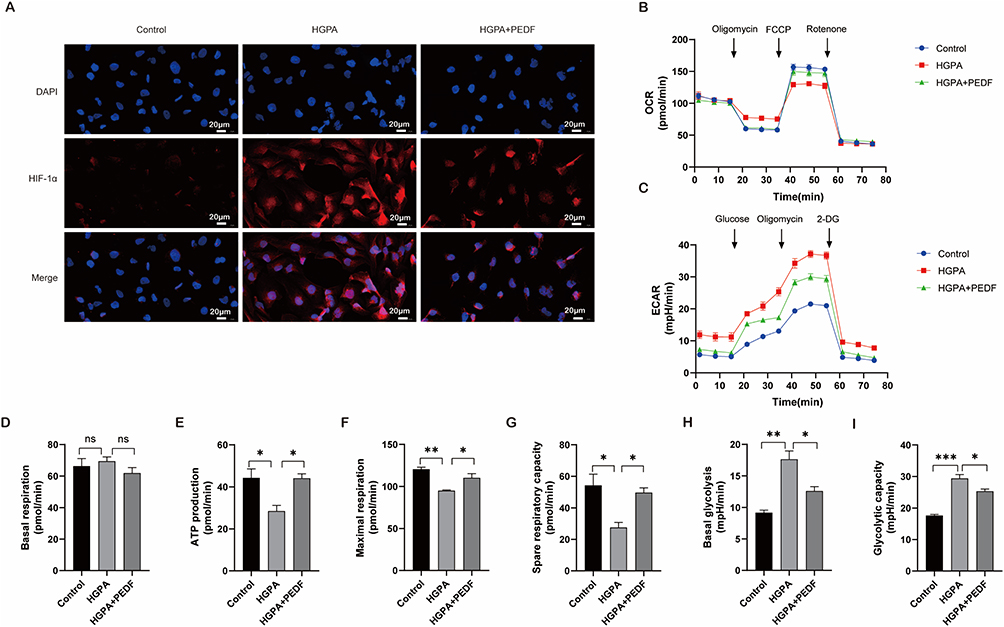 |
Figure 9 PEDF inhibited metabolic reprogramming in HK-2 cells induced by high glucose and high palmitic acid. (A) HK-2 cell HIF-1α immunofluorescence staining. (B) Oxygen consumption rate (OCR) of HK-2 cells was measured by Seahorse Energy metabolism analyzer. (C) The extracellular acidification rate (ECAR) of HK-2 cells was determined by Seahorse Energy metabolism analyzer. (D) Basal respiration of OCR. (E) Analysis results of ATP production for OCR oxidative phosphorylation. (F) Results of OCR maximal oxygen consumption (maximal respiration) analysis. (G) OCR spare respiratory capacity analysis results. (H) Basal glycolysis analysis of ECAR. (I) Results of ECAR Glycolytic capacity analysis. HGPA stands for high sugar and palmitic acid. Data are expressed as mean±SEM. “*” compared with HGPA group, nsP means no significant difference, *P<0.05, **P<0.01, ***P<0.001. |
PEDF Inhibited Glycolysis of HK-2 Cells Cultured with High Glucose and Palmitic Acid by HIF-1α
The gene expression of glycolysis-related enzymes in HK-2 cells was assessed using RT-qPCR. HK2 (hexokinase 2) is identified as the initial and rate-limiting enzyme in the glycolytic pathway. Additionally, PKM2 is recognized as a crucial rate-limiting enzyme involved in converting energy from PEP to ATP and pyruvate, which can be further reduced to lactic acid by intracellular lactate dehydrogenase or directly synthesized into ATP through the respiratory chain. We observed an upregulation of HK2 and PKM2 mRNA expression levels in HK-2 cells cultured with high glucose and high palmitic acid, whereas PEDF was able to attenuate the expression levels of HK2 and PKM2 mRNA (Figure 10A). To investigate whether PEDF inhibits glycolysis by suppressing HIF-1α, we supplemented FG4592 to assess the levels of HK2 and PKM2 mRNA. FG4592 is a HIF-α prolyl hydroxylase inhibitor that stabilizes HIF activity. The results demonstrated that the effect of PEDF on reducing HK2 and PKM2 mRNA levels disappeared upon addition of FG4592 (Figure 10A). The same effect was observed at the protein level, wherein PEDF attenuated the expression of HIF-1α and HK2 proteins induced by high glucose and palmitic acid in HK-2 cells. However, this inhibitory effect was abolished upon addition of FG4592 (Figure 10B–D). We further validated the glycolysis inhibition by PEDF through assessing lactic acid levels in the supernatant of HK-2 cells. It was found that PEDF significantly reduced lactic acid production in HK-2 cells cultured with high sugar and palmitic acid, which could be reversed by FG4592 treatment (Figure 10E). In order to further validate the impact of PEDF on glycolysis, we silenced the PEDF gene and observed a reduction in the expression of PEDF protein in HK-2 cells cultured with high glucose and high palmitic acid. Subsequently, upon addition of si-PEDF, there was a further decrease in the expression of PEDF protein (Figure 10F and G). We discovered that si-PEDF elevated HIF-1α and HK2 protein levels in HK-2 cells cultured with high glucose and palmitic acid, as well as increased lactic acid production in the cell supernatant (Figure 10H–K). However, when Echinomycin, an inhibitor of HIF-1α, was added, the effects of si-PEDF on increasing HIF-1α, HK2 protein, and lactate were abolished (Figure 10H–K).
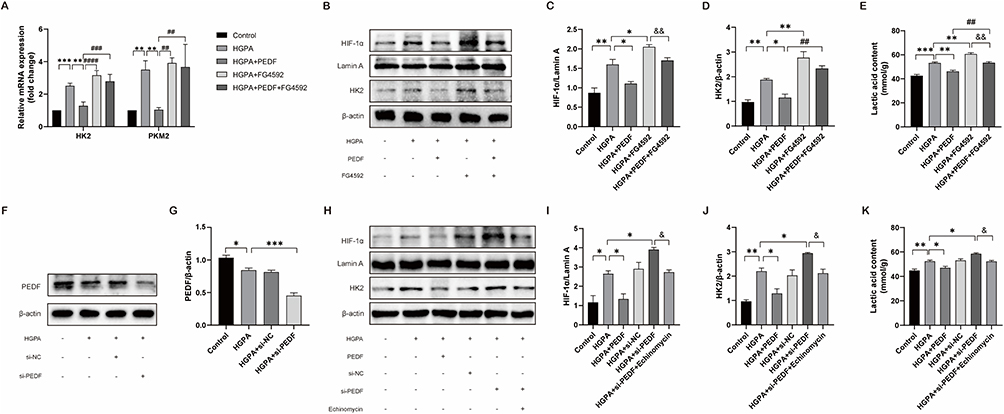 |
Figure 10 PEDF inhibited glycolysis of HK-2 cells cultured with high glucose and palmitic acid through HIF-1α. (A) The expression of glycolysis-related genes in HK-2 cells was detected by RT-qPCR. (B) The expressions of HIF-1α and HK-2 protein in HK-2 cells were detected by Western blot. (C) Histogram quantized analysis results of HIF-1α/Lamin A gray value. (D) Histogram quantized analysis results of HK2/β-actin gray values. (E) Extracellular lactic acid content. (F) The expression of PEDF protein in HK-2 cells was detected by Western blot. (G) Histogram quantization results of PEDF/β-actin gray values. (H) Western blot assay was used to detect HIF-1α and HK-2 protein expression in HK-2 cells. (I) Histogram quantized analysis results of HIF-1α/Lamin A gray value. (J) Histogram quantized analysis results of HK2/β-actin gray values. (K) Extracellular lactic acid content. HGPA stands for high sugar and palmitic acid, FG4592 is an HIF-α prolyl hydroxylase inhibitor that can stabilize the activity of HIF, and Echinomycin is an HIF-1α inhibitor. Data are expressed as mean±SEM. “*” compared with HGPA group, *P<0.05, **P<0.01, ***P<0.001, “#” compared with HGPA + PEDF group, ##P<0.01, ###P<0.001, ####P<0.0001, “&” compared with HGPA + si-PEDF group, &P<0.05, &&P<0.01. |
Discussion
The present study elucidated the role of PEDF in ameliorating diabetic renal fibrosis. It was revealed that AAV9-mediated PEDF gene implantation effectively mitigates ectopic fat deposition in the kidneys and regulates metabolic reprogramming of renal tubular epithelial cells, thereby alleviating renal fibrosis.
The db/db mouse is an ideal animal model for early studies on type 2 diabetic nephropathy. The findings of our study align with the previously published literature, the db/db mice exhibited glomerular vascular endothelial cell proliferation and increased expression of TGF-β1. Additionally, they display typical lipid deposition in the proximal convoluted tubules, with subsequent development of glomerular sclerosis and interstitial fibrosis in later stages.22
AAV is an innovative gene transfer vector capable of facilitating long-term expression of the target gene.23 AAV has demonstrated initial success in clinically treating various genetic disorders, including hemophilia; however, progress in preclinical and clinical studies related to kidney diseases remains limited.24 AAV encompasses multiple serotypes, wherein the primary distinction lies in their capsid proteins resulting in varying transfection efficiencies across different tissues and cells.25 This study utilized AAV9 combined with caudal vein injection to achieve overexpression of PEDF within the kidney. The administration of PEDF resulted in improved renal function and reduced urinary protein levels in db/db diabetic mice. Additionally, it mitigated renal tubule damage, attenuated ectopic lipid deposition in the kidneys, and inhibited renal fibrosis.
Physiologically, only a minimal amount of fat is deposited in the renal parenchyma. In the diabetic state, excessive production of free fatty acids (FFA) overwhelms the oxidative capacity of renal tissues, leading to inhibition of β-oxidation and redirection of FFA metabolism towards esterification within cellular compartments.26,27 ADRP is involved in cytoplasmic lipid droplet deposition and transport, formation of adipocyte storage vesicles, and regulation of triglyceride utilization.28,29 Consistent with literature reports,30 we detected kidney tissue of db/db diabetic nephropathy mice and found that ADRP was highly expressed in renal tubules, Oil red O staining also indicated the presence of fat deposits in renal tissue. Additionally, both Xiao Li’s team and our team conducted oil red staining on renal puncture specimens from patients with type 2 diabetic nephropathy, yielding consistent findings that revealed lipid deposition in both glomeruli and the interstitium of renal tubules. However, the predominant site of lipid accumulation was observed to be within the proximal tubular epithelial cells.3,19 It can be seen that ectopic fat is mainly deposited in the proximal tubular epithelial cells in DKD state, so we focused our research on the proximal tubular epithelial cells.
PPARα exhibits high expression levels in the kidney and serves as a crucial nuclear transcription factor that governs fatty acid catabolism within cells. Functioning as a transcriptional coactivator, PGC1α plays a pivotal regulatory role in energy metabolism by facilitating the activation of PPARα.9 The expression of PPARα, PGC1α, and proteins associated with the fatty acid oxidation pathway such as CPT1A and ACOX1 significantly diminishes with lipid accumulation in kidney of db/db diabetic nephropathy mice. The administration of PEDF in db/db diabetic mice can effectively attenuate renal lipid deposition and enhance the protein expression levels of PPARα, PGC1α, CPT1A, and ACOX1. PEDF has the potential to mitigate lipid deposition and enhance fatty acid oxidation in HK-2 cells that are cultured with high levels of glucose and palmitic acid. However, when the ATGL inhibitor Atglistatin or PPARα antagonist GW6471 is introduced, the protective effect of PEDF diminishes. This suggests that PEDF facilitates fatty acid β-oxidation in both mitochondria and peroxisomes by means of the ATGL-PPARα pathway.
Although metabolic reprogramming is an effective strategy to compensate for energy deficiency in proximal renal tubule cells, the accumulation of crucial glycolytic enzymes and resulting lactic acid production within this pathway exerts a significant impact on the structure and function of glomeruli, tubules, and stroma. The stimulation of TGF-β1, activation of oxidative stress, and regulation of the cell cycle by lactic acid can enhance fibroblast proliferation and extracellular matrix production.31,32 Renal tubule-derived lactate can enter the interstitial space through the monocarboxylate transporter, thereby promoting fibroblast activation, proliferation, and subsequent renal interstitial fibrosis.33 The regulation of glycolysis is significantly influenced by HIF-1α, and the antitumor properties of PEDF are attributed to its inhibitory effect on HIF-1α.34 Under physiological conditions, HIF-1α is unstable within cells and is quickly degraded. Under pathological conditions such as hypoxia, HIF-1α increases its stability and transfers to the nucleus to activate the transcription process of its target genes.35 HK2 is one of the target genes of HIF-1α, and HK2 is not only the first catalytic enzyme of glycolysis pathway, but also one of the key rate-limiting enzymes. The presence of PEDF could attenuate the the expression of HIF-1α and subsequently decrease the expression of HK2 gene, thereby mitigating lactic acid production. It should be noted that, as this study did not measure cytoplasmic HIF-1α protein levels or total protein content, the possibility that PEDF may exert a potential influence on its subcellular localization cannot be entirely ruled out. However, the observed significant decrease in HIF-1α mRNA levels suggests that transcriptional regulation of HIF-1α is likely the primary mechanism underlying PEDF’s action. The anti-diabetic renal fibrosis effect of PEDF may be partially attributed to its inhibition of glycolysis in renal tubular epithelial cells via the HIF-1α-HK2 signaling pathway.
Our research group initiated the investigation of PEDF in 2008 and has conducted preliminary studies on its potential in delaying the progression of DKD.19,36–38 Although preclinical findings are promising, several major challenges must be addressed to successfully translate PEDF into clinical applications: 1. Delivery system limitations: Developing renal-targeted nanoparticles encapsulating PEDF protein or its encoding gene may enable kidney-specific enrichment. 2. Efficacy-safety balance: The multifunctional nature of PEDF presents a double-edged sword. While therapeutically beneficial, it also elevates potential risks. For instance, while its potent anti-angiogenic effects suppress pathological neovascularization, could they concurrently impair normal renal repair processes and physiological angiogenesis?
3. Stage-specific applicability: The therapeutic efficacy of PEDF is likely most pronounced in early disease stages (primarily characterized by inflammatory initiation and fibrogenesis). In end-stage kidneys with extensive irreversible scar tissue formation, its anti-fibrotic effects may be substantially limited.
Conclusions
PEDF can enhance the degradation of ectopically deposited fat in diabetic kidneys and induce the generation of free fatty acids via its receptor ATGL (Figure 11). On one hand, PEDF promotes β-oxidation of fatty acids in mitochondria and peroxisomes through the ATGL-PPARα pathway; on the other hand, it inhibits glycolysis via HIF-1α. PEDF can impede metabolic reprogramming of renal tubular epithelial cells and ameliorate diabetic renal fibrosis. The findings of this study offer novel insights for the advancement of pharmaceuticals targeting diabetic nephropathy treatment.
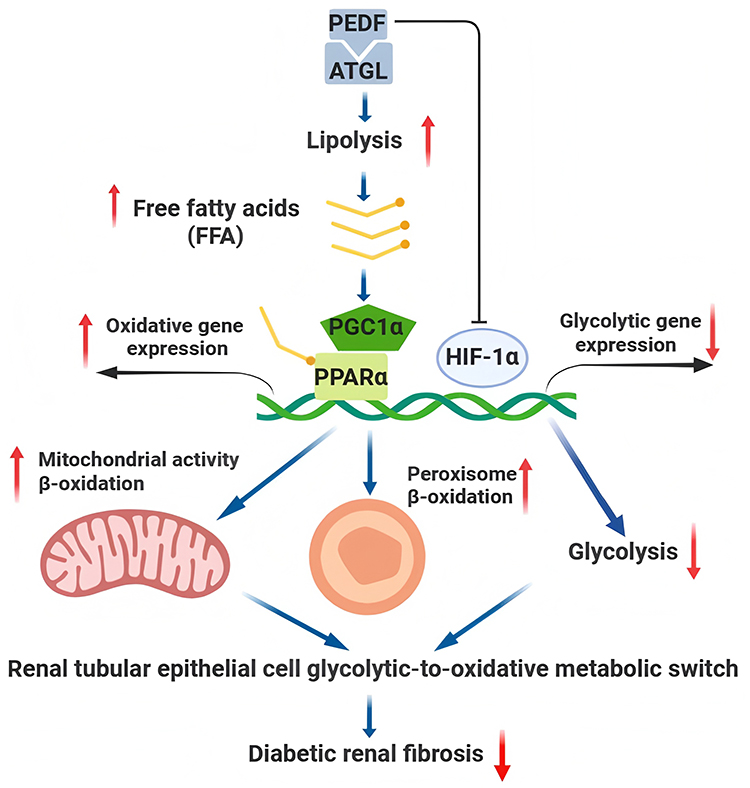 |
Figure 11 A summary of the proposed effects of PEDF for alleviating diabetic renal fibrosis. PEDF facilitates the degradation of ectopically accumulated fat in the diabetic kidney, leading to the generation of free fatty acids via its receptor ATGL. On one hand, PEDF promotes β-oxidation of fatty acids within mitochondria and peroxisomes through the ATGL-PPARα pathway; on the other hand, PEDF inhibits glycolysis via HIF-1α. This mechanism hinders metabolic reprogramming of renal tubular epithelial cells and mitigates diabetic renal fibrosis. (Blue arrows denote process flows, red upward arrows indicate promoting effects, and red downward arrows signify inhibiting effects.). |
Welfare of the Laboratory Animals
Animal use protocols conform to the Guide for the Care and Use of Laboratory Animals published by the US National Institutes of Health (the Eighth Edition, National Research Council 2011) and have been approved by the Animal Ethics Committee of Renmin Hospital of Wuhan University (No.20211203).
Ethics Approval and Consent to Participate
All animal experiments and procedures were approved by the Animal Ethics Committee of Renmin Hospital of Wuhan University (No.20211203), and carried out in strict accordance with the guidelines for the care and use of experimental animals.
Consent for Publication
The authors disclose no conflict of interest. All authors revised and approved the manuscript.
Funding
This work was sponsored by National Natural Science Foundation of China (82100866) Natural Science Foundation of Hubei Province (2025AFD826) to Tuohua Mao and Natural Science Foundation of Hubei Province (2022CFC024) to Yan Bao.
Disclosure
The authors report no conflicts of interest in this work.
References
1. Forbes JM, Thorburn DR. Mitochondrial dysfunction in diabetic kidney disease. Nat Rev Nephrol. 2018;14(5):291–312. doi:10.1038/nrneph.2018.9
2. de Vries AP, Ruggenenti P, Ruan XZ, et al. Fatty kidney: emerging role of ectopic lipid in obesity-related renal disease. Lancet Diabetes Endocrinol. 2014;2(5):417–426. doi:10.1016/S2213-8587(14)70065-8
3. Yang W, Luo Y, Yang S, et al. Ectopic lipid accumulation: potential role in tubular injury and inflammation in diabetic kidney disease. Clin Sci. 2018;132(22):2407–2422. doi:10.1042/CS20180702
4. Su K, Yi B, Yao BQ, et al. Liraglutide attenuates renal tubular ectopic lipid deposition in rats with diabetic nephropathy by inhibiting lipid synthesis and promoting lipolysis. Pharmacol Res. 2020;156. doi:10.1016/j.phrs.2020.104778
5. Huang TS, Wu T, Wu YD, et al. Long-term statins administration exacerbates diabetic nephropathy via ectopic fat deposition in diabetic mice. Nat Commun. 2023;14(1):390. doi:10.1038/s41467-023-35944-z
6. Kang HM, Ahn SH, Choi P, et al. Defective fatty acid oxidation in renal tubular epithelial cells has a key role in kidney fibrosis development. Nature Med. 2015;21(1):37–46. doi:10.1038/nm.3762
7. Lu YA, Liao CT, Raybould R, et al. Single-nucleus RNA sequencing identifies new classes of proximal tubular epithelial cells in kidney fibrosis. J Am Soc Nephrol. 2021;32(10):2501–2516. doi:10.1681/ASN.2020081143
8. Chung KW, Dhillon P, Huang S, et al. Mitochondrial damage and activation of the sting pathway lead to renal inflammation and fibrosis. Cell Metab. 2019;30(4):784–799.e785. doi:10.1016/j.cmet.2019.08.003
9. Lovisa S, Fletcher-Sananikone E, Sugimoto H, et al. Endothelial-to-mesenchymal transition compromises vascular integrity to induce Myc-mediated metabolic reprogramming in kidney fibrosis. Sci Signaling. 2020;13(635). doi:10.1126/scisignal.aaz2597
10. Li Z, Lu S, Li X. The role of metabolic reprogramming in tubular epithelial cells during the progression of acute kidney injury. Cel Mol Life Sci. 2021;78(15):5731–5741. doi:10.1007/s00018-021-03892-w
11. Tombran-Tink J, Chader GG, Johnson LV. PEDF: a pigment epithelium-derived factor with potent neuronal differentiative activity. Exp Eye Res. 1991;53(3):411–414. doi:10.1016/0014-4835(91)90248-D
12. He X, Cheng R, Park K, et al. Pigment epithelium-derived factor, a noninhibitory serine protease inhibitor, is renoprotective by inhibiting the Wnt pathway. Kidney Int. 2017;91(3):642–657. doi:10.1016/j.kint.2016.09.036
13. Wang JJ, Zhang SX, Mott R, et al. Salutary effect of pigment epithelium-derived factor in diabetic nephropathy: evidence for antifibrogenic activities. Diabetes. 2006;55(6):1678–1685. doi:10.2337/db05-1448
14. Wang JJ, Zhang SX, Lu K, et al. Decreased expression of pigment epithelium-derived factor is involved in the pathogenesis of diabetic nephropathy. Diabetes. 2005;54(1):243–250. doi:10.2337/diabetes.54.1.243
15. Zhang H, Sun T, Jiang X, et al. PEDF and PEDF-derived peptide 44mer stimulate cardiac triglyceride degradation via ATGL. J Transl Med. 2015;13(68):68. doi:10.1186/s12967-015-0432-1
16. Haemmerle G, Moustafa T, Woelkart G, et al. ATGL-mediated fat catabolism regulates cardiac mitochondrial function via PPAR-α and PGC-1. Nature Med. 2011;17(9):1076–1085. doi:10.1038/nm.2439
17. Khan SA, Sathyanarayan A, Mashek MT, Ong KT, Wollaston-Hayden EE, Mashek DG. ATGL-catalyzed lipolysis regulates SIRT1 to control PGC-1α/PPAR-α signaling. Diabetes. 2015;64(2):418–426. doi:10.2337/db14-0325
18. Zhou L, Yu M, Arshad M, et al. Coordination among lipid droplets, peroxisomes, and mitochondria regulates energy expenditure through the CIDE-ATGL-PPARα pathway in adipocytes. Diabetes. 2018;67(10):1935–1948. doi:10.2337/db17-1452
19. Mao T, Huang H, Wang M, Li J. The expressions of pigment epithelium-derived factor and adipose triglyceride lipase in human kidney and correlation with renal lipid accumulation. Int J Clin Exp Med. 2019;12(2):1666–1673.
20. Huang B, Miao H, Yuan Y, et al. PEDF decreases cardiomyocyte edema during oxygen‑glucose deprivation and recovery via inhibiting lactate accumulation and expression of AQP1. Int J Mol Med. 2019;43(5):1979–1990. doi:10.3892/ijmm.2019.4132
21. Lin Q, Li S, Jiang N, et al. Inhibiting NLRP3 inflammasome attenuates apoptosis in contrast-induced acute kidney injury through the upregulation of HIF1A and BNIP3-mediated mitophagy. Autophagy. 2021;17(10):2975–2990. doi:10.1080/15548627.2020.1848971
22. Azushima K, Gurley SB, Coffman TM. Modelling diabetic nephropathy in mice. Nat Rev Nephrol. 2018;14(1):48–56. doi:10.1038/nrneph.2017.142
23. Wang D, Tai PWL, Gao G. Adeno-associated virus vector as a platform for gene therapy delivery. Nat Rev Drug Discov. 2019;18(5):358–378. doi:10.1038/s41573-019-0012-9
24. Ding WY, Kuzmuk V, Hunter S, et al. Adeno-associated virus gene therapy prevents progression of kidney disease in genetic models of nephrotic syndrome. Sci Trans Med. 2023;15(708):eabc8226. doi:10.1126/scitranslmed.abc8226
25. Zincarelli C, Soltys S, Rengo G, Rabinowitz JE. Analysis of AAV serotypes 1-9 mediated gene expression and tropism in mice after systemic injection. Mol ther. 2008;16(6):1073–1080. doi:10.1038/mt.2008.76
26. Herman-Edelstein M, Scherzer P, Tobar A, Levi M, Gafter U. Altered renal lipid metabolism and renal lipid accumulation in human diabetic nephropathy. J Lipid Res. 2014;55(3):561–572. doi:10.1194/jlr.P040501
27. Chen X, Han Y, Gao P, et al. Disulfide-bond A oxidoreductase-like protein protects against ectopic fat deposition and lipid-related kidney damage in diabetic nephropathy. Kidney Int. 2019;95(4):880–895. doi:10.1016/j.kint.2018.10.038
28. Shi HB, Yu K, Luo J, et al. Adipocyte differentiation-related protein promotes lipid accumulation in goat mammary epithelial cells. J Dairy Sci. 2015;98(10):6954–6964. doi:10.3168/jds.2015-9452
29. Bartz R, Zehmer JK, Zhu M, et al. Dynamic activity of lipid droplets: protein phosphorylation and GTP-mediated protein translocation. J Proteome Res. 2007;6(8):3256–3265. doi:10.1021/pr070158j
30. Mishra R, Emancipator SN, Miller C, Kern T, Simonson MS. Adipose differentiation-related protein and regulators of lipid homeostasis identified by gene expression profiling in the murine db/db diabetic kidney. Am J Physiol Renal Physiol. 2004;286(5):F913–921. doi:10.1152/ajprenal.00323.2003
31. Henderson NC, Rieder F, Wynn TA. Fibrosis: from mechanisms to medicines. Nature. 2020;587(7835):555–566. doi:10.1038/s41586-020-2938-9
32. Schwörer S, Vardhana SA, Thompson CB. Cancer metabolism drives a stromal regenerative response. Cell Metab. 2019;29(3):576–591. doi:10.1016/j.cmet.2019.01.015
33. Shen Y, Jiang L, Wen P, et al. Tubule-derived lactate is required for fibroblast activation in acute kidney injury. Am J Physiol Renal Physiol. 2020;318(3):F689–f701. doi:10.1152/ajprenal.00229.2019
34. Becerra SP, Notario V. The effects of PEDF on cancer biology: mechanisms of action and therapeutic potential. Nat Rev Cancer. 2013;13(4):258–271. doi:10.1038/nrc3484
35. Lee JW, Ko J, Ju C, Eltzschig HK. Hypoxia signaling in human diseases and therapeutic targets. Exp Mol Med. 2019;51(6):1–13. doi:10.1038/s12276-019-0299-y
36. Mao T, Gao L, Li H, Li J. Pigment epithelium-derived factor inhibits high glucose induced oxidative stress and fibrosis of cultured human glomerular mesangial cells. Saudi Med J. 2011;32(8):769–777.
37. Mao T, Chen H, Hong L, Li J. Pigment epithelium-derived factor inhibits high glucose-induced JAK/STAT signalling pathway activation in human glomerular mesangial cells. Saudi Med J. 2013;34(8):793–800.
38. Gao L, Hu Y, Li J. Pigment epithelium‑derived factor protects human glomerular mesangial cells from diabetes via NOXO1‑iNOS suppression. Mol Med Rep. 2017;16(5):7855–7863. doi:10.3892/mmr.2017.7563
 © 2025 The Author(s). This work is published and licensed by Dove Medical Press Limited. The
full terms of this license are available at https://www.dovepress.com/terms
and incorporate the Creative Commons Attribution
- Non Commercial (unported, 4.0) License.
By accessing the work you hereby accept the Terms. Non-commercial uses of the work are permitted
without any further permission from Dove Medical Press Limited, provided the work is properly
attributed. For permission for commercial use of this work, please see paragraphs 4.2 and 5 of our Terms.
© 2025 The Author(s). This work is published and licensed by Dove Medical Press Limited. The
full terms of this license are available at https://www.dovepress.com/terms
and incorporate the Creative Commons Attribution
- Non Commercial (unported, 4.0) License.
By accessing the work you hereby accept the Terms. Non-commercial uses of the work are permitted
without any further permission from Dove Medical Press Limited, provided the work is properly
attributed. For permission for commercial use of this work, please see paragraphs 4.2 and 5 of our Terms.