
Back to Journals » International Journal of General Medicine » Volume 19
PCAT1 Supports Partial AR-V7 Function and Promotes Enzalutamide Resistance in Prostate Cancer
Authors Li T, Li R, Hao J, Yu J  , Niu Y
Received 16 April 2026
Accepted for publication 30 June 2026
Published 10 July 2026 Volume 2026:19 615525
DOI https://doi.org/10.2147/IJGM.S615525
Checked for plagiarism Yes
Review by Single anonymous peer review
Peer reviewer comments 3
Editor who approved publication: Dr Ching-Hsien Chen
Taipeng Li, Ruitao Li, Jiaru Hao, Jianpeng Yu, Yuanjie Niu
Department of Urology, Tianjin Institute of Urology, The Second Hospital of Tianjin Medical University, Tianjin, People’s Republic of China
*These authors contributed equally
Correspondence: Jianpeng Yu, Email [email protected] Yuanjie Niu, Email [email protected]
Background: Enzalutamide resistance (Enz-R) remains a major clinical challenge in advanced prostate cancer (PCa). Here, we identified resistance-associated long non-coding RNA (lncRNA) PCAT1 and investigated its functional relevance in Enz-R PCa.
Methods: Public transcriptomic datasets, bioinformatic analyses, RNA immunoprecipitation (RIP), ChIP-qPCR, and in vitro and in vivo functional assays were used to evaluate the expression, function, and potential mechanism of PCAT1 in Enz-R PCa models.
Results: PCAT1 was upregulated in Enz-R PCa models and was associated with adverse clinical features. PCAT1 knockdown inhibited the growth of C4-2 Enz-R cells and 22Rv1 cells and suppressed tumor growth in vivo. Mechanistically, PCAT1 was associated with AR/AR-V7 and supported selected AR-V7-associated downstream outputs without markedly altering AR-V7 protein expression. AR-V7 ChIP-qPCR further suggested that PCAT1 knockdown reduced AR-V7 enrichment at selected regulatory regions, including the KLK3 and PMEPA1 enhancers. In addition, high-dose androgen treatment reduced PCAT1 and AR-V7 expression in our experimental model.
Conclusion: PCAT1 contributes to Enz-R PCa growth and may support selected AR-V7-associated transcriptional outputs. PCAT1 may represent a potential therapeutic vulnerability, and the relationship between high-dose androgen treatment, PCAT1 suppression, and AR-V7 signaling warrants further investigation.
Keywords: PCAT1, prostate cancer, enzalutamide resistance, AR-V7, bipolar therapy
Introduction
In recent years, prostate cancer has emerged as a common malignant tumor in the male urinary system, with an increasing incidence rate and mortality that highlights its significant burden on public health.1 The current treatment landscape for prostate cancer primarily revolves around targeting the androgen receptor (AR) pathway, given the crucial role of AR in the progression of the disease. Enzalutamide, a nonsteroidal AR antagonist, has been a cornerstone in advanced prostate cancer.2 However, during disease progression, prostate cancer cells can sustain AR signaling despite AR-targeted therapy through multiple genetic and transcriptomic alterations, including AR amplification, AR point mutations, enhancer activation, and the emergence of constitutively active AR splice variants such as AR-V7, thereby allowing AR downstream genes to remain aberrantly activated.3 A significant number of castration-resistant prostate cancer (CRPC) cells express AR-V7, a constitutively activated isoform lacking the ligand-binding domain while retaining the nuclear localization signal and DNA-binding domain of AR.4 Detection of AR-V7 in circulating tumor cells from patients with CRPC predicts resistance to enzalutamide and abiraterone.5 Although AR-V7 could be a biomarker and functionally promotes CRPC progression, its targeting is very challenging.
Non-coding RNAs have attracted attention as potential regulators in various biological processes, including cancer progression.6 One of them, PCAT1, has been implicated in the development and progression of PCa.7 Some studies have identified PCAT1 as a potential biomarker and therapeutic target, with its expression levels correlating with disease severity, such as esophageal squamous cell carcinoma.8,9 Our previous study reported that PCAT1 regulates the PHLPP/FKBP51/IKKα complex and activates AKT and NF-κB signaling.10 In the context of prostate cancer, PCAT1 has been shown to interact with key pathways, including the AR pathway, and its dysregulation has been linked to treatment resistance.11 However, the function of PCAT1 in enzalutamide resistance remains unclear.
In this study, we investigated whether PCAT1 contributes to enzalutamide-resistant PCa growth and whether it is associated with selected AR-V7-related transcriptional outputs. We also explored the effect of high-dose androgen treatment on PCAT1 and AR-V7 expression, which may provide insight into BAT-related biological effects in enzalutamide-resistant PCa.
Materials and Methods
Analysis of Public Datasets
RNA-sequencing, copy number variation, and clinical data were retrieved from the GEO database (GSE285929,12 GSE229805,13 and GSE22828314 datasets) and the cBioPortal15 (SMMU,16 TCGA/GDC,17 SU2C/PCF Dream Team18 and Fred Hutchinson CRC19). Gene differential analysis was conducted using the DESeq package. Single-cell data sourced from GSE210358. The AR-V7 score was evaluated using the gene set summarized by Sugiura, Masahiro et al.20
Cell Lines and Cell Culture
The C4-2 and 22Rv1 cell lines were obtained from the American Type Culture Collection (ATCC, Manassas, VA, USA). C4-2 Enz-R cell line was cultured as in our previous study.10,12 Briefly, parental C4-2 cells were continuously exposed to stepwise increasing concentrations of enzalutamide (MedChemExpress, HY-70002) from 10 μM to 40 μM, with the concentration increased approximately every 20 days over a period of 3 months. After resistance was established, C4-2 Enz-R cells were maintained in medium containing 10 μM enzalutamide. Enzalutamide resistance was confirmed by the ability of C4-2 Enz-R cells to maintain growth under enzalutamide treatment compared with parental C4-2 cells, together with increased AR-V7 expression and altered AR downstream signaling.
All cell lines were cultured in RPMI-1640 medium (Gibco, 11875093, Thermo Fisher Scientific, Waltham, MA, USA) with 10% fetal bovine serum (Gibco), 100 μg/mL streptomycin, and 100 U/mL penicillin (Gibco). Cells were incubated at 37°C with 5% CO2. For functional assays where indicated, cells were treated with 20 μM enzalutamide. C4-2 Enz-R cells at 50–70% confluency were transduced with lentivirus (GENECHEM, Shanghai, China) against PCAT1 and a negative control. 22Rv1 cells were transfected with siRNA targeting PCAT1 or a scrambled negative control using Lipofectamine 3000 (Thermo Fisher Scientific) according to the manufacturer’s instructions; the target sequences of siPCAT1 were 5’-ATACATAAGACCATGGAAAT-3’, and knockdown efficiency was confirmed by qRT-PCR 48 h after transfection.
Quantitative RT-PCR Analysis
Trizol reagent (Invitrogen) was used to obtain total RNA from cells, and the Reverse Transcription System (Roche) was used for the cDNA synthesis. PCR was then conducted using SYBR Green PCR Master Mix (Roche) and Applied Biosystems 7900 Real Time PCR System (Thermo Fisher Scientific). GAPDH and β-actin were used as internal controls. Primer sequences were as follows: PCAT1, forward 5’-TGAGAAGAGAAATCTATTGGAACC-3’ and reverse 5’-GGTTTGTCTCCGCTGCTTTA-3’; AR-V7, forward 5’-CACCATGGAAGTGCAGTTAGGGCTGGGAAGGGTCTACCCT-3’ and reverse 5’-TCAGGGTCTGGTCATTTTGAGATGCTTGCAATTGCC-3’; MYC, forward 5’- CAGCGACTCTGAGGAGGAACAA-3’ and reverse 5’- CTCCAGCAGAAGGTGATCCAGA-3’; GAPDH, forward 5’-GGAGCGAGATCCCTCCAAAAT-3’ and reverse 5’-GGCTGTTGTCATACTTCTCATGG-3’; β-actin, forward 5’-GGGAAATCGTGCGTGACATTAAG-3’ and reverse 5’-TGTGTTGGCGTACAGGTCTTTG-3’.
Cell Proliferation Assay and Colony Assays
Cells were seeded (1000 cells per well) into a 96-well plate and cultured for 12 h. Then, they were detected at different times (0, 1, 3, 5, and 7 days). 20 μL CCK8 (Beyotime) was added to each well and cultured at 37◦C for 1 h. Absorbance at 450 nm was assessed. About 1000 cells were inoculated into a six-well plate. After 2 weeks, the six-well plate was stained with 0.5% crystal violet.
Animal Studies
6-week-old male nude mice were purchased from Beijing HFK Bioscience Co. Ltd. C4-2 Enz-R cells transduced with shPCAT1 or shSCR were used for subcutaneous tumor growth experiments. All mice took enzalutamide (orally, 10 mg/kg body weight) 5 days per week. Tumor volume was calculated using the following formula: V = 1/2 × length × width^2. The injections were performed under brief isoflurane anesthesia on a shaved ~1 cm2 region of the flank. All mice were sacrificed by cervical dislocation under deep anesthesia according to the American Veterinary Medical Association (AVMA) Guidelines.
Immunohistochemistry (IHC)
First, the 4 μm thick tumor tissues on the charged glass slides underwent the deparaffinization and rehydration. Antigen retrieval was performed with 10 mM citrate buffer (pH 7.5), and the sections were boiled in a microwave oven at 750 W for 30 minutes. Next, 3% hydrogen peroxide was temporarily added to block endogenous peroxidase activity. All sections were incubated with Ki67 antibodies (Abcam, ab16667, 1:200) at 4°C overnight and then incubated with polymer-conjugated horseradish peroxidase for 1 h at room temperature. Eventually, DAB staining was used for the color detection of Ki67.
RNA-Protein Interaction Prediction
The interaction propensity between PCAT1 and AR-V7 or full-length AR (AR-FL) was predicted using the catRAPID Global Score algorithm.21 The PCAT1 transcript sequence and the protein sequences of AR-V7 or AR-FL were submitted in FASTA format, and the prediction was performed using the default parameters. The Global Score was used to estimate the overall interaction propensity of each RNA-protein pair. The predicted scores were used as supportive computational evidence.
Western Blot Analysis
Total protein was extracted from different cell lines using the RIPA reagent (Solarbio), and its concentration was measured with the BCA protein assay kit (Solarbio). To observe the target proteins, SDS-PAGE (Solarbio) was used to separate the total protein samples. These proteins were then transferred to the PVDF membrane (Roche, Basel, Switzerland) and incubated with antibodies. Proteintech (Wuhan, China) provided us with β-tubulin (1D4A4, 1:20,000), GAPDH (1E6D9, 1:50,000), and KLK3 (241263F8, 1:5000) antibodies. AR antibody is from Abcam (ab133273, 1:20,000).
ChIP-qPCR Assay
ChIP-qPCR was performed using a Thermo Fisher Scientific ChIP kit according to the manufacturer’s instructions. Briefly, chromatin from the indicated cells was cross-linked, fragmented, and immunoprecipitated with an anti-AR-V7 antibody (E3O8L, Cell Signaling Technology) or normal IgG control. The recovered DNA was analyzed by qPCR, and enrichment at the indicated regulatory regions was normalized to the corresponding input DNA and presented as percentage of input.
Primer sequences were as follows: KLK3 enhancer, forward 5’-TGAGAAACCTGAGATTAGGA-3’ and reverse 5’-ATCTCTCTCAGATCCAGGCT-3’; PMEPA1 enhancer, forward 5’-AAACAGAAGGTGGGAGACAAA-3’ and reverse 5’-TACCCTGGCTAAAGCAGTTTC-3’.
RIP-PCR Assay
C4-2 Enz-R cells transduced with shPCAT1 or shSCR were used for RIP assay as in our previous paper.10 All operation procedures of the RIP experiment were carried out in accordance with the kit instructions. 2×Taq PCR Master Mix (Solarbio) was used for the PCR reaction. The PCR products were run on 2% agarose gels and imaged under ultraviolet light.
Statistical Analysis
All statistical analyses were performed using GraphPad Prism software, version 10.0 (GraphPad Software, La Jolla, CA, USA). Data are presented as mean ± SD unless otherwise indicated. Comparisons between two groups were performed using two-tailed unpaired Student’s t-tests. For experiments involving multiple time points, including CCK-8 assays and tumor growth curves, two-way ANOVA was used unless otherwise indicated. For comparisons among more than two groups, one-way ANOVA was used where appropriate. Chi-square tests were used for categorical variables. Kaplan–Meier survival curves were compared using the Log rank test. A P value < 0.05 was considered statistically significant. ns, not significant; *P < 0.05; **P < 0.01; ***P < 0.001.
Results
PCAT1 is Associated with a Poor Prognosis in Prostate Cancer
In order to screen the genes that play an important role in enzalutamide-resistant PCa, we analyzed high-throughput sequencing data from GSE285929 and GSE229805 (Figure 1A). We combined the above datasets and identified 17 common up-regulated and 22 common down-regulated genes (Figure 1B) in the enzalutamide-treated PCa compared with the enzalutamide-untreated PCa. Among the 17 up-regulated genes associated with enzalutamide resistance, 7 genes that were down-regulated in TCGA PRAD tumors were therefore deprioritized, and the remaining candidate targets are shown in Figure 1C.
 |
Figure 1 PCAT1 as a candidate therapeutic vulnerability in enzalutamide-resistant PCa. (A) Volcano plots showing changes in enzalutamide resistance-related genes in C4-2 cells (GSE285929) and 22Rv1 PCa cells (GSE229805). The adjusted P value threshold was set to 0.001, and the log2 fold-change threshold was set to 0.8. (B) Venn diagram showing the intersection of up-regulated genes (n = 17) and down-regulated genes (n = 22). (C) Heatmap showing candidate genes associated with enzalutamide-resistant PCa. Count values from the GEO datasets were normalized by z-score. (D) Proportion of PCAT1 copy number variations (CNVs) in the SMMU, TCGA, SU2C, and FHCRC datasets. Data were retrieved from cBioPortal. (E) PCAT1 expression in groups with or without PCAT1 copy number increase in the SMMU and SU2C datasets. Amplification and gain were considered as PCAT1 copy number increase, whereas samples with deep deletion, shallow deletion, or diploid PCAT1 status were considered as lacking PCAT1 copy number increase. P values were determined by two-tailed unpaired t-tests. (F) Kaplan–Meier curve showing overall survival in PCa patients stratified by PCAT1 copy number status (P = 0.046). P value was determined by Log rank test. Clinical data were retrieved from the SU2C dataset. Data are presented as mean ± SD where applicable. ns, not significant; * P < 0.05. |
Interestingly, PCAT1 was highlighted for its abnormally increased copy number variation (CNV) in both primary (SMMU and TCGA cohorts) and metastatic (SU2C and FHCRC cohorts) tumors (Figure 1D). We have reported that in TCGA, the PCAT1 gene amplification (AMP) was associated with poor prognosis in patients.10 Here, we found that the AMP and Gain variations of PCAT1 were related to the higher PCAT1 expression (Figure 1E) and poor prognosis (Figure 1F). In the absence of CNV disparities (Figure 2A), differential PCAT1 expression was observed among enzalutamide-treated patients in SU2C (Figure 2B). Thus, we considered PCAT1 as a candidate resistance-associated vulnerability in enzalutamide-resistant PCa.
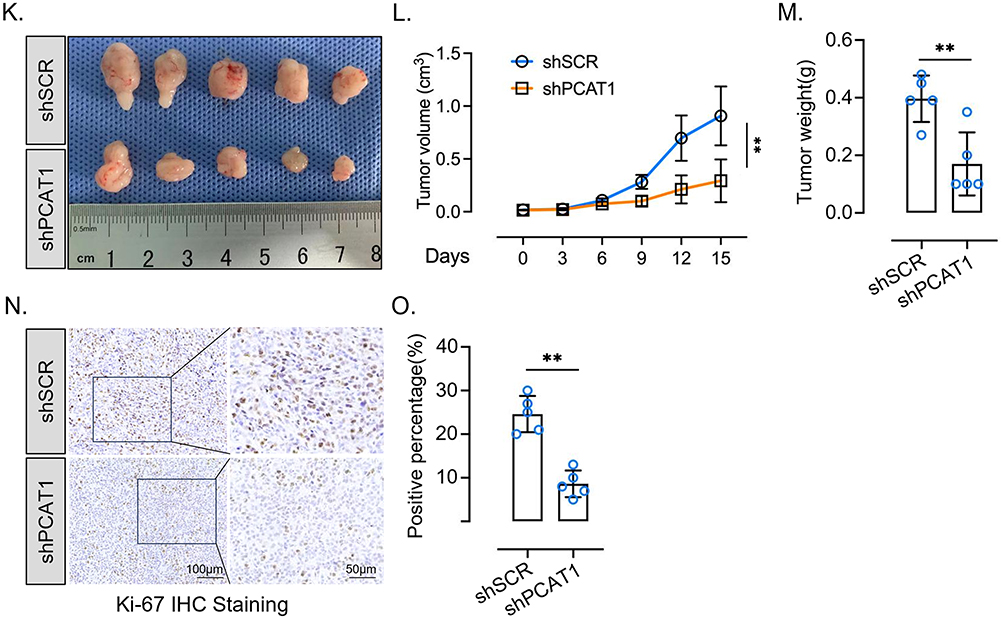
Figure 2 PCAT1 is upregulated in enzalutamide-resistant PCa and promotes tumor growth. (A) Copy number alterations of PCAT1 in enzalutamide-untreated and enzalutamide-treated samples. Data were retrieved from the SU2C dataset through cBioPortal. P value was determined by chi-square test. (B) Normalized FPKM values of PCAT1 in different groups from the SU2C dataset. (C) RT-qPCR analysis of PCAT1 expression in C4-2 and C4-2 Enz-R cells (n=3, technical replicates). (D) Normalized FPKM values of PCAT1 in prostate cancer patient-derived xenograft (PDX) models. Data were retrieved from GSE228283. (E) RT-qPCR analysis of PCAT1 expression in C4-2 Enz-R cells transfected with shSCR or shPCAT1 (n = 3, technical replicates). (F) CCK-8 assay assessing the proliferation of C4-2 Enz-R cells transfected with shSCR or shPCAT1 and cultured in medium containing 20 μM enzalutamide (n = 6, biological replicates). (G) Colony formation assay assessing the clonogenic potential of C4-2 Enz-R cells transfected with shSCR or shPCAT1. Representative whole-well images are shown. (H) RT-qPCR analysis of PCAT1 expression in 22Rv1 cells transfected with siSCR or siPCAT1 (n = 3, technical replicates). (I) CCK-8 assay assessing the proliferation of 22Rv1 cells transfected with siSCR or siPCAT1 and cultured in medium containing 20 μM enzalutamide (n = 6, biological replicates). (J) Colony formation assay assessing the clonogenic potential of 22Rv1 cells transfected with siSCR or siPCAT1. Representative whole-well images are shown. (K–M) In vivo xenograft experiments using C4-2 Enz-R cells transfected with shSCR or shPCAT1 (n = 5 mice per group). Representative tumor images, tumor volume curves, and tumor weights are shown. (N and O) Ki-67 expression in xenograft tumors from the indicated groups, as assessed by immunohistochemistry. Representative images and quantification from five shSCR and five shPCAT1 tumor specimens are shown. Scale bars are indicated in the images. Data are presented as mean ± SD. For comparisons between two groups, P values were determined by two-tailed unpaired t-tests unless otherwise indicated. For tumor growth curves and CCK-8 assays with multiple time points, P values were determined by two-way ANOVA. ns, not significant; *P < 0.05; **P < 0.01; ***P < 0.001. Figure 2 Continued.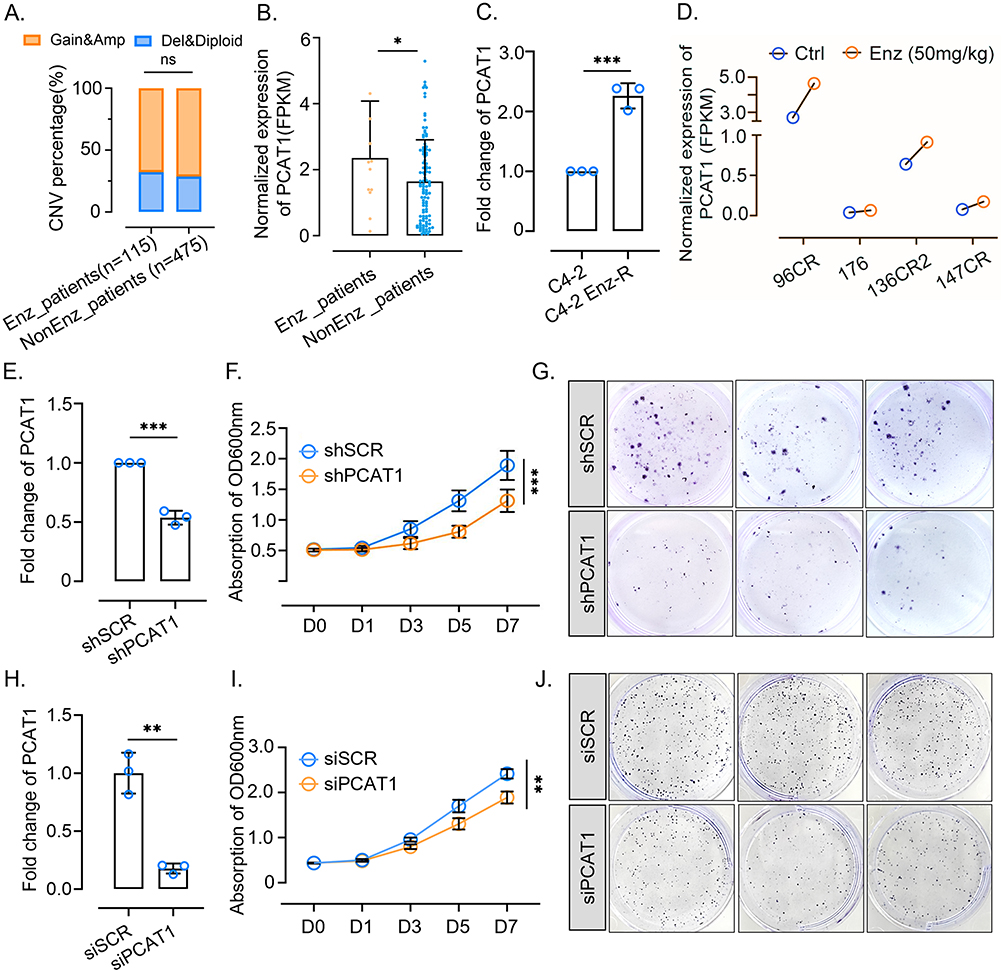
PCAT1 is Upregulated in Enzalutamide-Resistant PCa and Promotes Tumor Growth
C4-2 Enz-R cells were induced by maintaining the growth of C4-2 cells at an increasing enzalutamide concentration, as our previous study reported.12 Our previous study reported that PCAT1 promotes CRPC progression by activating AKT and NF-κB signaling in CRPC.10 Then, we confirmed that PCAT1 was upregulated during the development of enzalutamide resistance (Figure 2C), and a similar trend has also been observed in RNA-seq data of PCa patient-derived xenograft (PDX) models retrieved from the Mark et al study (Figure 2D) (GSE228283).14
To explore the function of PCAT1 in enzalutamide-resistant tumor growth, we silenced PCAT1 (Figure 2E) and observed the suppression of C4-2 Enz-R cells growth (Figure 2F and G). To further validate the functional relevance of PCAT1 in an additional enzalutamide-insensitive prostate cancer model, we performed siRNA-mediated PCAT1 knockdown in 22Rv1 cells. PCAT1 knockdown in 22Rv1 cells (Figure 2H) significantly inhibited cell proliferation and clonogenic growth (Figure 2I and J). These results support the growth-promoting role of PCAT1 in both enzalutamide-resistant C4-2 Enz-R cells and 22Rv1 cells.
This growth-promoting effect was further validated using C4-2 Enz-R model in in vivo experiments (Figure 2K–M). Ki67 staining demonstrated the suppressed tumor proliferation by PCAT1 knockdown (Figure 2N and O). Therefore, these results suggest that PCAT1 promotes enzalutamide-resistant tumor growth.
PCAT1/AR-V7 Interaction Contributes to the Expression of Selected AR/AR-V7-Associated Downstream Genes
Our previous study and some reports suggested that AR-V7 could regulate part of canonical AR signaling.22–25 Interestingly, we found AR downstream genes KLK3 and FASN highly expressed in PCAT1-high CRPC samples (using the median expression of PCAT1 as a cutoff), while AR-V7 expression level revealed no difference between the PCAT1-high and -low groups (Figure 3A). Pearson correlation analysis also confirmed the weak correlation between PCAT1 and the AR and NEPC signaling pathways (Figure 3B and C). In addition, we analyzed CRPC single-cell samples of GSE210358. Indeed, several cell subpopulations highly express PCAT1 (Figure 3D). Compared with PCAT1-negative cells, PCAT1-positive cells showed a significant increase in AR-V7 scores (Figure 3E), confirming our hypothesis that PCAT1 contributes to the downstream regulation of AR-V7.
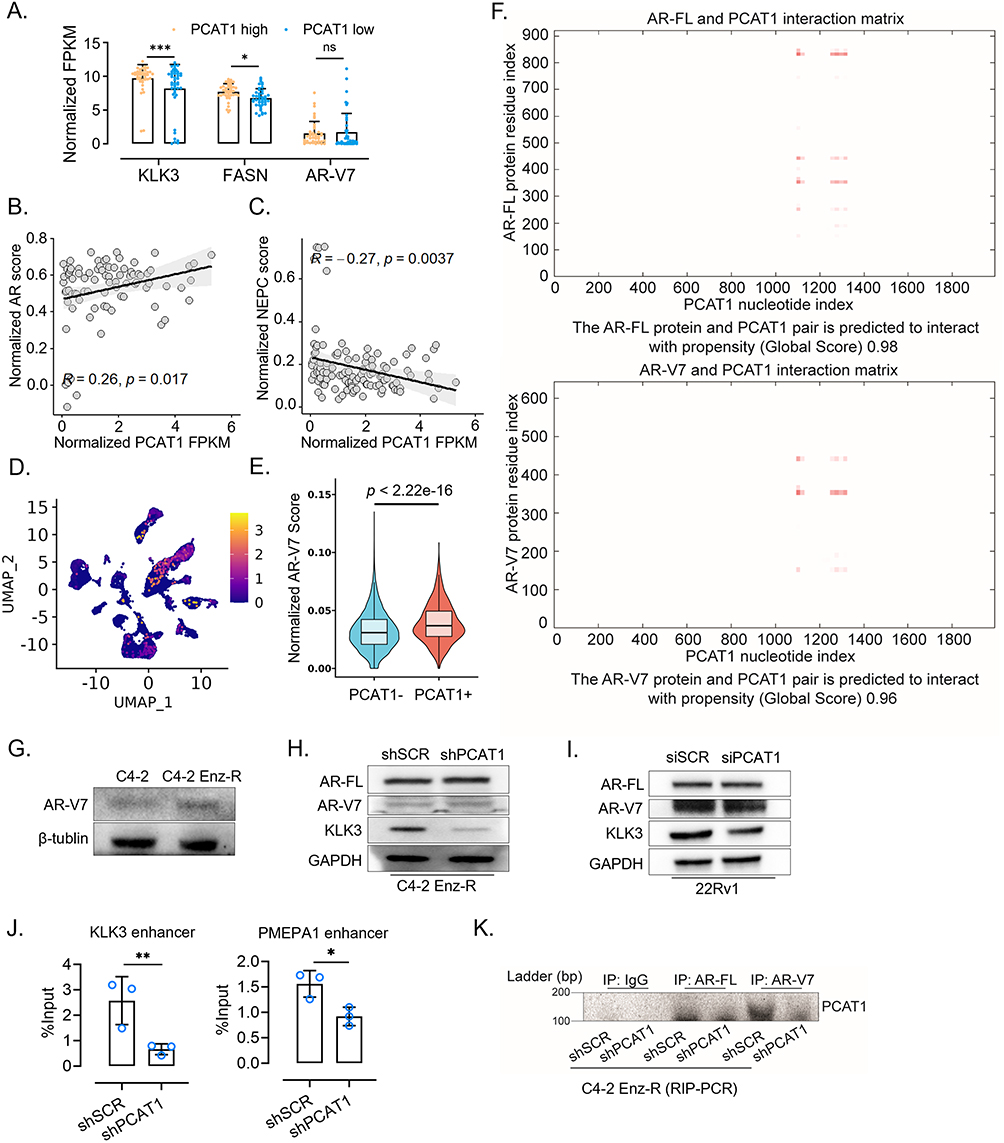 |
Figure 3 PCAT1/AR-V7 interaction contributes to the expression of selected AR/AR-V7-associated downstream genes. (A) Normalized FPKM values of KLK3, FASN, and AR-V7 in PCAT1-high and PCAT1-low groups. Samples were divided into two groups according to the relative FPKM value of PCAT1. Data were retrieved from the SU2C dataset. (B and C) Pearson correlation analysis between normalized PCAT1 FPKM and AR score or NEPC score in the SU2C dataset. P values were determined by Pearson correlation analysis. (D) Expression of PCAT1 in prostate cancer epithelial cells from GSE210358. (E) AR-V7 score in PCAT1-negative and PCAT1-positive epithelial cells from GSE210358. (F) Computational prediction of the interaction propensity between lncRNA PCAT1 and AR-FL or AR-V7 proteins. (G) Western blotting analysis of AR-V7 protein expression in C4-2 and C4-2 Enz-R cells. (H) Western blotting analysis of AR-V7, AR-FL and PSA proteins in C4-2 Enz-R cells transfected with shSCR or shPCAT1. (I) Western blotting analysis of AR-V7, AR-FL and PSA proteins in 22Rv1 cells transfected with siSCR or siPCAT1. (J) AR-V7 ChIP-qPCR analysis of AR-V7 enrichment at selected AR/AR-V7-responsive regulatory regions in C4-2 Enz-R cells transfected with shSCR or shPCAT1. ChIP enrichment was normalized to the corresponding input DNA and presented as percentage of input (n = 3 technical replicates). (K) RIP-PCR assay detecting the association between AR/AR-V7 and PCAT1. AR-FL and AR-V7 proteins were immunoprecipitated from the indicated C4-2 Enz-R cells, followed by PCR detection of PCAT1. Agarose gel electrophoresis images of PCR products are shown. Data are presented as mean ± SD where applicable. P values were determined by two-tailed tests unless otherwise indicated. ns, not significant; *P < 0.05; **P < 0.01; ***P < 0.001. |
Moreover, the catRAPID Global Score algorithm predicted a high interaction propensity between PCAT1 and AR-V7 protein (Global Score = 0.96), which was comparable to that between PCAT1 and full-length AR (AR-FL; Global Score = 0.98), a previously reported PCAT1-binding protein (Figure 3F).21,26 Western blot analysis showed that enzalutamide resistance induced AR-V7 upregulation in C4-2 cells (Figure 3G). However, PCAT1 knockdown did not markedly alter AR-V7 protein expression in either C4-2 Enz-R or 22Rv1 cells, while PSA/KLK3 protein expression was reduced in the PCAT1 knockdown groups (Figure 3H and I). To further determine whether PCAT1 affects AR-V7 chromatin recruitment, we performed AR-V7 ChIP-qPCR in shPCAT1 C4-2 ENZ-R cells. PCAT1 knockdown reduced AR-V7 enrichment at the KLK3 and PMEPA1 enhancer, suggesting that PCAT1 may support selected AR-V7-associated transcriptional outputs by facilitating AR-V7 occupancy at specific regulatory regions (Figure 3J). In addition, RIP-PCR showed that PCAT1 knockdown reduced the enrichment of PCAT1 in AR-V7 immunoprecipitates, further supporting the interaction between PCAT1 and AR-V7 (Figure 3K).
High-Dose Androgen Treatment Suppresses PCAT1 and AR-V7 Expression in Enzalutamide-Resistant PCa Cells
With clinical benefit and tumor regression for 20–30% of patients with CRPC, BAT is characterized by rapid cycling between supraphysiological and castrate testosterone levels. To model the supraphysiological androgen phase in vitro, we treated C4-2 Enz-R cells with high-dose DHT.27 In our generated C4-2 Enz-R model, supraphysiological androgen (SPA) revealed dramatically suppressive effects on tumor cell growth (Figure 4A). After DHT withdrawal, cells did not show accelerated growth as androgen levels gradually decreased (Figure 4A and B). During high-dose DHT treatment, the expression levels of AR-V7, MYC, and PCAT1 were reduced. After transient recovery from SPA for 3 days, no significant rebound of PCAT1 expression was observed (Figure 4C).
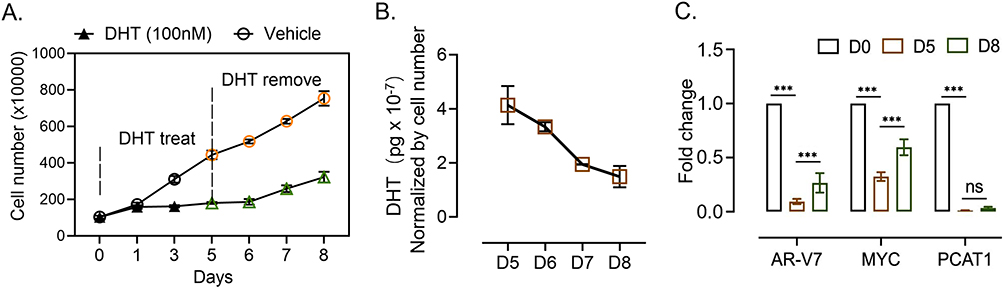 |
Figure 4 High-dose androgen treatment suppresses PCAT1 and AR-V7 expression in PCa cells. (A) CCK-8 assay assessing the proliferation of C4-2 Enz-R cells transfected with shSCR or shPCAT1. Cells were initially cultured in medium containing 100 nM DHT, which was withdrawn on day 5 (n = 3, biological replicates). (B) DHT concentration in the culture medium was measured at the indicated time points using ELISA (n = 3, biological replicates). (C) RT-qPCR analysis of AR-V7, MYC, and PCAT1 expression in C4-2 Enz-R cells at the indicated time points (n = 3, technical replicates). Data are presented as mean ± SD. For the CCK-8 assay with multiple time points and two treatment groups, P values were determined by two-way ANOVA. For RT-qPCR and ELISA analyses involving multiple time points, P values were determined by one-way ANOVA unless otherwise indicated. ns, not significant; *** P < 0.001. |
Discussion
Previous studies have shown that lncRNA PCAT1 plays a role in drug resistance across multiple cancers. Zhang et al found the PCAT1/c-Myc interaction upregulates SLC7A11 to block ferroptosis promoting docetaxel resistance in prostate cancer.28 Liu et al reported the PCAT1 epigenetically silences PTEN expression through recruiting EZH2, leading to cisplatin resistance in gastric cancer.29 Li et al also reported the PCAT1 induces cisplatin resistance in gastric cancer by suppress miR-128/ZEB1 axis.30 Wang et al determined the relationship of PCAT1 and gefitinib resistance non-small-cell lung cancer.31 Ju et al showed PCAT1 promotes bortezomib resistance in myeloma.32 However, all these previous studies have not investigated the role of PCAT1 in the PCa enzalutamide treatment, which is the main method of CRPC treatment. For the first time, this study confirmed the relationship between PCAT1 and enzalutamide resistance in PCa.
Consistent with previous studies, our results showed that PCAT1 promoted therapy-resistant tumor growth. Mechanistically, our data support a model in which PCAT1 is associated with AR/AR-V7 and may help maintain selected AR-V7-associated downstream outputs in enzalutamide-resistant PCa. However, our findings should not be interpreted as evidence that PCAT1 globally or directly regulates AR-V7 transcriptional activity. AR-V7 expression was not markedly altered after PCAT1 knockdown, whereas KLK3 expression and AR-V7 enrichment at selected regulatory regions, including the KLK3 and PMEPA1 enhancers, were reduced. These results suggest that PCAT1 may influence locus-selective AR-V7 chromatin occupancy or transcriptional output, potentially through AR-V7-associated co-regulatory complexes or chromatin-associated factors.
The observation that high-dose androgen treatment reduced PCAT1 and AR-V7 expression is also of interest, but the underlying mechanism remains to be fully defined. Previous studies have linked androgen-mediated transcriptional repression to AR-dependent cofactor redistribution and MYC suppression. In prostate cancer cells, the PCAT1 region has been linked to a prostate cancer-associated MYC super-enhancer regulatory architecture, and androgen stimulation has been reported to disrupt the interaction between this enhancer region and the MYC promoter, accompanied by reduced H3K27ac and BRD4-associated enhancer activity.11 Therefore, high-dose androgen-mediated suppression of PCAT1 in our model may be related to remodeling of the AR/MYC-associated enhancer landscape rather than simple direct repression at the PCAT1 promoter. However, our current study does not determine whether PCAT1 suppression is mediated by altered AR binding, BRD4/H3K27ac occupancy, MYC-associated enhancer remodeling, or post-transcriptional regulation. Future studies using AR, BRD4, and H3K27ac ChIP-qPCR/ChIP-seq at the PCAT1 locus, enhancer reporter assays, and RNA stability assays will be required to clarify this mechanism.
An important implication of our study is that high-dose androgen-mediated suppression of PCAT1 and AR-V7 may provide a potential mechanistic basis for further exploring BAT in selected enzalutamide-resistant PCa contexts. However, these findings should be considered hypothesis-generating. Additional studies are needed to determine whether PCAT1 suppression is necessary for the response to BAT and whether PCAT1-directed therapeutic strategies, such as optimized antisense oligonucleotides or siRNA delivery systems, can achieve durable antitumor effects in vivo.
In summary, our data suggest that lncRNA PCAT1 contributes to enzalutamide-resistant PCa growth and supports selected AR-V7-associated downstream outputs. PCAT1 knockdown inhibited tumor cell growth in vitro and in vivo and reduced AR-V7 enrichment at selected regulatory regions, most prominently at the KLK3 enhancer. In addition, high-dose androgen treatment suppressed PCAT1 and AR-V7 expression in our experimental model, suggesting a potential link between PCAT1 suppression and BAT-related biological effects. However, the precise mechanisms by which high-dose androgen regulates PCAT1 and whether PCAT1 can be therapeutically targeted in vivo require further investigation.
Ethical Statement
The human transcriptomic and clinical data analyzed in this study were obtained from publicly available databases and contained de-identified information. No new human specimens were collected, and no identifiable private information was accessed. According to Article 32 of the Measures for Ethical Review of Life Science and Medical Research Involving Human Subjects issued on February 18, 2023, research using legally obtained public data or anonymized information may be exempt from ethical review when it does not cause harm to human subjects and does not involve sensitive personal information or commercial interests.
All procedures involving mice were approved by the University Committee on Use and Care of Animals at Tianjin Medical University and the Tianjin Institute of Urology and complied with all regulatory standards (laboratory animal facility license number: SYXK 2019-0004) as our previously described.12 All animal procedures were conducted in accordance with the institutional guidelines for the care and use of laboratory animals and the Laboratory Animal—Guideline for Ethical Review of Animal Welfare (GB/T 35892-2018).
Funding
This research was supported by the Scientific Research Project of Tianjin Education Commission (2021KJ225).
Disclosure
The authors report no conflicts of interest in this work.
References
1. Sekhoacha M, Riet K, Motloung P, Gumenku L, Adegoke A, Mashele S. Prostate cancer review: genetics, diagnosis, treatment options, and alternative approaches. Molecules. 2022;27(17):5730. doi:10.3390/molecules27175730
2. Desai K, McManus JM, Sharifi N. Hormonal therapy for prostate cancer. Endocrine Rev. 2021;42(3):354–11. doi:10.1210/endrev/bnab002
3. Sands M, Adams S, Lee J, et al. The interconnection between androgen receptor and DNA damage response pathways in prostate cancer. Curr Urol. 2025;19(6):376–387. doi:10.1097/CU9.0000000000000300
4. Sun S, Sprenger CC, Vessella RL, et al. Castration resistance in human prostate cancer is conferred by a frequently occurring androgen receptor splice variant. J Clin Invest. 2010;120(8):2715–2730. doi:10.1172/JCI41824
5. Antonarakis ES, Lu C, Wang H, et al. AR-V7 and resistance to enzalutamide and abiraterone in prostate cancer. N Engl J Med. 2014;371(11):1028–1038. doi:10.1056/NEJMoa1315815
6. Derrien T, Johnson R, Bussotti G, et al. The GENCODE v7 catalog of human long noncoding RNAs: analysis of their gene structure, evolution, and expression. Genome Res. 2012;22(9):1775–1789. doi:10.1101/gr.132159.111
7. Prensner JR, Iyer MK, Balbin OA, et al. Transcriptome sequencing across a prostate cancer cohort identifies PCAT-1, an unannotated lincRNA implicated in disease progression. Nat Biotechnol. 2011;29(8):742–749. doi:10.1038/nbt.1914
8. Huang L, Wang Y, Chen J, et al. Long noncoding RNA PCAT1, a novel serum-based biomarker, enhances cell growth by sponging miR-326 in oesophageal squamous cell carcinoma. Cell Death Dis. 2019;10(7). doi:10.1038/s41419-019-1745-4.
9. Huang N, Dai W, Li Y, Sun J, Ma C, Li W. LncRNA PCAT-1 upregulates RAP1A through modulating miR-324-5p and promotes survival in lung cancer. Arch Med Sci. 2020;16(5):1196–1206. doi:10.5114/aoms.2019.84235
10. Shang Z, Yu J, Sun L, et al. LncRNA PCAT1 activates AKT and NF-κB signaling in castration-resistant prostate cancer by regulating the PHLPP/FKBP51/IKKα complex. Nucleic Acids Res. 2019;47(8):4211–4225. doi:10.1093/nar/gkz108
11. Guo H, Wu Y, Nouri M, et al. Androgen receptor and MYC equilibration centralizes on developmental super-enhancer. Nat Commun. 2021;12(1). doi:10.1038/s41467-021-27077-y.
12. Yu J, Gao Y, Zhang M, et al. FMNL2/SRC-mediated androgen receptor translocation into the nucleus promotes enzalutamide resistance of prostate cancer. iScience. 2025;28(4):112205. doi:10.1016/j.isci.2025.112205
13. White RE, Bannister M, Day A, et al. Saracatinib synergizes with enzalutamide to downregulate AR activity in CRPC. Front Oncol. 2023;13:1210487. doi:10.3389/fonc.2023.1210487
14. Labrecque MP, Brown LG, Coleman IM, et al. Targeting the fibroblast growth factor pathway in molecular subtypes of castration-resistant prostate cancer. Prostate. 2023;84(1):100–110. doi:10.1002/pros.24630
15. de Bruijn I, Kundra R, Mastrogiacomo B, et al. Analysis and visualization of longitudinal genomic and clinical data from the AACR project GENIE biopharma collaborative in cBioPortal. Cancer Res. 2023;83(23):3861–3867. doi:10.1158/0008-5472.CAN-23-0816
16. Ren S, Wei GH, Liu D, et al. Whole-genome and transcriptome sequencing of prostate cancer identify new genetic alterations driving disease progression. Eur Urol. 2018;73(3):322–339. doi:10.1016/j.eururo.2017.08.027
17. Abeshouse A, Ahn J, Akbani R, Cancer Genome Atlas Research N. The molecular taxonomy of primary prostate cancer. Cell. 2015;163(4):1011–1025. doi:10.1016/j.cell.2015.10.025
18. Abida W, Cyrta J, Heller G, et al. Genomic correlates of clinical outcome in advanced prostate cancer. Proc Natl Acad Sci U S A. 2019;116(23):11428–11436. doi:10.1073/pnas.1902651116
19. Kumar A, Coleman I, Morrissey C, et al. Substantial interindividual and limited intraindividual genomic diversity among tumors from men with metastatic prostate cancer. Nat Med. 2016;22(4):369–378. doi:10.1038/nm.4053
20. Sugiura M, Sato H, Okabe A, et al. Identification of AR-V7 downstream genes commonly targeted by AR/AR-V7 and specifically targeted by AR-V7 in castration resistant prostate cancer. Transl Oncol. 2021;14(1):100915. doi:10.1016/j.tranon.2020.100915
21. Livi CM, Klus P, Delli Ponti R, Tartaglia GG. catRAPID signature: identification of ribonucleoproteins and RNA-binding regions. Bioinformatics. 2016;32(5):773–775. doi:10.1093/bioinformatics/btv629
22. Krause WC, Shafi AA, Nakka M, Weigel NL. Androgen receptor and its splice variant, AR-V7, differentially regulate FOXA1 sensitive genes in LNCaP prostate cancer cells. Int J Biochem Cell Biol. 2014;54:49–59. doi:10.1016/j.biocel.2014.06.013
23. Cai L, Tsai Y-H, Wang P, et al. ZFX mediates non-canonical oncogenic functions of the androgen receptor splice variant 7 in castrate-resistant prostate cancer. Mol Cell. 2018;72(2):341–54.e6. doi:10.1016/j.molcel.2018.08.029
24. Yu J, Sun L, Hao T, et al. Restoration of FKBP51 protein promotes the progression of castration resistant prostate cancer. Ann translat Med. 2019;7(23):729. doi:10.21037/atm.2019.11.127
25. Roggero CM, Jin L, Cao S, et al. A detailed characterization of stepwise activation of the androgen receptor variant 7 in prostate cancer cells. Oncogene. 2020;40(6):1106–1117. doi:10.1038/s41388-020-01585-5
26. Guo H, Ahmed M, Zhang F, et al. Modulation of long noncoding RNAs by risk SNPs underlying genetic predispositions to prostate cancer. Nature Genet. 2016;48(10):1142–1150. doi:10.1038/ng.3637
27. Kr SLA, Sanin DE, Thompson EA, et al. Androgen receptor activity in prostate cancer dictates efficacy of bipolar androgen therapy through MYC. J Clin Investig. 2022;132(23):1.
28. Jiang X, Guo S, Xu M, et al. TFAP2C-mediated lncRNA PCAT1 inhibits ferroptosis in docetaxel-resistant prostate cancer through c-Myc/miR-25-3p/SLC7A11 signaling. Front Oncol. 2022;12:862015.
29. Li H, Ma X, Yang D, Suo Z, Dai R, Liu C. PCAT-1 contributes to cisplatin resistance in gastric cancer through epigenetically silencing PTEN via recruiting EZH2. J Cell Biochem. 2019;121(2):1353–1361. doi:10.1002/jcb.29370
30. Guo Y, Yue P, Wang Y, Chen G, Li Y. PCAT-1 contributes to cisplatin resistance in gastric cancer through miR-128/ZEB1 axis. Biomed Pharmacother. 2019;118:109255. doi:10.1016/j.biopha.2019.109255
31. Wang S, Liu C, Lei Q, et al. Relationship between long non-coding RNA PCAT-1 expression and gefitinib resistance in non-small-cell lung cancer cells. Respir Res. 2021;22(1). doi:10.1186/s12931-021-01719-7.
32. Shen X, Shen P, Yang Q, et al. Knockdown of long non-coding RNA PCAT-1 inhibits myeloma cell growth and drug resistance via p38 and JNK MAPK pathways. J Cancer. 2019;10(26):6502–6510. doi:10.7150/jca.35098
 © 2026 The Author(s). This work is published and licensed by Dove Medical Press Limited. The
full terms of this license are available at https://www.dovepress.com/terms
and incorporate the Creative Commons Attribution
- Non Commercial (unported, 4.0) License.
By accessing the work you hereby accept the Terms. Non-commercial uses of the work are permitted
without any further permission from Dove Medical Press Limited, provided the work is properly
attributed. For permission for commercial use of this work, please see paragraphs 4.2 and 5 of our Terms.
© 2026 The Author(s). This work is published and licensed by Dove Medical Press Limited. The
full terms of this license are available at https://www.dovepress.com/terms
and incorporate the Creative Commons Attribution
- Non Commercial (unported, 4.0) License.
By accessing the work you hereby accept the Terms. Non-commercial uses of the work are permitted
without any further permission from Dove Medical Press Limited, provided the work is properly
attributed. For permission for commercial use of this work, please see paragraphs 4.2 and 5 of our Terms.