Back to Journals » ClinicoEconomics and Outcomes Research » Volume 13
Patient Flows, Patient Distribution Computations and Medicines Accounting in the Pharmacoeconomic Models Through Procurement Perspective
Authors Yagudina R ![]() , Kulikov A
, Kulikov A ![]() , Serpik V
, Serpik V ![]() , Borodin A
, Borodin A ![]() , Vygodchikova I
, Vygodchikova I ![]()
Received 26 March 2021
Accepted for publication 12 July 2021
Published 23 July 2021 Volume 2021:13 Pages 673—680
DOI https://doi.org/10.2147/CEOR.S312986
Checked for plagiarism Yes
Review by Single anonymous peer review
Peer reviewer comments 2
Editor who approved publication: Professor Giorgio Colombo
Roza Yagudina,1 Andrey Kulikov,1 Vyacheslav Serpik,1 Alex Borodin,2 Irina Vygodchikova3
1Department of Organization of Medical Provision and Pharmacoeconomics, I.M. Sechenov First Moscow State Medical University (Sechenov University), Moscow, Russia; 2Plekhanov Russian University of Economics, Moscow, Russia; 3Department of Differential Equations and Mathematical Economics, Saratov State University, Saratov, Russia
Correspondence: Alex Borodin Tel +7 926 6469990
Fax +7 916 7008865
Email [email protected]
Purpose: Stimulating cost reduction of pharmaceutical companies to optimize the structure of distribution of patients by the level of treatment costs in various programs.
Patients and Methods: In this article, we rise up the issues of pharmacoeconomic modeling related to the description of the patient flows in the pharmacoeconomic model and methods to determining the course dose of drugs under the restriction of integer computations. We established two possible ways of distributing patients through treatment regimens in pharmacoeconomic models, also analyzed the effects of simultaneous and uniform entry of patients into the model. Also, we considered the limitations and possibilities of calculations based on the active substance and packaging, as well as the transition factor of the remainder of the drug in the next time period.
Results: A mathematical model of the analysis of the system assessment of patients by the level of risk of abandoning a healthy lifestyle in connection with the growing problems of the difficult-to-control process is developed. The use of a rational data convolution mode allowed us to obtain a criterion for the optimality of the process and a logical point of stability of the pharmaceutical company by rationally applying treatment methods according to established standards (percentage base). This approach makes it possible to influence the management of private clinics through clear ideas on the algorithms for prescribing drugs in each group of patients and their zoning in the vector recovery mode.
Conclusion: Initial data and sample size: 552 measurements of the intervals of changes in the subject’s indicators in seconds (smoothing and scaling the data to the level of the base (analytical) period or the final (barrier) period). Regular use of this approach makes it possible to reserve the resources of the body of a healthy and physically active person in a timely manner for a very reliable functioning of all body systems, taking into account the dosed intake of prescribed drugs and the conditions of comfortable (decent) maintenance of patients during the course of treatment according to the method chosen by the doctor.
Keywords: pharmacoeconomic modelling, pharmacoeconomic model, number of patients, patient flow, patient distribution, budget impact analysis, purchase requisition
Introduction
The use of interactive pharmacoeconomic models makes clinical and economic assessment more convenient for practical use: the presence of variable parameters in the model (such as cost characteristics, number of patients, distribution of patients between treatment regimens) and the possibility of real-time substitution of actual values in them significantly increases the value of the obtained conclusions.1–6 Of particular importance is this opportunity when conducting budget impact analysis.7–9 Practice has shown that the pharmacoeconomic models that allow not only to analyze the impact budget, but also to form an application template for the exact volumes of drugs (DP) in kind, are most in demand by healthcare organizers, especially at the regional level of the healthcare system and for inpatient settings, necessary to meet the needs of a given number of patients.10
The current situation reflects the trend towards a deeper immersion of the pharmacoeconomics in the process of organizing drug provision, in which pharmacoeconomic models should not provide an abstract assessment of drugs, but an assessment carried out taking into account the characteristics and limitations of specific drug provision programs or conditions for the provision of medical care.11–14 The development of pharmacoeconomic modeling in this direction raises a number of methodological issues for calculating the number and distribution of patients and the exact volume of drugs that we would like to highlight in this publication.
Pharmacoeconomic calculations carried out at the federal level (with the exception of rare diseases and other cases with a minimal number of patients, for example, when a medicine is used in a narrow subgroup of patients) for the country as a whole, taking into account regional differences, initially present an average clinical and economic assessment of drugs; the interval of its possible deviations from the presented average value is set as part of the sensitivity analysis.1–15 The implementation of the option to form an application in such models is impractical, since this process, within the framework of the current system for organizing drug provision, belongs to the authorities of the constituent entities of the state (on an outpatient basis) and medical institutions (on an inpatient basis).16 Therefore, for decision-makers at the regional level of the healthcare system and at the level of individual medical institutions, comprehensive budget impact analysis models with the possibility of generating an application can be a useful tool. Adding an option to form an application defines the key principles of calculations in the pharmacoeconomic model: they must be integer, since patients and drug packaging are indivisible. These principles are implemented by rounding up to an integer in the calculation of patients and the number of packages.
At the same time, for pharmacoeconomic models that evaluate on an outpatient level of medical care, for a methodologically accurate calculation, it becomes critically important to take into account the necessary medication based on the number of packages, while under stationary conditions, in some cases, these calculations can be performed based on the required amount of active substance (for example for injectable forms), which reflects the permissibility of using one package of the drug for several patients in the inpatient treatment (if it is not contrary to the instructions for medical use of the drug).
Advanced information issues of assessing the dynamic series of indicators of medical diagnostic devices gives physically active citizens the opportunity to diagnose the problem themselves at an early stage and take measures to restore it.17 Functional-diagnostic monitoring and analysis of the level of indicators of vital systems of the body is especially important for sports medicine fitness instructors and people interested in a healthy lifestyle. Activity and regular exercise helps to reduce energy consumption and trains muscles, bones, nerves, and blood vessels.
The prospects for analyzing the level of dynamic perception of medicines by the body of a prepared (trained) and ordinary person, for whom the maximum calorie intake does not exceed 1800 (with a weight of about 55 kg), are very optimistic: people are looking for a balance of health indicators, which requires a mathematical description of the process of taking drugs that heal the human body.
Overload in the work of the physiological structures of the body leads to a malfunction of all organs, at the same time, the lack of strength, mental and cardio load, can lead to a change in the status of the client from the “healthy” mode to the “health difficulties” mode, if not to say more strictly.
Structural analysis: goals, objectives, hypothesis.
The purpose of the article is to build an information system for assessing the level of costs for drug treatment of a patient at any stage of the problem.
The hypothesis of the article. Modeling and evaluating the dynamics of important indicators and the use of pharmaceuticals of the desired effect will allow patients to emigrate to a lower-risk area and use a milder treatment regimen than originally recommended.
Patients and Methods
Pharmacoeconomic assessment is comparative in nature, therefore, in pharmacoeconomic models, when analyzing the “budget impact”, patients are distributed between the alternatives considered. Let us look on possible approaches to patient distribution by the example of rheumatoid arthritis (RA) patient distribution according to deidentified data of register of patients with rheumatoid arthritis of Ministry of Health of Nijegorodskaya Oblast (one of typical region of the Russian Federation). Therefore, our study used retrospective management data on the distribution of patients between treatment regimens, which was obtained on the basis of real clinical practice in the previous period prior to the start of our study, hence approval of the ethics committee is not required. There are two ways to distribute patients in the model: by directly entering the estimated number of patients in each treatment regimen, that presented by Figure 1A, or on the basis of the product of the total number of patients and the estimated shares (%) in each treatment regimen, demonstrated by Figure 1B. The first method is simpler for calculations, but is more suitable for cases where patient distribution data are available accurate to the patient. The second of the indicated methods seems to be more functional and universal, in which it is required to enter only the total number of patients, and the value of the patient shares in each of the schemes changes in the pharmacoeconomic model as part of the analysis of possible situations. Figure 1B pointed, that the use of integer calculations of the number of patients distributed between the analyzed treatment regimens based on the total number of patients and shares in the pharmacoeconomic model is associated with a possible discrepancy between the total number of patients introduced initially and obtained as the total number of patients in individual treatment regimens.
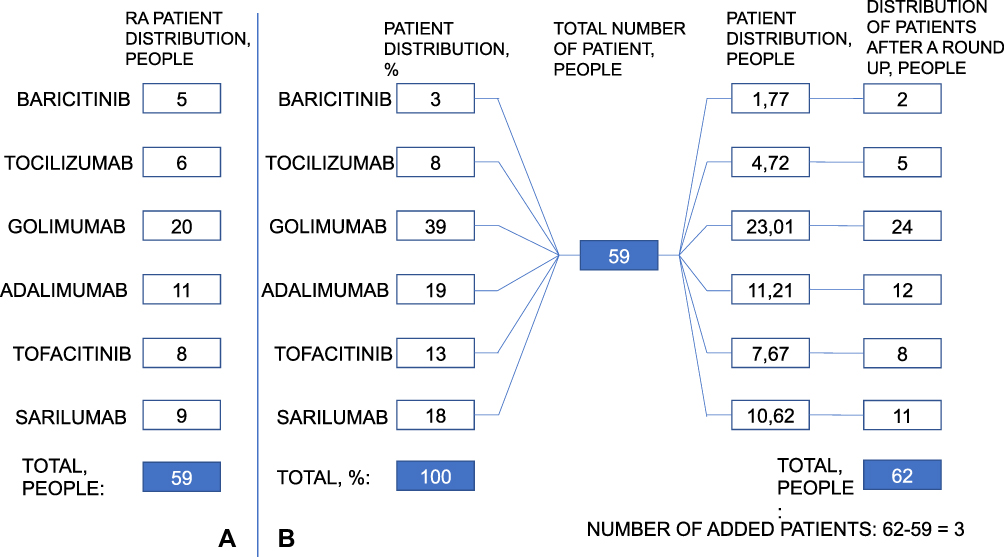 |
Figure 1 Illustration of possible ways of patient distribution in the pharmacoeconomic model (Figure 1A: by directly entering the estimated number of patients in each treatment regimen, Figure 1B: on the basis of the product of the total number of patients and the estimated shares (%) in each treatment regimen). |
This discrepancy is due to the fact that rounding up to an integer number of patients on each of the treatment regimens in the model is accompanied by the appearance of an “additional” patient (later in this article we will use this phrase in this sense).
Taking into account that the exchange rate for treating a patient with modern drugs can reach millions of rubles, it becomes relevant to adjust the model calculations that appear when rounding “additional patients”. There are several options for correcting this mismatch:
● Subtraction of “additional” patients who appeared due to rounding up from the number of patients in the treatment regimen with the smallest proportion of distribution;
● Subtraction of “additional” patients who appeared due to rounding up from the number of patients in the treatment regimen with the highest proportion of distribution;
● Subtracting the “additional” patients that appeared due to rounding up from the number of patients in the least expensive scheme.
The methodology of the article is as follows: modeling and evaluating the dynamics of important indicators will allow us to interpret and justify the level of the optimal dose of the drug in each group. According to the authors, all body systems and tissues are capable of recovery, but the timing and mode are different and individual. It is important to balance the cost of drugs for the optimal dose of treatment of patients of each group.
Results
From our point of view, all three of these approaches can be applied in pharmacoeconomic modeling, but subject to appropriate justification and reflection in the model description section. The first approach reflects the frequency logic of the distribution of patients, according to which, the smaller the proportion of patients in the treatment regimen, the less patients should be on it and, therefore, the “additional patients” should be removed from this treatment regimen. However, with a small number of patients and several treatment regimens, this approach can lead to a negative number of patients in the circuit from which “additional patients” are subtracted. Let us turn to the example in Figure 1B, according to which the smallest proportion of patients is established for Baricitinib, which corresponds to 2 patients; the number of “additional patients” is 3 people, therefore, after adjusting this method, the number of patients at Baricitinib will be −1 patient. In such situations, the second approach seems to be the best choice, which allows you to circumvent the identified problem. However, it should be borne in mind that its use will lead to an increase in the share of treatment regimens with low proportions of patient distribution. From the point of view of the analysis of the “impact on the budget”, the correction of “additional” patients by reducing the number of patients in the least expensive treatment regimen (if the condition is fulfilled that this will not lead to a negative number of patients in the regimen) may be more relevant. If we supplement the above example with data on cost of treatment course for each of the treatment options (based on prices of compulsory insurance fund of Nijegorodskaya oblast), we can demonstrate in Table 1, how the use of each of the described approaches determines the results of the budget impact analysis.
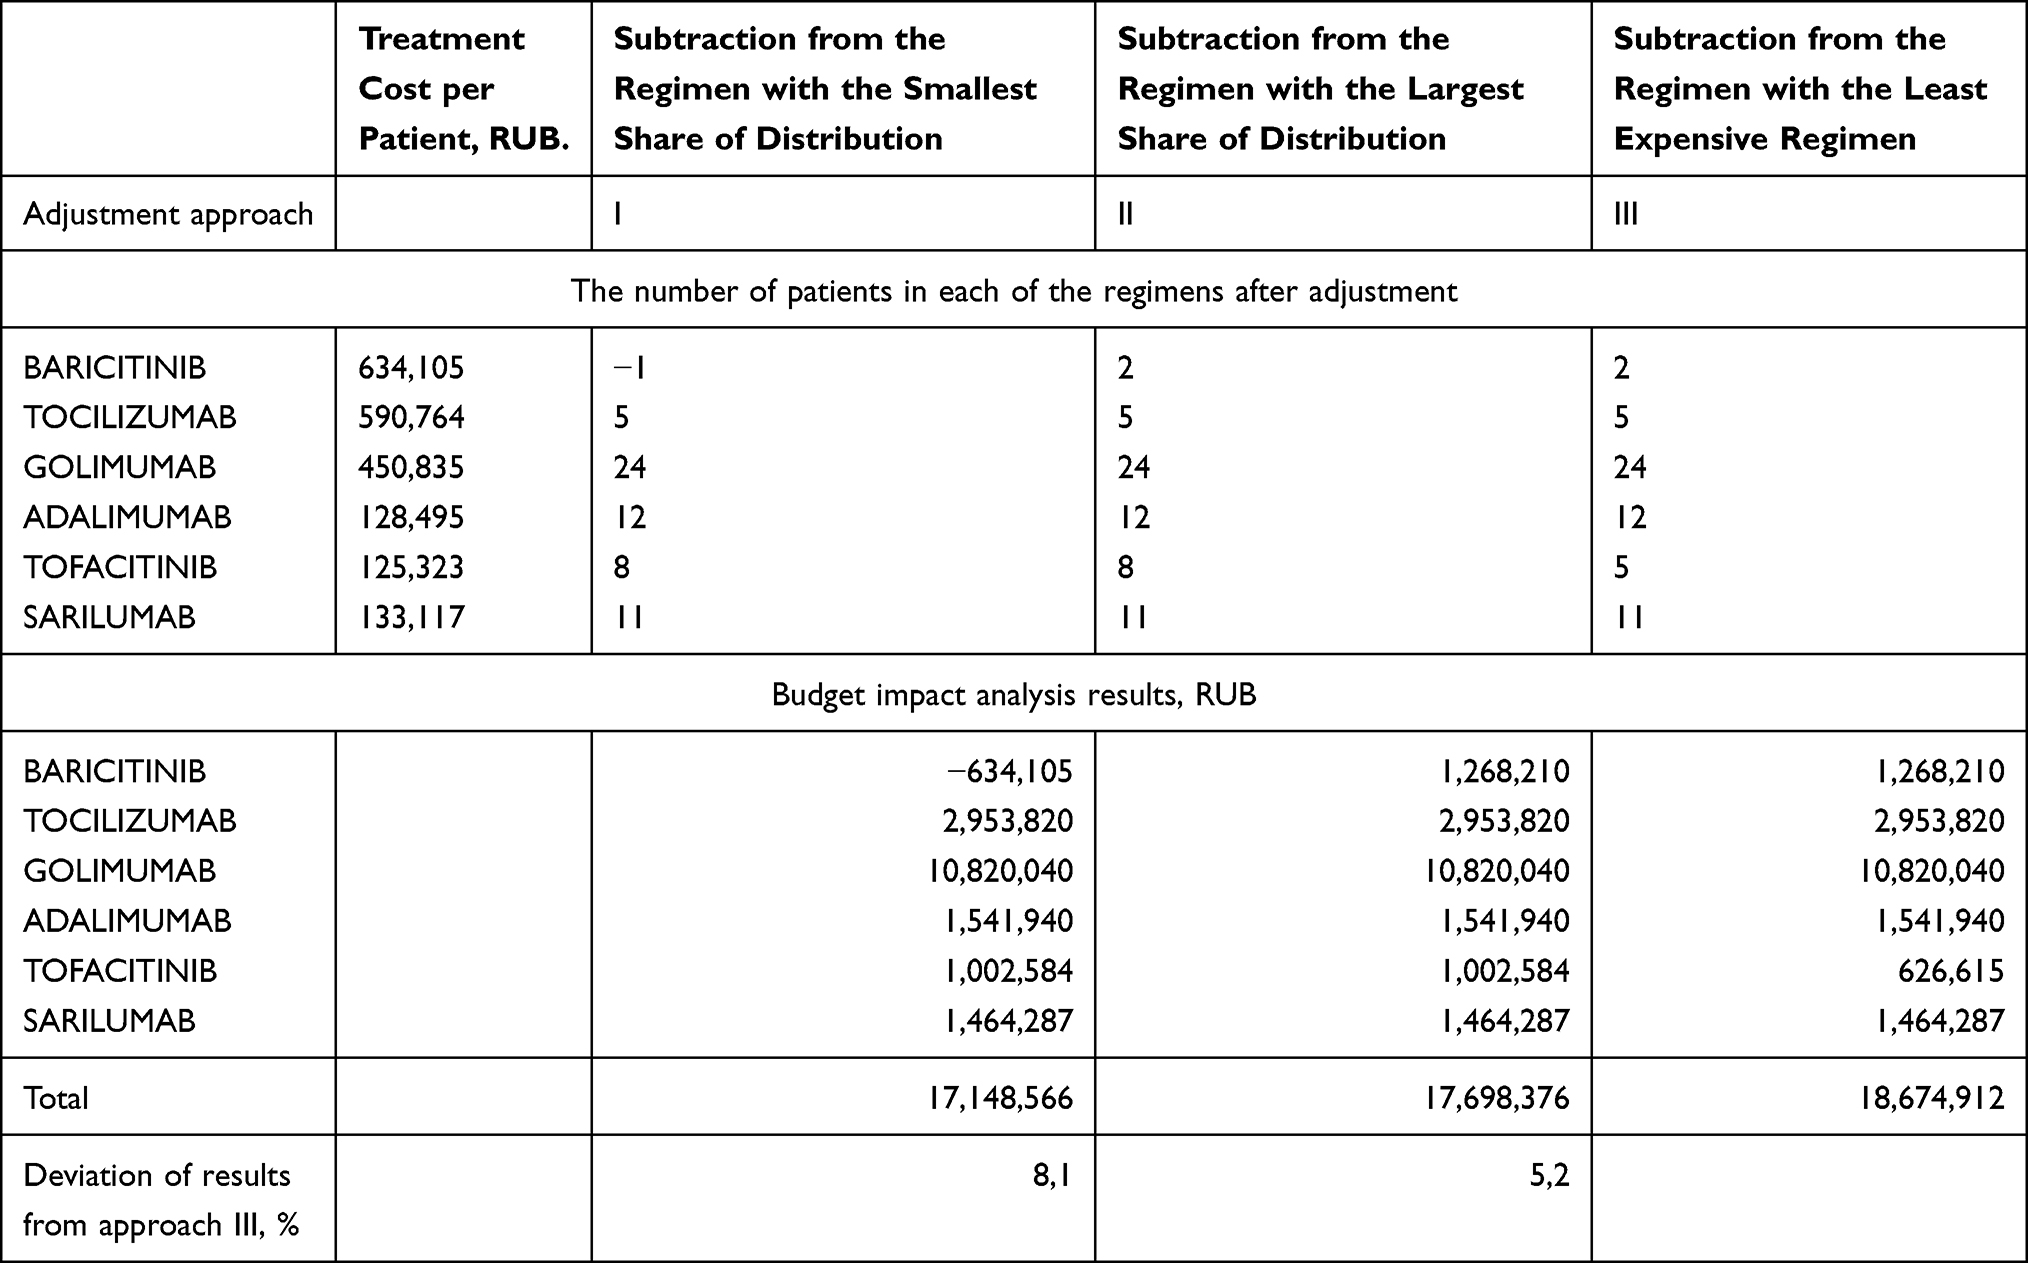 |
Table 1 The Results of the Budget Impact Analysis When Using Various Approaches to the Adjustment of “Additional Patients” |
The data in Table 1 show that when subtracting the “additional” patients from the number of patients at Baricitinib (with the smallest share in the distribution), a negative number of patients appears in this scheme, which is the reason for the error in the further calculation of the “budget impact” analysis. A comparison of the results of the second and third methods of correction of “additional” patients shows that when they decrease from the number of patients in the scheme with the lowest cost, the calculated budget is higher (18.7 million rubles) than when they decrease from the number of patients in the scheme with the largest share in the distribution (17.7 million rubles), which reflects the effect of the greater weight of the cost factor in the calculations.
Another aspect related to taking into account the number of patients in pharmacoeconomic models is the duration of entry into the patient model. In pharmacoeconomic models, the default assumption is usually that patients enter at a time. Such an assumption is justified when conducting a pharmacoeconomic assessment at the federal level, but it begins to have a serious impact on the results of the budget impact analysis, especially when implementing the option to form an application for the regional level of the healthcare system or at the health facility level. Obviously, the situation of patients entering the model at one time is abstract, while in reality patients enter the process of preferential drug provision throughout the entire considered time period, and thus the volume of a real application is lower when analyzing a fixed number of patients introduced into the model for the reporting period. Obviously, in a real situation, this effect is offset by patients moving from the previous time period to the current one, thereby forming the average annual amount of drug consumption with a dynamics corresponding to the incidence rate.
Mathematical Method
In the first stage of the analysis, scaling is performed as the difference between the cost level and the minimum cost, divided by the difference between the maximum and minimum. Specific indicators are calculated. To avoid null values, a unit is added to each metric.
The technology θ1 … θn usage shares are calculated as a result of solving the following minimax problem.
maxi=1, …,n(Viθi)→min(θ∈D). (1)
where D={θ=(θ1, …,θn)∈Rn:θ1+ … +θn=1}.
The solution of the problem is determined by the formulas:
θi =1/(Vi ((1/V1)+ … +(1/Vn))), i=1, …,n. (2)
For this technology, we use the accepted level of medication costs:
Pi = θi P. (3)
At the second stage of the analysis, the obtained shares (2) are recalculated taking into account the volume of patients served q.
We denote by the
wi=1/(qi (1/ q1 + … +1/ qn)), i=1, …,n. (4)
correction factor for the volume of patients served for the i-th technology (it is clear that the sum of the coefficients for all is one). Perform the correction of fractions from θ from (2) to θθ, see (5).
θθi=θiwi/(θ1w1 + … + θnwn)), i=1, …,n, (5)
(the sum of the coefficients is one). The calculations are presented in Table 2.
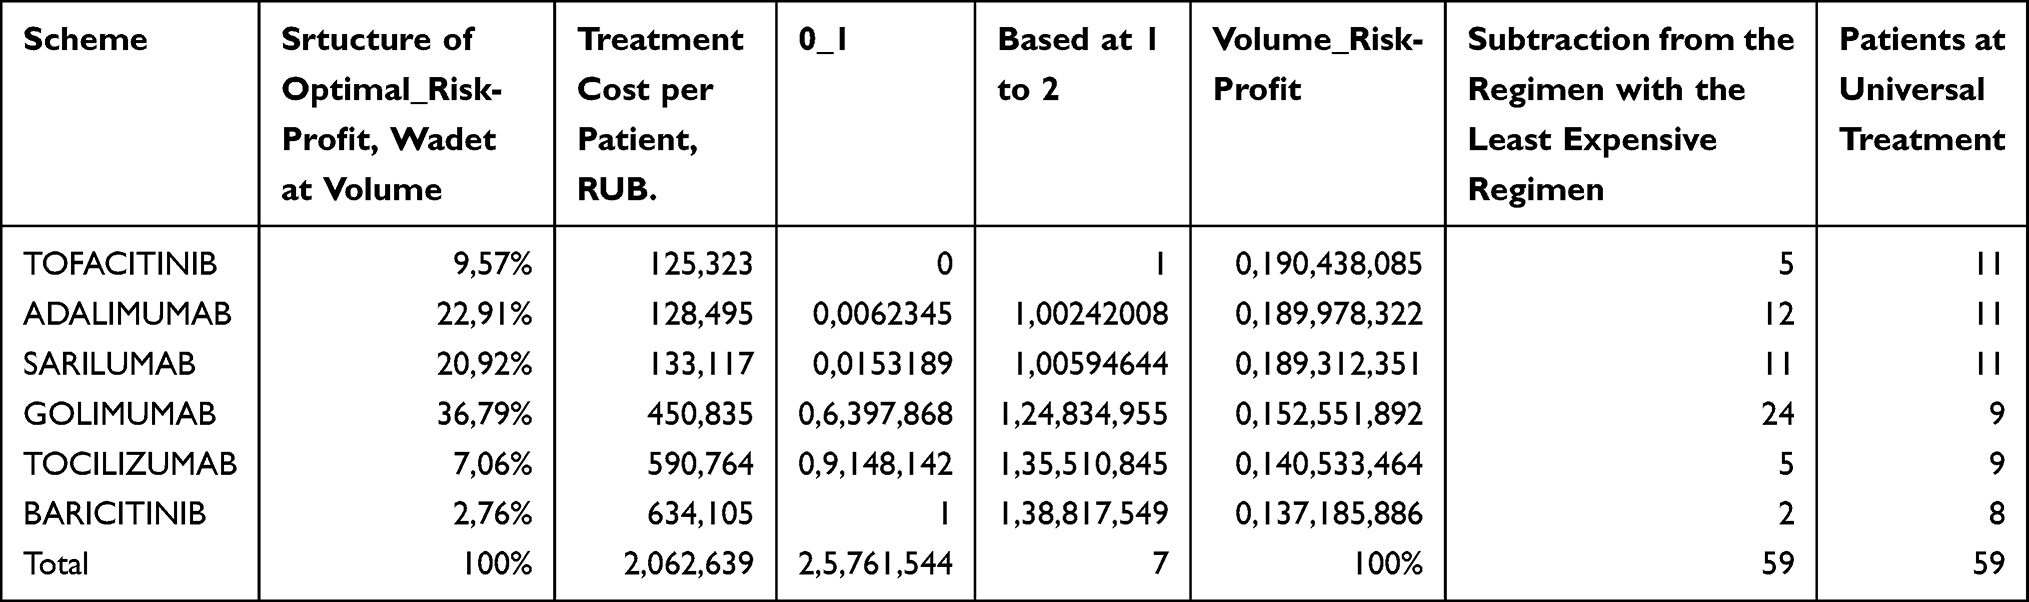 |
Table 2 Calculations of Distribution Patients by Level of Treatment Costs in Various Schemes |
While pharmacoeconomic models from the perspective of patient input are cohort, they do not take into account the transition of patients from the time period preceding the one considered in the model. From our point of view, an alternative solution to this problem can be the use of a correction factor in the pharmacoeconomic model, obtained on the basis of the ratio of the nominal and real consumption of drugs (which is usually lower, which is caused not only by the uniform detection and prescription of drugs, but also, for example, such factors as the presence of interruptions in taking the drug, drug cancellation due to side effects, etc.), if there is retrospective data on the latter. The correction factor is multiplied by the nominal amount of medication calculated in the pharmacoeconomic model required by a given number of patients.1
Discussion
The severity of the impact on the results of the budget impact analysis and the formation of the application of the factor of simultaneous entry of patients into the model is determined by the ratio of the duration of the course of the treatment scheme under consideration, the budget planning period and/or the application of the drug supply program and the time horizon of the pharmacoeconomic model. In order to more clearly illustrate the discussed features of pharmacoeconomic modeling, we presented, using the Gantt chart, several possible scenarios for 8 patients entering the model. In order to simplify in our example, patients receive one pack of drugs per month. Figure 2 shows an example for a medicinal product with a treatment course of 4 months (the planning period of interest to us is 1 year, consisting of two half-years, which reflects the practice of additional application and procurement as part of the drug supply process). As follows from the data presented on the right in Figure 2, the difference for 8 patients between the scenario with a single and uniform patient input is 3 packs of the drug or almost 10% of the total pack volume. We also note that with a single entry of patients into the model, all of them will undergo therapy in the first half of the year and no additional application will be required, while with uniform entry into the model 37% of the packages (11 packs) of drugs fall on the second half of the year.
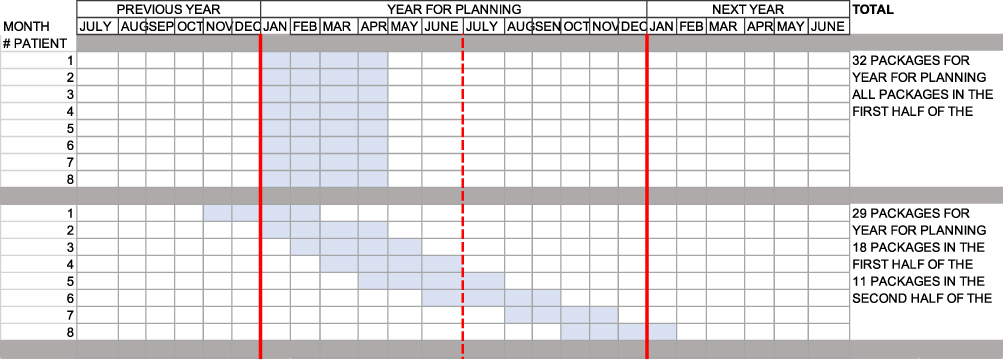 |
Figure 2 An example of a one-time and uniform entry of patients into the pharmacoeconomic model with a treatment course of 4 months. |
With an increase in the duration of the drug therapy course to 1 year, the difference in the number of necessary packages between the scenario with a single entry into the patient model and uniformly reaches 35 packages, or more than 35%. At the same time, it is obvious that with a single entry of patients into the model, the entire course of therapy fits into the planning period, capturing in equal proportions both half-years (48 packs each), while when the patients enter the model evenly, a significant amount of drug supply will go to the next temporary period (23 packs), and most of the packages (36 packs) are spent in the second half of the planning period (Figure 3).
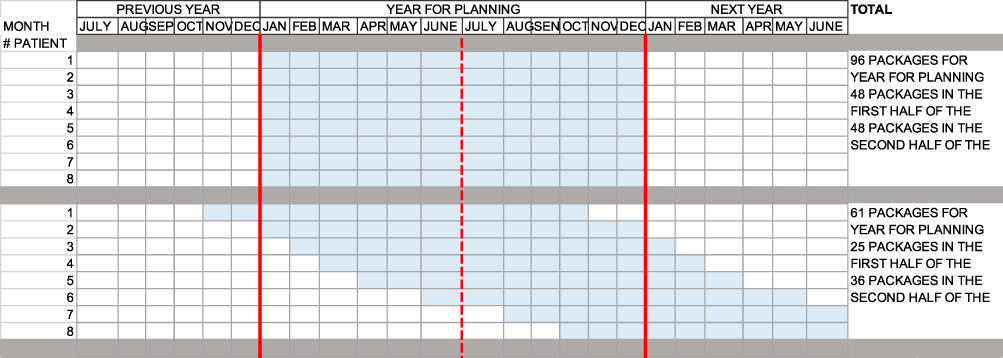 |
Figure 3 An example of a one-time and uniform entry of patients into the pharmacoeconomic model with a treatment course of 1 year. |
Also, when implementing the option to form an application, more attention than just for analyzing the “budget impact” requires taking into account the time horizon factor and its relationship with the planned financial period, since it is necessary to consider carry-over balances, especially in conditions of outpatient drug provision. So, a common approach in the development of pharmacoeconomic models for the domestic health care system is to set a time horizon of 3 years with an intermediate annual debriefing. At the same time, due to the peculiarities of the form of release and the regimen for taking the medicine, a situation may arise when a patient suffers from one package of medicine both at the end of one time period (year) and at the beginning of the next time period (next year). From the point of view of calculations for the entire time horizon (3 years), this situation does not affect the simulation results. However, when summing up the subtotals or if the results for the entire time horizon are calculated in the model as the sum of the results of the subtotals, it is important to consider the carry-over balances in order to avoid the appearance of additional drug packaging caused by integer calculations in the model. As an example of the given situation, we can consider the appointment of a drug, the release form of which is presented by packing tablets N. 28 with a dosage regimen of one tablet per day. Then, based on the fact, that there are 365 or 366 days in a year, the patient will need 13.04 packs, respectively, or 13.07 pkg of drug, which with integer calculations with rounding up will give 14 packages per year. Without correction for three years, the required number of packages, calculated as the sum of packages for each year, per patient will be 42. On the other hand, the calculation for the entire time horizon as a whole, based on 1095 or 1096 days, determines the required number of medicines packages per patient as 39.11 and or 39.14, which, when rounded up to an integer, gives 40. The observed difference in 2 packages between the two above calculations reflects the importance of taking into account the carry-over balances of drugs in pharmacoeconomic models.
Conclusion
The methodological issues that we have considered taking into account the number and distribution of patients and drugs in pharmacoeconomic models show that a deeper than just the process of compiling lists of drugs, the implementation of pharmacoeconomic instruments in the organization of drug supply requires consideration of additional factors in pharmacoeconomic models, or at least a clear statement of the accepted assumptions in the calculations. Concluding this article, I would like to emphasize an important trend in the development of healthcare technologies, which actualizes the above considerations: the transition to personalized medicine, including with the active introduction of gene therapy, it will be accompanied by a significant increase in costs on the one hand, and on the other hand, a saturation of the range of possible alternative technologies even within narrow groups of patients, which for healthcare organizers will mean the need for more and more detailed calculations.
A mathematical model of the analysis of the system assessment of patients by the level of risk of abandoning a healthy lifestyle in connection with the growing problems of the difficult-to-control process is developed. The use of a rational data convolution mode allowed us to obtain a criterion for the optimality of the process and a logical point of stability of the pharmaceutical company by rationally applying treatment methods according to established standards (percentage base). This approach makes it possible to influence the management of private clinics through clear ideas on the algorithms for prescribing drugs in each group of patients and their zoning in the vector recovery mode.17–19
The method is fundamentally new, since it is aimed at reducing the use of drugs and regular monitoring of the human body in order to optimize physical activity and sleep-rest – mental and physical-labor activity, sports development mode according to the daily grouping of incentives and tourist excitement.20,21
Initial data and sample size: 552 measurements of the intervals of changes in the subject’s indicators in seconds (smoothing and scaling the data to the level of the base (analytical) period or the final (barrier) period).22 Regular use of this approach makes it possible to reserve the resources of the body of a healthy and physically active person in a timely manner for a very reliable functioning of all body systems, taking into account the dosed intake of prescribed drugs and the conditions of comfortable (decent) maintenance of patients during the course of treatment according to the method chosen by the doctor.
Disclosure
The authors report no conflicts of interest in this work.
References
1. Weinstein M, O’Brien B, Hornberger J, et al. Principles of good practice of decision analytic modeling in health care evaluation: report of the ISPOR Task Force on Good Research Practices-Modeling Studies. Value Health. 2003;6(1):9–17. doi:10.1046/j.1524-4733.2003.00234.x
2. Caro J, Briggs A, Siebert U, Kuntz K. ISPOR-SMDM Modeling Good Research Practices Task Force. Modeling good research practices–overview: a report of the ISPOR-SMDM Modeling Good Research Practices Task Force–1. Value Health. 2012;15(6):796–803. doi:10.1016/j.jval.2012.06.012 PMID: 22999128.
3. Siebert U, Alagoz O, Bayoumi A, et al. State-transition modeling: a report of the ISPOR-SMDM Modeling Good Research Practices Task Force-3. Value Health. 2012;15(5):812–820. doi:10.1016/j.jval.2012.06.014
4. Pitman R, Fisman D, Zaric G, et al. Dynamic transmission modeling: a report of the ISPOR-SMDM Modeling Good Research Practices Task Force-5. Value Health. 2012;15(5):828–834. doi:10.1016/j.jval.2012.06.011
5. Roberts M, Russell L, Paltiel A, et al. Conceptualizing a model: a report of the ISPOR-SMDM Modeling Good Research Practices Task Force-2. Value Health. 2012;15(5):804–811. doi:10.1016/j.jval.2012.06.016
6. Karnon J, Stahl J, Brennan A, et al. Modeling using discrete event simulation: a report of the ISPOR-SMDM Modeling Good Research Practices Task Force-4. Value Health. 2012;15(5):821–827. doi:10.1016/j.jval.2012.04.013
7. Mauskopf J, Sullivan S, Anneman L, et al. Principles of good practice for budget impact analysis: report of the ISPOR Task Force on Good Research Practices— budget Impact Analysis. Value Health. 2007;10(5):336–347. doi:10.1111/j.1524-4733.2007.00187.x
8. Sullivan S, Mauskopf J, Augustovsk F, et al. Principles of good practice for budget impact analysis II: report of the ISPOR Task Force on Good Research Practices – budget Impact Analysis. Value Health. 2014;17(1):5–14. doi:10.1016/j.jval.2013.08.2291
9. Yagudina R, Kulikov A, Serpik V, Ugrekhelidze D. Concept of Combining Cost-Effectiveness Analysis and Budget Impact Analysis in Health Care Decision-Making. Value Health Reg Issues. 2017;13:61–66. doi:10.1016/j.vhri.2017.07.006
10. Tiriveedhi V. Impact of Precision Medicine on Drug Repositioning and Pricing: a Too Small to Thrive Crisis. J Pers Med. 2018;8:36. doi:10.3390/jpm8040036
11. Hung M, Lauren E, Hon E, et al. Using Machine Learning to Predict 30-Day Hospital Readmissions in Patients with Atrial Fibrillation Undergoing Catheter Ablation. J Pers Med. 2020;10:82. doi:10.3390/jpm10030082
12. Morgan S, Duguez S, Duddy W. Personalized Medicine and Molecular Interaction Networks in Amyotrophic Lateral Sclerosis (ALS): current Knowledge. J Pers Med. 2018;8:44. doi:10.3390/jpm8040044
13. Yella JK, Yaddanapudi S, Wang Y, Jegga AG. Changing Trends in Computational Drug Repositioning. Pharmaceuticals. 2018;11:57. doi:10.3390/ph11020057
14. Salem AF, Gambini L, Udompholku P, Baggio C, Pellecchia M. Therapeutic Targeting of Pancreatic Cancer via EphA2 Dimeric Agonistic Agents. Pharmaceuticals. 2020;13:90. doi:10.3390/ph13050090
15. Eddy D, Hollingworth W, Caro J, et al. Model transparency and validation: a report of the ISPOR-SMDM Modeling Good Research Practices Task Force-4. Value Health. 2012;15(5):843–850. doi:10.1016/j.jval.2012.04.012
16. Seidman G, Atun R. Do changes to supply chains and procurement processes yield cost savings and improve availability of pharmaceuticals, vaccines or health products? A systematic review of evidence from low-income and middle-income countries. BMJ Glob Health. 2017;13(2). doi:10.1136/bmjgh-2016-000243
17. Korolev V. Probabilistic-statistical methods of decomposition of the volatility of chaotic processes. Moscow: MSU. 2011;512. Available from: http://www.mathnet.ru/php/seminars.phtml?option_lang=eng&presentid=4100. Accessed July 16, 2021.
18. Awrejcewicz J, Krysko VA, Kutepov IE, Vygodchikova IY, Krysko AV. Quantifying chaos of curvilinear beam via exponents. Commun Nonlinear Sci Numer Simul. 2015;27(1–3):81–92. doi:10.1016/j.cnsns.2015.02.016
19. Bondarenko T, Prodanova N, Borodin A, Kokorev A, Kairbekuly A. The role of non-financial reporting in corporate sustainability of pharmaceutical industry. Syst Rev Pharm. 2020;11(12):1514–1522. doi:10.31838/srp.2020.12.223
20. Awrejcewicz J, Krysko AV, Papkova IV, Vygodchikova IY, Krysko VA. On the methods of critical load estimation of spherical circle axially symmetrical shells. Thin-Walled Structures. 2015;94:293–301. doi:10.1016/j.tws.2015.04.003
21. Sendov BK. Hausdorff approximations. Sofia. 1979;372.
22. Bai Z, Zheng S, Zhang B, Hu G. Statistical analysis for rounded data. J Stat Plan Infer. 2009;139(8):2526–2542. doi:10.1016/j.jspi.2008.11.018
 © 2021 The Author(s). This work is published and licensed by Dove Medical Press Limited. The
full terms of this license are available at https://www.dovepress.com/terms
and incorporate the Creative Commons Attribution
- Non Commercial (unported, 3.0) License.
By accessing the work you hereby accept the Terms. Non-commercial uses of the work are permitted
without any further permission from Dove Medical Press Limited, provided the work is properly
attributed. For permission for commercial use of this work, please see paragraphs 4.2 and 5 of our Terms.
© 2021 The Author(s). This work is published and licensed by Dove Medical Press Limited. The
full terms of this license are available at https://www.dovepress.com/terms
and incorporate the Creative Commons Attribution
- Non Commercial (unported, 3.0) License.
By accessing the work you hereby accept the Terms. Non-commercial uses of the work are permitted
without any further permission from Dove Medical Press Limited, provided the work is properly
attributed. For permission for commercial use of this work, please see paragraphs 4.2 and 5 of our Terms.