Back to Journals » Journal of Inflammation Research » Volume 19
Pathogenic Implications of the THY1/NF-κB Feedback Relationship in Osteoarthritis and Its Potential as a Therapeutic Target
Authors Yan Y, Wang C ![]() , Zhang M, Ji E
, Zhang M, Ji E ![]() , Yu J, Cheng W
, Yu J, Cheng W ![]()
Received 30 January 2026
Accepted for publication 19 May 2026
Published 30 May 2026 Volume 2026:19 597277
DOI https://doi.org/10.2147/JIR.S597277
Checked for plagiarism Yes
Review by Single anonymous peer review
Peer reviewer comments 3
Editor who approved publication: Dr Ujjwol Risal
Yiqun Yan,1,2 Chen Wang,1,2 Mingjun Zhang,1,2 Entong Ji,1,2 Jiangqi Yu,3 Wendan Cheng1,2
1Department of Orthopaedics, The Second Affiliated Hospital of Anhui Medical University, Hefei, Anhui, 230601, People’s Republic of China; 2Institute of Orthopaedics, Research Center for Translational Medicine, The Second Affiliated Hospital of Anhui Medical University, Hefei, Anhui, 230601, People’s Republic of China; 3Department of Information, the 970th Hospital of Joint Logistics Support Force, Weihai, Shandong Province, 264200, People’s Republic of China
Correspondence: Wendan Cheng, Email [email protected]; [email protected] Jiangqi Yu, Email [email protected]
Background: Osteoarthritis (OA) is a chronic inflammatory disease primarily characterized by cartilage damage, and its pathological mechanisms remain to be elucidated.
Objective: This study aimed to identify potential therapeutic targets for OA and to further explore their associated molecular mechanisms.
Methods: Candidate OA-associated genes were identified by integrating differential expression analysis, WGCNA, and PPI network analysis. Diagnostic marker genes were subsequently determined using machine-learning algorithms (RF, LASSO, and SVM-RFE) and further validated by ROC analysis and nomogram modeling. Single-cell sequencing analyses were conducted to characterize the temporal dynamics of these marker genes across the developmental trajectory of OA chondrocytes. Both in vitro and in vivo experiments were performed to confirm the expression of key molecules and the activation of relevant pathways. In addition, berberine, a natural isoquinoline alkaloid with anti-inflammatory potential, was selected as a candidate compound to evaluate its interaction with THY1 by molecular docking and molecular dynamics simulation.
Results: A total of 19 candidate OA-associated hub genes were identified. By integrating three machine-learning algorithms, THY1 was determined as a diagnostic marker gene for OA, and ROC curves and a nomogram model confirmed its favorable diagnostic/predictive performance. Single-cell sequencing further suggested a gradual upregulation of THY1 during chondrocyte development in OA. Both in vitro and in vivo experiments supported the feasibility of THY1 as a potential therapeutic target. Computational simulations demonstrated favorable binding between berberine and THY1.
Conclusion: This study suggests that THY1 may serve as a diagnostic biomarker for OA and may be involved in disease progression through its association with the NF-κB signaling pathway. Moreover, our computational simulations provide preliminary and predictive structural insights into the potential interaction between berberine and THY1, thereby expanding possible research directions for berberine-based approaches in OA.
Keywords: osteoarthritis, THY1, NF-κB signaling, berberine
Introduction
Osteoarthritis (OA) is a chronic degenerative joint disease that affects the entire joint. In addition to cartilage damage or degeneration, it is also characterized by meniscal degeneration, subchondral bone remodeling, synovial inflammation, and fibrosis and inflammation of the infrapatellar fat pad.1–3 These structural alterations are accompanied by biomechanical changes within the joint. For example, cartilage degeneration impairs load distribution and shock absorption, while subchondral bone remodeling alters mechanical properties and stress transmission. These biomechanical changes further contribute to the development of clinical symptoms.4 Its clinical manifestations typically include progressively worsening joint pain/discomfort, stiffness, inflammatory responses, restricted mobility, and structural abnormalities.5 As one of the most common joint diseases worldwide, OA affects the health of more than 500 million individuals and is a major cause of chronic disability in older adults.6 The onset and progression of OA are influenced by multiple factors, including age, sex, genetic background, body weight, previous joint injuries (eg., meniscal tears), mechanical loading, and metabolic syndrome;7,8 among these, low-grade, chronic inflammation driven by innate immune responses is considered a critical component of disease progression. This inflammatory microenvironment is characterized by a predominance of pro-inflammatory M1 macrophages and sustained release of inflammatory cytokines such as IL-1β, TNF-α, and IL-6. These mediators can activate signaling pathways including NF-κB and PI3K–AKT, thereby amplifying inflammatory responses, disrupting chondrocyte metabolism, and promoting matrix degradation, ultimately forming a vicious cycle of cartilage destruction and joint degeneration.9,10
However, because the key pathogenic mechanisms of OA have not yet been fully elucidated, current clinical treatments are mainly symptomatic, including oral medications (eg., NSAIDs and acetaminophen) and intra-articular injections (eg., corticosteroids and hyaluronic acid).11 For patients with advanced-stage disease who have severe mobility impairment, joint replacement surgery is often required to restore joint function. This not only imposes substantial physical and psychological burdens on patients, such as postoperative pain, reduced mobility, prolonged rehabilitation, decreased quality of life, and psychological distress, but also creates considerable economic pressure on healthcare systems and patients’ families.2,12,13 More challenging, OA often undergoes a prolonged “silent” phase before typical symptoms and radiographic changes become evident; during this stage, irreversible cartilage damage may have already occurred, resulting in missed opportunities for early intervention.14,15 Therefore, identifying sensitive and effective early diagnostic biomarkers and elucidating their associated molecular mechanisms are critical for improving OA management.16 Although candidate biomarkers such as CTX-II, COMP, and IL-6 have been proposed, their clinical utility is often limited by insufficient specificity, relatively weak disease relevance, and limited mechanistic interpretability, underscoring the need to develop novel biomarkers with greater translational potential.17–19
Among immune-related regulatory molecules, thymocyte antigen 1 (THY1) has gradually attracted attention as a promising yet insufficiently studied candidate. Previous studies have suggested that THY1 is closely associated with the intensity of inflammatory responses and the functional states of immune cells, and may participate in the establishment and maintenance of the local immune microenvironment.20,21 Accumulating evidence indicates that THY1 may intervene in the low-grade chronic inflammatory process of OA by modulating inflammatory cytokine networks and immune cell activation, thereby providing a potential link between immune-driven inflammatory amplification and cartilage tissue damage.22,23 However, the precise mechanisms by which THY1 contributes to OA-associated inflammation, as well as its value as a diagnostic biomarker, remain poorly understood and warrant further investigation.
Berberine is an isoquinoline alkaloid derived from Coptis chinensis and various Berberis species, and it exhibits multiple pharmacological activities, including anti-inflammatory and antioxidant effects.24 Previous studies have shown that berberine can alleviate cartilage degeneration and improve chondrocyte injury phenotypes in OA-related cellular and animal models. For example, in IL-1β–stimulated chondrocytes and in a rat OA model, berberine was reported to promote cell survival and ECM synthesis, thereby attenuating cartilage degeneration.25 Another study suggested that berberine may activate AMPK while inhibiting p38 MAPK, reducing NO-induced chondrocyte apoptosis and improving cartilage deterioration in rat OA.26 However, systematic investigations of berberine specifically along the NF-κB signaling axis remain limited, and whether berberine mitigates NF-κB–related inflammatory amplification and matrix degradation through a defined molecular target requires further clarification.
To address these gaps, this study aimed to identify potential diagnostic biomarkers for OA and to explore their associated molecular mechanisms. Unlike previous studies that often rely on single-cohort analyses with limited sample sizes and reduced reproducibility, we adopted an integrated multi-cohort analysis strategy. This approach enables cross-validation across independent datasets, reduces cohort-specific bias, and improves the robustness, reproducibility, and generalizability of the identified biomarkers. The overall study design is summarized in Figure 1. Using this framework, we sought to identify key molecules involved in OA progression and to evaluate their potential clinical and translational significance.
 |
Figure 1 Flow chart of this study design. |
Materials and Methods
Data Sources and Preprocessing
Human OA datasets were downloaded from the GEO database, including GSE57218, GSE114007, and GSE169077. These datasets were selected based on the following criteria: (1) human OA-related gene expression data, (2) inclusion of both OA and HC (healthy control) samples, (3) sufficient sample size, and (4) high data quality suitable for integrative analysis. A total of 122 samples were included (30 healthy control and 92 OA samples). GSE57218 was used as the training set, whereas GSE114007 and GSE169077 served as validation sets. Data preprocessing was performed in R software (version 4.5.1) using the “limma” package.27 When the maximum intensity value exceeded 50, the data were considered to be non-log-transformed expression values. Therefore, log2 transformation (log2(x + 1)) was applied to stabilize variance and improve comparability across samples, thereby better approximating a normal distribution. Quantile normalization was then conducted using the normalizeBetweenArrays function to ensure comparability across samples. For analyses involving multiple datasets, batch effects were corrected using the ComBat function in the “SVA” package.28 The intensity values after log2 transformation and normalization were used for all subsequent differential expression and network analyses.
Identification of Differentially Expressed Genes and WGCNA Construction
DEGs (Differentially Expressed Genes) between HC and OA samples were identified using the limma package. The screening criteria were set as adjusted p < 0.05 and |logFC| > 1. The results were visualized using the pheatmap function.
WGCNA (weighted gene co-expression network analysis) was performed using the WGCNA package29 to construct a gene co-expression network based on the expression profiles of OA and HC samples. Genes with a standard deviation > 0.5 were selected for subsequent analyses. To ensure data quality, the goodSamplesGenes function was used to remove genes with missing values or aberrant expression patterns. The optimal soft-thresholding power for network construction was determined using the pickSoftThreshold function (β = 11), which was chosen according to the scale-free topology criterion (R2 ≥ 0.9). The gene expression matrix was then transformed into an adjacency matrix, and gene modules were identified using a topological overlap-based clustering approach. Highly correlated modules were merged based on module eigengenes (MEs), and a hierarchical clustering dendrogram was generated to visualize the module structure. Gene significance (GS) and module significance (MS) were evaluated in conjunction with corresponding phenotypic data, thereby further characterizing the significance of associations between relevant genes and clinical information, as well as the correlations between modules and traits.
Analysis of Functional Enrichment and Chromosomal Localization
GO (Gene Ontology) and KEGG (Kyoto Encyclopedia of Genes and Genomes) functional enrichment analyses were conducted on the screened genes using the clusterProfiler and enrichplot packages,30 with cutoffs of adjusted p < 0.05 and q < 0.05. GO enrichment was evaluated across three categories: BP (biological process), MF (molecular function), and CC (cellular component). In addition, chromosomal localization of the core genes was visualized using the circlize package, and 20 genes were randomly selected using the random sampling function in R for visualization in the final figure.
Protein-Protein Interaction Networks
The PPI network was constructed via the STRINGdb package31(STRING version 11.5), with the organism restricted to Homo sapiens (taxon ID: 9606) and the confidence score cutoff set to 400. Nodes (genes) with low interaction frequency were removed. Betweenness centrality was computed for each node, and genes were categorized based on their betweenness values. Genes with betweenness centrality exceeding the network-wide mean were considered hub genes. Network visualization was performed using graph.
Gene-Associated Remodeling Analysis
The base R function cor() was used to calculate pairwise Pearson correlation coefficients among genes in the HC and OA groups, thereby constructing gene correlation matrices. Changes in the correlation structure under disease conditions were evaluated by calculating the difference in correlation coefficients for each corresponding gene pair between the two groups (HC − OA). The results were visualized using the corrplot package.
To further characterize the network features of correlation remodeling, gene pairs with large correlation changes were selected to construct a correlation-change network. An undirected network was built using the igraph package, in which nodes represent genes. Node colors indicate the direction of gene expression changes in OA, whereas edge color and width represent correlation strengthening or weakening and the magnitude of change, respectively. The network was visualized with a circular layout to intuitively depict the overall changes in gene co-regulatory relationships during OA development. In addition, the mean expression level of each gene was calculated separately in HC and OA groups, and expression changes were computed as log2(OA/HC) to determine up- or downregulation in OA. Gene expression changes were displayed using a scatter plot, with genes showing large expression changes annotated.
Screening of Disease-Characteristic Genes
Random forest (RF) analysis was performed using the randomForest package to further filter the core genes.32 RF is an ensemble learning method that aggregates multiple decision trees and mitigates overfitting, enabling effective handling of high-dimensional and imbalanced datasets and improving feature gene identification. The number of trees was set to 150 to ensure model stability and reliable estimation of feature importance. Out-of-bag (OOB) error estimation was used to assess model performance. A fixed random seed (set to 1723) was applied to ensure reproducibility. Support vector machine–recursive feature elimination (SVM-RFE) was implemented with the e1071 package to further screen the core genes.33 As a supervised learning strategy widely used for classification and regression, SVM-RFE provides high discriminative power for feature selection. A linear kernel was applied, and a 10-fold cross-validation procedure was used to determine the optimal number of features. Genes corresponding to the minimum classification error were selected. A fixed random seed (set to 1723) was used to ensure reproducibility. Least absolute shrinkage and selection operator (LASSO) regression was conducted using the glmnet package to further screen the core genes.34 LASSO performs variable selection through regularization and offers unique advantages for high-dimensional data analysis. A 10-fold cross-validation was used to determine the optimal regularization parameter (λ), and genes with non-zero coefficients at the optimal λ value were retained. A fixed random seed (set to 1723) was applied to ensure consistency of the results. Candidate genes identified by these three methods were then intersected to define the OA diagnostic marker genes.
Construction of ROC Curves and Nomograms for Clinical Prognosis Models
Receiver operating characteristic (ROC) curve models were constructed for the diagnostic marker genes using the pROC package. The area under the curve (AUC) was calculated to preliminarily evaluate the diagnostic performance of the marker genes for OA (AUC > 0.7 was considered indicative of acceptable accuracy).
A nomogram-based risk prognostic model was developed using the rms package. The total score, obtained by summing the scores of individual marker genes, was used to infer the probability of OA occurrence, with higher scores indicating a higher likelihood of disease. The regplot package was used to generate calibration curves; better predictive accuracy is reflected by a slope closer to 1. Decision curve analysis (DCA) was performed using the ggDCA package, where a net benefit value > 0 indicates good predictive performance of the model.
Analysis of Single-Cell RNA Sequencing Data
Cartilage scRNA-seq data were retrieved from the GEO database. Dataset GSE220243 was selected based on the following criteria: (1) human OA-related single-cell transcriptomic data, (2) inclusion of both normal and OA cartilage samples, and (3) sufficient cell number and data quality for downstream analysis. This dataset included six samples, consisting of normal cartilage (GSM6797149, GSM6797150, GSM6797151) and OA cartilage (GSM6797155, GSM6797156, GSM6797157). Data processing and analysis were conducted using Seurat.35 Quality control involved filtering out genes detected in fewer than three cells and removing cells with fewer than 1,000 detected genes or with mitochondrial gene content greater than 20%. Thereafter, IntegrateData, NormalizeData, FindClusters, and FindAllMarkers were employed to correct batch effects and normalize the data, followed by unsupervised clustering to refine cell subtypes and identification/annotation of marker genes for each cluster. The Monocle package36 was employed to conduct pseudotime analysis and to construct cellular trajectories. Using the orderCells function, cells were arranged along a time axis to depict their locations across distinct trajectories. Trajectories were visualized by coloring according to cell type or cluster, thereby delineating developmental routes in the process of chondrocyte differentiation.37
Gene Co-Expression Analysis
Co-expression between the OA diagnostic marker gene(s) and all other genes in the dataset was assessed using the base R function cor(). Pearson correlation was employed to quantify linear relationships, while Spearman correlation was used to capture monotonic associations and enhance robustness against outliers. Co-expressed genes were selected with thresholds of |r| ≥ 0.3 and P < 0.05. Genes reaching significance under Pearson and Spearman analyses were screened independently, and the overlap between the two sets was used for downstream analyses. Visualization was performed with ggplot2.
Transcription Factor Prediction and Analysis
Upstream TF enrichment was conducted using enrichR based on the positively correlated co-expression gene set. The co-expressed genes were queried against ChEA_2022, TF_Perturbations_Followed_by_Expression,ARCHS4_TFs_Coexp, and ENCODE_and_ChEA_.
Consensus_TFs_from_ChIP-X to systematically infer potential upstream regulators. These resources are derived from ChIP-seq evidence, TF perturbation–based transcriptomic profiling, large-scale co-expression datasets, and ENCODE consensus annotations, respectively, providing complementary lines of evidence for TF inference. Enrichment significance was defined as P < 0.05. Significantly enriched TFs were obtained from each database and then integrated by intersection analysis to identify TFs consistently present across all four databases, which were regarded as high-confidence upstream regulatory candidates.
Gene GSEA Enrichment Analysis
We downloaded the KEGG gene set annotation file c2.cp.kegg.v7.1.symbols.gmt from MSigDB (Molecular Signatures Database), which comprises known biological pathways and their associated gene sets, and used it as the reference gene set for GSEA. GSEA was performed in R using the GSEA() function from clusterProfiler after ranking genes based on the log2 fold change (log2FC) derived from differential expression analysis. Multiple comparisons were adjusted using the Benjamini–Hochberg procedure by setting p.adjust.method = “BH”. Pathways with adjusted P values (FDR) < 0.05 were considered statistically significant. The analysis yielded pathway-level enrichment scores and corresponding significance measures (P values and FDR). The results were presented as enrichment plots and heatmaps, and the NES was used to further quantify pathway activation levels.
Molecular Drug Docking Technology
The 3D structures of four drug molecules previously used for OA treatment (quercetin, berberine, celecoxib, and diclofenac) were retrieved from the PubChem database. These compounds were selected to represent two complementary therapeutic categories: conventional NSAIDs, which are widely used in clinical practice for symptom relief, and natural bioactive compounds, which have demonstrated anti-inflammatory, antioxidant, and cartilage-protective effects in OA-related studies. This combined selection strategy allows for the exploration of potential interactions between THY1 and compounds with distinct pharmacological mechanisms. The THY1 protein structure was obtained from the AlphaFold database (UniProt ID: THY1, AlphaFold accession: AF-P04216-F1), and models with predicted Local Distance Difference Test (pLDDT) values greater than 70 were selected to improve structural confidence. Receptor and ligand preparation was performed using AutoDockTools (v1.5.6), including conversion to PDBQT format and generation of a 3D grid box for docking simulations.38 Structures were then loaded into PyMOL (v3.1.1) to remove water molecules and bound ligands, after which molecular docking was carried out.39 Binding energies below −5 kcal/mol were considered indicative of effective ligand–receptor interactions, and energies below −7 kcal/mol were considered indicative of strong binding.
Molecular Dynamics Simulation
Docked complexes were subjected to 100 ns molecular dynamics (MD) simulations using GROMACS v2023.02.40 Briefly, (1) docking results in PDBQT format were converted to standard PDB files in PyMOL; (2) ligands were hydrogenated and exported as MOL2 files, and ligand topology parameters were generated using Sobtop, with parameters compatible with the AMBER force field; (3) systems were built in GROMACS using the AMBER99SB-ILDN force field41 and solvated with the TIP3P water model42 in a water box, with a minimum solute–box edge distance of 1.2 nm. System neutrality was achieved by adding appropriate amounts of Na⁺ and Cl−. A cutoff distance of 1.0 nm was applied for van der Waals and short-range electrostatic interactions, and long-range electrostatics were treated using the Particle Mesh Ewald (PME) method; (4) energy minimization was performed using steepest descent followed by conjugate gradient minimization; (5) equilibration was conducted by first restraining the solute under the NVT ensemble and slowly heating the system from 0 K to 300 K, followed by equilibration under the NPT ensemble at 300 K and 1 bar (1 bar = 1×10⁵ Pa). The velocity Verlet algorithm was used, temperature coupling was implemented with the V-rescale method, and pressure coupling was implemented with the C-rescale method. The initial equilibration duration was set to 100 ps; All covalent bonds involving hydrogen atoms were constrained using the LINCS algorithm; (6) Production MD: The complex was subjected to a 100 ns production MD simulation using a 2 fs integration time step, and simulation trajectories were recorded for downstream analyses.(7) Trajectory analysis: Based on the MD trajectories, the root-mean-square deviation (RMSD), root-mean-square fluctuation (RMSF), radius of gyration (Rg), solvent-accessible surface area (SASA), and the number of hydrogen bonds (H-bonds) were calculated. Using RMSD and Rg, Gibbs free energy was computed with the built-in GROMACS g_sham script, and the results were visualized as 2D and 3D plots.
MM/PBSA-Based Free Energy Analysis
To quantify ligand–protein binding affinity and corroborate the stable binding modes observed during MD simulations, MM/PBSA binding free energy calculations were performed using equilibrated MD trajectories.43 (1) Frames from the equilibrated portion of the 100 ns simulation (70–100 ns, corresponding to the stable plateau region of the RMSD curve) were extracted at 10 ps intervals, resulting in 3,000 snapshots. Water and ions were removed, retaining only the protein–ligand complex. (2) Binding free energy was computed as  , where the total free energy G was partitioned into gas-phase contributions
  and solvation contributions
  .
.  was obtained via the Poisson–Boltzmann equation, and
  was estimated from SASA. The entropic contribution (−TΔS) was not included due to its high computational cost and limited impact on relative binding energy comparisons.(3) To identify amino acid residues that contribute substantially to binding, per-residue binding free energy decomposition was performed for the complex, and
  was calculated for each residue. This analysis allowed the identification of key residues involved in ligand binding and the dominant types of energetic contributions (hydrophobic, polar, or electrostatic interactions).(4) MM/PBSA calculations were performed using the g_mmpbsa tool. PB calculations employed the linear Poisson–Boltzmann equation with a nonpolar solvation energy scaling factor γ = 0.0072 kcal·mol−1·Å−2 and intercept b = 0 kcal·mol−1. The calculation temperature was set to 300 K, with solvent permittivity ε = 80 and protein permittivity ε = 2. These parameters were selected based on commonly used settings in MM/PBSA calculations. (5) The average values and standard deviations of all calculated binding free energies and residue-by-residue contributions were obtained for subsequent statistical analysis and graphical representation.
Preparation of Clinical Samples and Laboratory Animals
The collection of clinical cartilage specimens from HC and OA patients was approved by the Ethics Committee of the Second Affiliated Hospital of Anhui Medical University (approval No. YX2025-030) and conducted in accordance with applicable guidelines and regulations, including the Declaration of Helsinki. HC cartilage was obtained from two patients undergoing amputation following traffic-accident–related injuries, while OA cartilage was obtained from four patients with severe OA undergoing surgical treatment. Written informed consent was obtained from all participants. After acquisition, part of the specimens was used to immediately extract chondrocytes for primary culture, and the remaining part was fixed with 4% paraformaldehyde solution for subsequent immunohistochemical evaluation.
The animal protocol used in this study was reviewed and approved by the Laboratory Animal Ethics Committee of Anhui Medical University (Approval No. LLSC20231140). All animal experiments were conducted in accordance with applicable guidelines and regulations, including the ARRIVE guidelines, the Guide for the Care and Use of Laboratory Animals (GB/T 35892–2018, China), and the American Veterinary Medical Association (AVMA) Guidelines for the Euthanasia of Animals.
Wild-type (WT) rats were purchased from Jiangsu Saiye Biotechnology Co., Ltd. and housed under standard laboratory conditions with a 12-h light/dark cycle, controlled temperature (22 ± 2 °C), and relative humidity (50 ± 10%). Animals were randomly assigned into two groups: WT group (n = 6) and WT + DMM group (n = 6).Adult male rats (8 weeks old, average body weight ~220 g) in the WT + DMM group were subjected to destabilization of the medial meniscus (DMM) surgery to induce an OA model. For surgical anesthesia, rats were intraperitoneally anesthetized with sodium pentobarbital (0.3%, 40 mg/kg), and local anesthesia was provided by infiltration of 1% lidocaine at the surgical site. Adequate depth of anesthesia was confirmed by the absence of pedal withdrawal and corneal reflexes before surgery. A medial parapatellar incision was made to expose the right knee joint, followed by transection of the medial meniscotibial ligament to destabilize the medial meniscus. The joint capsule and skin were subsequently sutured in layers.Ten weeks after surgery, rats were euthanized under deep anesthesia induced by an overdose of sodium pentobarbital, in accordance with the AVMA Guidelines for the Euthanasia of Animals. Death was confirmed by cessation of respiration and cardiac activity before tissue collection. Intact knee joints were harvested; part of the tissue was immediately used for primary chondrocyte isolation, while the remaining tissue was fixed in 4% paraformaldehyde for subsequent histological and immunohistochemical analyses.
Culturing of Cells
Human cartilage tissues were enzymatically digested with 0.25% collagenase II (Sigma-Aldrich, USA) in DMEM (Gibco, USA) using an enzyme solution volume equivalent to 10× the tissue volume. Digestion was performed at 37°C for 4–6 h, during which the digestion status of the tissue was observed every 30 min and the mixture was shaken. After filtration through a 70μM mesh, the filtrate was centrifuged at 1245 rpm for 5 min, and the supernatant was discarded. The cells at the bottom of the tube were resuspended in DMEM and centrifuged for 5 min; this step was repeated twice. Then, the cells were cultured in flasks with DMEM containing 10% fetal bovine serum in a humidified incubator at 37°C with 5% CO2.
Transient Transfection Technology
A THY1-targeting siRNA plasmid was designed and constructed by GenePharma (Shanghai, China). The siRNA sense and antisense sequences were 5’-GCCAUGAGAAUACCAGCAGUUTT-3’ and 5’-AACUGCUGGUAUUCUCAUGGCTT-3’, respectively. A scrambled siRNA served as a negative control (sense: 5’-UUCUCCGAACGUGUCACGUTT-3’; antisense: 5’-ACGUGACACGUUCGGAGAATT-3’). Following the manufacturer’s protocol, chondrocytes were seeded in six-well plates at a density of 7.5×10⁵ cells per well in 2 mL medium, and transfected in serum-free medium using Lipofectamine 2000 (Invitrogen, Carlsbad, CA). For each well, 75 pmol siRNA (3.75 μL of 20 μM stock) was diluted in serum-free medium and mixed with 5 μL Lipofectamine 2000, followed by incubation at room temperature for 15–20 min to allow complex formation. The resulting siRNA–Lipofectamine complexes were then added to the cells and gently mixed to ensure even distribution. Cells were inspected 6 h post-transfection and then cultured for an additional 72 h. Knockdown efficiency was assessed by Western blotting. Band intensities were quantified using ImageJ, and THY1 protein levels were normalized to GAPDH. Knockdown efficiency was calculated relative to the scramble control group. All experiments were performed with at least three independent biological replicates.
Cell Grouping and Processing
Untreated HC and OA chondrocytes were used for baseline phenotypic characterization. To model inflammatory stimulation, HC chondrocytes were assigned to four groups: control, TNF-α, BAY 11–7082, and TNF-α + BAY 11–7082. Following synchronization under low-serum conditions, cells were pretreated with the NF-κB inhibitor BAY 11–7082 (5μM) for 1 h and then stimulated with TNF-α (10 ng/mL) for 24.44–46 For OA chondrocytes, cells were transfected with THY1-specific siRNA, with scrambled siRNA serving as the negative control. At 72 h post-transfection, after confirming stable THY1 knockdown, cells were further subjected to BAY 11–7082 treatment either alone or in combination. Cells were collected at the end of treatment for immunofluorescence staining and Western blot analysis.
Immunohistochemical Analysis
Immunohistochemistry was performed to detect THY1 (1:200; DF4804), NF-κB p65 (1:200; AF5006), MMP13 (1:200; AF5355), ADAMTS5 (1:200; DF13268), and COL2A1 (1:200; AF0135). All primary antibodies were rabbit polyclonal antibodies from Affinity Bioreagents (USA). Human cartilage samples from HC and OA patients were fixed in 4% paraformaldehyde overnight, dehydrated through graded ethanol, and paraffin-embedded, followed by sectioning at 7μM. Rat knee joints were harvested, fixed in 4% paraformaldehyde for 48 h, decalcified in 10% EDTA for 4 weeks, paraffin-embedded, and sectioned at 5μM.
After deparaffinization, sections were treated with 4% H2O2 for 10 min and subjected to antigen retrieval in citrate buffer (10 mM, pH 6.0) using heat-induced epitope retrieval in a microwave oven (medium power for 10 min).Sections were then blocked and incubated with primary antibodies (diluted as indicated) at 4°C overnight, followed by incubation with HRP-conjugated goat anti-rabbit secondary antibody (1:200; S0001) for 30 min at room temperature. Immunostaining was visualized using DAB, and sections were counterstained with hematoxylin. Slides were dehydrated through ethanol, cleared in xylene, and imaged by light microscopy. Positive staining was quantified using ImageJ (v1.80v).
Immunofluorescence Analysis
Chondrocytes were seeded onto coverslips in 24-well plates at a density of 5 × 10⁴ cells per well 24 h prior to staining. Cells were washed with PBS and fixed with 4% paraformaldehyde for 30 min. After permeabilization with 0.1% Triton X-100 in PBS for 10 min, cells were blocked with bovine serum albumin (BSA) and incubated with primary antibodies against THY1 (1:200; DF4804, rabbit polyclonal, Affinity Bioreagents, USA) and NF-κB p65 (1:200; BF8005, mouse polyclonal, Affinity Bioreagents, USA) at 4°C overnight. On the following day, cells were incubated with Alexa Fluor 594-conjugated goat anti-rabbit secondary antibody (1:500; ab150092, Abcam) for THY1 and Alexa Fluor 488-conjugated goat anti-mouse secondary antibody (1:500; ab150113, Abcam) for NF-κB p65 for 30 min in the dark. Nuclei were counterstained with DAPI for 5 min in the dark. Fluorescence images were captured under identical exposure settings for all groups. THY1 fluorescence intensity and nuclear NF-κB p65 signals were quantified using ImageJ (v1.80v). For each sample, at least three randomly selected fields were analyzed, and the mean fluorescence intensity (MFI) was calculated. Nuclear p65 fluorescence was quantified within DAPI-positive nuclear regions to better reflect NF-κB nuclear translocation.
Western Blotting Analysis
Cells were lysed in RIPA buffer supplemented with protease inhibitors (Beyotime Biotech, #P0013B), and protein concentrations were determined using a BCA assay kit (Thermo, #PL212989). Equal amounts of protein were resolved by SDS–PAGE using a 10% resolving gel and 6% stacking gel at 80 V for stacking and 120 V for separation, and then transferred to PVDF membranes. Membranes were blocked with 5% non-fat milk and incubated at 4°C overnight with primary antibodies against THY1 (1:1000; DF4804), phospho-IκBα (P-IKBα; 1:1000; AF2002), IκBα (1:1000; AF5002), NF-κB p65 (1:1000; AF5006), MMP13 (1:1000; AF5355), ADAMTS5 (1:1000; DF13268), COL2A1 (1:1000; AF0135), and GAPDH (1:3000; AF7012). All primary antibodies were rabbit polyclonal antibodies from Affinity Bioreagents (USA). Membranes were then incubated with HRP-conjugated goat anti-rabbit secondary antibody (1:10000; S0001) at 37°C for 2 h, and signals were detected using an electrochemiluminescence system (Share-BIO, SB-WB012). Densitometric analysis was performed using ImageJ (v1.80v), and target protein levels were normalized to GAPDH. All experiments were performed with at least three independent biological replicates.
Results
Identification of DEGs with Key WGCNA Modules
Based on the grouping design of the training dataset GSE57218, which includes HC samples as well as paired cartilage samples comprising OA lesional cartilage and the corresponding adjacent macroscopically preserved normal-appearing cartilage from the same OA patients, we performed the following analyses. First, to reduce technical bias and to ensure that data from different samples were comparable on the same scale, we applied batch-effect correction and standardized integration to the HC samples and the OA lesional samples (Figure 2A and B). On this basis, differential expression analysis revealed substantial differences between HC and OA lesional samples (Figure 2C and D). In total, 744 DEGs were identified, including 403 significantly downregulated genes and 341 significantly upregulated genes. Similarly, we performed batch-effect correction and standardized integration for the HC samples and OA adjacent samples (Figure S1A and B). Differential expression analysis (Figure S1C and D) also showed significant differences between these two groups, identifying 522 DEGs, of which 300 were significantly downregulated and 222 were significantly upregulated.
 |
Figure 2 DEG identification results and WGCNA analysis. (A and B) OA lesion area samples and HC samples before/after batch-debalancing and standardized integration. (C and D) Heatmaps and volcano plots showing DEG expression in OA lesion area samples and HC samples. (E) Sample clustering trait map. (F) Hierarchical clustering dendrogram of OA lesion and HC samples. Each branch represents a gene, with corresponding colors below branches indicating co-expressed modules. (G) Scatterplot of module, trait, and gene importance. (H) Scaleless fitting exponents and average connectivity of co-expression networks for OA lesion samples and HC samples under different soft threshold powers. (I) Heatmap showing correlations and significance between modules and clinical trait features. |
To investigate the association between genes and phenotypic traits, we performed WGCNA. The sample clustering dendrogram with trait heatmap clearly illustrated the relationships between individual samples and traits (Figure 2E). We selected an optimal soft-thresholding power of β = 11 (scale-free topology fit index R2 = 0.9) to construct the co-expression network across HC and OA samples (Figure 2H). Using dynamic hybrid tree cutting, we identified three color-coded modules in total (Figure 2F).Pearson correlation coefficients and corresponding significance levels between each module and clinical trait features were then calculated and visualized as a heatmap (Figure 2I). Among these modules, the turquoise module (containing 558 genes) showed a strong association with clinical traits (r = 0.84, P = 1×10⁻¹¹) and was therefore defined as the key module. Within this module, 301 genes with both GS and MM greater than 0.5 were considered key genes (Figure 2G). By intersecting the 744 DEGs from the OA lesional region, the 522 DEGs from the adjacent region, and the 301 key genes from the WGCNA key module, we identified 212 differentially expressed genes that were significantly associated with OA traits; these genes were defined as core genes (Figure S1E). Notably, these genes exhibited consistent aberrant expression patterns in both OA lesional and adjacent regions, and they also showed high gene significance within the co-expression module that was strongly correlated with OA clinical traits. Collectively, these findings suggest that the core genes may play pivotal regulatory roles in OA onset, progression, and lesion expansion.
Functional Enrichment Analysis of Core Genes
To elucidate the biological functions associated with the core genes, we performed GO and KEGG enrichment analyses. The GO enrichment results (Figure 3A–E) indicated that: (1) In the BP category, these genes were significantly enriched in processes related to extracellular matrix (ECM) organization and the structural organization of collagen fibril bundles. (2) In terms of CC, the genes may be involved in the synthesis of components such as the collagen-containing ECM and the endoplasmic reticulum. (3) For MF, the enriched terms were closely associated with ECM structural constituent and glycosaminoglycan binding. KEGG pathway analysis (Figure 3C and D) suggested that these genes were mainly involved in the PI3K–Akt signaling pathway and ECM–receptor interaction, among others. In addition, to further characterize the structural features, functional implications, and patterns of genetic transmission of the core genes, we generated a chromosomal localization circos plot (Figure 3F), in which 20 core genes are randomly displayed.
 |
Figure 3 GO and KEGG enrichment results. (A–E) GO bar charts, bubble charts, and circle plots. (C and D) KEGG bar charts and bubble charts. (F) Chromosomal localization circle plot of genes. All results shown meet the criteria of adjusted p < 0.05 and q < 0.05. |
Protein-Protein Interaction Network Analysis
To explore the interaction relationships among the core genes and to identify potential hub genes that may play key regulatory roles in OA, we performed a PPI network analysis (Figure 4). The PPI network constructed from the 212 core genes contained 160 nodes and 138 edges. Node color and size were mapped to betweenness centrality, where larger nodes with darker colors represent higher betweenness values. Based on this criterion, we identified 19 hub genes, including COL1A1, SPARC, THY1, PDK4, ZNF69, CTHRC1, HAPLN1, PRDX4, PNPLA2, ZNF549, VKORC1, DDIT3, HLA-B, SAFB2, IRF3, PNPLA7, TXNIP, ZNF358, and POLR2A.
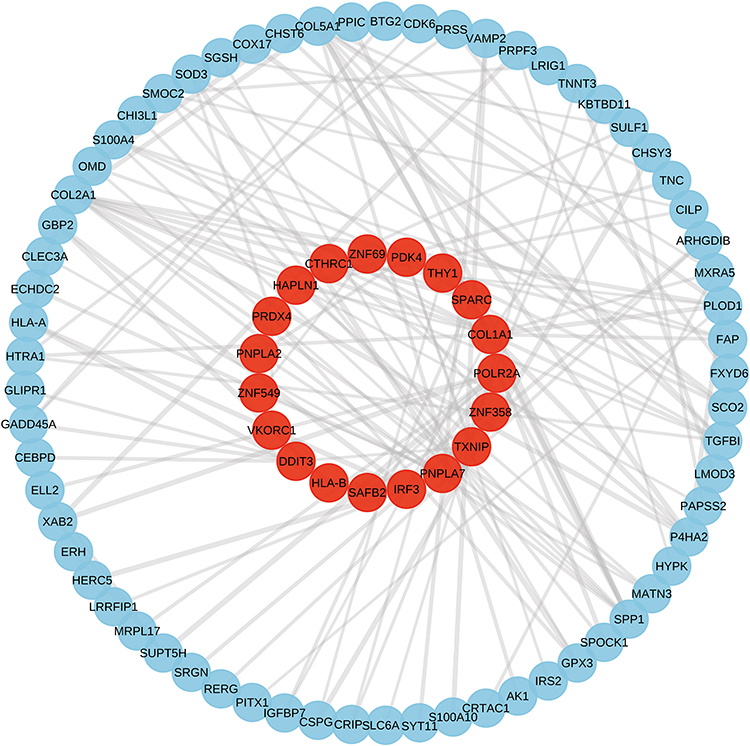 |
Figure 4 PPI Network Analysis. |
Genetic Correlation Reshaping Reveals Disruption of Synergistic Regulatory Networks For Hub Genes in OA States
Based on the 19 hub genes identified from the PPI network analysis, we further compared their co-expression regulatory network characteristics between HC cartilage and OA cartilage. Pearson correlation analysis (|r| > 0.3, p < 0.05) showed that, compared with the highly coordinated and stable pattern of gene co-regulation observed in the HC group, the correlation architecture among these hub genes was substantially remodeled in the OA group, characterized by an overall reduction in coordination accompanied by pronounced network disruption (Figure 5A).Among these changes, the regulatory relationship between THY1 and COL1A1 was particularly notable In the HC group, THY1 expression exhibited an extremely strong positive correlation with COL1A1 (r = 0.99, p < 0.001), suggesting that the two genes may be co-regulated and act synergistically to maintain cartilage structural homeostasis under normal conditions. However, in the OA group, although the correlation remained positive, its strength decreased markedly (r = 0.52, p = 0.015), yielding a correlation change of Δr = −0.47, which clearly indicates a breakdown of their coordinated regulation in the disease state. This loss of coordination was visually confirmed by the correlation-difference plot, reflecting a transition of the gene regulatory network from a stable homeostatic state to a highly heterogeneous state during OA development. To further characterize the global network features of correlation changes among hub genes, we constructed a gene co-regulatory network based on differential correlations (Figure 5B). The results showed that, under OA conditions, the connectivity among hub genes was markedly rearranged: the correlation strength between most hub-gene pairs was either weakened or strengthened, and for some pairs, the direction of association even reversed (from positive to negative or vice versa).Meanwhile, comparison of the average expression levels of hub genes between HC and OA samples (Figure 5C) indicated that although some genes exhibited significant upregulation or downregulation in OA, these expression shifts did not fully correspond to the observed changes in correlation architecture. This suggests that aberrant gene expression and disrupted co-regulatory coordination may occur asynchronously during OA progression, further highlighting the complex remodeling of transcriptional regulatory networks in the disease state.
 |
Figure 5 Comparative analysis of correlation patterns and expression characteristics of hub genes under healthy control (HC) and osteoarthritis (OA) conditions. (A) Correlation heatmap of co-expressed hub genes, illustrating gene correlations within HC and OA groups and intergroup correlation differences. (B) Gene co-regulation network diagram based on correlation differences. (C) Scatter plot of average expression levels for hub genes, showing expression trends in HC versus OA conditions. |
Acquisition of Disease Characterization Genes
We applied three machine-learning algorithms (RF, LASSO, and SVM) to further prioritize candidate markers from the 19 hub genes. Using the RF model, we identified two feature genes, THY1 and COL1A1 (Figure 6A and B), whose importance scores were markedly higher than those of all other candidate genes, indicating their dominant contribution to the model. Using LASSO regression, we performed 10-fold cross-validation and selected the number of genes corresponding to the minimum cross-validation error (Figure 6C and D), resulting in eight feature genes: COL1A1, THY1, ZNF69, CTHRC1, PNPLA2, ZNF549, DDIT3, and POLR2A.Similarly, using the SVM algorithm with 10-fold cross-validation, we selected the gene set at the minimum cross-validation error (Figure 6E and F) and obtained nine feature genes: DDIT3, ZNF549, VKORC1, COL1A1, PNPLA2, HAPLN1, POLR2A, CTHRC1, and THY1. Finally, we intersected the feature genes derived from the three algorithms (Figure 6G) and identified two diagnostic biomarkers, THY1 and COL1A1.
 |
Figure 6 Feature gene selection using RF, LASSO, and SVM algorithms. (A) Ranking of gene importance. (B) Relationship between tree count and error rate. (C and D) LASSO model and its coefficient curve from ten-fold cross-validation. Vertical dashed lines indicate optimal lambda values. (E and F) SVM accuracy plots and cross-validation error plots. (G) Venn diagram showing the intersection of results from the three algorithms. |
Establishment and Evaluation of ROC Curve Models
We constructed ROC models for THY1 and COL1A1 using samples from both the training and validation datasets. The ROC curves and the AUC were used to evaluate the diagnostic specificity and sensitivity of THY1 and COL1A1 for OA; an AUC > 0.7 was considered indicative of good predictive performance. In the training set derived from the OA lesional region, the AUCs for THY1 and COL1A1 were 0.883 and 0.900, respectively (Figure 7A). In the OA adjacent region and the corresponding validation set, the AUCs for THY1 were 0.874 and 0.771, respectively, while those for COL1A1 were 0.874 and 0.798, respectively (Figure 7D and G).
 |
Figure 7 Construction of ROC curve models. (A–G) ROC curve models for training and validation sets. (B–H) Box plots showing differential expression of THY1 between training and validation samples. (C–I) Box plots showing differential expression of COL1A1 between training and validation samples. (J–L) Calibration curves for training and validation sets. |
In addition, we validated the differential expression of THY1 (Figure 7B–H) and COL1A1 (Figure 7C–I) across the three datasets. Both genes were significantly upregulated in OA. Specifically, in the training set from the OA lesional region, the P values for THY1 and COL1A1 were 0.00077 and 0.0011, respectively. In the OA adjacent region and the corresponding validation set, the P values for THY1 were 0.0011 and 0.0009, respectively, whereas the P values for COL1A1 were 0.0022 and 0.00023, respectively.
Establishment and Evaluation of the Nomogram Clinical Prediction Model
We constructed a nomogram-based predictive model incorporating THY1 and COL1A1 to evaluate their clinical diagnostic value for OA. First, calibration curves were used to assess the agreement between predicted probabilities and observed outcomes; a slope closer to 1 indicates higher model accuracy. The results demonstrated good calibration performance of the model in both the OA lesional training set (Figure 7J) and the OA adjacent set as well as the corresponding validation set (Figure 7K and L).In the nomogram, each biomarker gene is assigned a specific score, and the total score is obtained by summing the individual gene scores, thereby reflecting the predicted risk of OA. In the OA lesional training set (Figure 8A), when the combined total score of THY1 and COL1A1 reached 115, the predicted probability of OA exceeded 90%. In addition, decision curve analysis (DCA) and clinical impact curves (CICs) were applied to further evaluate the clinical utility of the nomogram model. The results showed that, in the OA lesional training set (Figure 8B and C), the prediction model based on THY1 and COL1A1 achieved a higher net benefit than the “All” and “None” strategies across a wide range of threshold probabilities.
 |
Figure 8 Construction of the Nomogram Clinical Prediction Model. (A–G) Nomogram prediction models based on THY1 and COL1A1, applied to the OA lesion training set, OA adjacent region, and validation set samples, respectively, to predict individual risk of developing OA. (B–H) Clinical impact curves showing the number of individuals predicted as high-risk at different threshold probabilities and the number of true OA events among them. (C–I) Decision curve analysis comparing the net benefit of the nomogram model versus the “All” and “None” strategies at different threshold probabilities. |
In the OA adjacent set (Figure 8D–F), when the combined total score reached 92, the predicted probability exceeded 90%. Similarly, the model maintained a relatively high net benefit over most threshold probability intervals. In the validation set (Figure 8G–I), when the combined total score reached 145, the predicted probability likewise exceeded 90%, with the prediction curve consistently lying above the “All” and “None” curves, suggesting good model stability and generalizability. Similarly, the CICs in the OA adjacent set and the validation set further indicated that, as the threshold probability increased, the number of individuals classified as high risk gradually decreased, while the number of true OA events among the high-risk population remained in good agreement with model predictions, demonstrating favorable risk stratification capability. Collectively, these findings suggest that the THY1- and COL1A1-based nomogram provides consistent clinical net benefit across different cohorts and has potential value as an auxiliary tool for OA diagnosis.
Single-Cell Transcriptomic Analysis Reveals Abnormal Expression And Differentiation Dynamics of Thy1 In Osteoarthritic Chondrocytes
After quality control and batch-effect correction of the raw single-cell transcriptomic data, a total of 32,766 cells were retained. Using t-distributed stochastic neighbor embedding (t-SNE) combined with the Single-Cell Signature Annotator (SCSA) for cell-type annotation, HC chondrocytes were clustered into 9 cell clusters (Figure 9A and B), whereas OA chondrocytes were partitioned into 12 clusters (Figure 9G and H). On this basis, we compared the expression pattern of THY1 in HC and OA chondrocytes at the single-cell level (Figure 9C and I). Differential expression analysis (Figure S2A) showed that, compared with HC, THY1 was significantly upregulated in the OA single-cell transcriptome (adj. p = 4.44e−286).
 |
Figure 9 Single-cell transcriptomic analysis of human HC and OA. (A and B) t-SNE plots showing HC chondrocytes clustered into 9 clusters. (C) Expression of THY1 across HC chondrocyte clusters. (D–F) Pseudo-time trajectory plots of HC cartilage cell clusters. (G and H) t-SNE plot of OA cartilage cells clustered into 12 clusters. (I) THY1 expression in each OA cartilage cell cluster. (J–L) Pseudo-time trajectory plots of OA cartilage cell clusters. |
To further investigate the dynamic changes of THY1 during chondrocyte differentiation, we performed pseudotime trajectory analysis separately for HC and OA samples. In the HC single-cell transcriptome, chondrocytes exhibited five differentiation trajectories (Figure 9D and E), where trajectory 1 represented the initiation stage and trajectory 3 represented the terminal stage (Figure 9F). Differential analysis between trajectory 1 and trajectory 3 (Figure S2B) indicated that THY1 was significantly downregulated in cells at the terminal differentiation stage. In contrast, in the OA single-cell transcriptome, chondrocytes also displayed five trajectories (Figure 9J and K), with trajectory 1 corresponding to the initiation stage and trajectory 5 to the terminal stage (Figure 9L). Differential analysis between trajectory 1 and trajectory 5 (Figure S2C) showed that THY1 was significantly upregulated in terminal-stage cells.
Co-Expression Patterns, Transcriptional Regulatory Networks, and Pathway Enrichment Analysis of THY1
To systematically evaluate the co-expression relationships between THY1 and other genes, we performed both Pearson correlation and Spearman rank correlation analyses to calculate the correlation coefficients and corresponding significance levels between THY1 and genome-wide genes (Table S1). The results showed that 1,214 genes were significantly negatively correlated with THY1 expression. The two correlation methods exhibited good consistency, with the strongest correlation coefficient reaching r = 0.747 (Figure 10A). Meanwhile, 1,554 genes were significantly positively correlated with THY1 expression, with the maximum correlation coefficient reaching r = 0.889 (Figure 10B). Collectively, these findings indicate that the THY1-associated co-expressed gene set is highly robust.
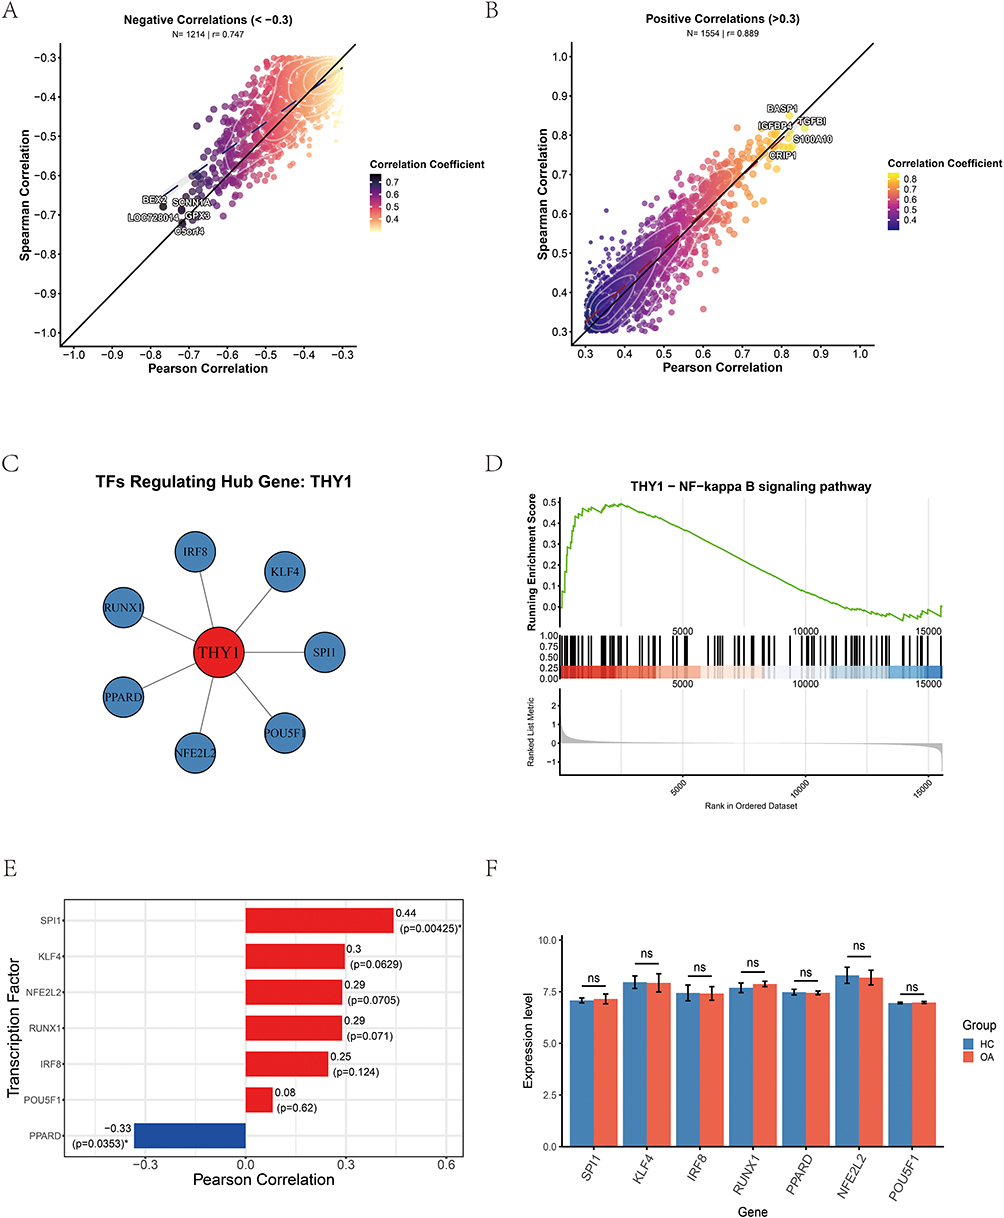 |
Figure 10 Co-expression analysis, transcription factor prediction, and pathway enrichment analysis of THY1. (A and B) Consistency analysis of Pearson and Spearman correlation coefficients among significantly negatively/positively correlated co-expressed genes with THY1. (C) Transcriptional regulatory network constructed based on positively correlated co-expressed genes of THY1, revealing potential upstream transcription factors. (D) GSEA enrichment analysis results for THY1. (E) Expression correlation analysis between THY1 and key candidate transcription factors. (F) Differential expression analysis of key transcription factors in HC and OA samples. Statistical significance is indicated as *P < 0.05; ns indicates no statistical significance. |
Based on the THY1 positively correlated co-expression gene set, we further performed an enrichment analysis to identify potential upstream transcription factors (TFs). Systematic screening was conducted using ChEA_2022 (Table S2), TF Perturbations (Table S3), ARCHS4 TFs Coexp (Table S4), and the ENCODE/ChEA consensus database (Table S5). We then intersected the enriched TFs from these resources and constructed a THY1-centered transcriptional regulatory network (Figure 10C). The results suggested that THY1 may be potentially regulated by TFs such as IRF8, KLF4, SPI1, RUNX1, NFE2L2, PPARD, and POU5F1.Subsequent correlation analysis in the training dataset (Figure 10E) showed that SPI1 expression was significantly positively correlated with THY1 (r = 0.44, P = 0.00425), whereas PPARD was significantly negatively correlated with THY1 (r = −0.33, P = 0.0353). However, differential expression analysis of these candidate TFs (Figure 10F) indicated that none of them exhibited significant expression differences between the HC and OA groups. This finding implies that the aberrant expression of THY1 may not be directly driven by expression-level changes of a single upstream TF, but rather may involve more complex regulatory mechanisms.
Furthermore, GSEA of THY1-related genes (Figure 10D) demonstrated significant enrichment in the NF-κB signaling pathway, with a positive enrichment pattern. Together, these results indicate a significant association between the THY1-related gene network and NF-κB signaling within the OA-related molecular regulatory landscape, providing a rationale for further investigating potential functional synergy between THY1 and the NF-κB pathway.
THY1 Expression Is Upregulated in Human OA and Experimental OA Rat Models
To validate the expression pattern of THY1, we performed immunohistochemical (IHC) analysis on cartilage tissues from both humans and rats (Figure 11A and C). Consistent with our previous findings, THY1 expression was markedly increased in OA cartilage tissues from both species. Quantitative analysis of the IHC staining (Figure 11B and D) further confirmed that THY1 was significantly upregulated in OA cartilage, with statistical significance (P < 0.05).
 |
Figure 11 Immunohistochemical analysis and expression levels of molecular markers for THY1 in human and rat cartilage. (A and B) Immunohistochemical analysis and quantitative analysis of human cartilage. (C and D) Immunohistochemical analysis and quantitative analysis of rat cartilage. Sample sizes: human cartilage (HC, n = 2; OA, n = 4); rat cartilage (HC, n = 6; OA, n = 6). Statistical significance is indicated as ***P < 0.001. |
On this basis, to further assess OA-associated molecular pathological changes, we examined the expression levels of several key markers in human and rat cartilage tissues, including NF-κB p65, MMP13, ADAMTS5, and COL2A1. The results showed that, compared with the HC group, OA cartilage tissues exhibited significantly higher levels of NF-κB p65, MMP13, and ADAMTS5, whereas COL2A1 expression was markedly reduced. Corresponding quantitative analyses further confirmed that the differences in these molecules between the OA and HC groups were statistically significant. Collectively, these results indicate that aberrant THY1 upregulation in OA cartilage is accompanied by activation of inflammation-related signaling and remodeling of the chondrocyte ECM.
Potential Crosstalk Between THY1 Expression and NF-κB Signaling Activity in OA Chondrocytes
In the aforementioned analyses, we observed that THY1 was significantly upregulated in OA cartilage. However, the transcription factor prediction and regulatory network analyses did not identify any classical upstream transcriptional regulators that could directly account for this aberrant overexpression. In contrast, enrichment analyses consistently pointed to a marked activation of the NF-κB signaling pathway. These findings suggest that the abnormal elevation of THY1 in OA chondrocytes is unlikely to be directly driven by expression-level changes in a single upstream transcription factor; instead, it may be embedded within an inflammation-associated feedback regulatory network. Based on this rationale, we further examined whether THY1 expression is associated with NF-κB signaling activity under inflammatory and OA-related conditions at the cellular level.
Immunofluorescence analysis (Figure 12A) showed that in HC chondrocytes, NF-κB p65 was predominantly localized in the cytoplasm and THY1 expression was low. Following TNF-α stimulation, p65 exhibited pronounced nuclear translocation, accompanied by a marked increase in THY1 fluorescence. In contrast, treatment with the NF-κB inhibitor BAY 11–7082 effectively reversed p65 nuclear translocation and suppressed the upregulation of THY1.By comparison, in OA chondrocytes, p65 displayed a sustained nuclear localization and THY1 expression was markedly elevated. Notably, after THY1 knockdown, the nuclear p65 signal was clearly reduced. Quantification of the immunofluorescence signals (Figure 12B) further confirmed that under TNF-α stimulation, both THY1 fluorescence intensity and nuclear NF-κB p65 signals were significantly increased in HC chondrocytes, whereas BAY 11–7082 significantly decreased the fluorescence intensities of both, restoring them to near-baseline levels. Meanwhile, OA chondrocytes exhibited significantly higher THY1 and nuclear p65 fluorescence intensities than HC cells, and both signals were markedly reduced after THY1 knockdown. All differences were statistically significant (P < 0.05).
 |
Figure 12 Potential crosstalk between THY1 expression and NF-κB signaling activity in OA chondrocytes. (A) Immunofluorescence results showing subcellular localization of NF-κB p65 and THY1 expression under different treatment conditions. Green indicates p65, red indicates THY1, and blue indicates DAPI-stained nuclei. (B) Quantitative analysis of fluorescence intensity. %Compared with the HC group; #Compared with the HC + TNF-α group; @Compared with the HC + TNF-α + BAY 11–7082 group; ^Compared with the OA group; $Compared with the OA + scramble group; P < 0.05 indicates statistically significant differences. (C) Western blot quantification of THY1, NF-κB pathway-related proteins, and matrix metabolism-related proteins in HC and OA chondrocytes. Statistical significance is indicated as ***P < 0.001 (D) Quantitative analysis of NF-κB pathway-related proteins and THY1 expression in HC chondrocytes after TNF-α and BAY 11–7082 treatment. % indicates comparison with HC group; # indicates comparison with HC + TNF-α group; and indicates comparison with HC + BAY 11–7082 group; P < 0.05 indicates statistically significant differences. (E) Quantitative analysis of NF-κB pathway activity and expression of matrix metabolism-related proteins in OA chondrocytes following THY1 knockdown and combined BAY 11–7082 treatment. Statistical significance is indicated as *P < 0.05, **P < 0.01, and ***P < 0.001; ns indicates no statistical significance. (F) Representative Western blot images of relevant proteins under different experimental conditions. All data are expressed as mean ± SD from at least three independent experiments. |
Subsequently, we performed Western blotting to systematically dissect the regulatory relationship between THY1 and NF-κB from both signaling and functional perspectives (Figure 12F). Compared with HC chondrocytes, OA chondrocytes exhibited a marked increase in THY1 protein expression, accompanied by enhanced IκBα phosphorylation and activation of NF-κB p65, indicating a persistently activated NF-κB pathway. Consistently, OA cells showed increased expression of matrix-degradation–associated proteins MMP13 and ADAMTS5, together with decreased COL2A1, reflecting a typical catabolic phenotype.
In HC chondrocytes, TNF-α stimulation was accompanied by NF-κB pathway activation and increased THY1 expression, whereas the NF-κB inhibitor BAY 11–7082 attenuated these changes. These findings suggest that THY1 upregulation under inflammatory stimulation is associated with NF-κB pathway activity. Furthermore, in OA chondrocytes, THY1 knockdown was associated with reduced NF-κB pathway activity, decreased expression of catabolism-related proteins, and partial restoration of COL2A1 expression. Importantly, combining THY1 knockdown with BAY 11–7082 further strengthened the inhibitory effects, reducing NF-κB activity and catabolic protein levels to their lowest observed levels. Quantitative analysis of Western blot signals (Figure 12C–E) statistically validated these trends, showing significant differences in key pathway and functional proteins across treatment groups (P < 0.05). Taken together, these findings support a bidirectional association between THY1 and NF-κB signaling, in which NF-κB activation promotes THY1 expression, while THY1 may in turn influence NF-κB pathway activity. This interaction may contribute to maintaining a sustained inflammatory and catabolic state in OA chondrocytes. However, the present data do not establish a direct causal interaction or a definitive positive feedback loop between THY1 and NF-κB signaling, and further mechanistic studies are required to clarify this relationship.
Molecular Docking-Based Evaluation of THY1 Binding Properties: Analysis of Potential for Commonly Used Drugs
To advance the treatment of OA, we focused on investigating the binding properties of THY1 as a potential therapeutic target. Using molecular docking, we systematically compared the binding performance of four commonly used agents—celecoxib, diclofenac, quercetin, and berberine—toward THY1 (Table 1). The results indicated that berberine (Figure 13A) achieved the most favorable docking score (−6.4 kcal/mol) among the four compounds and was predicted to bind to a pocket on chain A with an estimated volume of 68 Å3. Docking was performed within a search space defined by a 22 × 22×22 Å grid box. A total of 16 contacting residues were identified, with ARG, GLN, and LEU occurring most frequently, suggesting a well-defined interaction interface that may be relevant for ligand recognition by THY1.Celecoxib (Figure 13B) also exhibited a strong docking profile, with a docking score of −6.1 kcal/mol, and was predicted to occupy a pocket on chain A with an estimated volume of 68 Å3 (grid box: 22×22 × 32 Å). The binding site involved 18 contacting residues, predominantly SER, LYS, and TYR. The contacting residues were more broadly distributed, implying that the interaction may be stabilized through the collective contribution of multiple residues. For quercetin (Figure 13C), the docking score was −6.2 kcal/mol. Quercetin was predicted to bind within a pocket with an estimated volume of 77 Å3, using a 21 × 21×21 Å grid box, and involved 21 contacting residues. SER and LYS were among the most frequently contacted residues, suggesting that polar interactions (eg., hydrogen bonding) may contribute to stabilizing the quercetin–THY1 association. In contrast, diclofenac (Figure 13D) showed the weakest docking performance, with a docking score of −5.4 kcal/mol. It was predicted to bind to a smaller pocket (estimated volume: 59 Å3; grid box: 19 × 19×19 Å) involving 18 contacting residues, mainly SER and LYS. The contacting residues appeared relatively concentrated, suggesting that diclofenac may interact with a more localized region of THY1 and exhibit a comparatively lower binding preference.
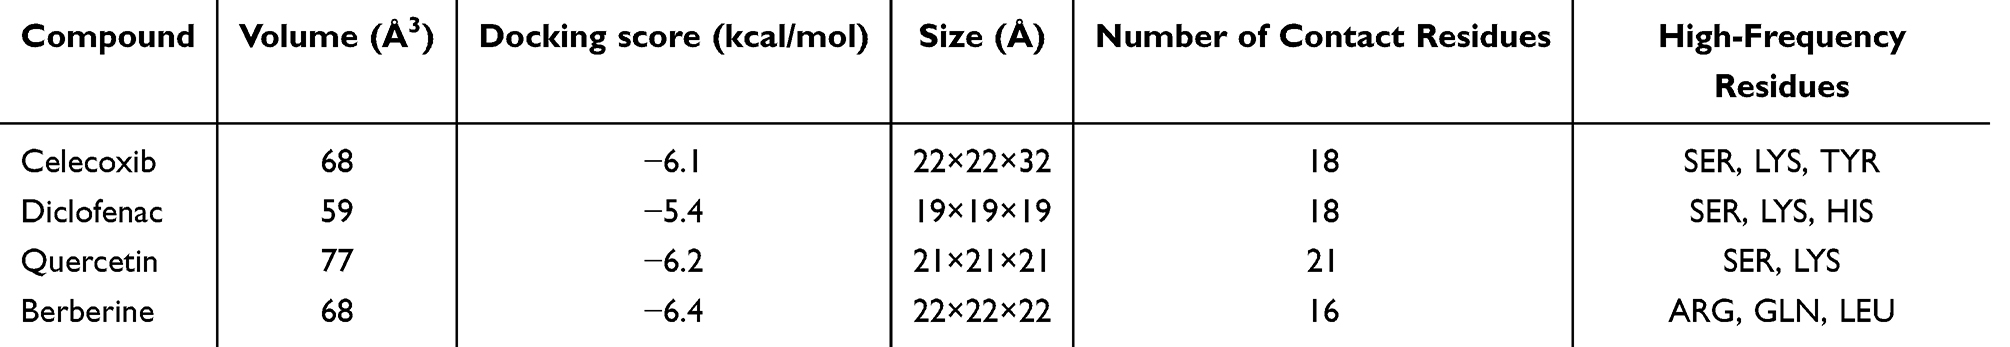 |
Table 1 Molecular Docking Analysis |
 |
Figure 13 Molecular docking analysis results of four candidate drugs with THY1. (A) Berberine. (B) Celecoxib. (C) Quercetin. (D) Diclofenac. |
Based on these findings, berberine exhibited the most favorable predicted binding affinity toward THY1 among the tested compounds and was therefore selected for further molecular dynamics simulations.
Molecular Dynamics Simulation of Berberine Interaction with THY1: Analysis of Stability, Key Residues, and Binding Mechanism
To validate the binding mode predicted by molecular docking and to further investigate the dynamic interaction features and potential inhibitory mechanism of berberine against THY1, we performed a 100-ns MD simulation of the THY1–berberine complex. Through direct visualization and quantitative analyses, we assessed whether berberine remained stably located within the THY1 binding site throughout the simulation. RMSD analyses (Figure 14A–E) showed that during the early stage of the simulation (0–30 ns), the complex rapidly reached equilibrium and maintained a low RMSD, indicating high initial stability of the THY1–berberine complex. Subsequently, during 40–80 ns, the protein RMSD exhibited certain fluctuations but did not show sustained divergence; instead, it re-stabilized at a new plateau in the later stage. This suggests that berberine binding may induce conformational rearrangement of THY1, leading to a new stable conformational state rather than structural destabilization. In contrast, the RMSD of berberine remained consistently low throughout the simulation (< 0.07 nm), indicating that berberine was highly stable within the binding pocket without evident dissociation or relocalization.
 |
Figure 14 Molecular dynamics (MD) simulation analysis of the THY1–berberine complex over 100 ns.(A) Time evolution of RMSD for the whole complex, the protein backbone, and the ligand (berberine).(B) Time evolution of RMSD for the whole complex.(C) Per-residue RMSF profile of THY1.(D) Time evolution of the solvent-accessible surface area (SASA) of THY1.(E) Time evolution of ligand (berberine) RMSD to assess ligand stability within the binding pocket.(F) Time evolution of the number of hydrogen bonds between THY1 and berberine.(G) Two-dimensional Gibbs free energy landscape constructed by principal component analysis (PCA), with PC1 and PC2 as axes.(H) Corresponding three-dimensional Gibbs free energy landscape showing the major stable conformational states and energy distribution of the system. |
To further evaluate the impact of berberine binding on the local flexibility of THY1, we calculated the per-residue RMSF. The results (Figure 14C) showed that the main body of THY1 (approximately residues 20–120) exhibited overall low fluctuations, indicating that the core conformation remained relatively stable during the 100-ns simulation. Meanwhile, the berberine-contacting residues were mainly distributed within residues 20–87 and were largely located in a low-fluctuation plateau region, suggesting that the binding pocket resides within a relatively rigid core region with favorable conformational stability. This structural context is conducive to maintaining sustained pocket occupancy and stable ligand binding. In contrast, the terminal regions of the protein displayed more pronounced fluctuations, which are more likely attributable to intrinsic terminal flexibility rather than ligand-induced structural instability. SASA analysis (Figure 14D) showed a marked decrease in SASA at the early stage of the simulation, followed by stabilization after approximately 25 ns, suggesting that THY1 adopts a more compact conformation upon berberine binding and subsequently maintains a steady state, consistent with an overall stable complex in the later phase. At the molecular interaction level, hydrogen-bond analysis (Figure 14F) indicated that the number of hydrogen bonds between berberine and THY1 was predominantly maintained at 0–1 throughout the simulation, and the occurrence of a single hydrogen bond was mostly transient, reflecting an evidently intermittent pattern. These results suggest that stable ligand–receptor binding does not rely on a persistent hydrogen-bond network. Instead, hydrogen bonds may primarily serve an auxiliary role in positioning, whereas complex stability is likely maintained predominantly by hydrophobic and other non-bonded interactions.
Furthermore, the Gibbs free energy landscape constructed based on principal component analysis (PCA) (Figure 14G and H) revealed a clear energetic preference in the conformational distribution of the THY1–berberine system in PC space. A distinct dominant low–free-energy basin was observed, and the basin appeared relatively deep, indicating that the system tends to converge and stabilize into a limited number of favorable conformational states during the simulation. Meanwhile, the conformational distribution was mainly extended along a continuous channel, suggesting a transition from higher-energy conformations toward a lower-energy stable state, which further supports the stability of berberine binding to THY1.
To further validate the stable binding mode observed in the MD simulations, we performed MM/PBSA binding free energy calculations based on the trajectory from the equilibrated phase (70–100 ns) (Table 2). The total binding free energy (ΔG_bind) was −31.73 ± 3.78 kcal/mol, indicating that the THY1–berberine interaction is energetically favorable and consistent with the stable association observed in the MD simulations. Energy decomposition analysis showed that the gas-phase interaction energy (ΔG_GAS = −47.01 ± 6.69 kcal/mol) provided the dominant favorable contribution to binding. Notably, van der Waals interactions (ΔE_vdW = −47.48 ± 3.36 kcal/mol) were the primary driving force, highlighting the importance of hydrophobic contacts and tight intermolecular packing in stabilizing the complex. In contrast, the electrostatic contribution was marginal on average (ΔE_elec = 0.47 ± 5.73 kcal/mol), suggesting that electrostatic interactions do not play a major stabilizing role in this system. The solvation free energy (ΔG_SOLV = 15.28 ± 5.12 kcal/mol) contributed unfavorably to binding, reflecting an energetic penalty associated with desolvation upon complex formation. This unfavorable effect was mainly derived from the polar solvation term (ΔG_polar = 18.97 ± 5.15 kcal/mol), whereas the nonpolar solvation energy (ΔG_nonpolar = −3.69 ± 0.12 kcal/mol) provided a modest favorable contribution that partially compensated for the polar solvation penalty. Together, these results indicate that THY1–berberine binding is predominantly driven by van der Waals/hydrophobic interactions, while polar solvation opposes complex formation. Per-residue energy decomposition analysis further supported this conclusion (Figure S3). LEU14 made the largest favorable contribution (−0.945 kcal/mol), underscoring its key role in stabilizing berberine through hydrophobic interactions. VAL16 also contributed favorably (−0.643 kcal/mol), consistent with the hydrophobic nature of the binding pocket. Other residues, including ARG18 and GLN15, exhibited only minor contributions, suggesting a limited role in direct ligand stabilization.
 |
Table 2 MM/PBSA Binding Free Energy Analysis of the THY1–Berberine Complex |
Discussion
OA often undergoes a prolonged preclinical phase before pain and functional impairment become apparent, during which structural remodeling, metabolic imbalance, and disruption of the joint microenvironment may progressively accumulate.1,11 This covert disease course frequently delays clinical diagnosis until cartilage degeneration has substantially progressed, thereby limiting the opportunity for early intervention. Therefore, identifying molecular entry points with both diagnostic and therapeutic relevance is important for improving early OA management.47
Increasing evidence indicates that dysregulated innate immune responses and low-grade chronic inflammation are closely involved in OA progression.7 Pro-inflammatory cytokines such as IL-1β, TNF-α, and IL-6 can activate downstream pathways, including NF-κB and PI3K-AKT, thereby promoting catabolic responses, suppressing extracellular matrix synthesis, and contributing to cartilage destruction.9,47 Within this immune inflammation–driven pathological framework, we focused on THY1 and, supported by an integrative multi-cohort analytical strategy together with experimental evidence, found that THY1 holds promise as a candidate diagnostic biomarker and may be involved in OA-related inflammatory and matrix-remodeling processes, suggesting its potential translational relevance.
In this study, to reduce technical bias and ensure that data from different samples were comparable on the same scale, we performed batch-effect correction and standardized integration of the expression data. Based on the grouping design of the training dataset GSE57218, which includes HC samples as well as paired cartilage samples comprising OA lesional cartilage and the corresponding adjacent macroscopically preserved normal-appearing cartilage from the same OA patients, we performed integrative analyses to identify genes associated with OA. Through differential expression and co-expression network analyses, we identified a set of core genes. Notably, these genes not only exhibited consistent aberrant expression patterns in both the OA lesional and adjacent regions, but also showed high gene significance within the co-expression module that was strongly correlated with OA clinical traits. This suggests that they may contribute to OA initiation and progression and play key regulatory roles during lesion expansion. To elucidate the biological functions of these core genes, we performed GO and KEGG enrichment analyses. The results indicated that these genes are mainly involved in ECM organization–related processes as well as key signaling pathways such as PI3K–Akt and ECM–receptor interaction. These findings suggest a close association with cartilage structural remodeling and OA-related signaling pathways. Next, to explore the interaction relationships among the core genes and to identify potential hub genes that may play key regulatory roles in OA, we performed a PPI network analysis. Based on betweenness centrality, we identified 19 hub genes with potential regulatory significance. We further compared the co-expression network characteristics of the hub genes between HC and OA cartilage and observed a marked remodeling of network architecture under OA conditions, characterized by reduced coordination and disrupted gene–gene interactions. Notably, the relationship between THY1 and COL1A1 was substantially altered, with a marked reduction in their coordinated expression pattern in OA. These findings suggest that gene co-regulation in OA shifts from a stable and coordinated state toward a more heterogeneous and dysregulated network structure. Furthermore, changes in correlation patterns were not always consistent with changes in gene expression levels, indicating that transcriptional dysregulation and network reorganization may occur asynchronously during OA progression. Given the markedly elevated expression of THY1 in OA cartilage, these findings suggest that aberrant THY1 activation may represent more than a simple upregulation event and could instead function as a potential early driver. From a mechanistic perspective, THY1 may be associated with a shift of chondrocytes from a homeostatic state toward an abnormal fibrosis-like or remodeling-related phenotype, potentially involving altered co-expression with matrix-related genes such as COL1A1. Notably, multiple THY1-associated regulatory edges were significantly weakened in OA, further supporting a pivotal role for THY1 in decoupling the regulatory network under disease conditions. However, we cannot exclude the possibility that changes in cellular composition within OA tissues (eg., fibrocartilaginous metaplasia) may influence the observed gene–gene correlation patterns. Therefore, the results may partially reflect variations in the relative abundance of different cell types rather than purely representing true regulatory decoupling. To enhance the robustness and potential clinical relevance of the identified genes, we applied three machine-learning algorithms (RF, LASSO, and SVM-RFE) to select key features from the hub genes, ultimately identifying THY1 and COL1A1 as candidate biomarkers.Subsequent validation using ROC analyses across multiple datasets indicated that both genes exhibited consistent diagnostic value for OA and were significantly upregulated under disease conditions. Furthermore, the nomogram-based model suggested that THY1 and COL1A1 may contribute to risk prediction and stratification, with overall good agreement between predicted and observed outcomes. Collectively, these results support the clinical potential of THY1 and COL1A1 from two complementary modeling perspectives. First, the ROC-based diagnostic model primarily focuses on discriminating OA from non-OA samples. Second, the nomogram model further addresses whether an individual’s disease risk can be reliably quantified and whether such risk estimates translate into actionable decision benefit under clinically relevant thresholds (ie., at the level of prediction and decision support). Taken together, these two approaches extend the evidence from mere “statistical discrimination” to “clinical usability,” thereby more strongly suggesting that THY1 and COL1A1 may serve as candidate molecular signatures and diagnostic prediction tools for OA. To explore the dynamic changes of THY1 during chondrocyte differentiation, we performed single-cell transcriptomic analyses using samples from GSE220243.Consistent with bulk transcriptomic results, THY1 was significantly upregulated in OA cartilage at the single-cell level. Pseudotime analysis further suggested that THY1 expression exhibits dynamic changes along chondrocyte differentiation trajectories, with an overall increasing trend under OA conditions. These findings indicate that THY1 may be associated with disease-related cellular state transitions and could reflect progression-related changes in OA chondrocytes.
To further dissect potential upstream regulators of aberrant THY1 expression and to explore its associated downstream pathways, we first systematically assessed THY1 co-expression with other genes at a genome-wide level and identified a set of THY1-associated genes. Subsequently, upstream transcription factor enrichment analysis suggested multiple candidate regulators of THY1; however, none of these candidates showed significant differential expression between HC and OA groups, indicating that THY1 dysregulation is unlikely to be driven by a single upstream factor. Instead, it may involve more complex regulatory layers or multi-factor coordination. In line with this, GSEA suggested that THY1 is potentially involved in the NF-κB signaling pathway with a positive enrichment trend. Together with our earlier GO/KEGG results indicating THY1-related involvement in ECM regulation and the PI3K–Akt signaling pathway, these lines of evidence collectively support a close coupling between THY1 expression changes and the canonical inflammation-related signaling axis in OA. Accordingly, we hypothesize that aberrant THY1 expression in OA chondrocytes is more likely embedded within an inflammation-driven regulatory network rather than being caused by altered expression of a single upstream TF. Based on this hypothesis, we further investigated at the cellular level whether a mutually reinforcing regulatory relationship exists between THY1 and NF-κB signaling. IHC analysis in human and rat cartilage confirmed that THY1 expression is elevated in OA, consistent with bioinformatic results. In parallel, OA tissues exhibited molecular features indicative of enhanced inflammatory signaling and matrix degradation. Collectively, these results suggest that aberrant THY1 upregulation in OA cartilage co-occurs with enhanced NF-κB–associated inflammatory signaling and a molecular phenotype indicative of matrix degradation/homeostatic imbalance, supporting the notion that THY1 may be embedded within the OA inflammation–matrix remodeling axis–related molecular network. Immunofluorescence analysis further suggested a concordance between THY1 expression and NF-κB activation status, as reflected by p65 nuclear localization under inflammatory conditions and its attenuation following pathway inhibition or THY1 knockdown. We then performed Western blotting to systematically dissect the THY1–NF-κB regulatory relationship at both pathway and functional levels. OA chondrocytes exhibited increased THY1 expression and activation of NF-κB signaling, accompanied by a catabolic molecular phenotype. In HC chondrocytes, TNF-α stimulation induced NF-κB activation and upregulated THY1, whereas NF-κB inhibition attenuated these effects, suggesting an association between NF-κB activity and THY1 expression. Furthermore, THY1 knockdown was associated with reduced NF-κB pathway activity and partial restoration of matrix-related markers, with enhanced effects observed upon combined inhibition. Collectively, these findings suggest a potential interaction between THY1 and NF-κB signaling in OA chondrocytes, although the precise regulatory mechanism remains to be further clarified.
To further explore the translational potential of THY1, we evaluated the predicted binding of several OA-related compounds to THY1. Among the tested compounds, berberine showed the most favorable overall binding profile and was therefore selected for molecular dynamics simulation. The MD and MM/PBSA analyses suggested that the THY1–berberine complex could maintain a relatively stable binding state, mainly supported by van der Waals and hydrophobic interactions. These computational results provide preliminary structural evidence for a potential interaction between berberine and THY1, indicating that it may serve as a prioritized candidate for subsequent experimental validation and intervention studies targeting THY1. However, these results remain exploratory. We speculate that stable berberine binding to THY1 may provide a novel entry point for “targeting THY1 to attenuate inflammatory amplification and matrix degradation,” thereby offering new perspectives for exploring berberine as a therapeutic option in OA.
Although this study integrated multiple cohorts and established a relatively comprehensive evidence chain by combining single-cell analyses, histological validation, and in vivo/in vitro functional experiments—collectively suggesting an important role for THY1 in OA—several limitations still warrant careful consideration. First, due to limited sample sizes and incomplete clinical annotations in public databases, differences remain across cohorts in grouping composition and representativeness. Although batch-effect correction was applied to reduce technical bias, the restricted sample scale may still affect model stability and external generalizability. Second, upstream transcription factor screening was primarily based on multi-database enrichment results and correlation evidence. While the databases used include experimentally supported information (eg., ChIP-related evidence), this study did not perform direct validation of binding sites or chromatin-level regulation in our own samples/systems. Therefore, these transcription factors should be regarded as candidate regulatory clues that require further experimental confirmation. Third, the MD simulation was based on a single 100-ns trajectory without multiple independent replicates. In addition, MM/PBSA calculations have inherent limitations, including dependence on model parameters and incomplete treatment of entropy; therefore, the results should be considered semi-quantitative. Furthermore, conclusions regarding berberine targeting THY1 and its related pathways are currently mainly supported by computational simulations. Future studies should include surface plasmon resonance (SPR) or other direct binding assays, as well as experimental validation in cellular or animal OA models, to further confirm their biological relevance.
Conclusion
This study provides preliminary evidence that THY1 may serve as a reliable candidate diagnostic biomarker for OA and may be involved in OA progression through its bidirectional association with the NF-κB signaling pathway. Specifically, NF-κB activation is associated with increased THY1 expression, while THY1 modulation in turn influences NF-κB pathway activity. These observations raise the possibility of a mutually reinforcing regulatory relationship between THY1 and NF-κB signaling; however, further studies are required to determine whether a definitive feedback loop exists. Moreover, our computational simulations provide preliminary and predictive structural insights into the potential interaction between berberine and THY1, thereby expanding possible research directions for berberine-based approaches in OA.
Data Sharing Statement
The datasets generated and/or analyzed in this study are available in the GEO database (https://www.ncbi.nlm.nih.gov/geo). Part of the data supporting this study has been provided in the supplementary materials. Additional data related to this study are available from the corresponding author ([email protected]) upon reasonable request.
Ethics Approval and Consent to Participate
The clinical specimen collection plan for HC and OA cartilage was approved by the Ethics Committee of the Second Affiliated Hospital of Anhui Medical University (Approval No:YX2025-030) and conducted in accordance with relevant guidelines and regulations.
Author Contributions
Yiqun Yan: Conceptualization, Investigation, Writing – original draft, Writing – review & editing. Wendan Cheng: Conceptualization, Project administration, Supervision, Writing – review & editing. Entong Ji: Investigation, Data curation, Resources, Writing – review & editing. Chen Wang: Formal analysis, Visualization, Writing – original draft, Writing – review & editing. Mingjun Zhang: Methodology, Software, Validation, Writing – review & editing. Jiangqi Yu: Conceptualization, Funding acquisition, Supervision, Writing – review & editing. All authors took part in drafting, revising or critically reviewing the article; gave final approval of the version to be published; have agreed on the journal to which the article has been submitted; and agree to be accountable for all aspects of the work.
Funding
The authors declare that no funding was received for this study.
Disclosure
The authors declare that there are no competing interests associated with the paper.
References
1. Hunter DJ, Bierma-Zeinstra S. Osteoarthritis. Lancet. 2019;393(10182):1745–33. doi:10.1016/S0140-6736(19)30417-9
2. Tang SA, Zhang C, Oo WM, et al. Osteoarthritis. Nat Rev Dis Prim. 2025;11(1):10. doi:10.1038/s41572-025-00594-6
3. Pettenuzzo S, Berardo A, Belluzzi E, et al. Mechanical insights into fat pads: a comparative study of infrapatellar and suprapatellar fat pads in osteoarthritis. Connective Tissue Res. 2025;66(4):272–283. doi:10.1080/03008207.2025.2502591
4. Collins KH, Haugen IK, Neogi T, et al. Osteoarthritis as a systemic disease. Nat Rev Rheumatol. 2025;22(2):105–117. doi:10.1038/s41584-025-01332-8
5. Favero M, Belluzzi E, Ortolan A, et al. Erosive hand osteoarthritis: latest findings and outlook. Nat Rev Rheumatol. 2022;18(3):171–183. doi:10.1038/s41584-021-00747-3
6. Motta F, Barone E, Sica A, et al. Inflammaging and Osteoarthritis. Clin Rev Allergy Immunol. 2023;64(2):222–238. doi:10.1007/s12016-022-08941-1
7. Usher KM, Zhu S, Mavropalias G, et al. Pathological mechanisms and therapeutic outlooks for arthrofibrosis. Bone Res. 2019;7:9. doi:10.1038/s41413-019-0047-x
8. Olivotto E, Belluzzi E, Pozzuoli A, et al. Do synovial inflammation and meniscal degeneration impact clinical outcomes of patients undergoing arthroscopic partial meniscectomy? a histological study. Int J Mol Sci. 2022;23(7):3903. doi:10.3390/ijms23073903
9. Sun K, Zhang X, Hou L, et al. TRPM2-mediated feed-forward loop promotes chondrocyte damage in osteoarthritis via calcium-cGAS-STING-NF-κB pathway. J Adv Res. 2024;75:213–227. doi:10.1016/j.jare.2024.11.007
10. Li Z, Lu H, Fan L, et al. Microneedle-delivered pda@exo for multifaceted osteoarthritis treatment via pi3k-akt-mtor pathway. Adv. Sci. 2024;11(42):e2406942. doi:10.1002/advs.202406942
11. Peat G, Thomas MJ. Osteoarthritis year in review 2020: epidemiology & therapy. Osteoarthritis Cartilage. 2021;29(2):180–189. doi:10.1016/j.joca.2020.10.007
12. Glyn-Jones S, Palme AJR, Agricola R, et al. Osteoarthritis. Lancet. 2015;386(9991):376–387. doi:10.1016/S0140-6736(14)60802-3
13. Moldovan F, Moldovan L. Fixation methods in primary hip arthroplasty: a nationwide, registry-based observational study in romania (2001-2024). Healthcare. 2025;13(19):2452. doi:10.3390/healthcare13192452
14. Charlier E, Deroyer CL, Ciregia F, et al. Chondrocyte dedifferentiation and osteoarthritis (OA). Biochem. Pharmacol. 2019;165:49–65. doi:10.1016/j.bcp.2019.02.036
15. Fujii Y, Liu L, Yagasaki L, et al. Cartilage homeostasis and osteoarthritis. Int J Mol Sci. 2022;23(11):6316. doi:10.3390/ijms23116316
16. Kraus VB, Hsueh M-F. Molecular biomarker approaches to prevention of post-traumatic osteoarthritis. Nat Rev Rheumatol. 2024;20(5):272–289. doi:10.1038/s41584-024-01102-y
17. Maly K, Andres Sastre E, Farrell E, et al. COMP and TSP-4: functional roles in articular cartilage and relevance in osteoarthritis. Int J Mol Sci. 2021;22(5):2242. doi:10.3390/ijms22052242
18. Ruan H, Zhu T, Wang T, et al. Quercetin modulates ferroptosis via the sirt1/nrf-2/ho-1 pathway and attenuates cartilage destruction in an osteoarthritis rat model. Int J Mol Sci. 2024;25(13):7461. doi:10.3390/ijms25137461
19. Plsikova Matejova J, Spakova T, Harvanova D, et al. A preliminary study of combined detection of comp, timp-1, and mmp-3 in synovial fluid: potential indicators of osteoarthritis progression. Cartilage. 2020;13(2_suppl):1421S–1430S. doi:10.1177/1947603520946385
20. Croft AP, Campos J, Jansen K, et al. Distinct fibroblast subsets drive inflammation and damage in arthritis. Nature. 2019;570(7760):246–251. doi:10.1038/s41586-019-1263-7
21. Zeng F, Gao M, Liao S, et al. Role and mechanism of CD90+ fibroblasts in inflammatory diseases and malignant tumors. Mol Med. 2023;29(1):20. doi:10.1186/s10020-023-00616-7
22. Damerau A, Kirchner M, Pfeiffenberger M, et al. Metabolic reprogramming of synovial fibroblasts in osteoarthritis by inhibition of pathologically overexpressed pyruvate dehydrogenase kinases. Metabolic Eng. 2022;72:116–132. doi:10.1016/j.ymben.2022.03.006
23. Damerau A, Rosenow E, Alkhoury D, et al. Fibrotic pathways and fibroblast-like synoviocyte phenotypes in osteoarthritis. Front Immunol. 2024;15:1385006. doi:10.3389/fimmu.2024.1385006
24. Song D, Hao J, Fan D. Biological properties and clinical applications of berberine. Front Med. 2020;14(5):564–582. doi:10.1007/s11684-019-0724-6
25. Zhao H, Zhang T, Xia C, et al. Berberine ameliorates cartilage degeneration in interleukin-1β-stimulated rat chondrocytes and in a rat model of osteoarthritis via Akt signalling. J Cell & Mol Med. 2013;18(2):283–292. doi:10.1111/jcmm.12186
26. Zhou Y, Liu S-Q, Yu L, et al. Berberine prevents nitric oxide-induced rat chondrocyte apoptosis and cartilage degeneration in a rat osteoarthritis model via AMPK and p38 MAPK signaling. Apoptosis. 2015;20(9):1187–1199. doi:10.1007/s10495-015-1152-y
27. Ritchie ME, Phipson B, Wu D, et al. limma powers differential expression analyses for RNA-sequencing and microarray studies. Nucleic Acids Res. 2015;43(7):e47. doi:10.1093/nar/gkv007
28. Leek JT, Johnson WE, Parker HS, et al. The sva package for removing batch effects and other unwanted variation in high-throughput experiments. Bioinformatics. 2012;28(6):882–883. doi:10.1093/bioinformatics/bts034
29. Langfelder P, Horvath S. WGCNA: an R package for weighted correlation network analysis. BMC Bioinf. 2008;9(1):559. doi:10.1186/1471-2105-9-559
30. Wu T, Hu E, Xu S, et al. clusterProfiler 4.0: a universal enrichment tool for interpreting omics data. Innovation. 2021;2(3):100141. doi:10.1016/j.xinn.2021.100141
31. Szklarczyk D, Kirsch R, Koutrouli M, et al. The STRING database in 2023: protein-protein association networks and functional enrichment analyses for any sequenced genome of interest. Nucleic Acids Res. 2023;51(D1):D638–D646. doi:10.1093/nar/gkac1000
32. Liaw A, Wiener M. Classification and Regression by randomForest. R News. 2002;2(3):18–22.
33. Huang S, Cai N, Pacheco PP, et al. Applications of Support Vector Machine (SVM) Learning in Cancer Genomics. Cancer Genom Proteom. 2018;15(1):41–51.
34. Friedman J, Tibshirani R, Hastie T. Regularization paths for generalized linear models via coordinate descent. J Statist Software. 2010;33(1):1–22. doi:10.18637/jss.v033.i01
35. Stuart T, Butler A, Hoffman P, et al. Comprehensive integration of single-cell data. Cell. 2019;177(7). doi:10.1016/j.cell.2019.05.031
36. Cao J, Spielmann M, Qiu X, et al. The single-cell transcriptional landscape of mammalian organogenesis. Nature. 2019;566(7745):496–502. doi:10.1038/s41586-019-0969-x
37. Yang J, Li S, Li Z, et al. Targeting YAP1-regulated glycolysis in fibroblast-like synoviocytes impairs macrophage infiltration to ameliorate diabetic osteoarthritis progression. Adv. Sci. 2024;11(5):e2304617. doi:10.1002/advs.202304617
38. Ravindranath PA, Forli S, Goodsell DS, et al. AutoDockFR: advances in protein-ligand docking with explicitly specified binding site flexibility. PLOS Computat Biol. 2015;11(12):e1004586. doi:10.1371/journal.pcbi.1004586
39. Eberhardt J, Santos-Martins D, Tillack AF, et al. AutoDock vina 1.2.0: new docking methods, expanded force field, and python bindings. J Chem Inf Model. 2021;61(8):3891–3898. doi:10.1021/acs.jcim.1c00203
40. Lee T-S, Allen BK, Giese TJ, et al. Alchemical binding free energy calculations in amber20: advances and best practices for drug discovery. J Chem Inf Model. 2020;60(11):5595–5623. doi:10.1021/acs.jcim.0c00613
41. Maier JA, Martinez C, Kasavajhala K, et al. ff14SB: improving the accuracy of protein side chain and backbone parameters from ff99SB. J Chem Theory Comput. 2015;11(8):3696–3713. doi:10.1021/acs.jctc.5b00255
42. Lu J, Qiu Y, Baron R, et al. Coarse-Graining of TIP4P/2005, TIP4P-Ew, SPC/E, and TIP3P to monatomic anisotropic water models using relative entropy minimization. J Chem Theory Comput. 2014;10(9):4104–4120. doi:10.1021/ct500487h
43. Genheden S, Ryde U. The MM/PBSA and MM/GBSA methods to estimate ligand-binding affinities. Expert Opin Drug Discov. 2015;10(5):449–461. doi:10.1517/17460441.2015.1032936
44. Wang S, Kurth S, Burger C, et al. TNFα-related chondrocyte inflammation models: a systematic review. Int J Mol Sci. 2024;25(19).
45. Defois A, Bon N, Charpentier A, et al. Osteoarthritic chondrocytes undergo a glycolysis-related metabolic switch upon exposure to IL-1b or TNF. Cell Commun Signal. 2023;21(1):137. doi:10.1186/s12964-023-01150-z
46. Miao Y, Wu S, Gong Z, et al. SPARCL1 promotes chondrocytes extracellular matrix degradation and inflammation in osteoarthritis via TNF/NF-κB pathway. J Orthopaed Transl. 2024;46:116–128. doi:10.1016/j.jot.2024.02.009
47. Yan Y, He J, Xu Z, et al. Mendelian randomization based on genome-wide association studies and expression quantitative trait loci, predicting gene targets for the complexity of osteoarthritis as well as the clinical prognosis of the condition. Front Med. 2024;11:1409439. doi:10.3389/fmed.2024.1409439
 © 2026 The Author(s). This work is published and licensed by Dove Medical Press Limited. The
full terms of this license are available at https://www.dovepress.com/terms
and incorporate the Creative Commons Attribution
- Non Commercial (unported, 4.0) License.
By accessing the work you hereby accept the Terms. Non-commercial uses of the work are permitted
without any further permission from Dove Medical Press Limited, provided the work is properly
attributed. For permission for commercial use of this work, please see paragraphs 4.2 and 5 of our Terms.
© 2026 The Author(s). This work is published and licensed by Dove Medical Press Limited. The
full terms of this license are available at https://www.dovepress.com/terms
and incorporate the Creative Commons Attribution
- Non Commercial (unported, 4.0) License.
By accessing the work you hereby accept the Terms. Non-commercial uses of the work are permitted
without any further permission from Dove Medical Press Limited, provided the work is properly
attributed. For permission for commercial use of this work, please see paragraphs 4.2 and 5 of our Terms.