Back to Journals » Eye and Brain » Volume 6 » Thematic series: Organization and function of the visual system in primates
Patchy distributions of myelin and vesicular glutamate transporter 2 align with cytochrome oxidase blobs and interblobs in the superficial layers of the primary visual cortex
Authors Rockoff E, Balaram P, Kaas J
Received 27 December 2013
Accepted for publication 4 March 2014
Published 24 September 2014 Volume 2014:6(Thematic series: Organization and function of the visual system in primates) Pages 19—27
DOI https://doi.org/10.2147/EB.S59797
Checked for plagiarism Yes
Review by Single anonymous peer review
Peer reviewer comments 5
Emily C Rockoff,1 Pooja Balaram,1 Jon H Kaas1,2
1Department of Psychology, 2Department of Cell and Molecular Biology, Vanderbilt University, Nashville, TN, USA
Abstract: Blobs are a modular component of the primary visual cortex (area 17) of all primates, but not of other mammals closely related to primates. They are characterized as an even distribution of patches, puffs, or blobs of dense cytochrome oxidase (CO) expression in layer III of area 17, and are now known to differ from surrounding, nonblob cortex in thalamic, intrinsic, and extrastriate connections. Previous studies have also recognized a blob-like pattern of myelin-dense patches in layer III of area 17 of primates, and more recently the vesicular glutamate transporter (VGLUT)-2 isoform of the VGLUT family has been found to selectively distribute to layer III patches in a similar blob-like pattern. Here, we sought to determine if the blob-like patterns all identify the same modular structures in area 17 of primates by staining alternate brain sections cut parallel to the surface of area 17 of a prosimian primate (Otolemur garnettii) for CO, myelin, and VGLUT2. By aligning the sections from the three preparations, we provide clear evidence that the three preparations all identify the same modular blob structures. The results provide a further understanding of the functional nature of the blobs by demonstrating that their higher level of CO activity is related to thalamic inputs from the lateral geniculate nucleus that use VGLUT2 as their main glutamate transporter, and via myelinated axons.
Keywords: columns, modules, visual cortex, primates, prosimians
Introduction
The neocortex of mammals is structurally and functionally divided into areas and repeating modules or columns within areas.1 Carroll and Wong-Riley2 were the first to recognize that the primary visual cortex (V1) of monkeys is subdivided into two types of modules by differences in the distribution of the cellular metabolic enzyme, cytochrome oxidase (CO).3 Layer III of V1 is characterized by a pattern of small patches of dense CO expression that are regularly dispersed in a field of less dense CO expression. These patterns were originally called “puffs”,3,4 but the improbable name of “blobs”, used by subsequent researchers,5 came into common use. Blobs are found in V1 of all primates,6–8 but not in close relatives of primates, such as tree shrews and rodents. Therefore, the blob modules in V1 likely evolved with the first primates.1 Evidence also suggests that certain carnivores, such as cats, have blobs, but they likely have a different structure that evolved independently of the primate lineage.9 Consistent with the high level of the metabolic enzyme CO, neurons in blobs have higher firing rates than neurons outside blobs, and neurons in blob modules are more selective for color and less selective for stimulus orientation than neurons in interblob regions.5,10–13 Blobs and interblobs are also distinguished by differences in intrinsic V1 connections, and extrinsic connections with other visual thalamic and cortical areas.5,14 For example, the blobs, unlike layer IV, selectively receive inputs from the koniocellular layers of the lateral geniculate nucleus.15,16 Therefore, CO blobs appear to identify an important component of the primate visual system, and other histological ways of recognizing them would be useful. If other histological markers with similar distribution patterns are found to colocalize with CO blobs, it will be possible to discuss and identify further differences in blob and interblob function.
In this regard, two other histological markers have revealed blob-like patterns in primate V1. Myelin stains reveal a blob-like pattern of myelin-dense patches in V1 of monkeys,17 and a similar pattern of myelin-sparse holes in a myelin-dense background.18,19 These two different patterns seem to relate to different sublayers of layer III, so that both the myelin patches and holes may reflect columns containing blobs. More recently, the vesicular glutamate transporter (VGLUT)-2 isoform of the vesicular glutamate-transporter family has been found to identify a blob-like pattern in V1 of galagos19 and Old World macaque monkeys.20–22 The distribution patterns of the myelin-dark patches, the myelin-light holes, and the VGLUT2-dense patches all suggest that they reveal different features of the same modular division of V1, the modules that densely express CO.
To address this possibility, we processed alternate sections from the cerebral cortex of prosimian galagos for CO, myelin, or VGLUT2. Galagos are specifically relevant to a study of blobs, as they have well-developed koniocellular layers of the lateral geniculate nucleus that are known to project to the blobs,16 and yet they lack blue (S) cones.23,24 Brain sections were cut parallel to the surface of V1, and CO-, myelin-, and VGLUT2-stained sections were aligned and compared through the depth of V1. The alignment of CO blobs with myelin-dense patches and VGLUT2 puffs indicates that all these markers identify the same cortical column.
Materials and methods
The alignment of CO, myelin, and VGLUT2 distributions was studied in four adult galagos (Otolemur garnettii). Experimental procedures were all approved by the Vanderbilt Institutional Animal Care and Use Committee and followed the guidelines published by the US National Institutes of Health.
Tissue acquisition and histology
Each animal was given a lethal overdose of sodium pentobarbital (80 mg/kg) and perfused transcardially with phosphate-buffered saline, followed by 4% paraformaldehyde in 0.1 M PB, and then 4% paraformaldehyde and 10% sucrose in phosphate-buffered saline. The brain was removed from the skull, bisected, postfixed for 2–4 hours in 4% paraformaldehyde and 10% sucrose in PB, and cryoprotected in 30% sucrose. The subcortical structures were removed from the cortices, and one cortical hemisphere in each animal was manually flattened via the opening of sulci. Only one hemisphere from each case was used, due to other laboratory experiments requiring tissue (left, n=2, right, n=2). The flattened cortices were then cut tangentially on a freezing microtome at 40 μm and saved in three series.
Histochemistry
One series of sections from each case was processed for myelin using the Gallyas25 silver procedure, which is based on the binding of colloidal silver to myelin for viewing by light microscopy. A second series of sections was processed for cytochrome oxidase26 to identify the original CO blobs. Stained sections were then mounted and dehydrated in an ascending series of ethanols (70% for 20 minutes, 95% for 10 minutes, 100% for 10 minutes), cleared in xylene, and coverslipped using Permount™ (Thermo Fisher Scientific, Waltham, MA, USA).
Immunohistochemistry
One series from each case was immunohistochemically labeled for VGLUT2 protein using commercial antibodies against VGLUT2 and previously described immunohistochemical techniques.27 In brief, sections were incubated in a primary antibody solution of 1:5,000 goat mouse anti-VGLUT2 (EMD Millipore, Billerica, MA, USA), incubated in 1:500 peroxidase antigoat immunoglobulin G in blocking solution (Vector Laboratories, Burlingame, CA, USA), amplified using an avidin–biotin conjugate kit (Vector Labs), and visualized using a diaminobenzidine reaction with nickel enhancement. The primary antibody against VGLUT2 has been previously characterized in galago tissue.19,27,28 Sections were then dehydrated, cleared in xylene, and coverslipped using the methods described in the previous paragraph.
Light microscopy
Processed sections were viewed using a Nikon (Tokyo, Japan) E800 microscope, and digital photomicrographs of visual area structures were captured using a Nikon DXM2200 camera. The images were adjusted for contrast and brightness using Adobe Photoshop (Adobe Systems, San Jose, CA. USA), but they were not otherwise altered. Cortical borders were apparent even at low magnification in CO, myelin, and VGLUT2 stains, making the location of the V1/V2 border easily visible when viewed under a high-powered light microscope.
Stain comparisons by case
As previously mentioned, one hemisphere per galago was analyzed. CO-, myelin-, and VGLUT2-staining patterns were all visible throughout V1, but it was difficult to identify large regions of V1 where all three stains were distinct and measurable. Additionally, only a few sections in each case would contain blobs, given the thickness of layer III in V1. Due to these complexities of tissue reconstruction, tissue was typically only processed for two of the three stains (with the exception of case 4). Therefore, comparisons in each case are only between two types of preparation. In case 1, CO and myelin blobs were analyzed (n=74). In case 2, CO and VGLUT2 blobs were analyzed (n=21). In case 3, VGLUT2 and myelin blobs were analyzed (n=100). Case 4 consisted of all three stains, and both the CO and VGLUT2 blobs (n=29) and CO and myelin blobs (n=40) were analyzed. However, the myelin and VGLUT2 comparison was excluded from case 4, since there was a lack of tissue visible in which both these blobs appeared and were able to be measured reliably.
Identification and anatomical reconstruction of cytochrome oxidase blobs
Images were cropped in Adobe Photoshop at the V1/V2 border, which was identifiable by the abrupt change in reactivity for each stain. The V1/V2 border was visible in all CO-, myelin-, and VGLUT2-stained sections (Figure 1). Multiple cortical layers were often visible in the same section due to the curvature of the cortex; therefore, transitions between layers are visible in some sections (Figure 1). It is not currently possible to find the exact areas of blobs in primate visual cortex, as their boundaries are expressed as a gradual change in CO reactivity (Figure 2A). Therefore, the borders of blobs and interblobs were estimated by visual inspection after adjusting for contrast in Photoshop. Conservative estimates of blob boundaries were generated by preliminarily outlining regions of dense CO, myelin, or VGLUT2 staining using the paint tool in Photoshop (Figure 2B), and the inner border of this outline was redrawn for final area measurements in ImageJ (National Institutes of Health, Bethesda, MD, USA) (Figure 2C).
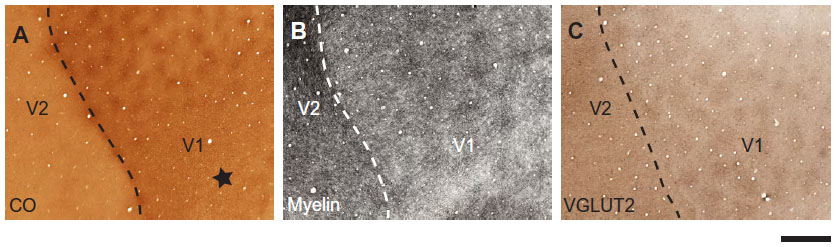 | Figure 1 Patchy staining pattern of area 17. |
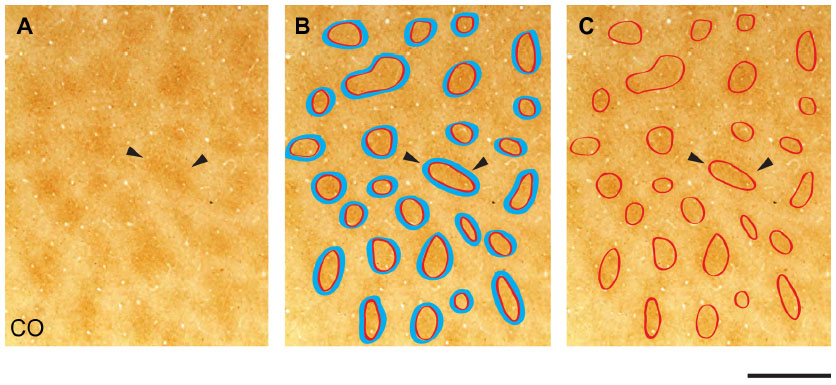 | Figure 2 Identification of cytochrome oxidase (CO) blobs. |
Since the depth of layer III spread throughout consecutive sections, there were often a few CO, myelin, or VGLUT2 blobs outlined, which represented the same blob once sections were aligned. When layer III was reconstructed (see Figure 3) and it was apparent that two outlined blobs of the same stain were a representation of the same blob, an average of these outlines was drawn (see Figure 4). For example, if all the CO blobs are outlined in layer III, and layer III is visible in two separate sections, the alignment of both layer III CO sections will reveal multiple outlined CO blobs on top of one another, necessitating an average outline of that CO blob. It has been reported that blob borders can be estimated by using the filtering software from ImageJ and Photoshop, but a comparison of these two methods does not favor one technique over the other, which provides further evidence that this is an accurate and trustworthy method.28 Accordingly, all of the data were collected with the manual method using subjective estimates of blob borders.
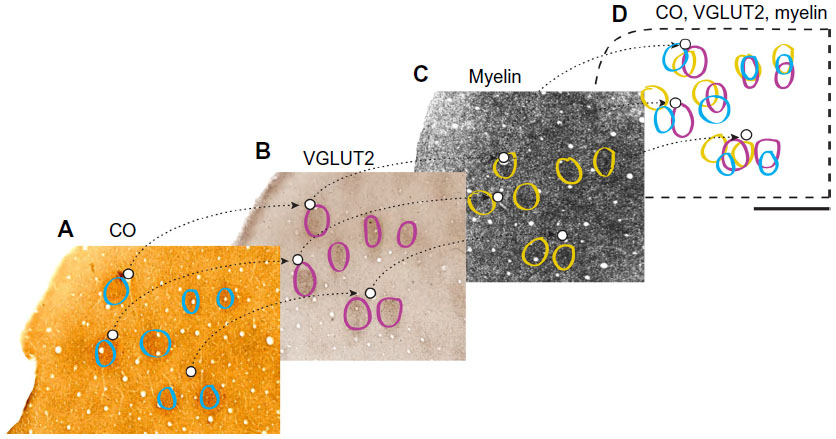 | Figure 3 Alignment of adjacent cytochrome oxidase (CO), outlines of vesicular glutamate transporter (VGLUT)-2, and myelin sections in area 17. |
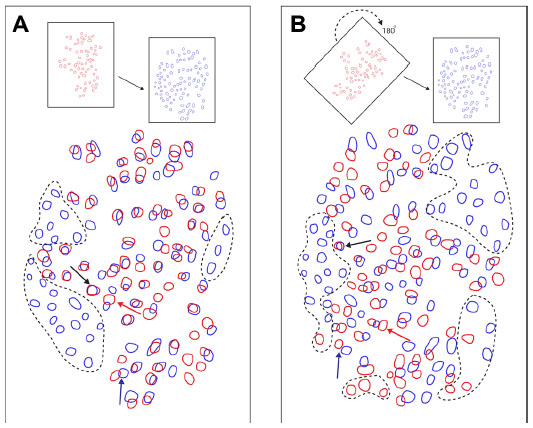 | Figure 4 Random assortment of overlapping blobs used as a comparison against measured overlap percentages. |
It is important to address the bias associated with using a manual measure to identify blobs in the cortex. While previous studies have found this method can be just as accurate as computerized methods that examine density changes across images of stained sections, there is the concern that outlining could be biased toward what we expect to find. However, this assumption is highly unlikely, given that blob outlines were individually marked on separate sections, and were not visible when adjacent tissue sections were aligned. After tissue sections were aligned, blob outlines were made visible again for area measurement. Therefore, our methods were accurate in identifying an unbiased, constant, and conservative estimate of each individual blob in V1.
Adjacent tangential V1 sections in each series were aligned in Photoshop, using at least three blood vessels in order to reconstruct superficial layer III. Layer III in each series was aligned using blood vessels in each section (Figure 3). Differential tissue shrinkage and expansion within each section, from variations in histological and immunohistochemical techniques, required V1 then to be divided into groups in Photoshop for local tissue alignment. The size of these groups differed, based on identifiable surrounding blood vessels and the degree of tissue distortion. Each case typically had four to nine groups containing anywhere from five to 28 blobs per group.
Data acquisition
The degree of overlap when two blob regions were aligned was computed using the measurement tool in ImageJ, with relative areas and percentage of overlap rather than exact areas. For all blob alignments, the individual areas of both blobs were computed, and then the area of overlap was measured to determine the percentage overlap between the blobs (Figure 4A). Note that the percentage overlap of blob 1 in blob 2 can be computed, or conversely the percentage overlap of blob 2 in blob 1 can be computed, which will yield a slightly different percentage-overlap number. It is more relevant to compute how much myelin or VGLUT2 overlaps with CO blobs, and for comparisons between myelin and VGLUT2, the percentage overlap of VGLUT2 in myelin was computed. The converse distributions of percentage-overlap scores and confidence intervals are reported for all three types of comparisons (ie, CO/VGLUT2, CO/myelin, and myelin/VGLUT2) (Figure 5), but they were not significantly different from their counterparts. The comparisons between VGLUT2 and CO had more variable spreads (Figure 5B), but this was likely due to the low sample number of blobs for this comparison (total n=50, from case 2 and case 4), and will not be discussed further. In case 1, the percentage overlap for myelin blobs in CO blobs was computed. In case 2, the percentage overlap for VGLUT2 blobs in CO blobs was computed. In case 3, the percentage overlap for VGLUT2 blobs in myelin was computed. In case 4, since all three types of stain were present, the percentage overlaps for myelin in CO as well as VGLUT2 in CO were computed.
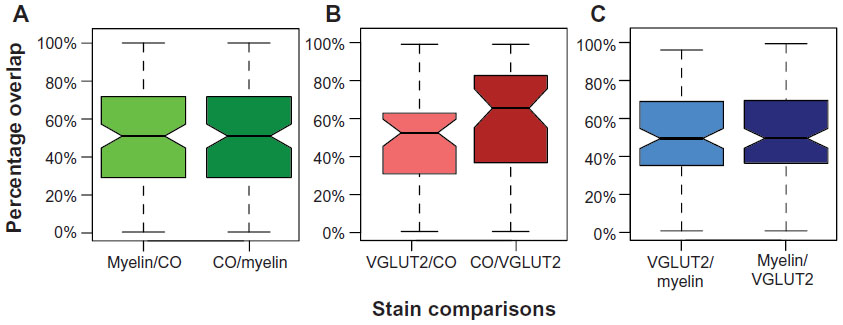 | Figure 5 Box plot comparing the percentage-overlap comparisons used in this experiment and the converse computations, which were not found to be significantly different from one another based on their overlapping 95% confidence intervals. |
Analysis
In order to analyze overlapping blob distributions between blobs of two different stains, the total overlap percentages for each type of comparison (ie, VGLUT2/CO, myelin/CO, and VGLUT2/myelin) were compared against a random alignment of blobs. The myelin sections from case 1 were rotated 180° to create a random pattern of aligned blobs at chance levels (n=65) (Figure 4B). The control percentage-overlap score was calculated between the randomly aligned myelin and CO blobs. A box plot shows the distribution of percentage-overlap scores in the random case, as well as all of the percentage-overlap scores in the myelin/CO comparisons (case 1 and case 4), VGLUT2/CO comparisons (case 2 and case 4), and the VGLUT2/myelin comparisons (case 3) (Figure 6).
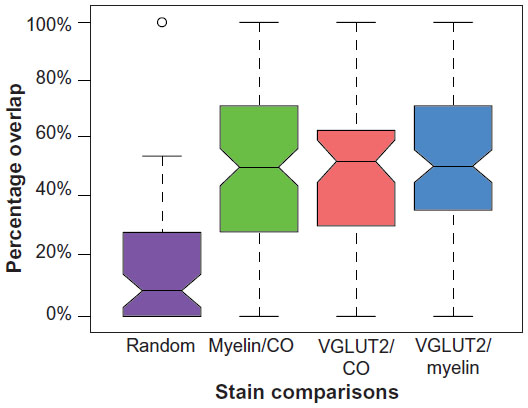 | Figure 6 Box plot comparing the random (purple [0.033–0.014]) percentage-overlap scores to the three groups of blob comparisons made. |
Results
The goal of this study was to determine whether the myelin-rich and VGLUT2-rich blobs aligned with CO blobs in the primary visual cortex, since visual inspection of VGLUT2 or myelin blobs in comparison to CO blobs indicated that all patches likely identified the same blobs, or varying profiles of the same blob structures. The present results provide evidence that darkly stained patches of myelin and VGLUT2 correspond with CO blobs in the superficial layers of V1.
Patterns of CO, myelin, and VGLUT2 staining in V1
CO, myelin, and VGLUT2 patterns were all visually similar in flattened tissue preparations of galago visual cortex (Figure 1). CO blobs in layer III appeared as dark, oval patches spread in a regular pattern across V1. In VGLUT2 preparations of V1, VGLUT2-rich blobs were surrounded by VGLUT2-poor regions throughout layer III. Myelin-stained sections revealed a similarly patchy pattern, with dark myelinated blobs surrounded by a lighter, myelin-poor background. Identification of blobs in CO and VGLUT2 sections was easier than in myelin sections, as the myelin blobs appeared to transition more gradually into interblob tissue. Despite that difference, myelin-dense blobs were still detectable in each case. Generally, blobs in all three stains appeared more circular in central areas of V1 tissue, while those located in more peripheral regions took on an elongated, noncircular appearance. Additionally, all blobs were generally evenly spaced and seemed to align in rows, consistent with prior descriptions of CO-staining patterns in V1.4 Coronal sections of V1 (Figure 7) stained for CO, myelin, or VGLUT2 also show evenly distributed patches of dense and light labels throughout layer III.
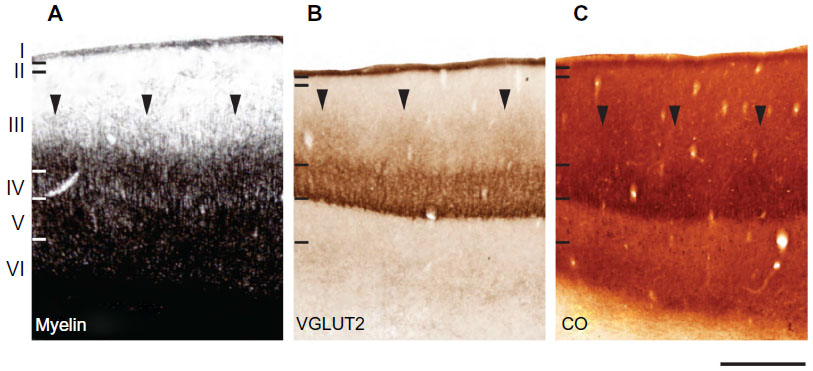 | Figure 7 Laminar characteristics of area 17 at low magnification. Coronal sections from the occipital cortex were processed for (A) cytochrome oxidase (CO), (B) myelin, and (C) vesicular glutamate transporter (VGLUT)-2. The arrowheads in (A–C) indicate the locations of CO blobs in layer III. Scale bar 1 mm. |
In layer IV, all three stains showed dense, homogeneous staining, which made layer III easily distinguishable by irregular staining immediately dorsal to layer IV. This dense labeling pattern for CO, myelin, and VGLUT2 was consistent with previous results in galagos,19,27 and likely reflects the dense thalamocortical projections that terminate in this layer.16,29–34 Coronal sections through V1 (Figure 7) delineated the boundaries of regular CO and VGLUT2 staining in layer IV, and identified densely labeled patches in layer III, as well as layers V and VI in CO preparations.35,36 Myelin-dense patches, however, appeared almost continuous from layer III through layer V of V1. For data collection, we only used blob measurements in superficial layer III, as it was not known whether or not visible blobs in deeper layers V and VI corresponded to the same set of connections.
CO, myelin, and VGLUT2 alignment
When aligned blob patterns were compared across adjacent sections in galagos, the number of blob-like structures in any local region of V1 was identical across CO, myelin, and VGLUT2 preparations. The 95% confidence intervals for the medians of the myelin/CO (0.444–0.570) and VGLUT2/CO (0.455–0.600) comparisons did not overlap with the control 95% confidence interval (0.033–0.014), signifying that both the myelin/CO and VGLUT2/CO comparisons contained significantly higher percentage-overlap scores than the random alignment of blobs. This suggests that within layer III, dark CO blobs were well aligned with dark VGLUT2 patches, and also that the CO-dense blobs and myelin-dense blobs identified the same cortical regions. Furthermore, the 95% confidence intervals for the VGLUT2/myelin percentage-overlap scores (0.455–0.566) also yielded an equally significant result, which was expected, given how each of these two stains related to the CO-blob distribution in V1. While the contrast between blobs and interblobs in the myelin sections was remarkably less prominent compared to CO and VGLUT2 sections (see Figure 1B), the blob regions outlined in individual myelin sections aligned well with those of the VGLUT2- and CO-blob regions. Overall, all alignments consistently showed that CO blobs aligned with myelin-dense and VGLUT2-rich patches, and that the CO interblobs likely overlapped with the myelin-pale and VGLUT2-sparse regions as well. Lastly, coronal sections of CO, myelin, and VGLUT2 revealed vertical laminar specificity and high overlap of CO blobs with myelin and VGLUT2 patches in V1 (Figure 7).
Discussion
The primary aim of this study was to characterize and align the patchy distributions of CO, myelin, and VGLUT2 labeling across the striate cortex in galagos, in order to determine how these patterns might relate to the functional roles of V1. We found that myelin and VGLUT2 had patchy distribution patterns throughout layer III of cortex V1 and homogeneous distribution patterns across layer IV, which were identical to CO-staining patterns in these layers. Further analysis of aligned sections indicated that the blob-like structures visualized in myelin and VGLUT2 stains colocalized with CO-dense blobs in V1. When the blob-like structures were aligned across sections, the percentage overlap was high. However, there was variability in how well blobs overlapped, as some overlapped perfectly while others were adjacent with no overlap. The overlap percentages were not expected to be perfect, because each stain likely revealed different functional profiles of blobs. However, it is important to point out that these comparisons provide convincing evidence that each stain identified the same larger blob structure. Furthermore, laminar differences seen within myelin and VGLUT2 preparations revealed a vertical columnar structure that included blobs, which is consistent with a modular organization of V1 in primates.
The differences in CO, myelin, and VGLUT2 expression in blobs and interblobs reflected the anatomical and functional differences between those two regions of V1. Anatomical data suggested that there was a modular organization of geniculate projections in the galago visual cortex, and blobs and interblobs contributed to separate transformations of geniculate inputs within V1. Besides having different levels of metabolic activity, blobs and interblobs also differ in their efferent and afferent connections.14,37,38 The major thalamic input to V1 in galagos and other primates arises from the dorsal lateral geniculate nucleus (LGN), and terminates in layers I, III, IV, and VI.39 The magnocellular (M) geniculate cells predominantly project to layer IVα of V1 and parvocellular (P) cells to IVβ, while koniocellular (K) cells terminate directly within CO blobs in layers III.16,40–45 K-cell inputs to layer III terminate in clusters that are surrounded by corticocortical projections and intrinsic laminar connections, including those from layer IV,16,30,32,46 thus strongly linking the CO blobs to the K-geniculate pathway in V1.47 CO blobs also receive indirect information from M and P geniculate inputs via respective projections from layers IVα and IVβ of V1. Because of these indirect connections, CO blobs are in a special position to integrate information from all three pathways of the LGN. The interblob regions receive indirect projections from the LGN M pathway via layer IIIC, but in general, interblobs seem to receive more restricted information.41 There are also numerous intrinsic connections across V1 layers,14 but these projections are not discussed here. Given the numerous vertical connections within V1, the functional blob unit most likely spreads throughout all layers.
Previous research examining the distribution of VGLUT2 in the cortex shows that VGLUT2 is abundant throughout layer IV of the primary visual cortex,19,29,32 and our results are consistent with this pattern, which strongly suggests that VGLUT2 is associated with predominantly feed-forward or driving projections. These findings confirm that VGLUT2 staining typically reveals glutamatergic geniculocortical and not corticocortical terminations.19,20,48,49 Since all K-cell projections from the galago LGN contain glutamate50 and express VGLUT2 messenger ribonucleic acid (mRNA),27 it makes sense that VGLUT2 terminations form a patchy pattern in layer III of V1 that colocalize with K inputs to CO blobs. Given that VGLUT2 connections identify feed-forward pathways, the VGLUT2 input to blobs suggests that the K layers form driving projections as well. Since blobs in layer III also get input from sublayers of layer IV in V1, these feed-forward inputs may contribute to some of the CO or VGLUT2 reactivity found in blob structures.
Previous research concerning the relationship between CO and myelin has produced varied results, as there has been considerable debate over whether CO-dense blobs are densely or lightly myelinated. The results of myelin studies suggest that the patterns of myelin staining found in the visual cortex can vary according to the choice of technique. It was previously reported using Luxol fast blue that CO-dense blobs were densely myelinated,17 but this led others to conclude that Luxol fast blue stains differently than the traditional Gallyas silver stain.18 In this study, though, it was apparent that the Gallyas pattern in V1 was related to the CO blob/interblob pattern.51 Some evidence suggests that CO-light interblobs are more densely myelinated than the CO-dense blobs in squirrel monkeys18 and galagos.19 The present results indicate that the blobs do have a denser distribution of myelin than the surround, and this was revealed by the Gallyas silver procedure.25 The myelin-poor blob-like pattern could reflect a pattern in a cortical sublayer just above or below the CO blobs that was not revealed in the present study. However, the tissue examined in this study reveals myelin-dense blobs surrounded by myelin-poor interblobs in layer III. While CO-dense blobs appear most prominently in layer IIIB in galagos (and other primates), there is periodic weaker staining across infragranular layers V and VI, as well as in the upper layers directly above the blobs.52
There are several possible hypotheses for the coincidence of myelin-dense regions with CO-blob regions in V1. First, as blobs and interblobs each have different specialized functions,53 then the neurons subserving blob functions may require denser myelination than their surrounding interblob counterparts. Or, as a related hypothesis, the greater myelination of blobs could relate to the high levels of neuronal activity within blobs.3 Alternatively, the dense myelination found in blob regions in layer III could reflect the density of VGLUT2 labeling from lateral geniculate inputs, as described in previous reports of blob and interblob projections in galagos.16,33 Layer IV of V1 also receives dense inputs from the lateral geniculate nucleus14 and shows dense myelin reactivity,19 which again suggests that dense myelin labeling in layer III is related to the large quantity of afferent terminations in these structures. Further studies will undoubtedly reveal whether the dense myelination of CO blobs is related more to the afferent or efferent projections in these structures. For now, we can conclude that myelin-dense patches definitively align with VGLUT2- and CO-dense blobs in V1 of galagos. It is also likely that myelin and VGLUT2 identify CO blobs in V1 of other primates, including monkeys, apes, and humans.
Acknowledgments
This work was funded by National Eye Institute grant EY 02686 to JHK. We thank Laura Trice for assistance in tissue processing and histology, and Mary Feurtado for assistance in animal care.
Disclosure
The authors report no conflicts of interest in this work.
References
Kaas JH. Evolution of columns, modules, and domains in the neocortex of primates. Proc Natl Acad Sci U S A. 2012;109:10655–10660. | |
Carroll EW, Wong-Riley MT. Quantitative light and electron microscopic analysis of cytochrome oxidase-rich zones in the striate cortex of the squirrel monkey. J Comp Neurol. 1984;222:1–17. | |
Wong-Riley MT. Primate visual cortex: dynamic metabolic organization and plasticity revealed by cytochrome oxidase. In: Peters A, Rockland KS, editors. Cerebral Cortex. New York: Plenum; 1994;10:141–200. | |
Wong-Riley MT. Cytochrome oxidase: an endogenous metabolic marker for neuronal activity. Trends Neurosci. 1989;12:94–101. | |
Livingstone MS, Hubel DH. Anatomy and physiology of a color system in the primate visual cortex. J Neurosci. 1984;4:309–356. | |
Preuss TM, Beck PD, Kaas JH. Areal, modular, and connectional organization of visual cortex in a prosimian primate, the slow loris (Nycticebus coucang). Brain Behav Evol. 1993;42:237–251. | |
Preuss TM, Kaas JH. Cytochrome oxidase ‘blobs’ and other characteristics of primary visual cortex in a lemuroid primate, Cheirogaleus medius. Brain Behav Evol. 1996;47:103–112. | |
Horton JC, Hubel DH. Regular patchy distribution of cytochrome oxidase staining in primary visual cortex of macaque monkey. Nature. 1981;292:762–764. | |
Murphy KM, Jones DG, Van Sluyters RC. Cytochrome-oxidase blobs in cat primary visual cortex. J Neurosci. 1995;15:4196–4208. | |
Hendrickson AE. Dots, stripes and columns in monkey visual cortex. Trends Neurosci. 1985;8:406–410. | |
Felleman DJ. Functional maps in visual cortex: topographic, modular, and column organizations. In: Masland RH, Albright TA, editors. The Senses. London: Elsevier; 2008:577–593. | |
Lu HD, Roe AW. Functional organization of color domains in V1 and V2 of macaque monkey revealed by optical imaging. Cereb Cortex. 2008;18:516–533. | |
Economides JR, Sincich LC, Adams DL, Horton JC. Orientation tuning of cytochrome oxidase patches in macaque primary visual cortex. Nat Neurosci. 2011;14:1574–1580. | |
Casagrande VA, Kaas J. The afferent, intrinsic, and efferent connections of primary visual cortex in primates. In: Peters A, Rockland K, editors. Cerebral Cortex. New York: Plenum; 1994;10:201–259. | |
Casagrande VA, Yazar F, Jones KD, Ding Y. The morphology of the koniocellular axon pathway in the macaque monkey. Cereb Cortex. 2007;17:2334–2345. | |
Lachica EA, Casagrande VA. Direct W-like geniculate projections to the cytochrome oxidase (CO) blobs in primate visual cortex: axon morphology. J Comp Neurol. 1992;319:141–158. | |
Tootell RB, Silverman MS, De Valois RL, Jacobs GH. Functional organization of the second cortical visual area in primates. Science. 1983;220:737–739. | |
Krubitzer LA, Kaas JH. Cortical integration of parallel pathways in the visual system of primates. Brain Res. 1989;478:161–165. | |
Wong P, Kaas JH. Architectonic subdivisions of neocortex in the galago (Otolemur garnetti). Anat Rec (Hoboken). 2010;293:1033–1069. | |
Balaram P, Hackett TA, Kaas JH. Differential expression of vesicular glutamate transporters 1 and 2 may identify distinct modes of glutamatergic transmission in the macaque visual system. J Chem Neuroanat. 2013;50–51:21–38. | |
Bryant KL, Suwyn C, Reding KM, Smiley JF, Hackett TA, Preuss TM. Evidence for ape and human specializations in geniculostriate projections from VGLUT2 immunohistochemistry. Brain Behav Evol. 2012;80:210–221. | |
Garcia-Marin V, Ahmed TH, Afzal YC, Hawken MJ. Distribution of vesicular glutamate transporter 2 (VGluT2) in the primary visual cortex of the macaque and human. J Comp Neurol. 2013;521:130–151. | |
Wikler KC, Rakic P. Distribution of photoreceptor subtypes in the retina of diurnal and nocturnal primates. J Neurosci. 1990;10:3390–3401. | |
Jacobs GH, Neitz M, Neitz J. Mutations in S-cone pigment genes and the absence of colour vision in two species of nocturnal primate. Proc Biol Sci. 1996;263:705–710. | |
Gallyas F. Silver staining of myelin by means of physical development. Neurol Res. 1979;1:203–209. | |
Wong-Riley MT. Changes in the visual system of monocularly sutured or enucleated kittens demonstrable with cytochrome oxidase histochemistry. Brain Res. 1979;171:11–28. | |
Balaram P, Takahata T, Kaas JH. VGLUT2 mRNA and protein expression in the visual thalamus and midbrain of prosimian galagos (Otolemur garnetti). Eye Brain. 2011;3:1–11. | |
Baldwin MK, Kaskan PM, Zhang B, Chino YM, Kaas JH. Cortical and subcortical connections of V1 and V2 in early postnatal macaque monkeys. J Comp Neurol. 2012;520:544–569. | |
Glendenning KK, Kofron EA, Diamond IT. Laminar organization of projections of the lateral geniculate nucleus to the striate crotex [sic] in galago. Brain Res. 1976;105:538–546. | |
Casagrande, VA, De Bruyn EJ. The galago visual system: aspects of normal organization and developmental plasticity. In: Lesser Bushbaby as an Animal Model. In: Haines DE, editor. Boca Raton (FL): CRC; 1982:107–135. | |
Florence SL, Sesma MA, Casagrande VA. Morphology of geniculo-striate afferents in a prosimian primate. Brain Res. 1983;270:127–130. | |
Diamond IT, Conley M, Itoh K, Fitzpatrick D. Laminar organization of geniculocortical projections in Galago senegalensis and Aotus trivirgatus. J Comp Neurol. 1985;242:584–610. | |
Florence SL, Casagrande VA. The organization of individual afferent axons in layer IV of striate cortex of a primate (Galago senegalensis). J Neurosci. 1987;7:3850–3868. | |
Florence SL, Casagrande VA. Development of geniculocortical axon arbors in a primate. Vis Neurosci. 1990;5:291–309. | |
Livingstone MS, Hubel DH. Thalamic inputs to cytochrome oxidase-rich regions in monkey visual cortex. Proc Natl Acad Sci U S A. 1982;79:6098–6101. | |
Condo GJ, Casagrande VA. Organization of cytochrome oxidase staining in the visual cortex of nocturnal primates (Galago crassicaudatus and Galago senegalensis): I. Adult patterns. J Comp Neurol. 1990;293:632–645. | |
Livingstone MS, Hubel DH. Connections between layer 4B of area 17 and thick cytochrome oxidase stripes of area 18 in the squirrel monkey. J Neurosci. 1987;7:3371–3377. | |
Casagrande VA. A third visual pathway to primate V1. Trends Neurosci. 1994;17:305–310. | |
Kaas JH, Huerta MF, Weber JT, Harting JK. Patterns of retinal terminations and laminar organization of the lateral geniculate nucleus of primates. J Comp Neurol. 1978;182:517–553. | |
Jones EG, Hendry SH. Differential calcium binding protein immunoreactivity distinguishes classes of relay neurons in monkey thalamic nuclei. Eur J Neurosci. 1989;1:222–246. | |
Lachica EA, Beck PD, Casagrande VA. Intrinsic connections of layer III striate cortex in squirrel monkey and bush baby: correlations with patterns of cytochrome oxidase. J Comp Neurol. 1993;329:163–187. | |
Hendry SH, Yoshioka T. A neurochemically distinct third channel in the macaque dorsal lateral geniculate nucleus. Science. 1994;264:575–577. | |
Johnson JK, Casagrande VA. Distribution of calcium-binding proteins within the parallel visual pathways of a primate (Galago crassicaudatus). J Comp Neurol. 1995;356:238–260. | |
Ding Y, Casagrande VA. The distribution and morphology of LGN K pathway axons within the layers and CO blobs of owl monkey V1. Vis Neurosci. 1997;14:691–704. | |
Goodchild AK, Martin PR. The distribution of calcium-binding proteins in the lateral geniculate nucleus and visual cortex of a New World monkey, the marmoset, Callithrix jacchus. Vis Neurosci. 1998;15:625–642. | |
Carey RG, Fitzpatrick D, Diamond IT. Layer I of striate cortex of Tupaia glis and Galago senegalensis: projections from thalamus and claustrum revealed by retrograde transport of horseradish peroxidase. J Comp Neurol. 1979;186(3):393–437. | |
Casagrande VA, Khaytin I, Boyd J. The evolution of parallel visual pathways in the brains of primates. In: Preuss TM, Kaas JH, editors. Evolution of Nervous Systems. Waltham (MA): Academic Press; 2006;4:87–108. | |
Kaneko T, Fujiyama F. Complementary distribution of vesicular glutamate transporters in the central nervous system. Neurosci Res. 2001;42:243–250. | |
Kaneko T, Fujiyama F, Hioki H. Immunohistochemical localization of candidates for vesicular glutamate transporters in the rat brain. J Comp Neurol. 2002;444:39–62. | |
Ding Y, Casagrande VA. Synaptic and neurochemical characterization of parallel pathways to the cytochrome oxidase blobs of primate visual cortex. J Comp Neurol. 1998;391:429–443. | |
Horton JC, Hocking DR. Myelin patterns in V1 and V2 of normal and monocularly enucleated monkeys. Cereb Cortex. 1997;7:166–177. | |
Horton JC. Cytochrome oxidase patches: a new cytoarchitectonic feature of monkey visual cortex. Philos Trans R Soc Lond B Biol Sci. 1984;304:199–253. | |
Livingstone MS, Hubel DH. Segregation of form, color, movement and depth: anatomy, physiology and perception. Science. 1988;240:740–749. |
 © 2014 The Author(s). This work is published and licensed by Dove Medical Press Limited. The
full terms of this license are available at https://www.dovepress.com/terms
and incorporate the Creative Commons Attribution
- Non Commercial (unported, 3.0) License.
By accessing the work you hereby accept the Terms. Non-commercial uses of the work are permitted
without any further permission from Dove Medical Press Limited, provided the work is properly
attributed. For permission for commercial use of this work, please see paragraphs 4.2 and 5 of our Terms.
© 2014 The Author(s). This work is published and licensed by Dove Medical Press Limited. The
full terms of this license are available at https://www.dovepress.com/terms
and incorporate the Creative Commons Attribution
- Non Commercial (unported, 3.0) License.
By accessing the work you hereby accept the Terms. Non-commercial uses of the work are permitted
without any further permission from Dove Medical Press Limited, provided the work is properly
attributed. For permission for commercial use of this work, please see paragraphs 4.2 and 5 of our Terms.