Back to Journals » Journal of Inflammation Research » Volume 12
Particulate and solubilized β-glucan and non-β-glucan fractions of Euglena gracilis induce pro- and anti-inflammatory innate immune cell responses and exhibit antioxidant properties
Authors Phillips FC, Jensen GS ![]() , Showman L, Tonda R
, Showman L, Tonda R ![]() , Horst G
, Horst G ![]() , Levine R
, Levine R
Received 23 October 2018
Accepted for publication 24 December 2018
Published 5 March 2019 Volume 2019:12 Pages 49—64
DOI https://doi.org/10.2147/JIR.S191824
Checked for plagiarism Yes
Review by Single anonymous peer review
Peer reviewer comments 2
Editor who approved publication: Professor Ning Quan
Farrah C Phillips,1,* Gitte S Jensen,2 Lucas Showman,3 Rachel Tonda,1 Geoff Horst,4 Robert Levine4,*
1Kemin Industries, Animal Nutrition and Health of North America, Des Moines, IA 50317, USA; 2NIS Labs, Klamath Falls, OR 97601, USA; 3W.M. Keck Metabolomics Research Laboratory, Iowa State University, Ames, IA, USA; 4Kemin Industries, Plymouth, MI 48170, USA
*These authors contributed equally to this work
Purpose: The purpose of this work was to determine the pro- and anti-inflammatory properties of the single-cell organism Euglena gracilis (EG) and various fractions of its whole biomass.
Methods: Heterotrophically grown EG was tested, along with its aqueous fraction (E-AQ), the intact linear β-glucan paramylon granules (PAR), and alkaline-solubilized paramylon. Peripheral blood mononuclear cell cultures were treated with the test products and analyzed for a variety of cellular responses. Immune cell activation was evaluated by flow cytometry detection of CD69 levels on CD3−CD56+ NK cells, CD3+CD56+ NKT cells, and monocytes, and cytokines were analyzed from the cell culture supernatants. Antioxidant capacity was measured by Folin–Ciocalteu assay and cellular antioxidant protection and MTT assays.
Results: EG and E-AQ were the most effective in driving immune cell responses as measured by CD69 upregulation on NK and NKT cells and proinflammatory (tumor necrosis factor, IL-6, IL-1β) cytokine production. None of the test products effectively stimulated monocyte. EG and PAR inhibited reactive oxygen species under conditions of oxidative stress. E-AQ contained antioxidants capable of providing cellular antioxidant protection from oxidative damage and protection of mitochondrial function under inflammatory conditions.
Conclusion: The effects of EG on immune function are only partially attributable to the content of the β-glucan, paramylon. The regulation of additional cellular responses, such a reactive oxygen species production and resistance to oxidative stress, is likely mediated by currently unknown molecules found in the EG cell.
Keywords: CAP-e, oxidative stress, PAMP, Dectin-1, paramylon, mannitol
Introduction
Algae have been recognized as an important source of nutrition for thousands of years. More recently, interest has grown in utilizing algae as components of functional foods and nutraceuticals that provide more targeted health benefits.1 Microalgae are a unique source for several bioactive compounds that are now used commercially, such as β-carotene, astaxanthin, lutein, docosahexaenoic acid, eicosapentaenoic acid, sulfated polysaccharides, and phycobiliproteins.2,3 Recently, the well-studied but previously uncommercialized microalgae Euglena gracilis (EG) has been receiving more attention as a possible source of numerous biotechnologically important compounds.4 This work explores the immunomodulating properties of whole EG, its water-soluble fraction, and the purified β-glucan, paramylon.
EG is a spindle-shaped unicellular microalga belonging to the Euglenaceae family. The cell contains one nucleus, an eyespot, a contractile vacuole, a flagellum, and chloroplasts with either pigments, when grown in light, or proplastids, when grown in the dark.5 EG has been found widely in nature, including freshwater ponds, lakes, and various wastewaters, and can survive in a wide range of temperature and pH extremes.5 EG can grow in a variety of laboratory conditions including autotrophically with CO2 and light as the sole source of carbon and energy, mixotrophically in light with an organic carbon source, or heterotrophically in the dark with a carbon source.4 A defining feature of EG is its ability to synthesize the highly crystalline storage polysaccharide paramylon, a linear, unbranched β-d-glucan polymer (Figure S1A) that is deposited in the cells as small discoid granules between 1 and 3 µm in size.6 β-glucan is an immune modulator known as a pathogen-associated molecular pattern (PAMP); however, the magnitude of its immunostimulatory properties may be dependent upon its source.7 Upon recognition by cell surface receptors such as Dectin-1, a signaling cascade within immune cells such as macrophages and dendritic cells results in increased rates of phagocytosis and antigen presentation, production of ROS, and secretion of cytokines and chemokines.6,8 Due to its insolubility in water and lack of attachment to other cell components, paramylon can be readily isolated from Euglena cells by simple mechanical processing followed by washing, drying, and milling.
Because it is easy to isolate, much work has focused on the immune-stimulating properties of purified paramylon. For example, Kondo et al found that injected paramylon served as an effective adjuvant in mice, increasing antibody titers against sheep red blood cells and upregulating the cytokines IL-1 and IL-6.9 More recently, Sugiyama et al found that orally fed paramylon had hepatoprotective effects in mice challenged with carbon tetrachloride via an antioxidative mechanism.10 The same group later reported that oral consumption of paramylon inhibited the development of atopic dermatitis-like skin lesions in sensitized NC/Nga mice, most likely by reducing serum levels of both IL-4 and IFN-γ as well as the IL-18 and IL-12 contents of the skin lesions.11 Another study on mice showed that paramylon has antitumor effects and reduced preneoplastic aberrant crypt foci in the colon.12 In vitro work has also validated that paramylon is immunomodulatory, though to varying degrees depending on its physical pretreatment.13–15 In this work, we examined paramylon as well as alkaline-solubilized paramylon (PAR-S) to compare its effect in human peripheral blood mononuclear cells (PBMCs) with whole EG and a water-soluble extract that contains non-β-glucan components.
To date, very few studies have considered the non-β-glucan fraction of EG biomass for human health applications. Although Euglena has been investigated to produce vitamin E,16,17 and studies have detailed the presence of various carotenoids in Euglena,18 only one report on the biological activity of Euglena extracts free of β-glucan.19 Tolivia et al demonstrated that there was a substantial antioxidant activity due to polyphenols in Euglena, as well as some antitumor activity based on a bioassay of the inhibition of wheat seeds.19 Their work was limited, however, to the study of two photosynthetically grown strains of EG. The present work is the first to report the biological activity of heterotrophically grown Euglena biomass, as well as its paramylon and nonparamylon fractions.
Materials and methods
Materials and reagents
Folin–Ciocalteu phenol reagent, PBS, Roswell Park Memorial Institute 1640 (RPMI-1640) medium, penicillin–streptomycin 100×, IL-2, polyinosinic–polycytidylic acid (poly I:C), and lipopolysaccharide (LPS) were purchased from Millipore Sigma-Aldrich Co. (St. Louis, MO, USA). CD69 fluorescein isothiocyanate, CD56 phycoerythrin, CD3 peridinin chlorophyll protein, and heparin Vacutainer vials were purchased from BD Biosciences (Franklin Lakes, NJ, USA). Bio-Plex Pro™ human cytokine 10-Plex arrays were purchased from Bio-Rad Laboratories Inc. (Hercules, CA, USA).
EG algal product and fractions
The dried whole EG powder and purified paramylon granules were provided by Kemin Industries (Des Moines, IA, USA). Both products were produced by first growing EG ATCC PTA-123017 heterotrophically in sterile fermenters under controlled environmental conditions. The fermenter contents were dried and milled to produce the whole biomass powder, or the paramylon was first isolated and then washed, dried, and milled. Both products have been previously described and evaluated for genotoxicity and both acute and subchronic toxicity in rodents.20 For the preparation of the test fractions used for this project, stocks of the dry Euglena powder and paramylon were suspended in PBS at 100 and 50 mg/mL, respectively, and were frozen at −20°C prior to use. The aqueous extract of the Euglena biomass was prepared by mixing 1 g of dry powder with 10 mL of sterile PBS under constant agitation at room temperature for 2 hours. The suspension was centrifuged, and the supernatant was filtered through 0.22 µm cellulose acetate filters. Liquid aliquots of the sterile-filtered water extract were stored at −20°C until use. Solubilized paramylon was obtained from the dry paramylon through dissolution of 1 g paramylon granules in 100 mL of 1 M NaOH, followed by neutralization to pH 7 by slowly adding 3.8 mL of 4.1 M HCl under vigorous agitation. The resulting material was washed three times by centrifugation and resuspended in deionized water to remove salt. The solubilized paramylon was then suspended in PBS and stored at −20°C until use. Prior to use, each test product stock solution suspended in PBS was thawed and passed through homogenization spin columns (QIAshredder, Qiagen, Hercules, CA, USA) to disrupt any aggregates. From the homogenized stock, five-fold dilutions were prepared for use in cell culture experiments. The concentration of each test product is reported on a whole algae equivalent (WAE) basis. For example, specific volumes of the 100 mg/mL stock solution of EG were added to cell cultures so that the final concentration of EG powder in the cell culture work was 10, 2.0, 0.4, and 0.08 mg/mL. The same volumes of the aqueous extract stock solution were also added to each cell culture to achieve the same WAE concentrations, even though on a dry matter basis the concentration of actual extract would be about 20% that of the WAE concentration. For paramylon, the stock concentration was prepared to contain only 50 mg/mL since EG contains about 50% β-glucan. Finally, since base-solubilized paramylon was hypothesized to be more potent, this product was tested at 2, 0.4, and 0.08 mg/mL WAE concentrations.
Characterization of test products
The dried EG and paramylon were analyzed in Covance Laboratories to determine the amount of moisture (AOAC 925.09), crude fat (AOAC 922.06), crude protein (AOAC 968.06), ash (AOAC 923.03), and total carbohydrates (calculated by difference). The vitamin and carotenoid content of the dried EG material were analyzed via HPLC by Craft Technologies (Wilson, NC, USA). The β-glucan content of the products was measured using an aniline blue fluorescent dye-binding assay following the microplate procedure as described previously with minor modifications.21 The test products (1 mg/mL) were dissolved in 0.5 M NaOH and then adjusted to neutral pH with 1 M acetic acid prior to dilution to 25 mL. Samples were diluted 10- to 100-fold in 1 M NaOH prior to running the fluorescence assay. Curdlan was used as the β-glucan standard for fluorescence assays.22 EG water extracts were prepared for gas chromatography–mass spectrometry (GC-MS) analysis. One gram of dried algae was extracted with 10 mL of HPLC grade water by vortexing for 3 minutes and rested at room temperature for 2 hours. Rested samples were vortexed again briefly and centrifuged at 1,000× g for 3 minutes. Extract supernatants were passed through a 0.20 μM polytetrafluoroethylene (PTFE) filter and reduced by 0.1 mL under a nitrogen stream. To prepare for GC-MS analysis, extracts were subjected to methoximation with methoxyamine hydrochloride at 30°C for 90 minutes. Samples were silylated with BSTFA/TMCS at 60°C for 30 minutes and then subjected to GC-MS on a 7890C gas chromatograph (Agilent Technologies, Santa Clara, CA, USA) in tandem with a 5975C MSD. The GC oven program began at 80°C and was ramped at 5°C/minute to 320°C, which was held for 6 minutes. The mass range was set from 40 to 800 m/z. The separation column was an HP5MSI (30 m long, 0.250 mm ID, 0.25 µm film thickness). The mass spectrometer operated under standard conditions with a 230°C ion source. Identification and quantification were conducted using automated mass spectral deconvolution and identification system (AMDIS) with a manually curated retention indexed GC-MS library with additional identification performed using the NIST14 GC-MS spectral library. Scanning electron microscopy was performed at Iowa State University (Ames, IA, USA) in the Roy J. Carver High Resolution Microscopy Facility on a Hitachi SU4800 field emission scanning electron microscope.
Isolation of PBMCs, polymorphonuclear (PMN) cells, and erythrocytes
Peripheral venous blood was drawn from the antecubital vein from healthy human donors into heparinized Vacutainer tubes, upon written informed consent from subjects, and approved for ethical standards by the Sky Lakes Medical Center Institutional Review Board (Federalwide Assurance 2603). Whole venous blood was layered onto Lympholyte-poly (Cedarlane Labs, Burlington, NC, USA) and centrifuged at 400× g for 35 minutes to separate layers in the gradient, composed of PBMCs, PMN cells, and erythrocytes. Each cellular fraction was harvested by aspiration using sterile bulb pipettes and washed with PBS. PBMC and PMN cells were washed twice and erythrocytes four times prior to use in assays (mixed cell population referred to as PBMCs; single population specified as PMN).
Expression of the CD69 activation marker on PBMC subsets as a measure of immune cell activation
The immune modulating effects of the Euglena-derived fractions were tested using cultures of human PBMCs that were untreated or treated with bacterial LPS or the viral mimetic, poly I:C. Freshly isolated PBMCs were first exposed to the Euglena fractions (EG, aqueous fraction of EG [E-AQ], granular paramylon [PAR], and PAR-S tested at 0.08, 0.4, and 2.0 mg/mL; additional 10 mg/mL concentration for EG, E-AQ, and PAR) and then either left without further treatment or treated immediately thereafter with LPS (10 ng/mL) or poly I:C (2.5 µg/mL). Each product was tested in triplicate at four concentrations. In each experiment, a set of cultures that did not receive the test products served as a negative control and cultures receiving LPS (10 ng/mL), poly I:C (2.5 µg/mL), or IL-2 (100 IU/mL) served as positive controls for immune activation. After the 24-hour incubation, the culture supernatants were harvested and stored frozen for cytokine analysis. The cells were washed in PBS with bovine serum albumin and sodium azide and stained with fluorochrome-conjugated monoclonal antibodies specific for CD3, CD56, and CD69. The samples were analyzed by multiparameter flow cytometry using an acoustic dual laser Attune® flow cytometer (Molecular Probes, Eugene, OR, USA). During data analysis, electronic gating was used to perform separate analysis on changes to the CD69 mean fluorescence intensity (MFI) on lymphocytes vs monocytes based on their distinct size and granularity, using the forward and side scatter properties. The MFI was used because changes in CD69 expression represent a gradient from low through high levels of CD69 on the cell membrane, and using MFI is more accurate than attempting to define a certain expression range as negative vs positive for CD69. Expression of CD69 on the lymphocyte population was performed in triplicate samples from three different healthy donors on the NK cell (CD3−CD56+) and NKT cell (CD3+CD56+) subsets.
Cytokine levels in PBMC cultures
The supernatant from each PBMC culture was tested for a panel of pro- and anti-inflammatory cytokines, antiviral peptides, and regenerative growth factors using a 10-plex Luminex magnetic bead array and the MagPix® multiplexing system (Luminex, Austin, TX, USA). The following Luminex panel was obtained from R&D Systems (Minneapolis, MN, USA): IL-1β, IL-1RA, IL-2, IL-4, IL-6, IL-10, G-CSF, IFN-γ, MIP-1α, and TNF.
ROS formation by inflammatory PMNs
The test products were evaluated for their effects on ROS formation using human PMN cell cultures.23 Freshly isolated PMNs were pretreated with test products for 20 minutes, where each test product was tested in triplicate at four concentrations. The PMNs were washed twice in PBS and loaded with the cell-permeant indicator 2′,7′-dichlorodihydrofluorescein diacetate (H2DCFDA) (a chemically reduced form of fluorescein). H2DCFDA enters a cell in a nonfluorescent form and is retained inside the PMN cell due to enzymatic cleavage of acetate groups by intracellular esterase. This resulting precursor dye turns fluorescent upon exposure to intracellular ROS. Formation of ROS was triggered by addition of H2O2 (2 mM) for 45 minutes. Cells were washed and then transferred to RPMI-1640 cell culture medium. Fluorescence intensity was evaluated immediately by flow cytometry using an Attune acoustic focusing cytometer using an acoustic dual laser Attune flow cytometer (Molecular Probes). The low fluorescence intensity of untreated control cells served as a baseline and PMNs treated with H2O2 alone served as a positive control for ROS formation. Six H2O2-treated cultures were acquired by flow cytometry immediately before acquisition of the cultures treated with Euglena fractions, and another six H2O2-treated samples were acquired after all Euglena-treated samples. In this assay, the cell cultures cannot be treated with a fixative and must be done on living cells. The flow cytometry was performed over time and a small difference was typically observed between the two sets of H2O2-treated samples. This difference, reflecting slight changes in intracellular ROS formation in cultures that were waiting for flow cytometric acquisition, was accounted for in the data analysis by incremental adjustment of fluorescence intensity values for the order in which samples were acquired against the change over time in ROS formation between the two sets of H2O2-treated control cultures. This adjustment was necessary for the most correct comparison of the Euglena fractions. The testing was performed on PMNs from three different healthy donors.
Total antioxidant capacity
Total antioxidant capacity of each test product was evaluated by the Folin–Ciocalteu assay, which is a colorimetric in vitro assay for determining levels of phenolic and polyphenolic antioxidants.24 For each test product, six concentrations were tested in duplicate. Gallic acid was used as a reference standard, and the results were calculated in gallic acid equivalents per gram of product. The Folin–Ciocalteu phenol reagent was added to serial dilutions of the test products and incubated for 5 minutes. Sodium carbonate was added and the reaction continued for 30 minutes at 37°C. Measurements of the optical absorbance at 765 nm were read in a colorimetric microplate reader (BioTek PowerWave, Winooski, VT, USA).
Cellular antioxidant protection and bioavailability
To test for antioxidant bioavailability at the cellular level, the cellular antioxidant protection of erythrocytes (CAP-e) assay was used.25,26 Human erythrocytes were treated with duplicate, two-fold serial dilutions of test products in physiological saline for 20 minutes. During this incubation time, antioxidant compounds able to cross the cell membrane enter the cell. Following the incubation of erythrocytes with test products, the erythrocytes were washed twice with PBS to remove any compounds from the test products that were not absorbed by the cells. Cultures were then treated with the indicator dye DCFDA, which becomes fluorescent when oxidized, and the peroxyl-free radical generator 2,2′-azobis-2-methyl-propanimidamide, dihydrochloride (AAPH) was added to trigger oxidation. Control cultures were performed in hexaplicate and included untreated erythrocytes as a negative control (not exposed to test products or AAPH) and erythrocytes treated with AAPH in the absence of test products (positive control and reference for the analysis of the protection provided by test products). After exposure to AAPH for 1 hour, the fluorescence intensity was measured at 488 nm using a Tecan Spectrafluor plate reader (Tecan, Männedorf, Switzerland). When a reduction of fluorescence intensity was observed in erythrocytes exposed to a test product prior to exposure to AAPH, this was indicative that the test product contained antioxidants able to penetrate the cells and protect them from oxidative damage.
Mitochondrial metabolic activity
The effects of test products on the mitochondrial metabolic activity of PBMCs were tested using the colorimetric MTT assay in which NAD(P)H-dependent cellular oxidoreductase enzymes reduce the tetrazolium dye MTT to formazan, which has a purple color. Briefly, freshly harvested PBMCs were cultured in the presence of test products for 24 hours at 37°C, 5% CO2, where each test product was evaluated at six concentrations tested in triplicate. After this incubation, the cells were treated with the MTT dye for 4 hours to allow the color formation to take place in proportion to mitochondrial function. This incubation allows the PBMC mitochondria to convert the formazan dye to the purple formazan compound. Subsequently, the cells were lysed overnight with SDS. Measurements of the optical absorbance at 570 nm were read in a colorimetric microplate reader (BioTek PowerWave).
Statistical analysis
MFI values were normalized to the average absorbance of the untreated cell culture media or LPS or poly I:C-treated cell culture media. Graphic analysis was performed using GraphPad Prism version 7.04 for Windows, GraphPad Software, La Jolla, CA, USA.
Results
Test product preparation and characterization
Dried whole EG (Figure S1B) is a golden-yellow powder (Figure S1C) and contains about 23% protein, 7.5% fat, 5% ash, and 65% total carbohydrates. EG cell is about 51% β-glucan and after drying retains ~3% moisture (Table 1). The paramylon is a white powder (Figure S1D) that is almost entirely β-glucan (98.1%) with trace amounts of residual protein and fat from the purification process (Table 1). Scanning electron microscopy of the paramylon revealed that the granules are uniform in shape and size and frequently form aggregates (Figure S1E). Multiangle light scattering analysis in combination with size exclusion chromatography measured the paramylon molecular weight to be 633.8 kDa, which translates to 3,517 glucose units, or degree of polymerization (data not shown). The golden color of the dried algae suggests the presence of carotenoids, and HPLC analysis demonstrated that the algae contains about 21.7 µg/g total carotenoids, with the most abundant being 10.5 µg/g β-carotene (Table 2). There is also canthaxanthin (4.9 µg/g), β-cryptoxanthin (6.0 µg/g), trans-lutein (3.7 µg/g), and vitamin A (10.5 µg/g) (Table 2). The aqueous extract appeared golden-orange in color, and on a dry weight basis about 23% of the starting EG biomass was extracted into the water phase. GC-MS analysis of the water extract revealed that sugar alcohols and free amino acids were detected at a concentration of 28.1 mg/mL and 17.8 mg/L, respectively (Table 3). Mannitol, a widely studied osmotherapeutic that can modulate inflammation27 contributed to 27.9 mg/mL of the total sugar alcohols. Other significant sugars detected were glucose and trehalose, which contributed to a total sugar concentration of 34.3 mg/mL (Table 3). The amino acid composition was dominated by l-leucine, followed by l-valine, and proline at concentrations of 2.4, 1.8, and 1.5 mg/mL, respectively (Table 3).
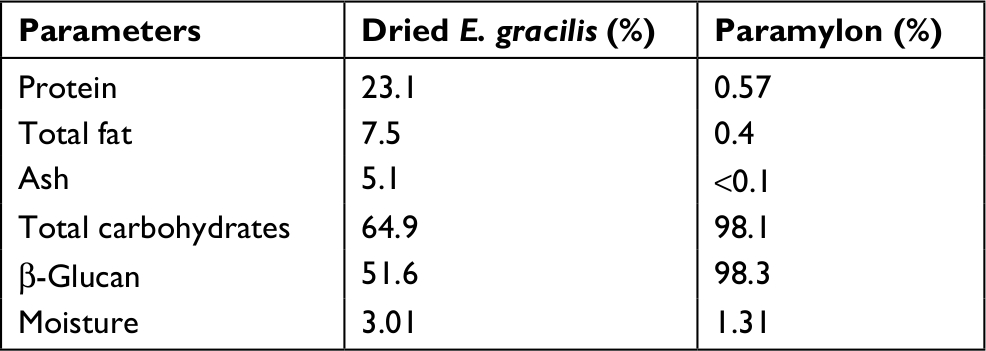 | Table 1 Proximate analysis of dried Euglena gracilis and paramylon |
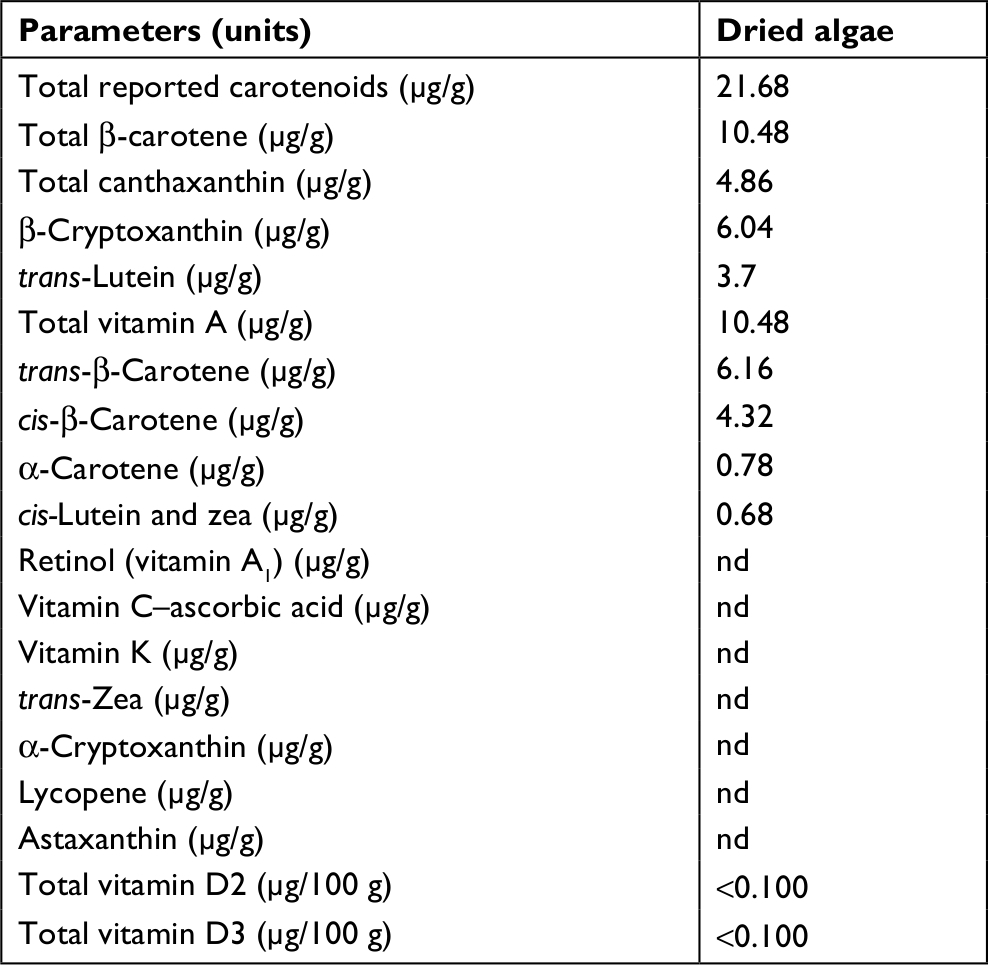 | Table 2 Detailed analysis of vitamins and pigments in dried Euglena gracilis Abbreviation: nd, not detected. |
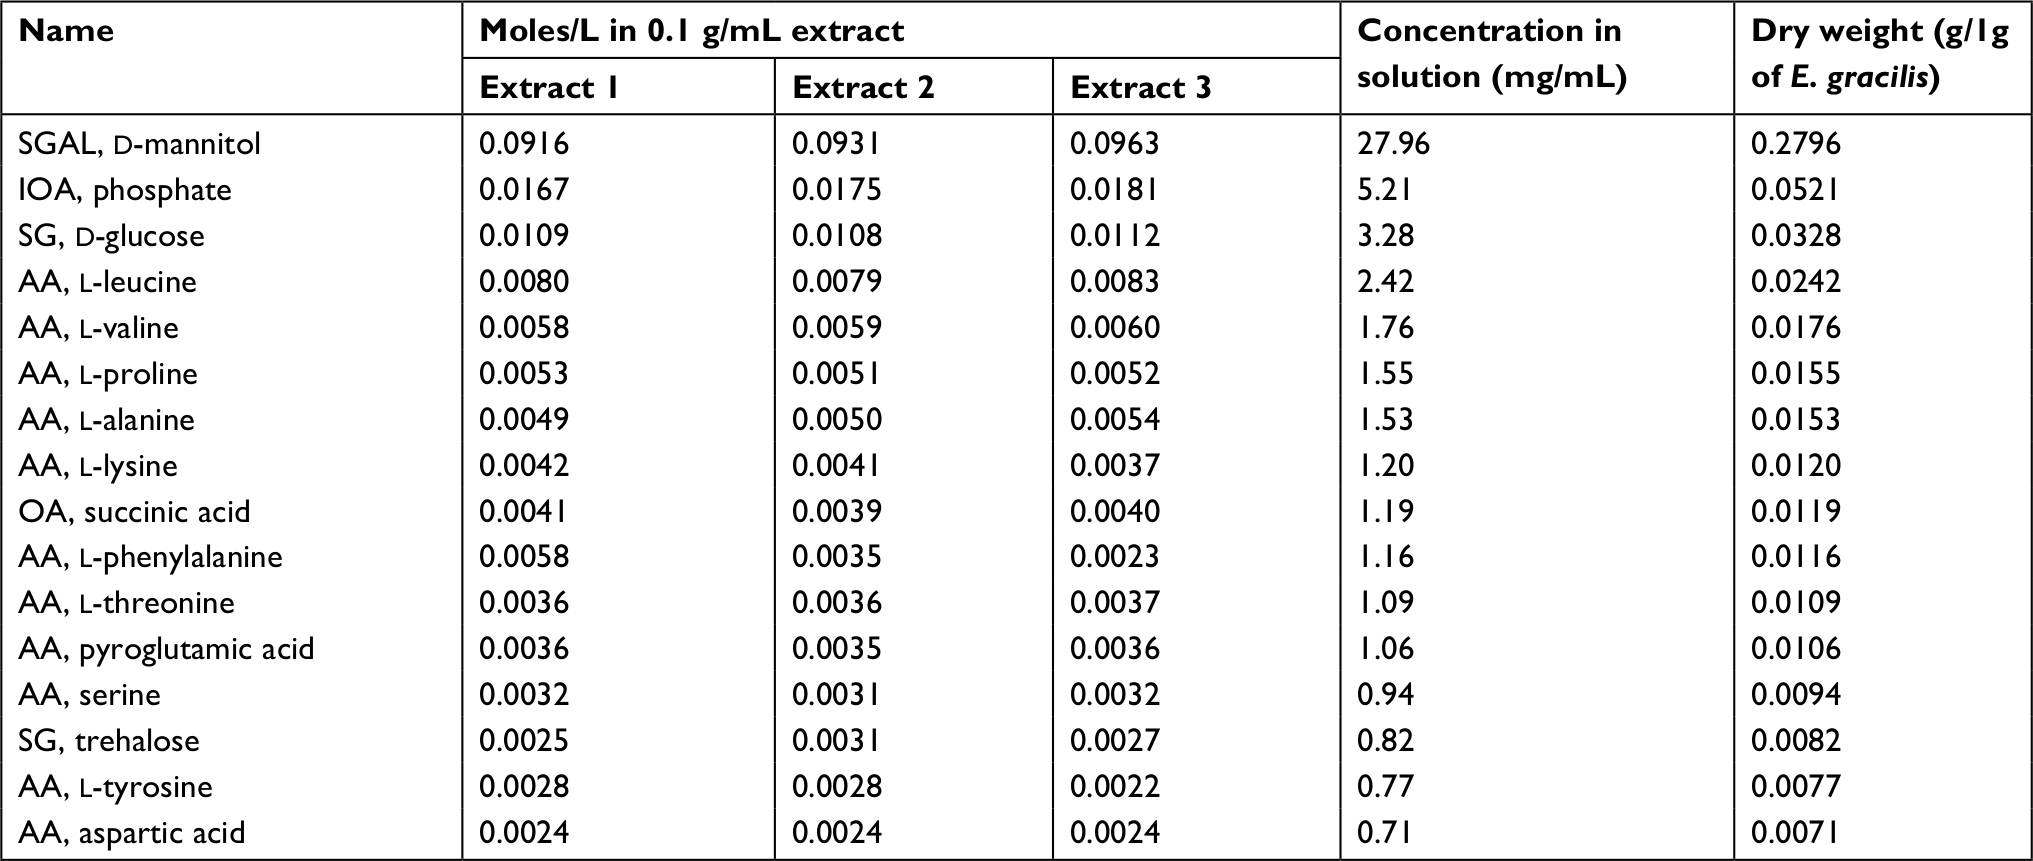 | Table 3 GC-MS analysis of Euglena gracilis water extracts Abbreviation: GC-MS, gas chromatography–mass spectrometry. |
NK and NKT cells upregulate CD69 in response to whole EG
PBMCs were used to examine the immune cell-activating properties of the four test products (Table 4) and two known inflammatory PAMPs: LPS, a Gram-negative cell wall component that activates toll-like receptor (TLR) 4 and poly I:C, a viral mimetic that activates TLR3. After 24-hour stimulation, the PBMC cultures were stained with CD3-, CD56-, and CD69-specific antibodies and analyzed by flow cytometry. The initial forward and side light scatter separated lymphocytes from monocytes, and the lymphocyte gate was further divided into NK cells (CD3−CD56+) and NKT cells (CD3+CD56+) (Figure 1A). These cells were analyzed for the expression of CD69 and represented as a fold increase over the unstimulated control (Figure 1B–D).
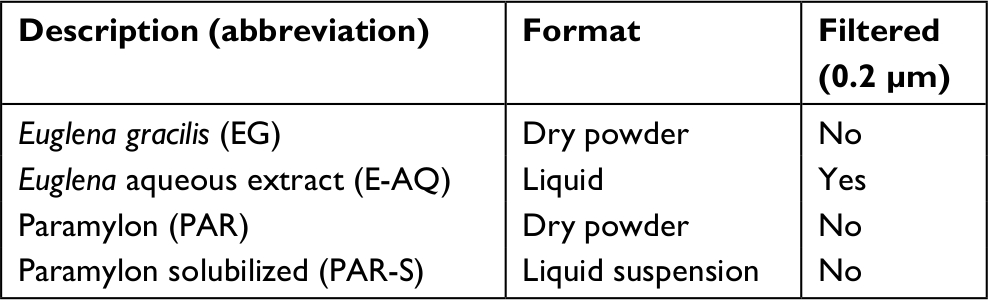 | Table 4 List of test products |
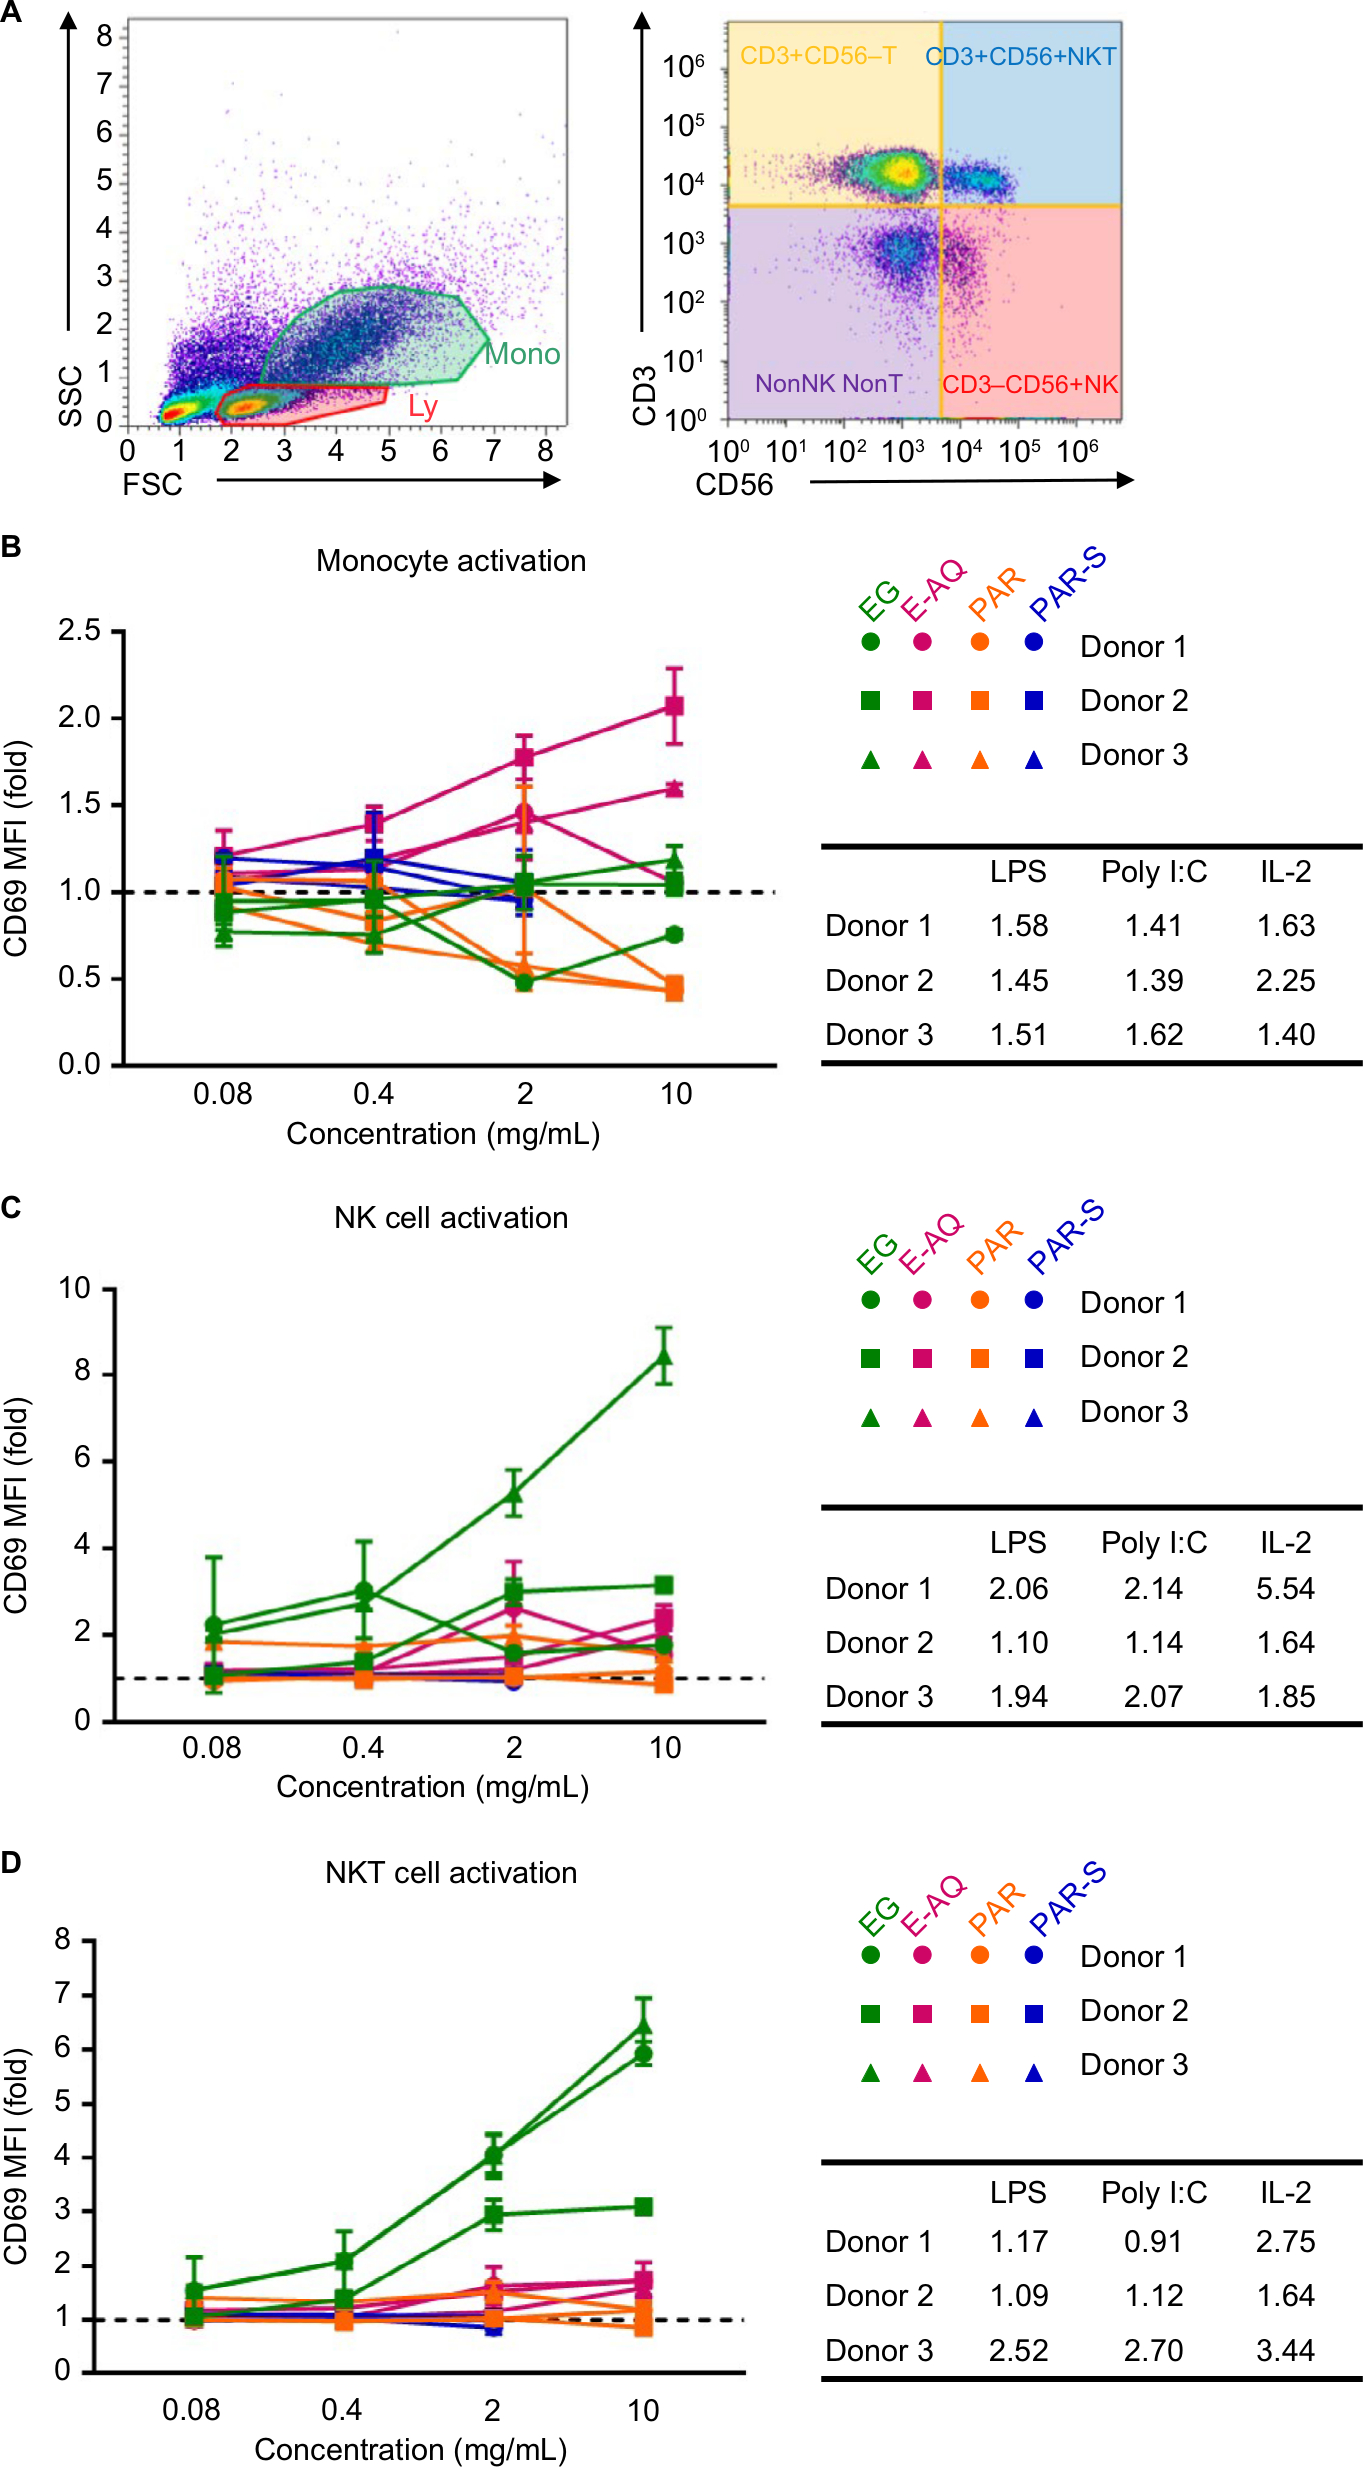 | Figure 1 CD69 expression on human PBMC subsets is modulated by EG, but not E-AQ, PAR, or PAR-S. Notes: Human PBMCs from three healthy donors were cultured untreated or stimulated in vitro for 24 hours with LPS (10 ng/mL), poly I:C (2.5 µg/mL), IL-2 (100 IU/mL), or each of the four test products (EG, E-AQ, PAR, and PAR-S), stained and analyzed by flow cytometry. (A) Representative flow plots of gating strategy for identifying innate cell subsets. These subsets were analyzed for the expression of CD69, which is represented as a fold increase in MFI over the untreated control (dotted line) in (B) monocytes, (C) NK cells, and (D) NKT cells. In the table, the average fold increase in CD69 MFI for each donor by the positive controls is shown. All samples were analyzed in triplicate. Symbols represent mean ± SD. Abbreviations: E-AQ, aqueous fraction of EG; EG, Euglena gracilis whole algae; LPS, lipopolysaccharide; MFI, mean fluorescence intensity; PAR, granular paramylon; PAR-S, alkaline-solubilized paramylon; PBMCs, peripheral blood mononuclear cells; poly I:C, polyinosinic–polycytidylic acid. |
Monocyte stimulated with the TLR agonists or IL-2 upregulated CD69 expression 1.5- to 2.0-fold (Figure 1B). PAR at 2 and 10 mg/mL reduced CD69 expression in monocytes by about 0.5-fold compared with control, and PAR-S did not have any effect. The whole EG did not change CD69 expression on monocytes, and the E-AQ induced CD69 expression 1.5- to 2.0-fold in samples from two of the three donors (Figure 1B). These changes in CD69 expression are modest and could be due to constitutive expression of CD69 on the untreated monocytes, a variation in maturity of a mixed monocyte population, or an unknown inhibitory factor present in the cell culture.
NK and NKT cells both responded to EG at the 2 and 10 mg/mL concentrations by upregulating CD69 expression, but the response was variable between donors (Figure 1C, D). PAR-S and PAR did not induce CD69 expression in either lymphocyte cell type. E-AQ induced expression of CD69 like the LPS and poly I:C controls; this two-fold increase was only observed at the highest concentration of E-AQ. The response to EG and the muted response to E-AQ suggest that there is an insoluble or semisoluble fraction of EG that is not paramylon that may trigger a response from these CD1d-restricted innate lymphocytes.
Stimulation of PBMCs with the test products was also performed in the presence of LPS or poly I:C to determine if EG and its soluble components have anti-inflammatory properties. In the presence of LPS or poly I:C, CD69 expression on the PBMC subsets also treated with the test products mirrored that which was observed in the stimulated cells without additional PAMP in the culture (Figure S2A–F). This observation indicates that the cell activation response observed in the combination stimulation conditions is dominated by the test products and that these products do not directly interfere with TLR3- and TLR4-mediated cell activation and CD69 expression.
EG and E-AQ activate a proinflammatory immune response
The media supernatants from the stimulated, mixed cell population were analyzed by multiplex immunoassay. Some of the cytokines in the multiplex panel were below the limit of detection (IFN-γ, IL-2, and IL-4) or had an error size within samples that exclude the data from accurate analysis (MIP-1α). However, several of the analyzed proteins in the supernatant were induced by the test products, with often EG being the most potent.
EG and E-AQ increased the levels of tumor necrosis factor (TNF or TNFα) (Figure 2A) and IL-6 in a concentration-dependent manner (Figure 2B). EG and E-AQ did induce some of the highly inflammatory cytokine, IL-1β; however, the variability between donors was much more pronounced compared with TNF and IL-6. For all the proinflammatory cytokines, donor 1 had a much stronger response than either donor 2 or donor 3 (Figure 2A–C). PAR induced TNF at a low level (Figure 2A) but did not induce secretion of IL-6 (Figure 2B) or IL-1β (Figure 2C). PAR-S did not induce TNF, IL-6, or IL-1β secretion at any of the tested concentrations (Figure 2A–C).
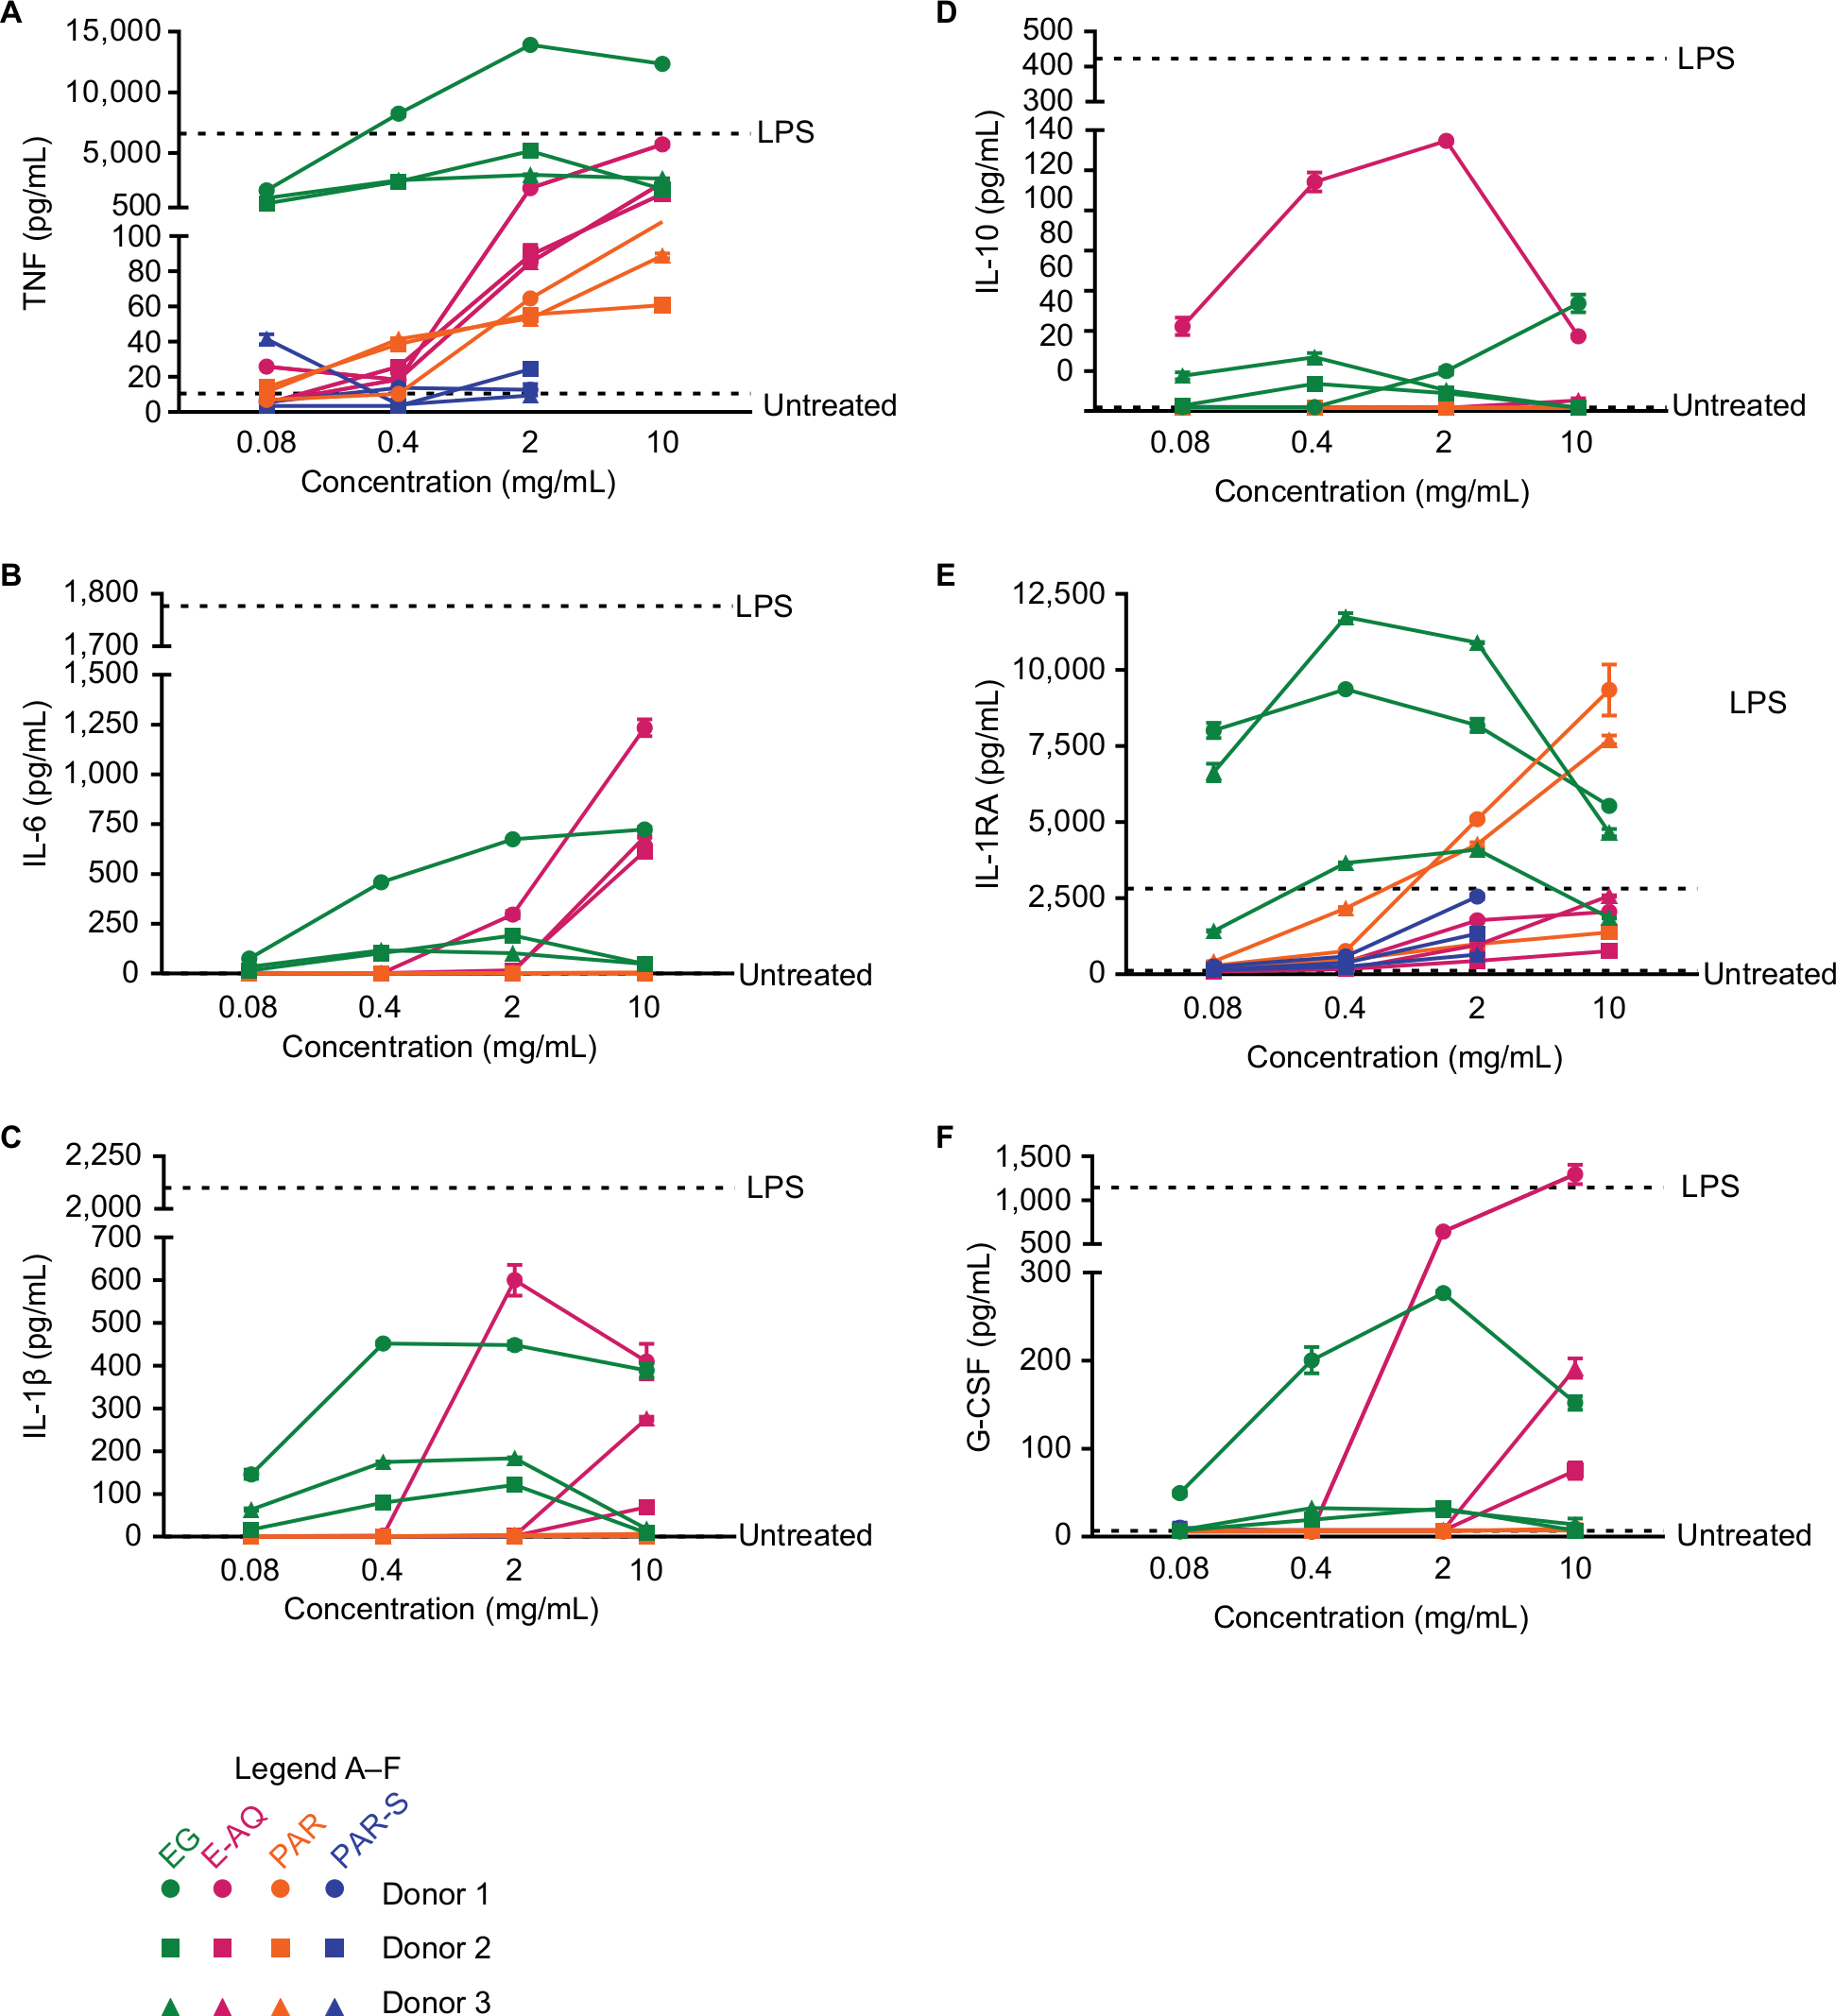 | Figure 2 Cytokine and growth factor production by human PBMCs is modulated by EG, but not E-AQ, PAR, or PAR-S. Notes: Human PBMCs from three healthy donors were cultured untreated or stimulated in vitro for 24 hours with LPS (10 ng/mL) or each of the four test products (EG, E-AQ, PAR, and PAR-S). Cell culture supernatants were analyzed by Luminex multiplex for (A) TNF, (B) IL-6, (C) IL-1β, (D) IL-10, (E) IL-RA, and (F) G-CSF. All samples were analyzed in triplicate. Symbols represent the mean ± SD. Abbreviations: E-AQ, aqueous fraction of EG; EG, Euglena gracilis whole algae; G-CSF, granulocyte colony stimulating factor; IL-1RA, IL-1 receptor antagonist; LPS, lipopolysaccharide; PAR, granular paramylon; PAR-S, alkaline-solubilized paramylon; PBMCs, peripheral blood mononuclear cells; TNF, tumor necrosis factor. |
The anti-inflammatory cytokine IL-10 was increased with EG stimulation over the untreated control, but this trend was not consistent between donors and was not dependent on the concentration (Figure 2D). E-AQ induced up to 140 pg/mL IL-10 in donor 1 cells but was not observed in the other two donors (Figure 2D). IL-RA, or IL-1 receptor antagonist, is a secreted molecule that blocks IL-1 signaling through a nonproductive interaction with the IL-1 receptor,28 thus having an anti-inflammatory effect in the presence of IL-1α or IL-1β. EG stimulation induced some level of IL-1 receptor antagonist (IL-1RA), but there was less of this anti-inflammatory molecule produced at the highest concentration than at the lowest concentration (Figure 2E). PAR and, to some extent, PAR-S drove a concentration-dependent increase in IL-1RA (Figure 2E). Interestingly, E-AQ, which was a better inducer of the proinflammatory cytokines TNF and IL-6 than PAR, did not stimulate cells to make more IL-1RA than EG or PAR (Figure 2E).
To determine the anti-inflammatory response driven by the test products in the presence of a proinflammatory PAMP, cells were stimulated with the test products followed by either LPS or poly I:C (Figure S3). EG and PAR appeared to inhibit LPS-induced (Figure S3A) and poly I:C-induced (Figure S3C) IL-10 production in a concentration-dependent manner. However, because of the huge variation in IL-10 production between donors as was driven by the LPS or poly I:C stimulus alone, this observation is inconsistent, and it is not possible to draw a solid conclusion about the ability of these test compounds to inhibit IL-10 production in the presence of a proinflammatory signal. Similarly, induction or inhibition of IL-1RA in the presence of LPS (Figure S3B) or poly I:C (Figure S3D) is unintelligible under these conditions.
The growth factor granulocyte colony stimulating factor (G-CSF), known for its role in stem cell mobilization during restorative processes,29 was induced by EG in a similar pattern as the IL-1RA, which was not concentration dependent (Figure 2F). E-AQ also induced G-CSF to a level like LPS stimulation in cells from donor 1, but not from donors 2 and 3 (Figure 2F). PAR and PAR-S did not induce G-CSF (Figure 2F).
ROS formation is inhibited by EG and PAR
A critical part of the innate immune response is to trigger the production of ROS, which has a variety of effects on inflammation. The response triggered by ROS can initiate the highly inflammatory pyroptotic cell death response30 or promote an increase in inflammatory cytokine production.31 Internally generated ROS can be used to digest intracellular components processed via autophagy or phagocytosed pathogens that are now isolated in the phagolysosome.32 Treatment of PMNs with EG and PAR reduced the level of detectable intracellular ROS in the presence of free radical stress (H2O2) (Figure 3). To a lesser extent, the PAR-S and E-AQ also had some ability to reduce intracellular ROS production, but there was more variability between donors and less overall efficacy compared with the insoluble test products (Figure 3).
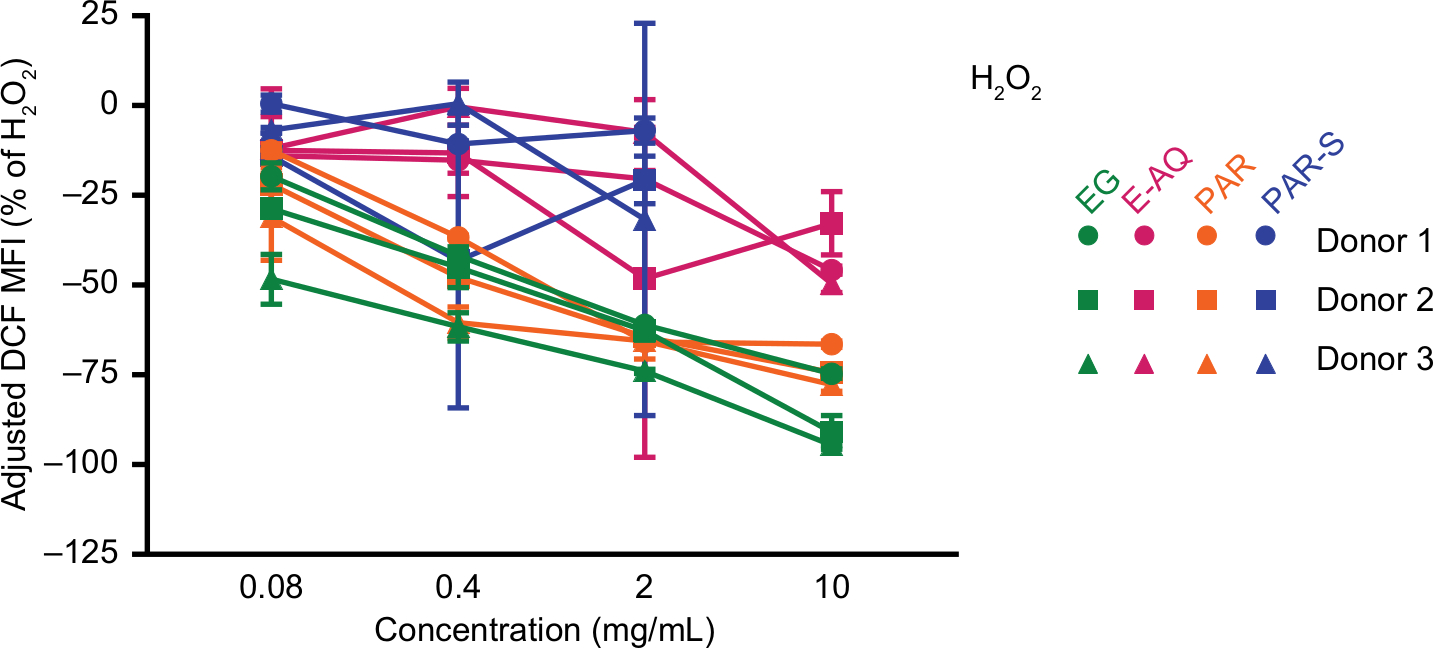 | Figure 3 H2O2-induced ROS production in human PMN cells is inhibited by β-glucan treatment. Notes: Human PMN cells from three healthy donors were pretreated with the four test products and H2DCFDA and then water to induce ROS production. Oxidized, fluorescent DCF is represented as MFI as a percentage of DCF MFI average from the H2O2-treated cells without pretreatment (dotted line). All samples were analyzed in triplicate. Symbols represent mean ± SD. Abbreviations: DCF, dichlorofluorescein; E-AQ, aqueous fraction of EG; EG, Euglena gracilis whole algae; H2DCFDA, 2′,7′-dichlorodihydrofluorescein diacetate; MFI, mean fluorescence intensity; PAR, granular paramylon; PAR-S, alkaline-solubilized paramylon; PMN, polymorphonuclear. |
Aqueous fraction protects cells from free radical stress
The test products were evaluated for total antioxidant capacity by the Folin–Ciocalteu assay. In this assay, E-AQ reached a maximum tested value of 4.0 µg/mL gallic acid equivalents and was concentration dependent (Figure 4A). The antioxidant properties of E-AQ observed in the Folin–Ciocalteu assay were bioavailable at the cellular level, as demonstrated by the results from the CAP-e assay (Figure 4B). The CAP-e assay measures the ability of antioxidants that can enter the erythrocyte to protect it from oxidative damage,26 thus it is a measure of the antioxidant capacity of erythrocyte-permeable compounds within the E-AQ extract. The solubility and/or bioaccessibility of an unknown antioxidant in E-AQ are likely responsible for this anti-inflammatory effect because at the same WAE concentration the EG treatment reached only half the gallic acid equivalents as the E-AQ treatment (Figure 4A). Furthermore, these data suggest that this antioxidant effect was not due to paramylon, which makes up about 50% of the EG product, because PAR and PAR-S exhibited <2.0 µg/mL gallic acid equivalents at concentrations four-fold higher than the concentrations tested for E-AQ (Figure 4A). E-AQ was also tested in an MTT assay where PBMCs were exposed to LPS for 24 hours to induce inflammatory stress. PBMCs treated with E-AQ alone showed better cellular energy production than the LPS treatment control (Figure 4C). Cotreatment of E-AQ with LPS demonstrated that 2 and 10 mg/mL concentrations of E-AQ increased cellular metabolic activity compared with LPS alone (Figure 4C).
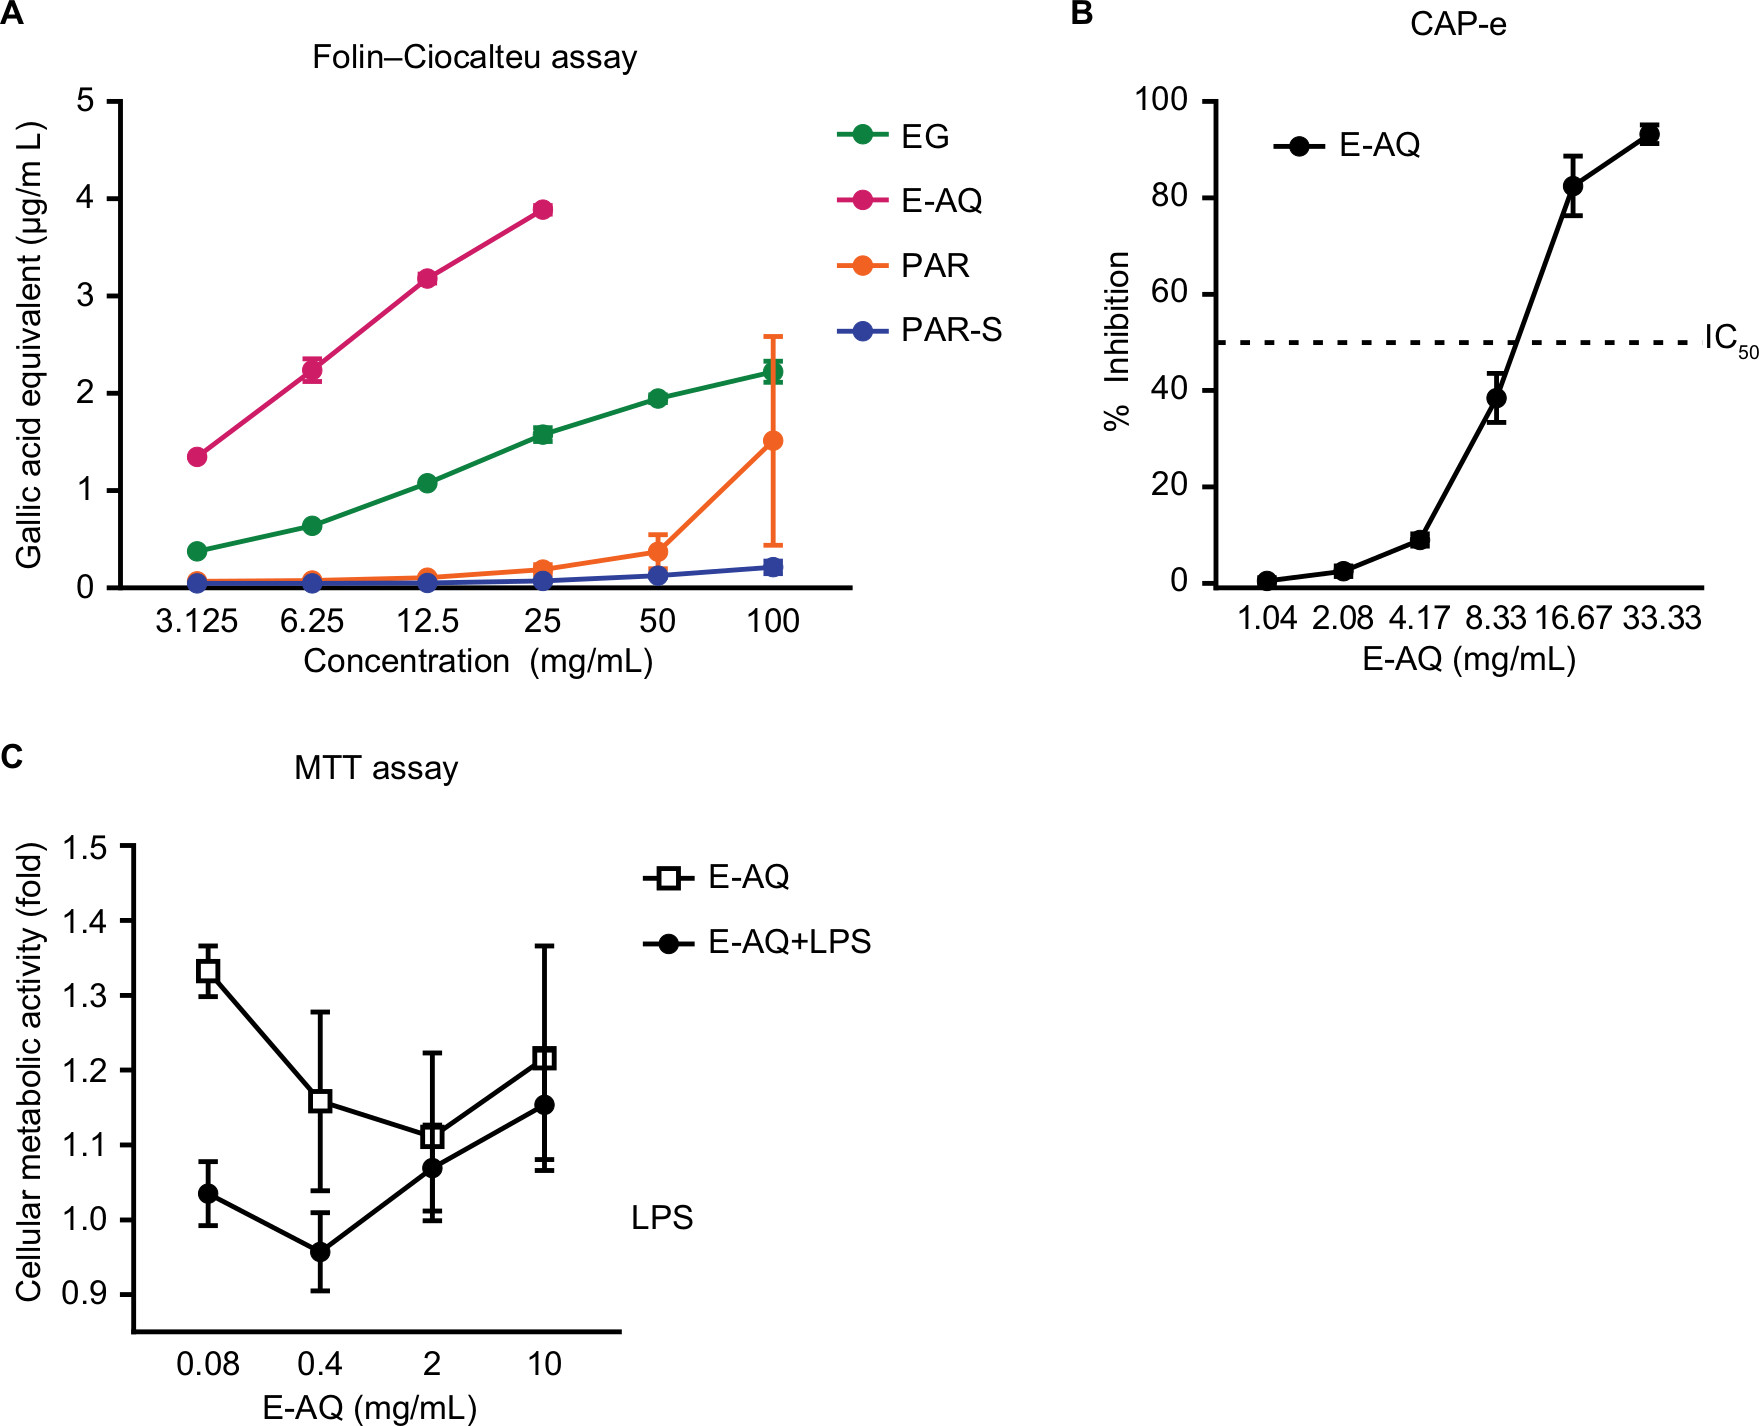 | Figure 4 E-AQ has antioxidant properties and improves mitochondrial metabolism in stressed PBMCs. Notes: The four test products were tested for (A) total antioxidant capacity, (B) antioxidant protection from oxidative stress in erythrocytes, and (C) protection of mitochondrial function under LPS-induced inflammatory culture conditions. Samples in (A–C) were tested in duplicate, quadruplicate, and triplicated, respectively. Symbols represent mean ± SD of replicates, n=1. Abbreviations: CAP-e, cellular antioxidant protection of erythrocytes; E-AQ, aqueous fraction of EG; EG, Euglena gracilis whole algae; LPS, lipopolysaccharide; PAR, granular paramylon; PAR-S, alkaline-solubilized paramylon; PBMCs, peripheral blood mononuclear cells. |
Summary and discussion
The work reported here demonstrates a variety of cellular responses regulated by EG grown under heterotopic conditions. Furthermore, the work shows that the cellular responses, particularly the immune modulating properties of EG, are not due to β-glucan alone. The soluble fraction of EG has antioxidant properties and can increase metabolic activity during cellular stress. Immune modulating effects of EG and E-AQ included direct upregulation of the activation marker, CD69, changes in production of pro- and anti-inflammatory cytokines and growth factors and inhibition of ROS. The antioxidant capacity of EG was measured quantitatively in gallic acid equivalents and functionally in an erythrocyte protection assay. Metabolic activity of peripheral blood cells was protected during endotoxin stress by E-AQ.
CD69 is one of the earliest cell surface antigens expressed by T and B lymphocytes, NK cells, monocytes, neutrophils, and eosinophils.33 Specifically, for NK cells, CD69 is rapidly induced shortly after activation,34 and its direct role in NK cytotoxicity has been demonstrated.35 None of the Euglena fractions drove expression of the activation marker CD69 on monocytes, and only EG treatment increased the expression of CD69 on the NK and NKT cells. This observation suggests that there was a stimulatory molecule present in the whole EG cell preparation that was absent in the purified paramylon products. NK and NKT cells recognize a variety of self and non-self-ligands through evolutionarily conserved receptors such as NKG2D and NK1.1 with or without presentation of the antigen on the nonclassical MHC molecule CD1d,36,37 but there are no reports that have implicated β-glucan signaling in NK and NKT cell activation.
β-glucans derived from sources other than EG drive pro- and anti-inflammatory immune responses through the nuclear factor-κB transcription factor.7 Paramylon has previously been described as a muted immunostimulant compared with other β-glucan sources.7 Similarly, in this study, the purified β-glucan was not a potent activator of cytokine production. However, when the whole Euglena cell or just the aqueous extract of the whole cell was applied to the PBMCs, TNF, IL-6, and IL-1β were detected in the culture supernatant. These cytokines are highly inflammatory and are indispensable when priming adaptive immune responses and licensing dendritic cells. IL-1β is a zymogen that requires cleavage by cysteine protease, caspase-1, while in complex with NLRP3. The active form of IL-1β only released in its active form when the macrophage or monocyte undergoes pyroptotic cell death.38 This type of inflammation is essential for protection against viral infection,39 but when IL-1 (α or β) signaling is chronic, autoinflammatory diseases can develop.40 Anti-inflammatory cytokines IL-10 and IL-1RA were less consistently induced by the test products, but there was an interesting G-CSF response from the E-AQ stimulation. G-CSF is important for granulocyte differentiation and PMN maturation and survival both of which are essential for protection against invading pathogens.41
PAR and EG demonstrated the ability to inhibit ROS production, whereas PAR-S and E-AQ were much less effective (Figure 3). Generally, ROS production is a proinflammatory response and is induced by phagocytosis mechanisms.42 Furthermore, EG was proinflammatory in the PBMC activation as was measured by CD69 expression and cytokine production, and PAR had no effect in these assays. Because EG contains both the soluble fraction and insoluble paramylon and PAR contains only the paramylon, these results suggest that the proinflammatory response was driven by the soluble portion of EG and the anti-inflammatory response was driven by the β-glucan. Conversely, it was the E-AQ fraction that had the highest total antioxidant capacity in the Folin–Ciocalteau assay. This fraction contained unknown antioxidant(s) that functionally protected erythrocytes from intracellular oxidative damage and supported mitochondrial energy production under inflammatory culture conditions.
Conclusion
These results support the previously reported immunomodulatory effects of whole EG, yet acknowledge the substantial evidence which suggests that the paramylon found in EG is not a potent immunomodulator. Specifically, this study fractionated the whole EG from the water-soluble portion (E-AQ) and used purified paramylon in a granular (PAR) or soluble (PAR-S) forms. The data revealed that the proinflammatory properties lie in the EG and E-AQ rather than in the PAR and PAR-S. Furthermore, the paramylon is implicated in regulating ROS production, and the aqueous fraction is an effective antioxidant. These observations make heterotrophically grown EG and its cellular components a worthy subject for further investigation as a source of bioactive natural products.
Acknowledgments
The authors would like to thank Kelli Herrlinger, Laura Wonderling, Sally Moore, and Jon Rubach of Kemin Industries (Des Moines, IA, USA) for their careful review of this manuscript, Katie-Jo Galayda of Kemin Industries (Des Moines, IA, USA) for her molecular weight analysis of β-glucan, and Tracey Stewart of Iowa State University (Ames, IA,USA) biotechnology service facility for her assistance with the scanning electron microscope.
Disclosure
This study was sponsored by Kemin Industries, Des Moines, IA, USA. RL serves as a consultant for Kemin Industries. FCP, RT, and GH are employed by Kemin Industries. GSJ holds a patent for the CAP-e assay (patent number 8465988) and is employed by NIS Labs, Klamath Falls, OR, USA. The other authors report no other conflicts of interest in this work.
References
Wells ML, Potin P, Craigie JS, et al. Algae as nutritional and functional food sources: revisiting our understanding. J Appl Phycol. 2017;29(2):949–982. | ||
de Jesus Raposo MF, de Morais RM, de Morais AM. Health applications of bioactive compounds from marine microalgae. Life Sci. 2013;93(15):479–486. | ||
Borowitzka MA. High-value products from microalgae--their development and commercialisation. J Appl Phycol. 2013;25(3):743–756. | ||
Krajčovič J, Vesteg M, Schwartzbach SD. Euglenoid flagellates: a multifaceted biotechnology platform. J Biotechnol. 2015;202:135–145. | ||
Buetow DE, Gilbert CW. Polypeptide composition of thylakoid membranes: two-dimensional gel analysis during development of Euglena chloroplasts. Prog Clin Biol Res. 1982;102 Pt B:139–148. | ||
Barsanti L, Passarelli V, Evangelista V, Frassanito AM, Gualtieri P. Chemistry, physico-chemistry and applications linked to biological activities of β-glucans. Nat Prod Rep. 2011;28(3):457–466. | ||
Noss I, Doekes G, Thorne PS, Heederik DJ, Wouters IM. Comparison of the potency of a variety of β-glucans to induce cytokine production in human whole blood. Innate Immun. 2013;19(1):10–19. | ||
Soltanian S, Stuyven E, Cox E, Sorgeloos P, Bossier P. Beta-glucans as immunostimulant in vertebrates and invertebrates. Crit Rev Microbiol. 2009;35(2):109–138. | ||
Kondo Y, Kato A, Hojo H, Nozoe S, Takeuchi M, Ochi K. Cytokine-related immunopotentiating activities of paramylon, a beta-(1-->3)-D-glucan from Euglena gracilis. J Pharmacobiodyn. 1992;15(11):617–621. | ||
Sugiyama A, Suzuki K, Mitra S, et al. Hepatoprotective effects of paramylon, a beta-1,3-D-glucan isolated from Euglena gracilis Z, on acute liver injury induced by carbon tetrachloride in rats. J Vet Med Sci. 2009;71(7):885–890. | ||
Sugiyama A, Hata S, Suzuki K, et al. Oral administration of paramylon, a beta-1,3-D-glucan isolated from Euglena gracilis Z inhibits development of atopic dermatitis-like skin lesions in NC/Nga mice. J Vet Med Sci. 2010;72(6):755–763. | ||
Watanabe T, Shimada R, Matsuyama A, et al. Antitumor activity of the β-glucan paramylon from Euglena against preneoplastic colonic aberrant crypt foci in mice. Food Funct. 2013;4(11):1685–1690. | ||
Kankkunen P, Teirilä L, Rintahaka J, Alenius H, Wolff H, Matikainen S. (1,3)-beta-glucans activate both dectin-1 and NLRP3 inflammasome in human macrophages. J Immunol. 2010;184(11):6335–6342. | ||
Sonck E, Stuyven E, Goddeeris B, Cox E. The effect of beta-glucans on porcine leukocytes. Vet Immunol Immunopathol. 2010;135(3–4):199–207. | ||
Russo R, Barsanti L, Evangelista V, et al. Euglena gracilis paramylon activates human lymphocytes by upregulating pro-inflammatory factors. Food Sci Nutr. 2017;5(2):205–214. | ||
Ogbonna JC. Microbiological production of tocopherols: current state and prospects. Appl Microbiol Biotechnol. 2009;84(2):217–225. | ||
Rodríguez-Zavala JS, Ortiz-Cruz MA, Mendoza-Hernández G, Moreno-Sánchez R. Increased synthesis of α-tocopherol, paramylon and tyrosine by Euglena gracilis under conditions of high biomass production. J Appl Microbiol. 2010;109(6):2160–2172. | ||
Gross JA, Stroz RJ, Britton G. The carotenoid hydrocarbons of Euglena gracilis and derived mutants. Plant Physiol. 1975;55(2):175–177. | ||
Tolivia A, Conforti V, Córdoba O, Flores L. Chemical constituents and biological activity of Euglena gracilis extracts. J Pharm Res. 2013;7(3):209–214. | ||
Simon RR, Vo TD, Levine R. Genotoxicity and subchronic toxicity evaluation of dried Euglena gracilis ATCC PTA-123017. Regul Toxicol Pharmacol. 2016;80:71–81. | ||
Shedletzky E, Unger C, Delmer DP. A microtiter-based fluorescence assay for (1,3)-beta-glucan synthases. Anal Biochem. 1997;249(1):88–93. | ||
Ko YT, Lin YL. 1,3-beta-glucan quantification by a fluorescence microassay and analysis of its distribution in foods. J Agric Food Chem. 2004;52(11):3313–3318. | ||
Benson KF, Beaman JL, Ou B, Okubena A, Okubena O, Jensen GS. West African Sorghum bicolor leaf sheaths have anti-inflammatory and immune-modulating properties in vitro. J Med Food. 2013;16(3):230–238. | ||
Singleton V, Orthofer R, Lamuela-Raventos R. Analysis of total phenols and other oxidation substrates and antioxidants by means of Folin–Ciocalteu reagent. Methods Enzymol. 1999;299:152–178. | ||
Jensen GS, Wu X, Patterson KM, et al. In vitro and in vivo antioxidant and anti-inflammatory capacities of an antioxidant-rich fruit and berry juice blend. Results of a pilot and randomized, double-blinded, placebo-controlled, crossover study. J Agric Food Chem. 2008;56(18):8326–8333. | ||
Honzel D, Carter SG, Redman KA, Schauss AG, Endres JR, Jensen GS. Comparison of chemical and cell-based antioxidant methods for evaluation of foods and natural products: generating multifaceted data by parallel testing using erythrocytes and polymorphonuclear cells. J Agric Food Chem. 2008;56(18):8319–8325. | ||
Schreibman DL, Hong CM, Keledjian K, et al. Mannitol and hypertonic saline reduce swelling and modulate inflammatory markers in a rat model of intracerebral hemorrhage. Neurocrit Care. 2018;29(2):253–263. | ||
Arend WP, Palmer G, Gabay C. IL-1, IL-18, and IL-33 families of cytokines. Immunol Rev. 2008;223(1):20–38. | ||
Motabi IH, DiPersio JF. Advances in stem cell mobilization. Blood Rev. 2012;26(6):267–278. | ||
Yin Y, Pastrana JL, Li X, et al. Inflammasomes: sensors of metabolic stresses for vascular inflammation. Front Biosci (Landmark Ed). 2013;18:638–649. | ||
Weinberg SE, Sena LA, Chandel NS. Mitochondria in the regulation of innate and adaptive immunity. Immunity. 2015;42(3):406–417. | ||
Nunes P, Demaurex N, Dinauer MC. Regulation of the NADPH oxidase and associated ion fluxes during phagocytosis. Traffic. 2013;14(11):1118–1131. | ||
Ziegler SF, Ramsdell F, Alderson MR. The activation antigen CD69. Stem Cells. 1994;12(5):456–465. | ||
Borrego F, Peña J, Solana R. Regulation of CD69 expression on human natural killer cells: differential involvement of protein kinase C and protein tyrosine kinases. Eur J Immunol. 1993;23(5):1039–1043. | ||
Moretta A, Poggi A, Pende D, et al. CD69-mediated pathway of lymphocyte activation: anti-CD69 monoclonal antibodies trigger the cytolytic activity of different lymphoid effector cells with the exception of cytolytic T lymphocytes expressing T cell receptor alpha/beta. J Exp Med. 1991;174(6):1393–1398. | ||
Bendelac A, Savage PB, Teyton L. The biology of NKT cells. Annu Rev Immunol. 2007;25(1):297–336. | ||
Della Chiesa M, Marcenaro E, Sivori S, Carlomagno S, Pesce S, Moretta A. Human NK cell response to pathogens. Semin Immunol. 2014;26(2):152–160. | ||
Storek KM, Monack DM. Bacterial recognition pathways that lead to inflammasome activation. Immunol Rev. 2015;265(1):112–129. | ||
Pang IK, Iwasaki A. Inflammasomes as mediators of immunity against influenza virus. Trends Immunol. 2011;32(1):34–41. | ||
Dinarello CA. Interleukin-1 in the pathogenesis and treatment of inflammatory diseases. Blood. 2011;117(14):3720–3732. | ||
Bendall LJ, Bradstock KF. G-CSF: from granulopoietic stimulant to bone marrow stem cell mobilizing agent. Cytokine Growth Factor Rev. 2014;25(4):355–367. | ||
Mittal M, Siddiqui MR, Tran K, Reddy SP, Malik AB. Reactive oxygen species in inflammation and tissue injury. Antioxid Redox Signal. 2014;20(7):1126–1167. |
Supplementary material
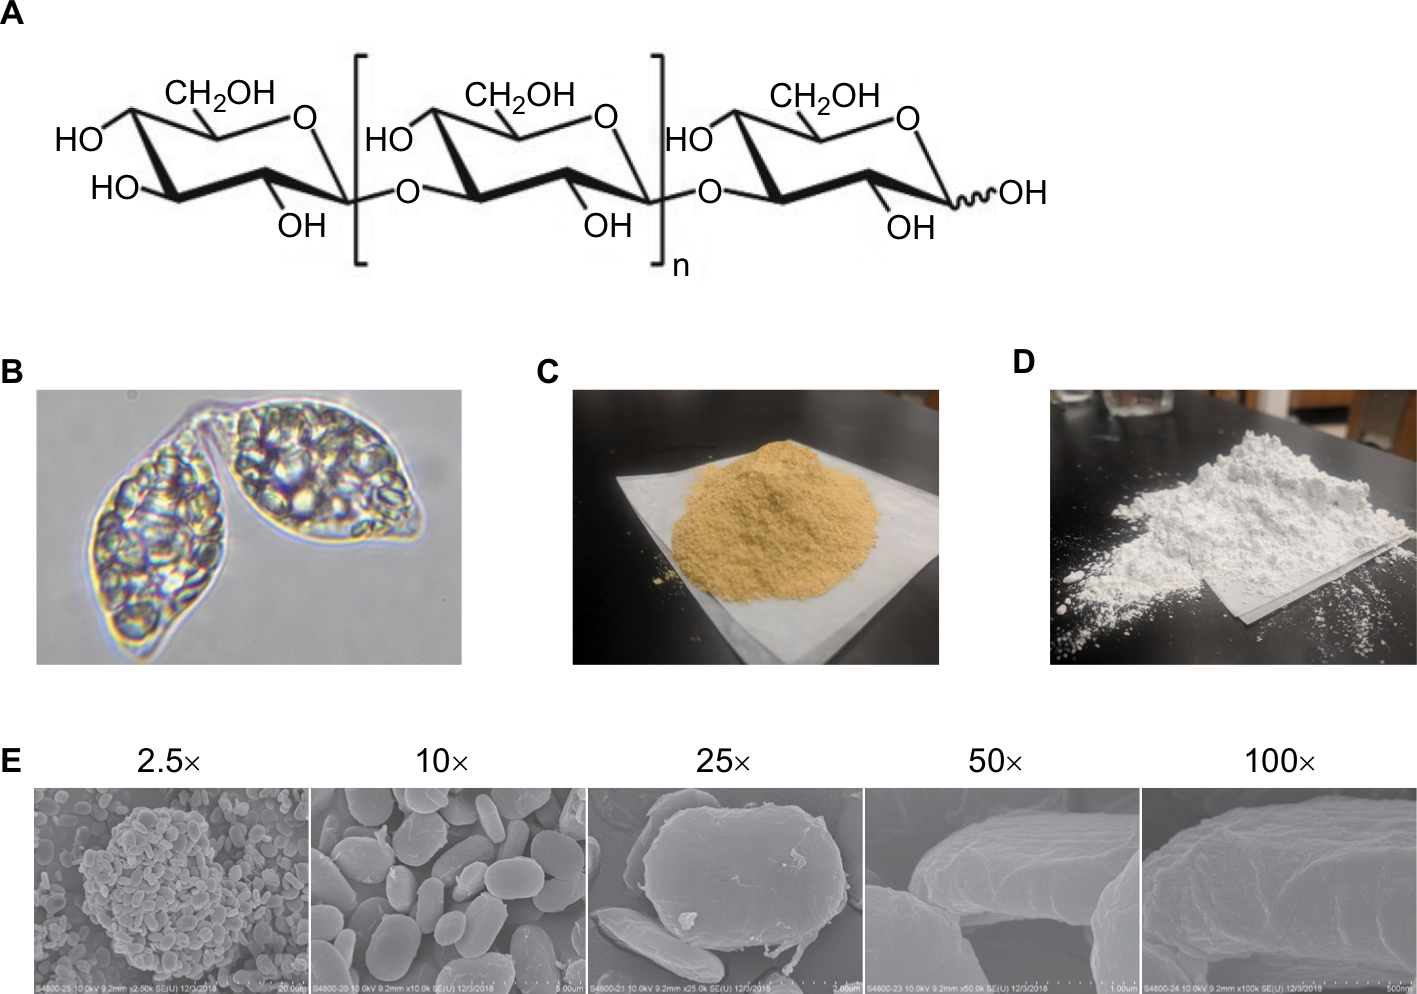 | Figure S1 Physical characteristics of E. gracilis and paramylon. Notes: (A) Chemical structure of 1,3-β-glucan. (B) Light microscopy image of live E. gracilis filled with paramylon granules. (C) Dried E. gracilis material for EG and E-AQ fractions. (D) Purified paramylon powder for PAR and PAR-S fractions. (E) Scanning electron microscopy images of paramylon material. 40× magnification. Abbreviations: E-AQ, aqueous fraction of EG; EG, Euglena gracilis whole algae; PAR, granular paramylon; PAR-S, alkaline-solubilized paramylon. |
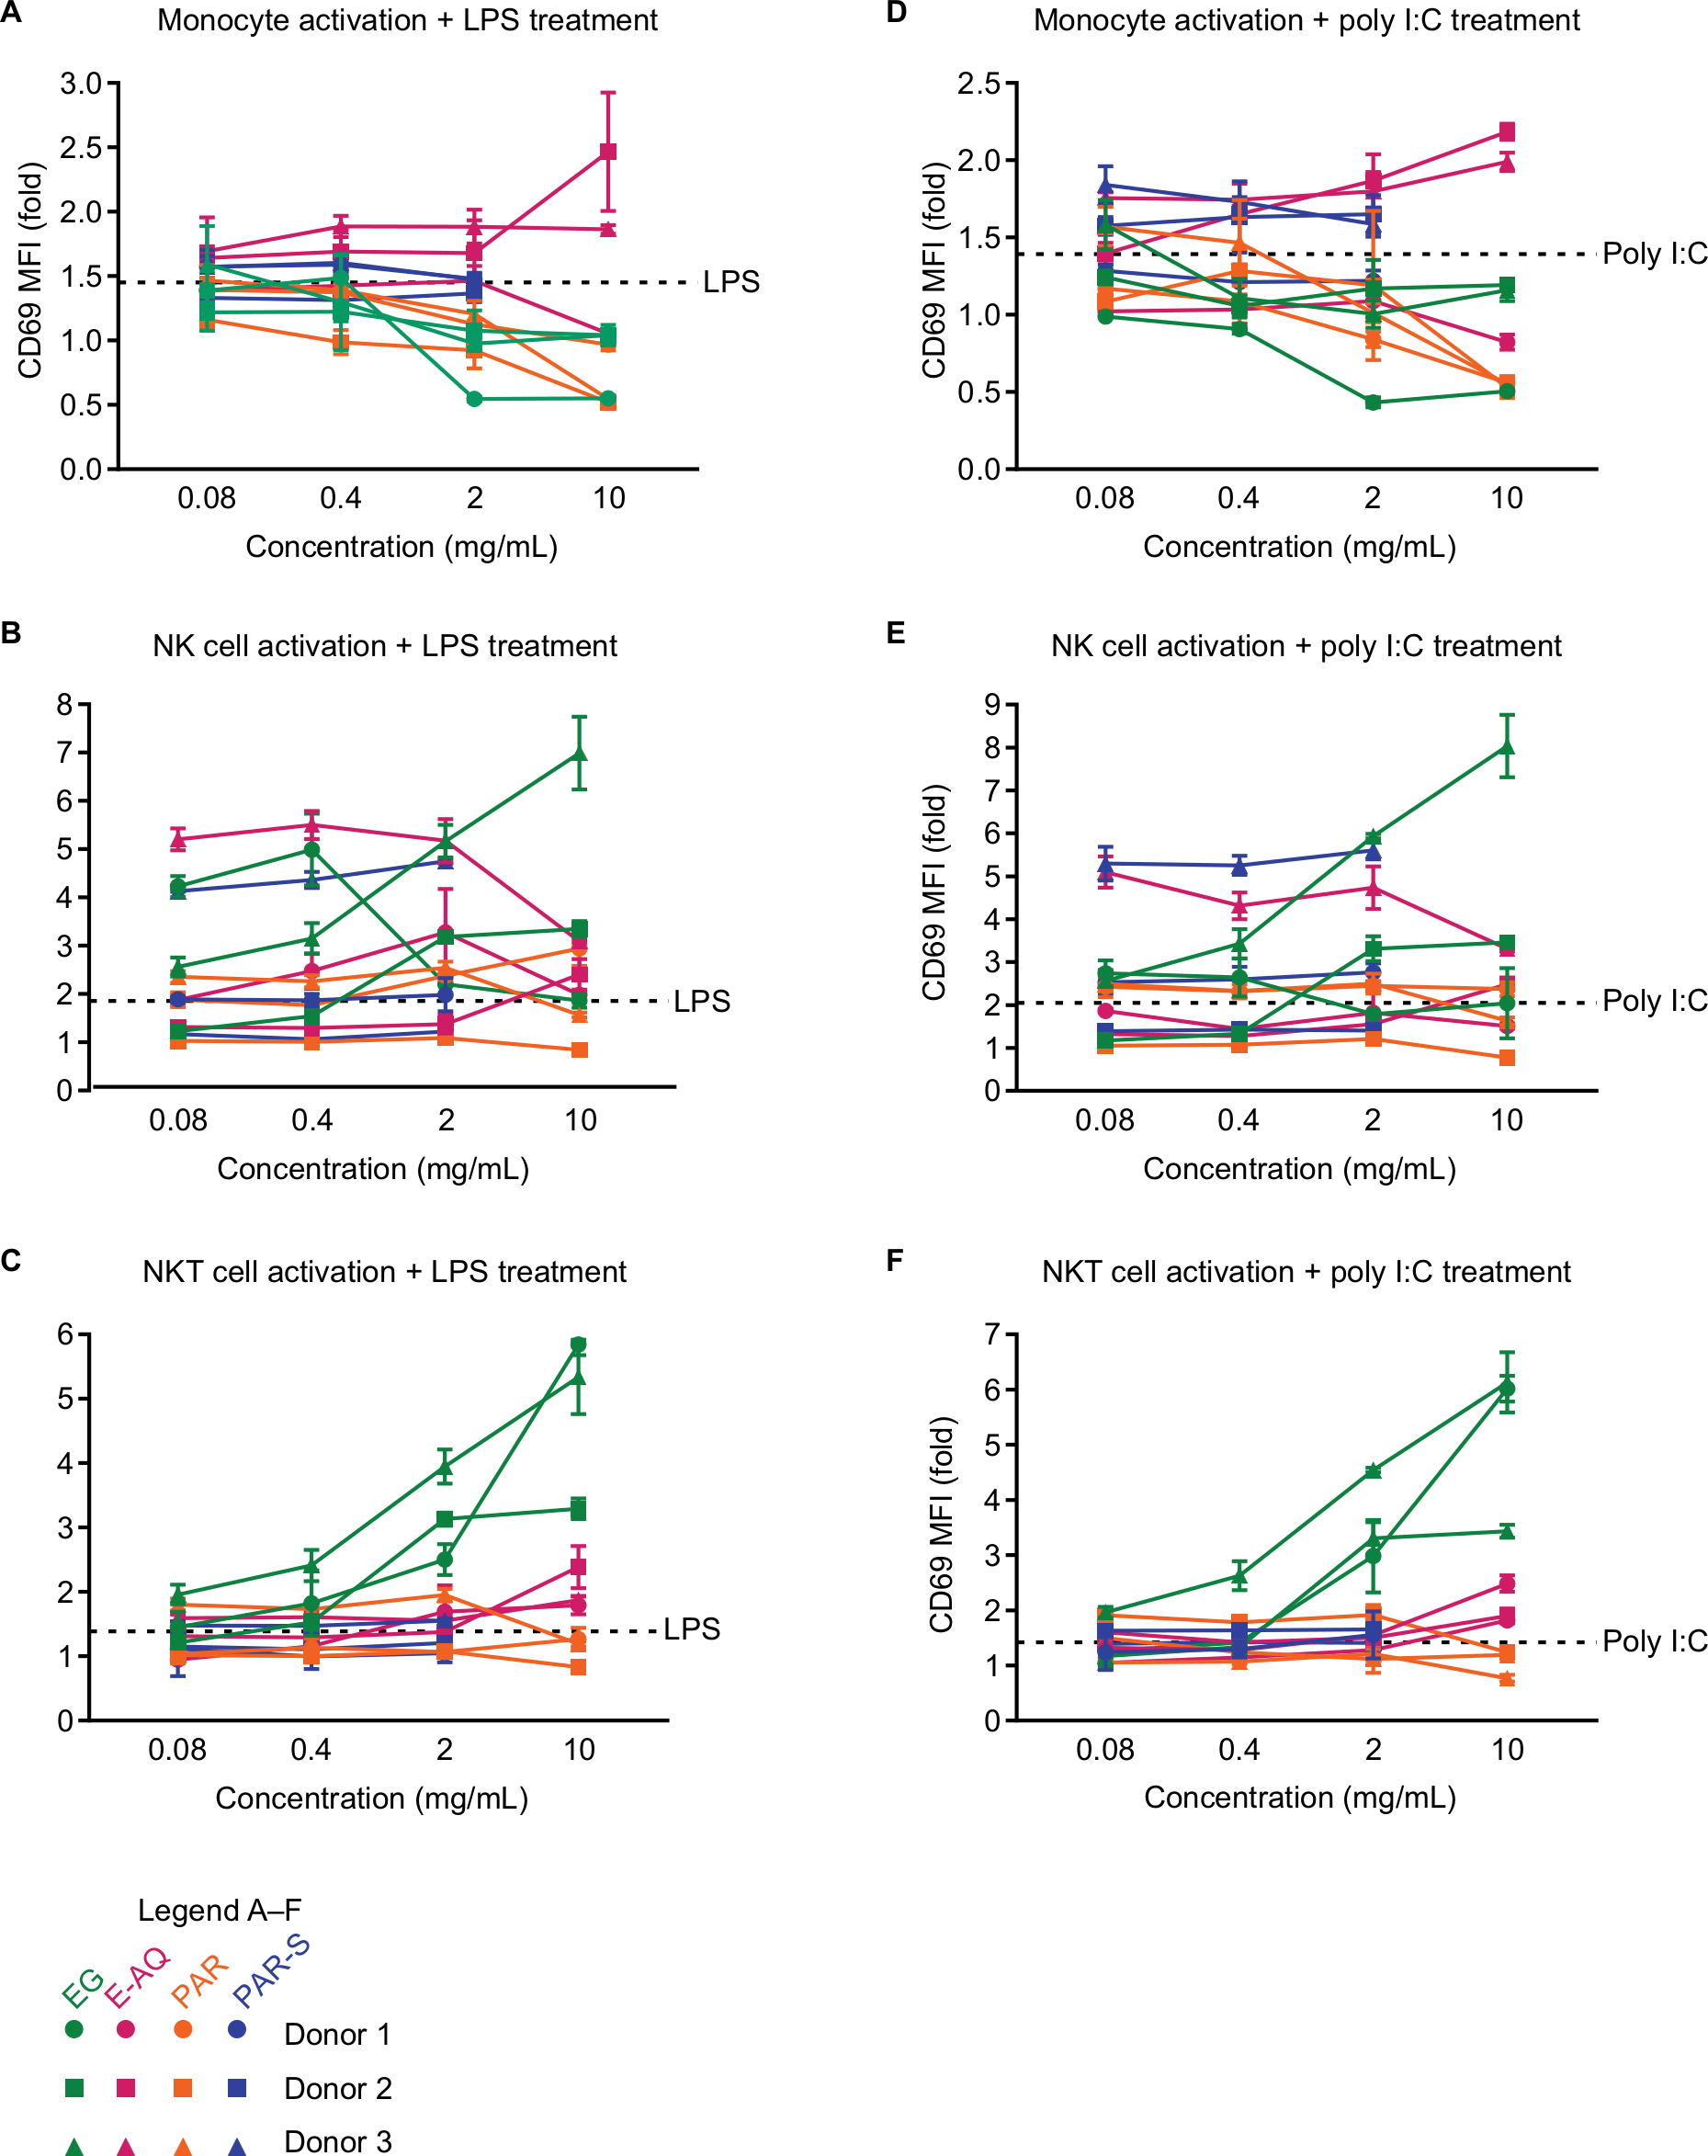 | Figure S2 CD69 expression on human PBMCs stimulated with pathogen-associated molecular patterns is modulated by EG, but not E-AQ, PAR, or PAR-S. Notes: Human PBMCs from three healthy donors were stimulated in vitro for 24 hours with LPS (10 ng/mL) (A–C) or poly I:C (2.5 µg/mL) (D–F), plus each of the four test products (EG, E-AQ, PAR, and PAR-S), stained and analyzed by flow cytometry for expression of CD69, which is represented as a fold increase in MFI over the LPS control (=1) (A) monocytes, (B) NK cells, and (C) NKT cells were stimulated with LPS. (D) Monocytes, (E) NK cells, and (F) NKT cells were stimulated with poly I:C. All samples were analyzed in triplicate. Symbols represent mean ± SD. Abbreviations: E-AQ, aqueous fraction of EG; EG, Euglena gracilis whole algae; LPS, lipopolysaccharide; MFI, mean fluorescence intensity; PAR, granular paramylon; PAR-S, alkaline-solubilized paramylon; PBMCs, peripheral blood mononuclear cells; poly I:C, polyinosinic–polycytidylic acid. |
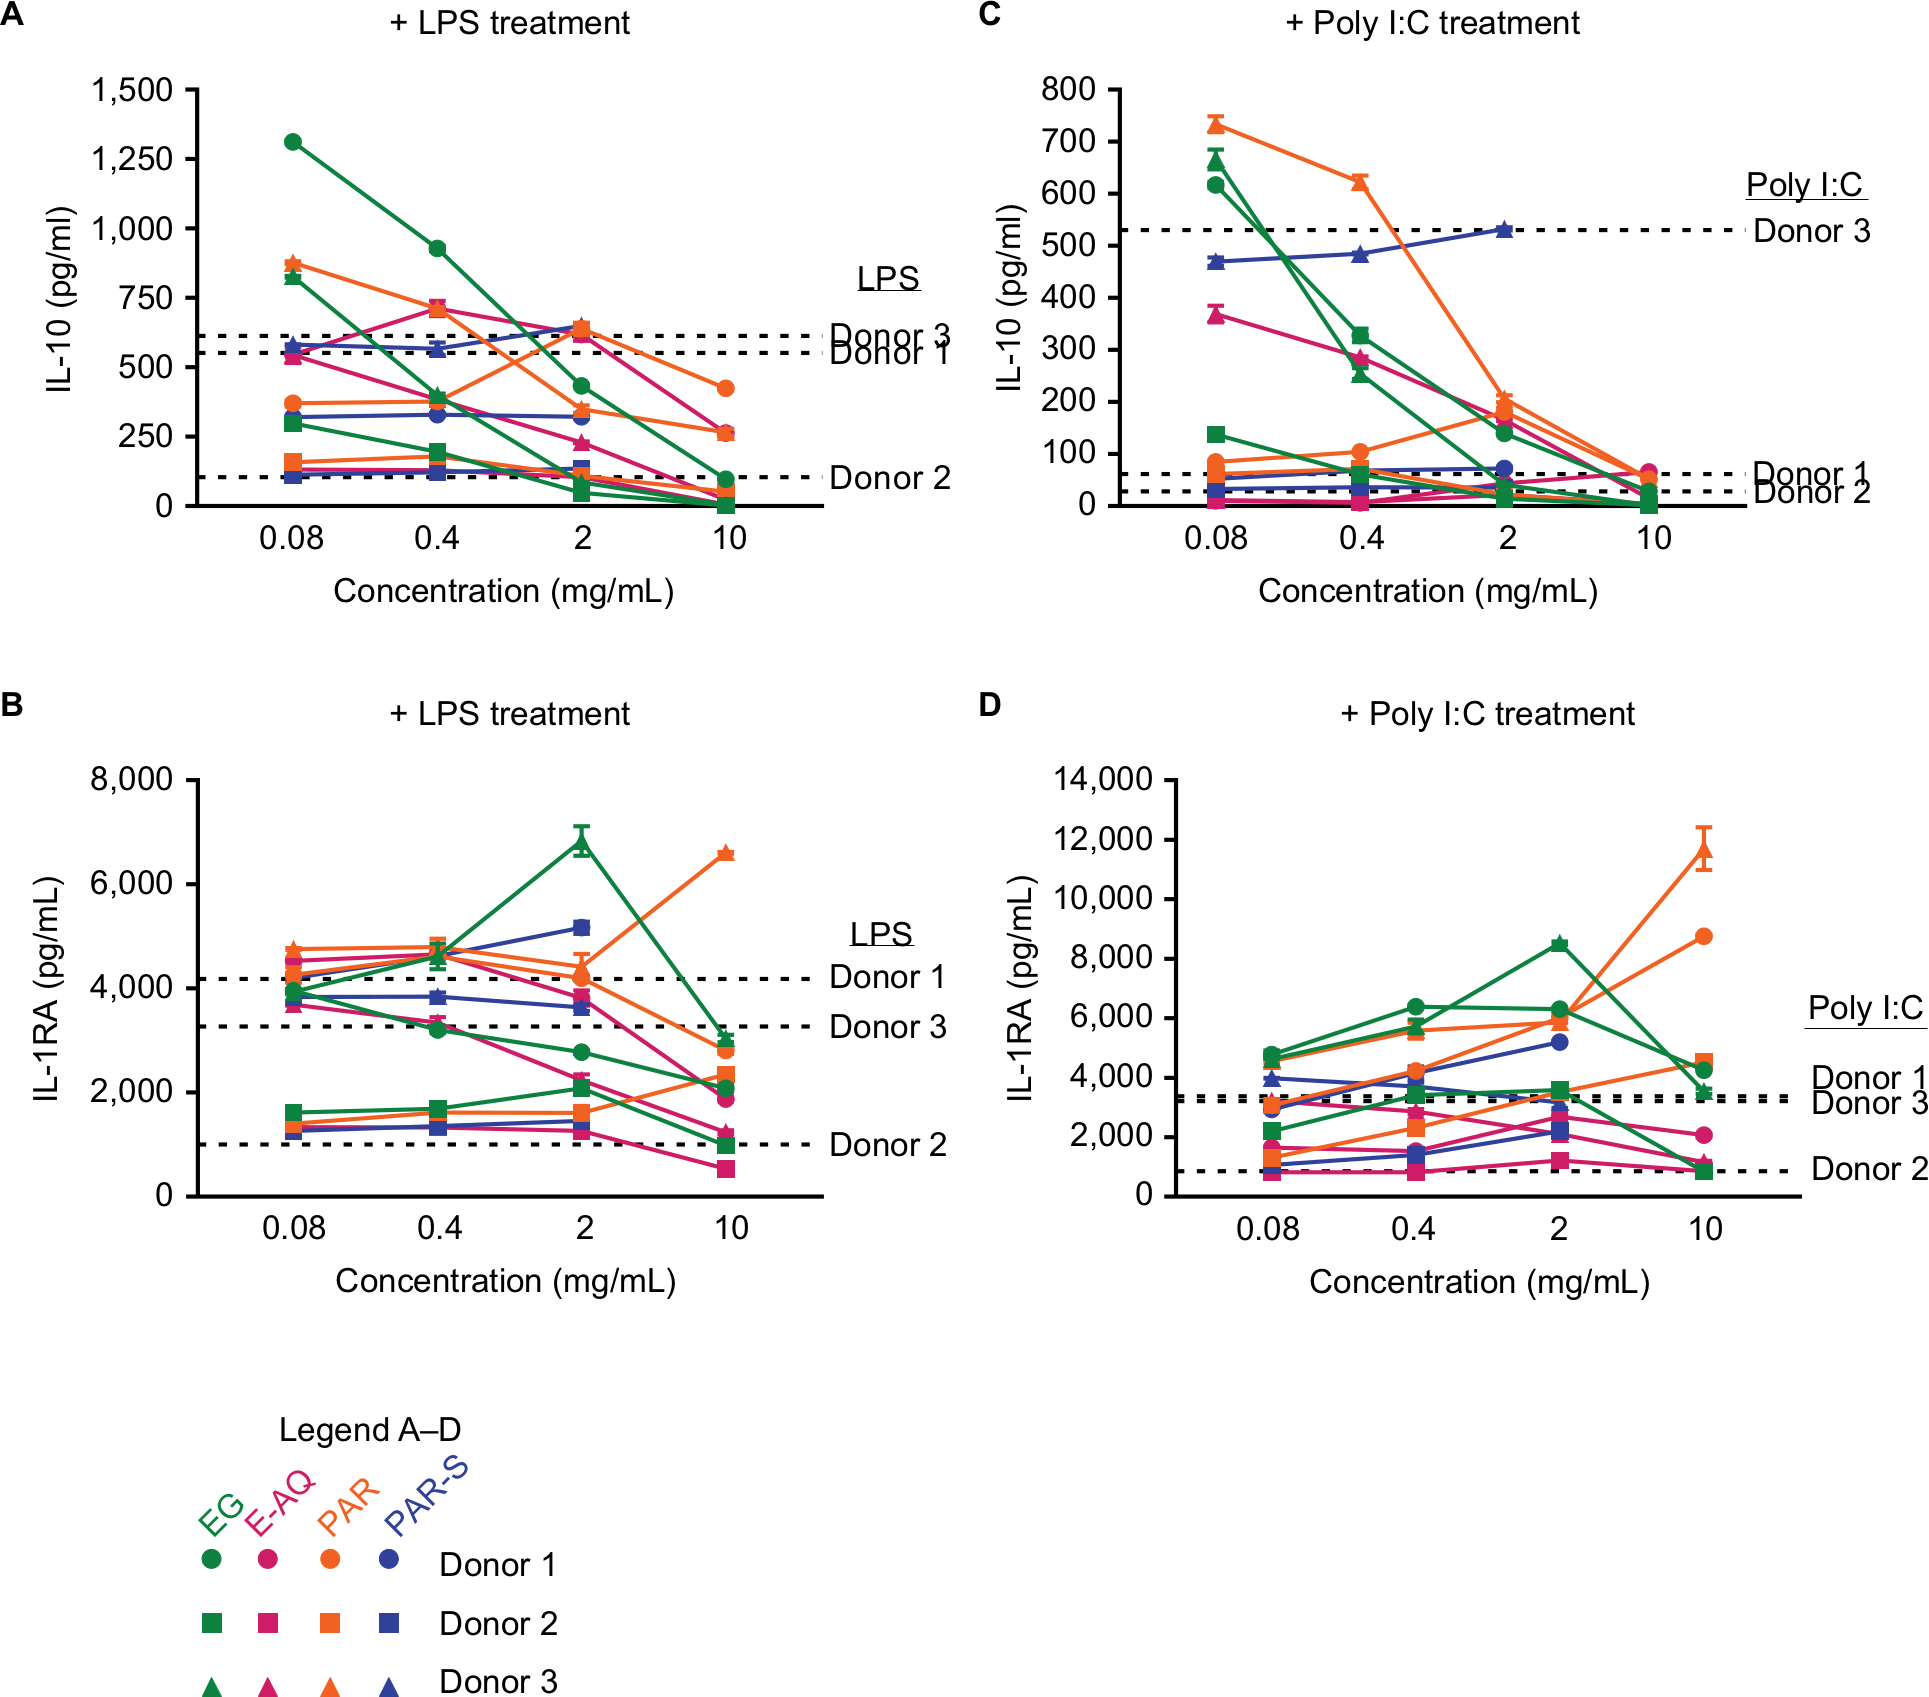 | Figure S3 Anti-inflammatory cytokine production by human PBMCs stimulated with pathogen-associated molecular patterns may be regulated by EG and PAR. Notes: Human PBMCs from three healthy donors were stimulated in vitro for 24 hours with LPS (10 ng/mL) (A, B) or poly I:C (2.5 µg/mL) (C, D), plus each of the four test products (EG, E-AQ, PAR, and PAR-S). Cell culture supernatants were analyzed by Luminex multiplex for (A, C) IL-10 and (B, D) IL-1RA. All samples were analyzed in triplicate. Symbols represent mean ± SD. Abbreviations: E-AQ, aqueous fraction of EG; EG, Euglena gracilis whole algae; IL-1RA, IL-1 receptor antagonist; LPS, lipopolysaccharide; PAR, granular paramylon; PAR-S, alkaline-solubilized paramylon; PBMCs, peripheral blood mononuclear cells; poly I:C, polyinosinic–polycytidylic acid. |
 © 2019 The Author(s). This work is published and licensed by Dove Medical Press Limited. The
full terms of this license are available at https://www.dovepress.com/terms
and incorporate the Creative Commons Attribution
- Non Commercial (unported, 3.0) License.
By accessing the work you hereby accept the Terms. Non-commercial uses of the work are permitted
without any further permission from Dove Medical Press Limited, provided the work is properly
attributed. For permission for commercial use of this work, please see paragraphs 4.2 and 5 of our Terms.
© 2019 The Author(s). This work is published and licensed by Dove Medical Press Limited. The
full terms of this license are available at https://www.dovepress.com/terms
and incorporate the Creative Commons Attribution
- Non Commercial (unported, 3.0) License.
By accessing the work you hereby accept the Terms. Non-commercial uses of the work are permitted
without any further permission from Dove Medical Press Limited, provided the work is properly
attributed. For permission for commercial use of this work, please see paragraphs 4.2 and 5 of our Terms.