Back to Journals » Clinical Epidemiology » Volume 11
Modeling determinants of satisfaction with health care in youth with inflammatory bowel disease part 2: semiparametric distributional regression
Authors Otto-Sobotka F, Peplies J ![]() , Timmer A
, Timmer A ![]()
Received 19 October 2018
Accepted for publication 2 March 2019
Published 16 May 2019 Volume 2019:11 Pages 403—417
DOI https://doi.org/10.2147/CLEP.S191458
Checked for plagiarism Yes
Review by Single anonymous peer review
Peer reviewer comments 2
Editor who approved publication: Professor Vera Ehrenstein
Fabian Otto-Sobotka,1 Jenny Peplies,2 Antje Timmer1
1Division of Epidemiology and Biometry, Medical Faculty, Carl von Ossietzky University, Oldenburg, Germany; 2Department of Epidemiological Methods and Etiological Research, Leibniz Institute for Prevention Research and Epidemiology - BIPS GmbH, Bremen, Germany
Background: Methodological challenges arise with the analysis of patient satisfaction as a measure of health care quality. One of them is the necessity to adjust for differences in patient characteristics or other variables. A combination of several helpful extensions to regression analysis is shown based on patients with inflammatory bowel disease (IBD) to help identify important covariates associated with the distribution of satisfaction.
Patients and methods: Analyses were based on cross-sectional data from a postal survey on the health care of patients with IBD aged 15–25, with satisfaction assessed using a 32-item validated questionnaire weighing experience by perceived relevance. The weighted summary score was modeled using a Beta distribution in a generalized additive model for location, scale and shape. Covariates were distinguished in 3 groups and the model was entered in separate, consecutive analyses. First, demographic and disease-related variables were included. Next, information about the IBD specialist was added. The third step added care quality indicators. Results are presented as OR with 95% CI.
Results: In the survey, 619 questionnaires were returned and the data set had 453 complete cases for analysis. Satisfaction appeared increased for patients working (OR 1.59, 95% CI: 1.19–2.11) or studying (1.25, 1.00–1.56) as compared to those still at school or in non-academic job training. High anxiety scores and an older age of onset were associated with lower satisfaction. The variation of satisfaction is higher for patients with Crohn’s disease or who have statutory insurance (1.19, 1.01–1.40 and 1.22, 1.06–1.40).
Conclusion: Modeling the entire distribution of the response uncovered additional influences on the variance of patient satisfaction not previously identified by classical regression. It also resulted in a richer model for the mean. The construction of a combined model for different features of the distribution also helped to improve the control of confounding.
Keywords: patient-reported outcomes, generalized additive models for location, scale and shape, two-stage regression, P-splines, model selection
Introduction
Patient satisfaction has been used as a measure of health care quality for many years despite a number of unresolved methodological issues.1,2 Concepts vary and definitions may be tailored to the respective object of evaluation or research. Commonly, satisfaction mirrors patient perception of care, based on expectations and experience.3 Adjustment of satisfaction scores may be necessary to facilitate comparative evaluation between providers or to identify relevant determinants of satisfaction.4–7
From the statistical viewpoint, the typically skewed distribution of satisfaction scores represents a particular challenge when modeling satisfaction with care. Most patients report high satisfaction, even where quality of care is known to be deficient.8–10 There are several ways to deal with this phenomenon. Where the focus is on improving quality of care, most information may be drawn from the usually small proportion of patients with low satisfaction.11 This would justify approaches where scores are dichotomized, as we did in a previous analysis of the same data.12 However, important information may be lost by transforming a multidimensional weighted score to a simple binary variable based on some arbitrary threshold. For example, low and high satisfaction may be considered different concepts, and it is likely that different factors impact at different levels of a continuous score.9,10 Mean scores insufficiently reflect both further improvement of already high scores – this may be important to improve customer retention – as well as changes in the small proportion of patients with low satisfaction who are important to identify care gaps.
In consequence, classical mean regression models should not be expected to deliver sufficiently helpful results regarding covariates associated with self-reported patient satisfaction. Current developments in regression modeling are more suitable to cover the whole distribution of the satisfaction variable rather than just the mean as they facilitate the identification of covariates taking effect in the extreme values of satisfaction. The need for regression models beyond the mean first arose for growth curves and led to the Lambda-Mu-Sigma (LMS) method.13 The LMS method comprises regression models for the mean parameter and for a variance and skewness parameter as well. This idea was further developed into the more flexible generalized additive models for location, scale and shape (GAMLSS).14
Similar to modern mean regression models, GAMLSS offers a strong flexibility for the construction of its different predictors. The models can comprise nonlinear, spatial, random or varying coefficients’ effects. This variety contains all tools necessary to assess the complete conditional distribution of the patients’ satisfaction and to identify all influential covariates for different parts of the distribution.
We use data from a study into the quality of care of young patients with inflammatory bowel disease (IBD) to illustrate the potential of this approach.15 These diseases may be viewed as exemplary chronic conditions impacting on many aspects of health. They pose particular challenges to health care in particular in the transitional age of changing from pediatric to adult specialty care. In a previous publication, we have used standard regression modeling, specifically, multivariate logistic regression, to examine determinants of patient satisfaction.12 It was appreciated that this may constitute an overly simplistic approach.
In the current analysis, we modeled and estimated GAMLSS to examine differential effects on different levels/features of patient satisfaction. In analogy to our previous work, the underlying clinical questions relate to the identification of patient factors relevant for satisfaction with care (primary research question) and the effect of the type of provider when adjusted for relevant patient characteristics (secondary research aim).12
In an exploratory third step, additional indicators of quality of care were introduced. We aimed to uncover possible nonlinear or spatial effects and also added an ex ante analysis to control for confounding. We show that semiparametric distributional regression methods offer more thorough analyses for the mean and especially beyond mean regression.
Patients and methods
Data source, survey
A cross-sectional postal survey was performed in youth with pediatric onset IBD aged 15–25 from the CEDATA-GPGE registry.16 This registry contains patients who were diagnosed with either Crohn’s disease (CD), ulcerative colitis (UC) or unclassified colitis before the age of 18 by a participating physician. The survey was conducted in 2011 with a response rate of 48.2% (619 of 1,387 questionnaires returned). The satisfaction score could be computed for 576 participants and the entire data set had 453 complete cases for the purposes of this paper. The baseline characteristics and clinical information of the patients have been published, as well as the descriptive analysis of the quality of care.15,17 We also refer to the first part of our work on modeling determinants of disease satisfaction which focused on covariate selection.12
Response: patient satisfaction
Patient satisfaction with care was in this survey conceptualized as the degree to which aspects of care considered important by the individual person are met by experience. It was measured by a validated summation score.18 The score is constructed from 32 items which are rated twice on a 4-point Likert scale, first for importance and second for perceived degree of fulfillment. The summary score is then constructed as the degree of fulfillment of the IBD health care weighted by the individually rated importance and rescaled to the standard unit interval. Items had been selected based on a qualitative patient survey complemented by a review of the literature and expert interviews. They cover relevant aspects, in particular provider-patient communication, accessibility, organization, competence, respect of patient autonomy and continuity of care. Face and construct validity as well as patient acceptance of the instrument were shown to be good.18 Use of subscales by domain is not recommended. An ad-hoc English translation and an algorithm to derive the summation score are available online.18
Covariates
The selection of covariates followed the three-step approach introduced in our previous paper of low patient satisfaction.12 The approach can be shortly described as follows: available variables were categorized into 3 groups: patient characteristics, including sociodemographic and disease-related information (step 1), non modifiable health care provider characteristics (step 2) and additional patient reported information indicating quality of care not included in the satisfaction instrument (step 3). Other than in our previous analysis, whereever possible, clinically plausible metric covariates were chosen to allow for the detection of nonlinear effects on the response.
Patient-related characteristics
The patient-related variables included sex, current age (in years), socioeconomic status (SES) of the parents (in units), the region of residence within Germany based on modified Nielsen market regions, the smoking status in 3 categories (current, former, never), the current occupation of the patient in 5 categories (school, studies at university, apprenticeship/non-academic job training, work, other), the type of health insurance (private, mixed, statutory), the level of education (patient) in 3 categories (basic, intermediate, advanced). Level of education was based on the type of school attended. The parental SES was calculated based on the level of education, current occupation and household income.19,20
Health-related variables included were the type of disease in 3 categories (CD, UC, not specified/other), the age of onset (in years), the disease duration (in years), the course of the disease in 3 categories (no relapse, 1 relapse, more than 1 relapses/chronic activity), the current disease activity in 3 categories (remission, mild activity, moderate to severe activity) based on patient-reported symptoms as measured by the survey-based Crohns Disease and Colitis Activity Indices (SCDAI, SCAI) and the depression and anxiety subscales of the Hospital Anxiety and Depression Scale (HADS, in units).21–23 Disease-specific quality of life had been assessed by the Short Inflammatory Bowel Disease Questionnaire (SIBDQ).24
Provider characteristics
We defined the health care provider as the physician currently in charge of IBD-related decisions and treatment. Three categories were distinguished (pediatric gastroenterologist (PG), adult care gastroenterologist (GE) and other or non-specialist (other)). As the type of specialist (pediatric vs adult) strongly depended on age, we included the possibility for interactions between the type of provider and either the age of the patient, the age of onset and/or the duration of the disease (all in years). Also, we employed a two-stage regression to control for confounding between the type of IBD specialist and the various measures of age as introduced in the previous Section.
Indicators of quality of care
In an exploratory analysis, we included additional indicators of quality of health care as available from the patient-reported survey data. These included the usual time spent in the waiting room and the usual consultation time with the physician to our selection of covariates. Both variables were constructed with 3 categories (less than 15 mins, 15–30 mins, more than 30 mins).
We also allowed for an ad hoc IBD management quality index (IMQI) to be selected into the model. The IMQI combines several indicators of appropriate treatment which are specific to selected situations, such as ophthalmological controls when under treatment with corticosteroids or being seen by a nutritionist when the body mass index is non-normal.12 It measures the degree to which individually applicable items are fulfilled.
Data security, ethical considerations
Pseudonymized data were used for data analysis. All personal data remained with the registry-trust center, with no access for study personnel. The project was submitted to the ethics committee of the University of Bremen prior to the postal survey (date of approval June 1, 2011). Written informed consent was secured after detailed written information by all participants, and their guardians if aged below 18 years.
Data analysis
In previous analyses, the mean satisfaction had no large variation across all groups. Hence, we employed a more versatile form of regression model that was able to capture effects of covariates beyond the mean.25 While quantile regression and expectile regression do not require any restrictions on the distribution of the response variable, there is also no possibility to impose the restrictions of the response on the regression estimates.26,27 Hence, we chose to construct a generalized additive model for location, scale and shape.14 In a GAMLSS, a parametric distribution for the response variable is used furthermore. However, in contrast to a classical regression model, all parameters of the distribution depend on their combination of covariates. This allowed us to capture effects beyond the mean while keeping a distribution family that was appropriate for the limited range of the satisfaction score. Further, we gained the flexibility to model each parameter of the distribution with a semiparametric predictor, including categorical, nonlinear metric or spatial effects.
The analysis was performed with three consecutive GAMLSS. The first model concentrated on patient-related factors. In the second step, information about the health care provider/physician was added. And finally, in an exploratory step 3, information about the quality of the health care was also included.
For the parametric effects, fully adjusted odds ratios and 95% confidence intervals (CI) are reported. For the covariates modeled with aP -spline basis, the estimated partial effect was visualized with pointwise standard errors and the partial residuals added to the plot. The spatial effect was drawn on a heatmap of the regions.
GAMLSS
As usual in a generalized regression model, a parametric distribution from an exponential family was chosen. The values of the satisfaction score were bounded to the standard unit Y∈ [0; 1]. Therefore, the Beta distribution was applied which offered a lot of flexibility for this restricted range. It was a rather parsimonious distribution with only two parameters, µ for the expectation and σ for the standard deviation.

A classical regression model would have been limited to modeling the expectation parameter µ with additional assumptions for the parameter σ. This design limited the amount and kind of information we could obtain from our model severely. In the GAMLSS, in contrast, a predictor η for each of the two parameters was constructed. Each predictor comprised an intercept, a linear part for simple metric or dummy-coded variables, and unknown functional effects as introduced below.


For the Beta regression, the link function g was a logit for both equations. The regression coefficients were then estimated via the Cole and Green backfitting algorithm.13 With starting values given for the predictor of σ, the conditional penalized likelihood was maximized for the predictor for µ. The algorithm then alternated between the estimation of each predictor while keeping the previous parameters of the other predictor fixed. This was repeated until convergence. The procedure of maximizing likelihoods allowed for the use of the usual frequentist confidence intervals.
Model selection
To keep the complexity of a GAMLSS manageable, a variable selection strategy was employed that included two decisions for each covariate: 1) whether to include it in the predictor and 2) the necessary complexity to capture the effect on the response’s parameters was selected as well. The criterion used for all parts of the model selection was the generalized Akaike’s Information Criterion (AIC) as provided in the R-package gamlss.28 The model selection for steps 2 and 3 began at the model selected for the previous step.
The initial estimation used the saturated model including all possible and sensible covariates in both predictors. For each model, a sequential stepwise selection procedure was performed. In each step, a variable was removed from or added to the model based on the strongest decrease in the AIC. The algorithm continued until no smaller AIC could be obtained in one step.
We started by selecting the predictor for µ using the saturated model for σ. The selection process then alternated between both predictors until convergence. Pairwise interaction terms were checked manually for selection into the model afterwards. Additionally, a more flexible, nonlinear modeling of metric and spatial covariates was available for selection during the process.
P-splines in most cases, the shape of an estimated effect of a metric covariate cannot be determined in advance. Previously, evidence of a nonlinear effect of patient age on satisfaction with care was already found.29 Hence, we started by constructing a B-spline basis for each metric covariate. A basis consisting of 20 or more polynomial spline elements, each with its own regression coefficient, offered enough flexibility to model all relevant kinds of covariate effects. A penalty term consisting of second-order differences is added to achieve the appropriate amount of smoothness to the estimated effect and to avoid overparameterization.30 The strength of this penalty was determined by an arbitrary smoothing parameter λ ≥0. For λ → ∞ the effect of the covariate was reduced again to its basic linear form while rather small values of λ allowed for very flexible models.
For each observation, the information about its region of residence within Germany was available which could be represented by a covariate with 6 categories, based on Nielsen market regions. This would have, however, ignored the neighborhood structure between these regions entirely. We assumed a stronger similarity between neighboring regions by constructing a Gaussian Markov random field for the spatial information contained in the region variable. The covariate is represented by an indicator matrix denoting which observation was found in which region. The penalty is constructed from the neighborhood matrix. The smoothing parameter regulated the overall strength of the neighborhood similarities. The special case λ =0 would have led to the same treatment as a categorical covariate.
Two-stage regression
Due to several possible variables that contained information about the age and the additional dependence on the type of provider, there were multiple sources of confounding. We aimed to control a part of these dependencies by using a two-stage regression. In the first stage, the dependencies among the covariates of the main analyses were modeled. The residuals of the first stage were included as an additional covariate into the final regression model. For the first-stage model, the age of onset in years was set as response variable since it was both associated with all variables containing age information as well as the type of provider. Following earlier work in two-stage distributional regression, the first stage was analyzed with a semiparametric mean regression and only took the mean residuals ε to the second stage.31 The additional covariate was only included in the location part of the GAMLSS. The first-stage model used throughout was defined as
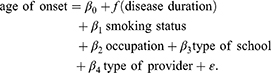
Additionally, several two-way interaction terms were explored in the second-stage regression to consider the dependencies between covariates where necessary. The necessity of the inclusion of the first-stage residuals and the interaction terms was again evaluated using the generalized AIC. An overview of all analyses performed for this paper is shown in Figure 1.
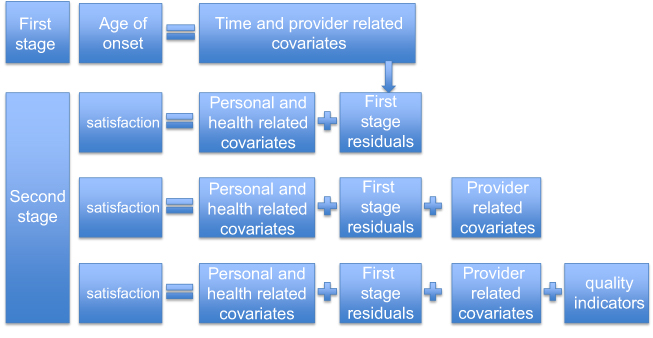 | Figure 1 Structure and sequence of the analyses performed for this paper illustrating the connection between first and second stage as well as the differences between the three second-stage analyses. |
Results
The first-stage regression had an adjusted R2 of 0.84. The residuals of this first stage were also never removed as a covariate from any of the second-stage models in the automatic model selection process. Therefore, we concluded that our two-stage analysis was appropriate for the dependence structure.
Step 1: patient-related factors
The variables and interaction terms that were included in the model at the end of the selection are shown in Table 1 and in Figures 2 and 3. The variable type of IBD was selected into the model only in dichotomized form. During model selection, the categories for UC and unclassified colitis were collapsed.
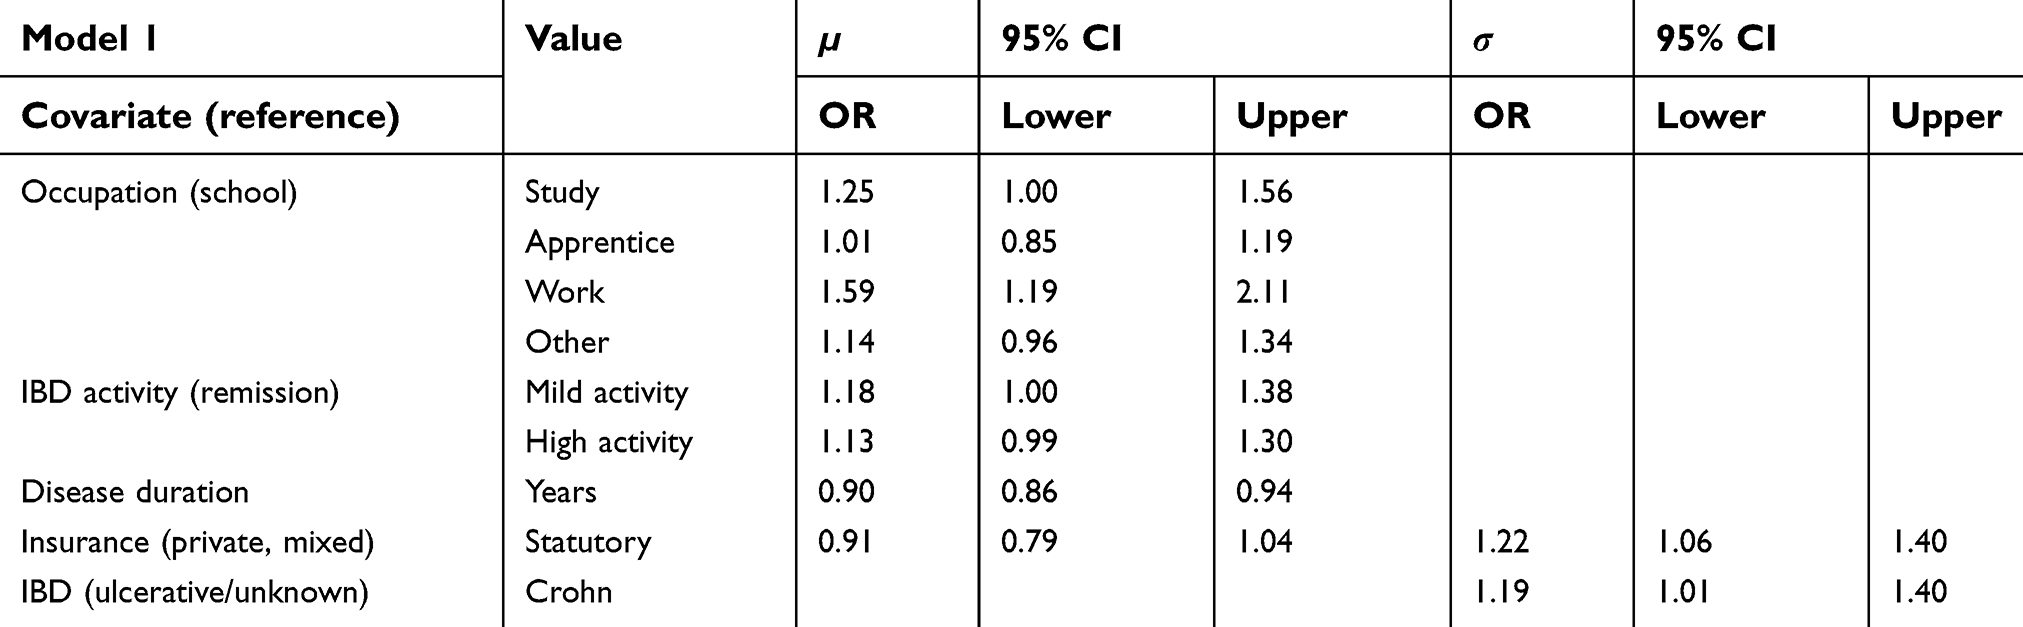 | Table 1 Adjusted odds ratios and 95% confidence intervals of parametric effects for both predictors in the step 1 model |
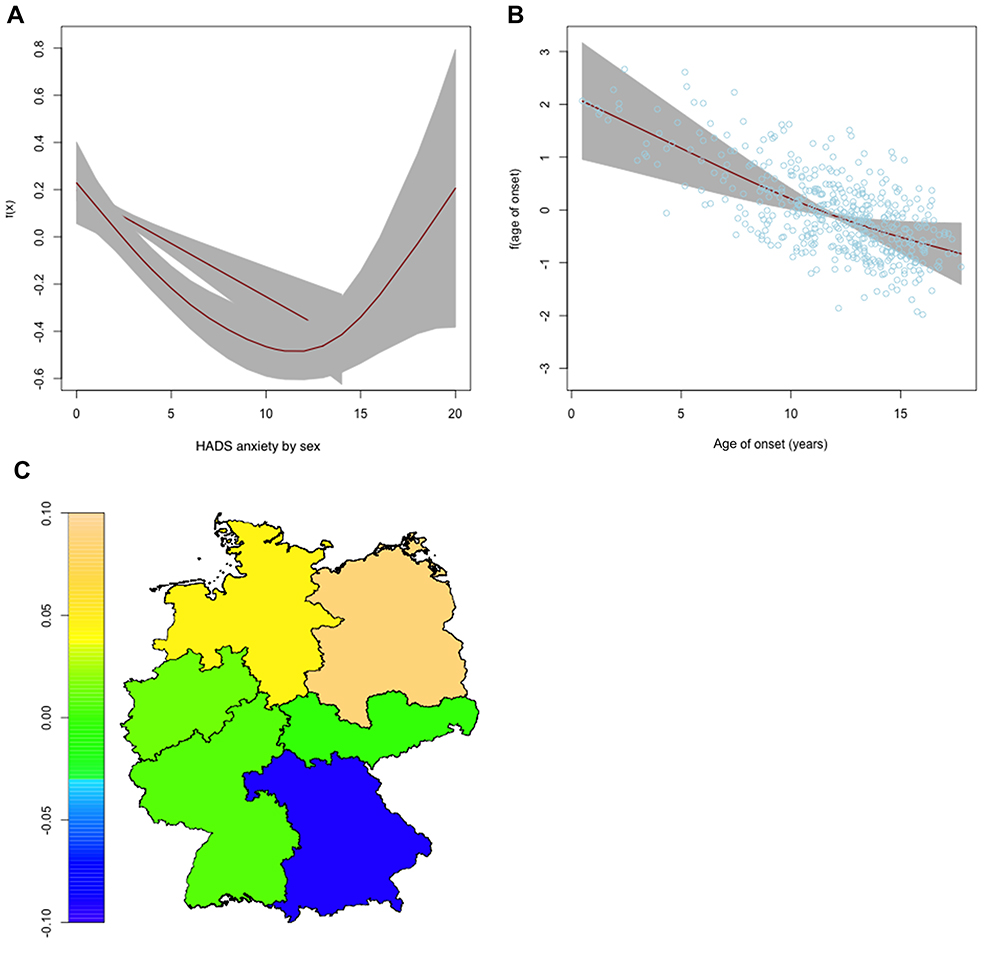
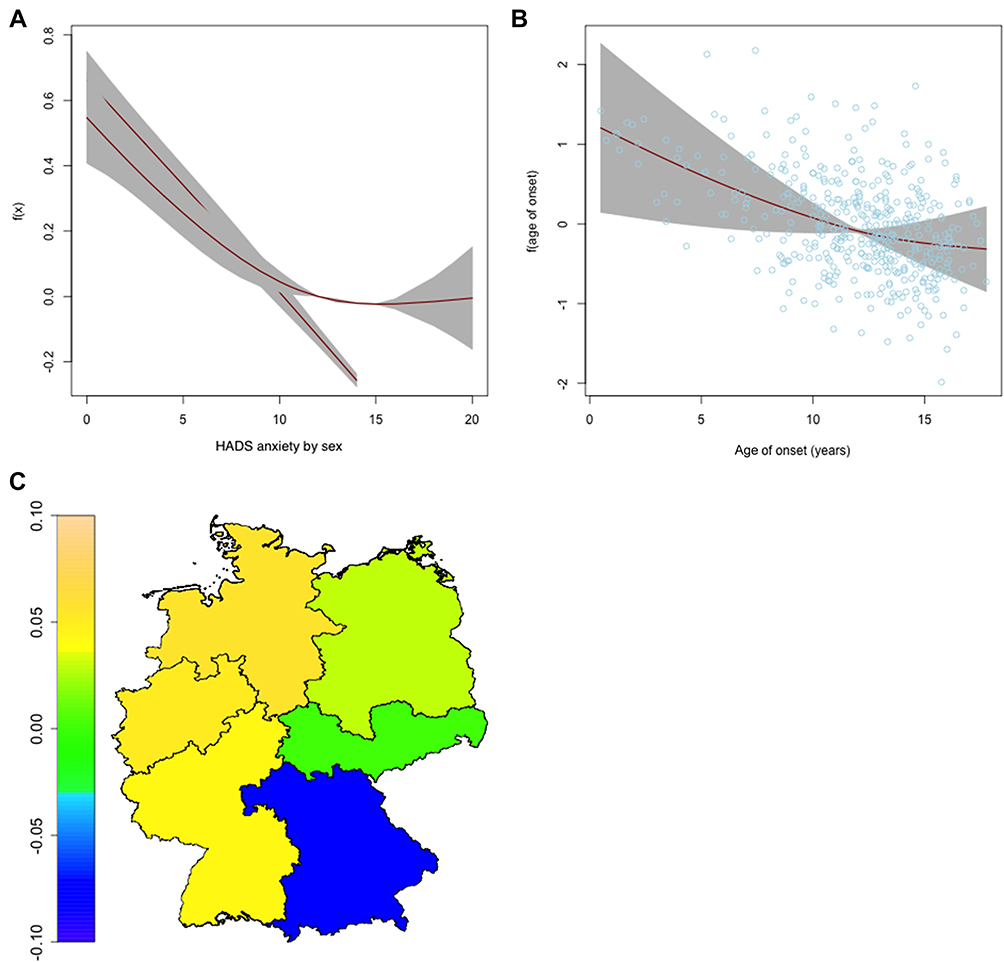
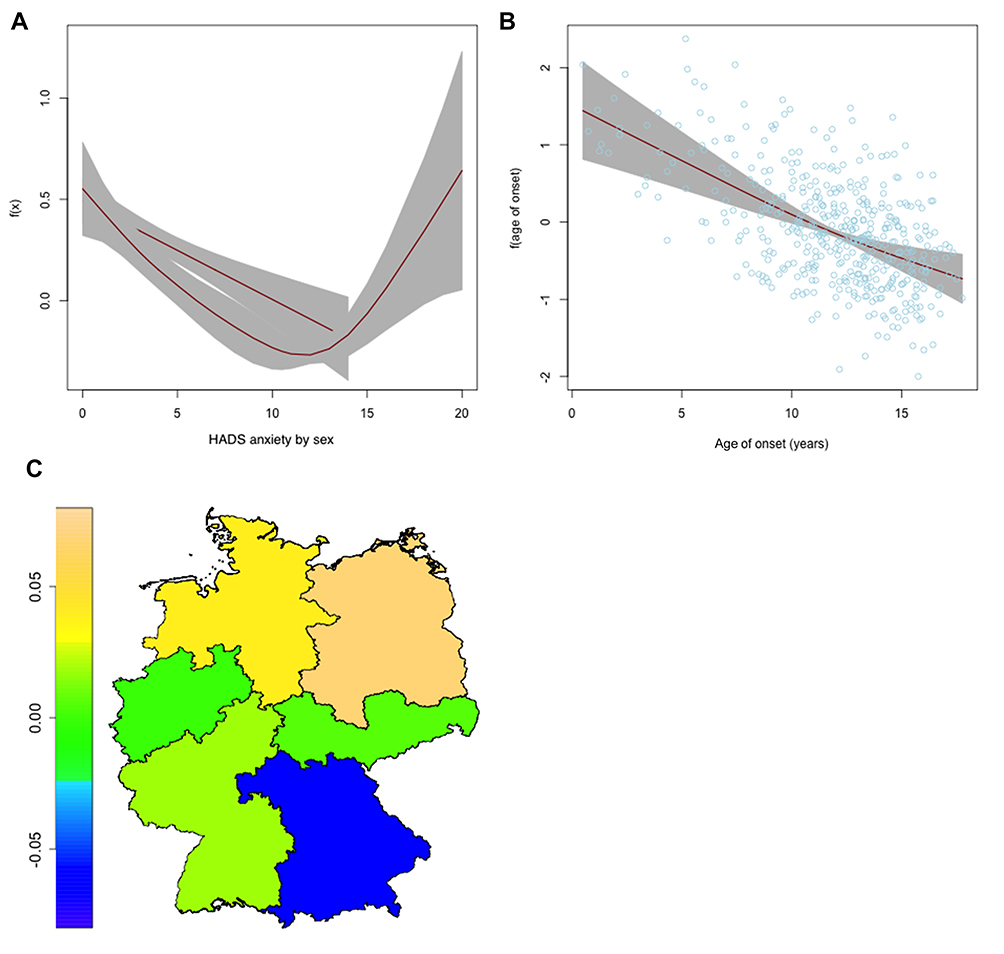 | Figure 2 Nonlinear and spatial effects for the μ-predictor of the step 1 regression model. Partial effects for the HADS anxiety subscore varying for sex (A) and for age of onset (B) as red lines, standard deviations in grey. Spatial effect for the region of residence (C) as heatmap of Germany. Abbreviation: HADS, Hospital Anxiety and Depression Scale. |
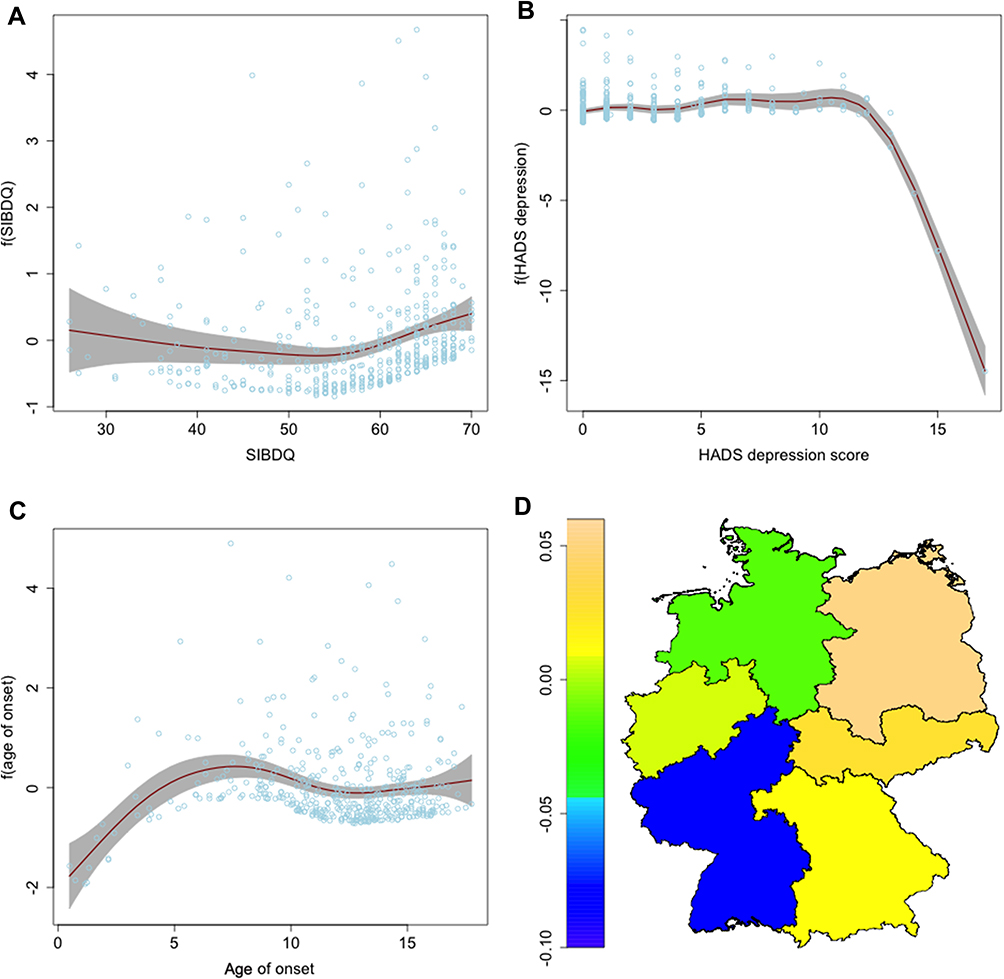
 | Figure 3 Nonlinear and spatial effects for the σ-predictor of the step 1 regression model. Partial effects for the SIBDQ (A), for the HADS depression subscore (B) and for the age of onset (C) as red lines, standard deviations in grey. Spatial effect for the region of residence (D) as heatmap of Germany.Abbreviations: SIBDQ, Short Inflammatory Bowel Disease Questionnaire; HADS, Hospital Anxiety and Depression Scale. |
The results of this first model suggested that patients who studied or had a working position showed a higher mean satisfaction than school attendees (OR 1.25, 95% CI 1.00–1.56). Patients with a higher disease activity seemed to be more satisfied on average (OR 1.18, CI 1.00–1.38). The expected satisfaction was smaller for patients who were living longer with their disease (OR 0.90 per year of disease duration, CI 0.86–0.94). For the HADS anxiety subscore, there seemed to be a negative relationship with patients’ satisfaction. For higher anxiety scores up to 14, the satisfaction was lower as shown in Figure 2. However, there were a few female patients with higher anxiety scores who showed a higher satisfaction. Further, a very young age of onset led to slightly more satisfaction. Finally, while the differences between the region of residence look interesting, the confidence intervals of the spatial effect are rather wide and no conclusions can be drawn from the estimates.
The predictor for σ had higher values for patients with CD (OR 1.19, CI 1.01–1.40) and in statutory health insurance (OR 1.22, CI 1.06–1.40). Nonlinear and spatial changes to the variance of the satisfaction are also shown in Figure 3. There was less variation for a few patients with a very young age of onset or a rather high HADS depression score. The variance was higher for very low or very high scores in the SIBDQ.
Step 2: relevance of provider
The results of the second step are presented in Table 2 and in Figures 4 and 5. The variable type of provider and an interaction with age of onset was selected into the final model.
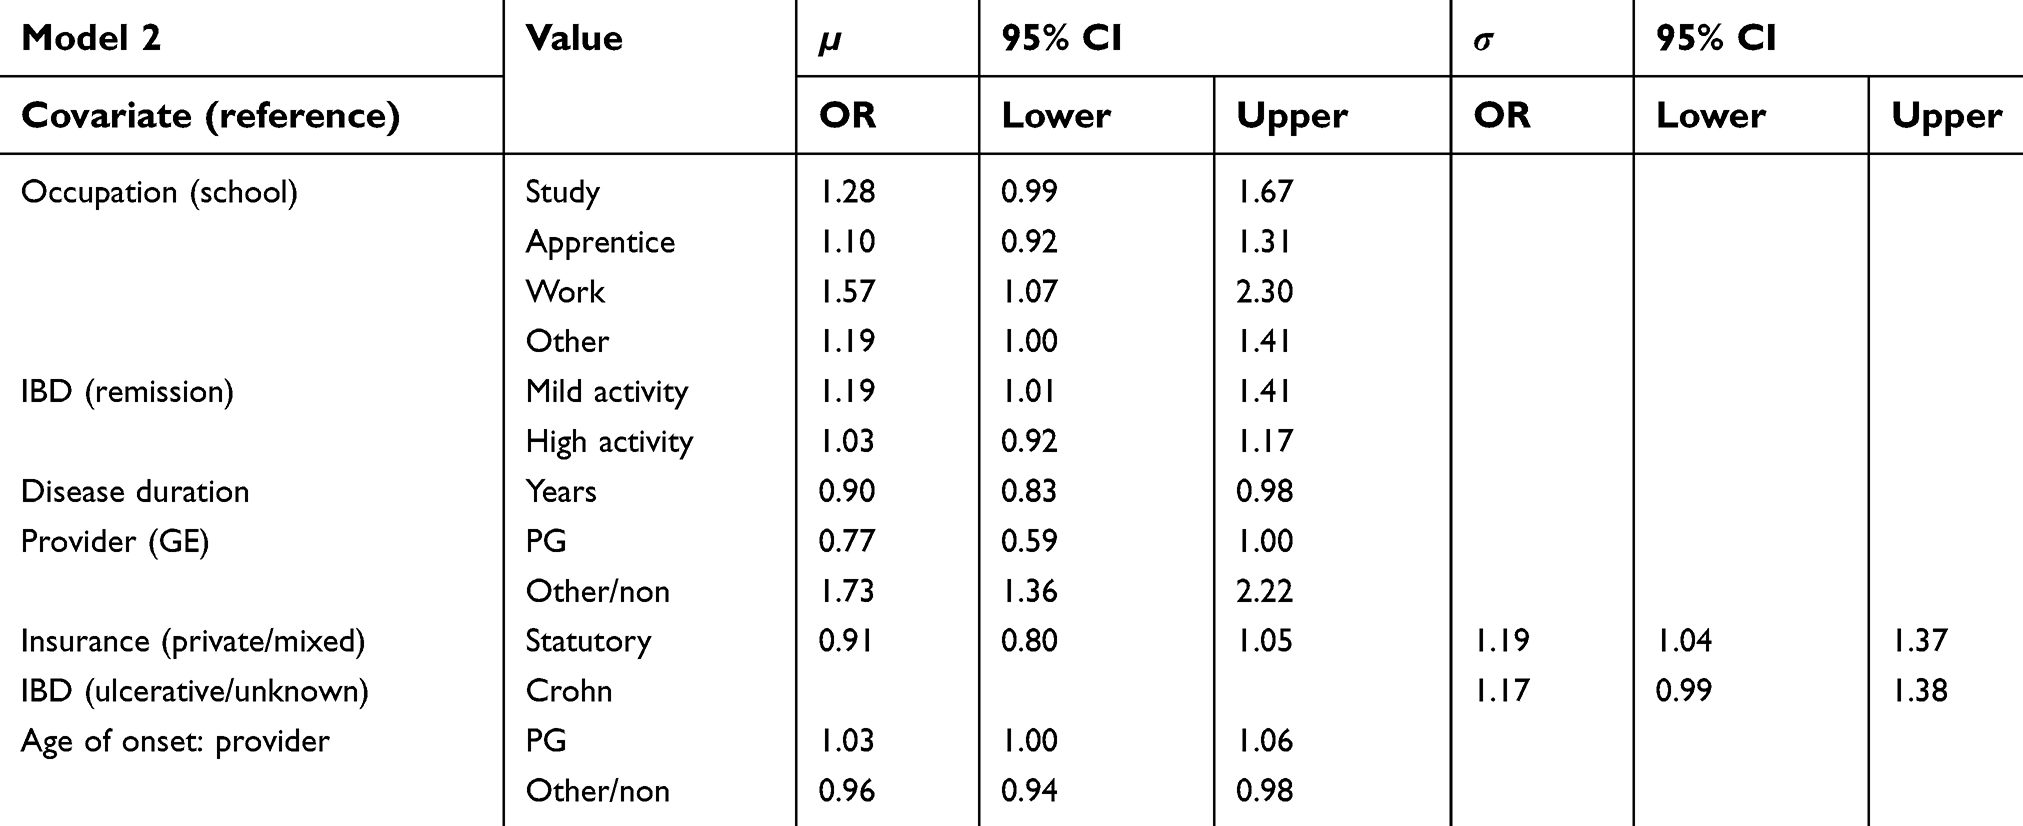 | Table 2 Adjusted odds ratios and 95% confidence intervals of parametric effects for both predictors in the step 2 model |
 | Figure 4 Nonlinear and spatial effects for the μ-predictor of the step 2 regression model. Partial effects for the HADS anxiety subscore varying for sex (A) and for age of onset (B) as red lines, standard deviations in grey. Spatial effect for the region of residence (C) as heatmap of Germany.Abbreviation: HADS, Hospital Anxiety and Depression Scale. |
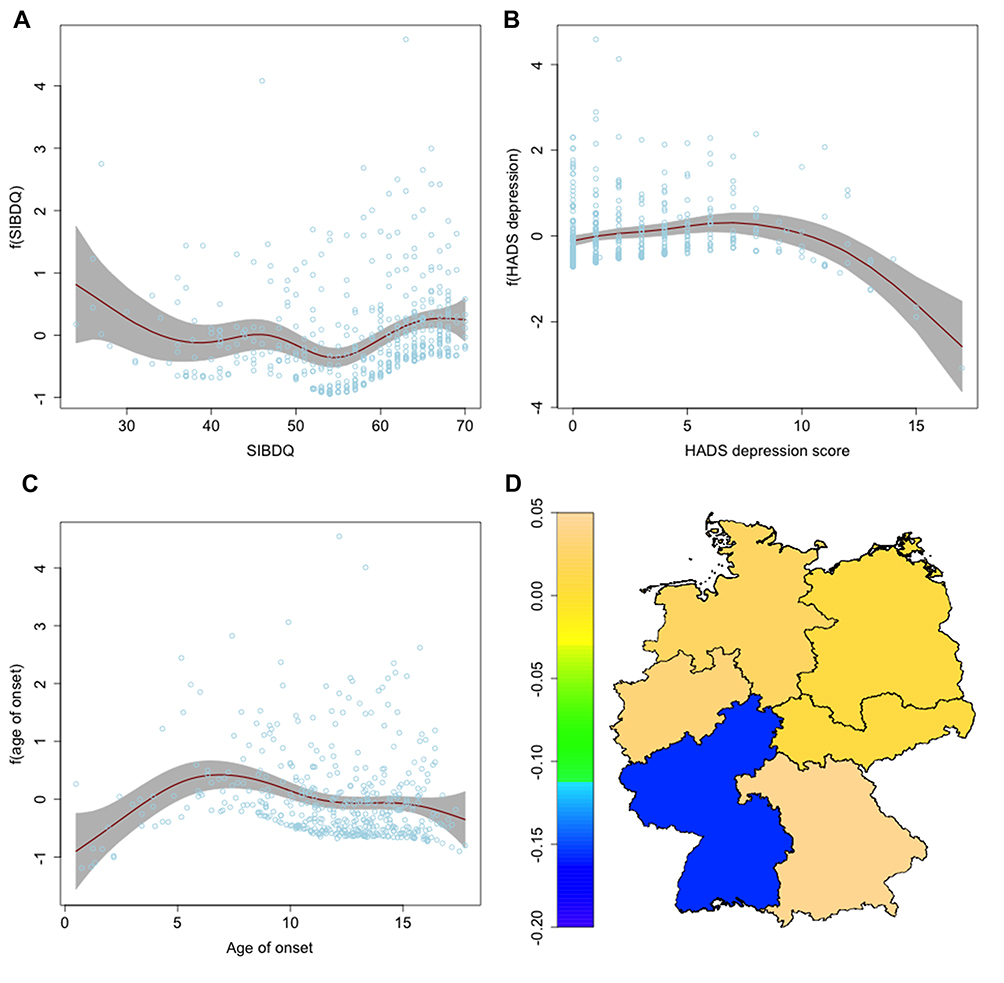
 | Figure 5 Nonlinear and spatial effects for the σ-predictor of the step 2 regression model. Partial effects for the SIBDQ (A), for the HADS depression subscore (B) and for the age of onset (C) as red lines, standard deviations in grey. Spatial effect for the region of residence (D) as heatmap of Germany.Abbreviations: SIBDQ, Short Inflammatory Bowel Disease Questionnaire; HADS, Hospital Anxiety and Depression Scale. |
Again, studying (OR 1.28, CI 0.99–1.67) or being in employment (OR 1.57, CI 1.07–2.30) resulted in a higher average satisfaction than attending school or an apprenticeship. Also, higher disease activity led to more satisfaction (OR 1.19, CI 1.01–1.41). A longer disease duration reduced the expected satisfaction similarly as in the previous model (OR 0.90 per year, CI 0.83–0.98). There was also a non-significant effect indicating that patients in care of a PG were less satisfied (OR 0.79, CI 0.53–1.17). Patients with older age of onset in combination with a PG as specialist health care provider were, however, more satisfied (OR 1.03 per year, CI 1.00–1.06). Patients in care of a nonspecialist, however, were more satisfied on average (OR 1.73, CI 1.36–2.22). The estimates for the nonlinear effects are displayed in Figure 4 for µ and in Figure 5 for σ. The results were very similar to those of the first model that only included the patients’ characteristics. An interaction between the anxiety score and sex and overall lower satisfaction for higher anxiety scores were still present. For patients with CD, the variance was likely higher than for other forms of colitis. A statutory insurance indicated a higher variance in the satisfaction score similar to the previous model.
Step 3: additional quality indicators
The third model and its estimated effects are reported in Table 3 and in Figures 6 and 7. The general structure of the selected model was similar to the two previous models. There were, however, a few changes. The current disease activity was not selected into the model anymore and neither was the interaction between type of provider and age of onset. Instead, we found the consultation time with physician and the experimental IMQI to be important covariates in the model. Once more, average satisfaction was higher for the occupations studying (OR 1.05, CI 0.95–1.16) and working (OR 1.44, CI 1.32–1.58) and it was lower for patients with a longer disease duration (OR 0.93 per year, CI 0.93–0.93). A higher IMQI seemed to result in a higher average satisfaction (OR 1.94, CI 1.94–1.94). The mean of the response was also higher if the physician spent more time with the patient at an appointment (OR 1.63, CI 1.49–1.79) and slightly lower for patients with statutory insurance (OR 0.89, CI 0.82–0.97) and for patients in care of a PG (OR 0.90, CI 0.83–0.98). Patients in care of a nonspecialist again had a higher average satisfaction (OR 1.10, CI 1.09–1.10). The effect of the interaction between sex and the HADS anxiety score was present. Opposed to the models from steps 1 and 2, this time the mean satisfaction of women with high anxiety scores was less pronounced. The results for the standard deviation σ were rather similar to step 2. σ was higher for patients with statutory insurance (OR 1.42, CI 1.31–1.54) and for patients with CD (OR 1.12, CI 0.94–1.33). It was again smaller for high scores of HADS depression (based on very few observations) and in the extremes of the SIBDQ. The variation was smaller among patients with a young age of onset. Generally, we often observed a lower σ for covariate values with fewer observations.
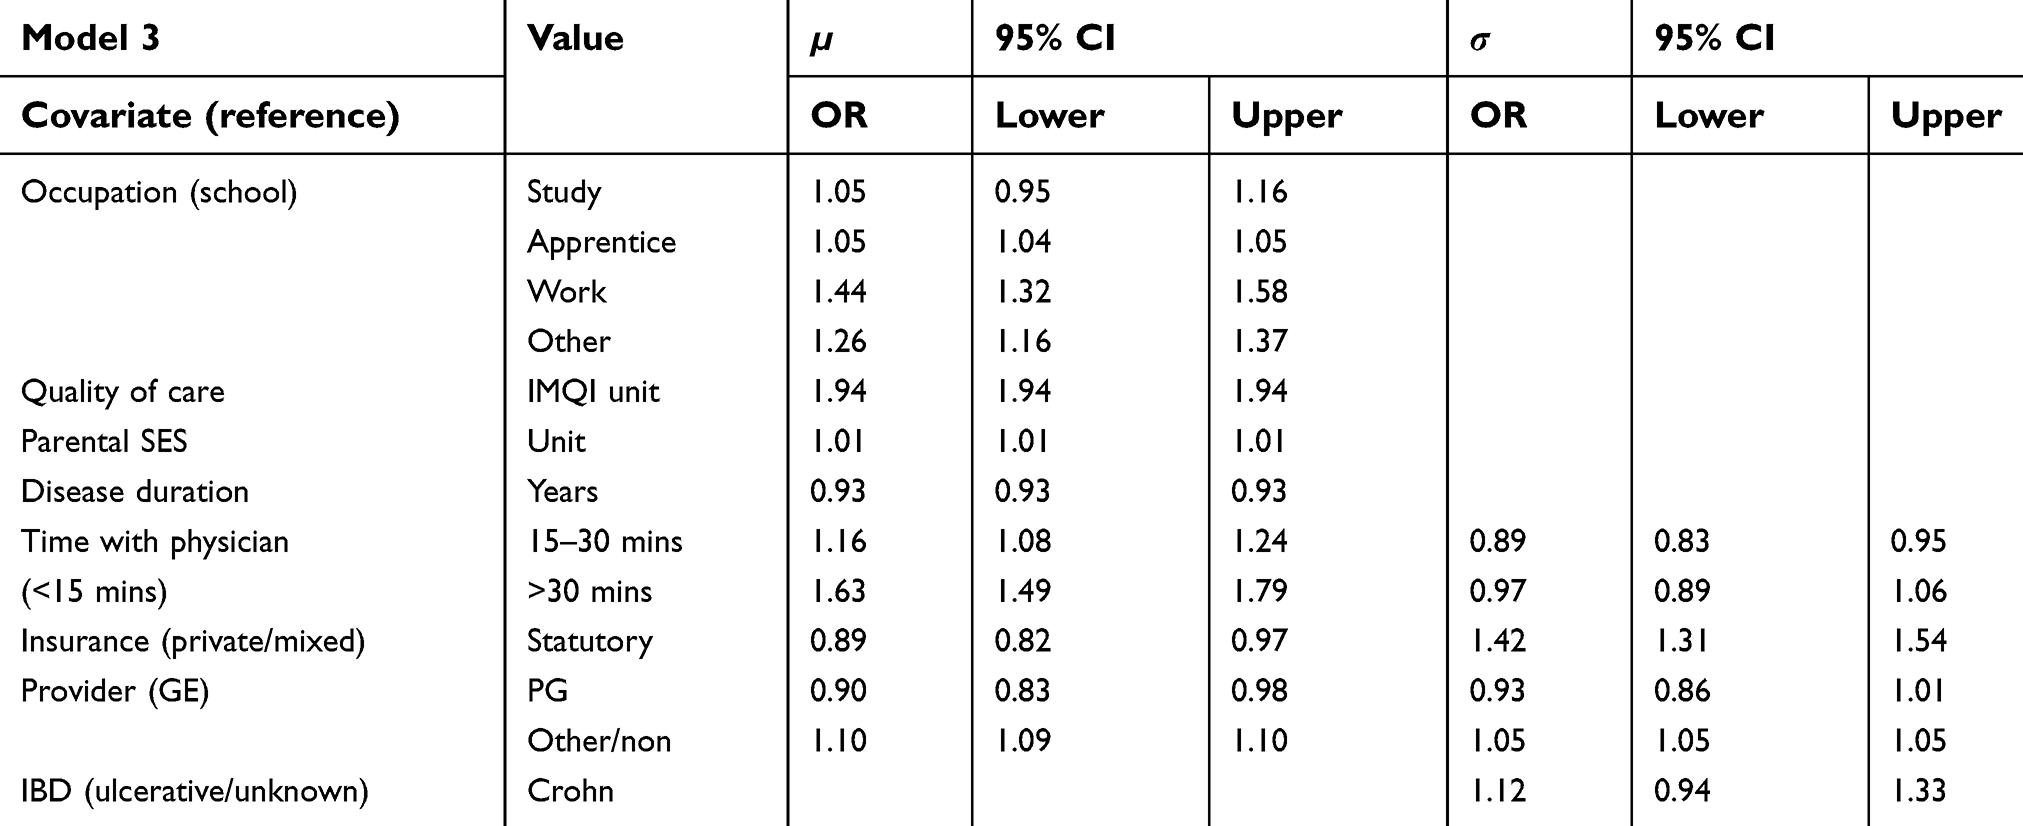 | Table 3 Adjusted odds ratios and 95% confidence intervals of parametric effects for both predictors in the step 3 model |
 | Figure 6 Nonlinear and spatial effects for the μ-predictor of the step 3 regression model. Partial effects for the HADS anxiety subscore varying for sex (A) and for age of onset (B) as red lines, standard deviations in grey. Spatial effect for the region of residence (C) as heatmap of Germany.Abbreviation: HADS, Hospital Anxiety and Depression Scale. |
 | Figure 7 Nonlinear and spatial effects for the σ-predictor of the step 3 regression model. Partial effects for the SIBDQ (A), for the HADS depression subscore (B) and for the age of onset (C) as red lines, standard deviations in grey. Spatial effect for the region of residence (D) as heatmap of Germany.Abbreviations: SIBDQ, Short Inflammatory Bowel Disease Questionnaire; HADS, Hospital Anxiety and Depression Scale. |
Discussion
Throughout all of our analyses, the first-stage residuals were never removed from our models by automatic model selection. The AIC was always improved by the inclusion of the first-stage results. Hence, we conclude that confounding was present in all three models and its impact might have been reduced by our two-stage approach. In addition, we found several pairwise interaction terms that helped to model dependencies among the covariates. A standard multiple regression model therefore cannot be appropriate to uncover important covariate effects. The complexity of the combinations of age-related variables and the type of provider became visible rather quickly. While an overall longer duration of the disease lowered the average satisfaction, a young age of onset increased it. These two findings have to be viewed in combination. On the other hand, no such interaction term was selected into the first-step model.
The regression coefficient of the IMQI in step 3 had to be put into the perspective that the overall range of the IMQI was restricted to one unit. Hence, the estimated increase presented in Table 3 was not directly observable.
There were also possibilities to estimate more flexible nonlinear or spatial effects in the model. For the spatial information on the region of residence, a large smoothing parameter was estimated.
This effectively reduced the dimension of the covariate in comparison to a categorical effect without losing the essential information about the effects on the response. In contrast, nonlinear effects with various degrees of freedom were selected for metric covariates such as age of onset, duration of disease, SIBDQ and HADS scores. The same covariates were included in the model only with a linear effect whenever appropriate such that complexity was only added as it was beneficial to the explanation of the conditional distribution of the response.
In a compromise of model fit and interpretability, the distribution of the response variable was approximated with a Beta distribution. This allowed us to model a standard deviation parameter in addition to the usual expectation parameter. In the results, we found, on the one hand, some covariates that were associated with a stronger variation of the response and therefore with either very high or very low values of satisfaction. On the other hand, the addition of a regression model to σ also led to far more results in the predictor for µ. The results were in part comparable to earlier results from a logistic model.
Comparison with previous analysis
The analyses presented here complement a more simplistic approach of modeling patient satisfaction as a binary outcome based on the same data.12 Previously, the focus was on low satisfaction while in the current analysis, the satisfaction score was used in its original scale, where higher scores mean higher satisfaction. Hence, effect estimates cannot be directly compared as they are presented anithetic. Handling of covariates also differed in several instances as the predictor was previously multiple linear or categorized in contrast to the semiparametric predictors constructed in this paper. As an example, HADS or SES were usually presented based on pre-defined thresholds, which was ignored for the current analysis. These differences were explained by the different focus of the two papers, where part 1 used standard approaches focusing on the clinical question, while in part 2 we were interested in non-linear distributions. These differences need to be kept in mind when comparing the results from both approaches, specifically checking, whether the selected GAMLSS contained the same influential covariates.
In step 1, two important covariates were selected into the logistic model. We similarly found that a higher HADS anxiety score decreased the satisfaction. In the previous paper, the quality of life measured by SIBDQ was estimated to be negatively associated with low satisfaction. In the current analyses, the quality of life was not selected into the mean predictor but instead had an effect on the variation of the response.
In step 2, mainly the lack of a GE specialist as IBD health care provider was a predictor for low satisfaction in the logistic models. At first, it looked like the GAMLSS contradicted that as the presence of a PG seemed to decrease the satisfaction compared to an adult or no specialist. However, with the additional interaction of specialist and age of onset, a slight increase in satisfaction was again present if an appropriate specialist was the main health care provider.
In the third step, a similar importance of the additional quality indicators in both models was found. In the logistic regression, the additional time with the physician at an appointment was protective from low satisfaction with odds ratios of 0.35 (15–30 mins) and 0.20 (more than 30 mins) and in the GAMLSS it increased the satisfaction with odds ratios of 1.16 (15–30 mins) and 1.63 (more than 30 mins). An increased IMQI was negatively associated with low satisfaction (OR 0.40) in the logistic model and improved the average satisfaction in the GAMLSS (OR 1.94). The overall importance of the quality indicators appeared to be similar in both models even though the coefficients in the GAMLSS were less pronounced than in the previous logistic model. Also, the time spent in the waiting room was of similar importance in the first analysis. It was not included in the final model of our current analyses. In summary, most of the key findings of the logistic models could also be found in the models we present in this paper. We additionally found spatial effects, relevant interaction terms and information about the variance of the satisfaction score. The latter may also be used to predict patients with very low satisfaction. Overall, we found that in this scenario a distributional regression was superior to classical regression methods. The consideration of changes in variance and skewness led not only to an improved model fit for the expectation, but for the entire distribution of the response. Substantial information was added to the explanation of the satisfaction through the second predictor.
Outlook
The selection of the final sets of variables is a demanding task, especially with such a large number of covariates and possible interaction terms. In comparison to a standard model selection procedure, the complexity is exponential with 2x due to the two parameters in the response’s distribution. The GAMLSS selection process iterates between both predictors and the sheer number of variables only allow for a stepwise selection procedure. In the future, with a strong parallelization of the selection process, it might be possible to find the overall best model out of all available ones. While the stepwise selection process has run for several hours on a single computer, a parallel procedure that checks many models at the same time could finish in roughly the same amount of time and bring certainty that the best subset of variables will be selected.
The results of a GAMLSS regression still strongly depend on the initial choice of a parametric distribution family. Usually, a parsimonious distribution with no more than 4 parameters is chosen to keep the results interpretable. Still, it might very well be that the entire type of the response’s distribution changes along with some covariate or between different subgroups. Thus, the analyses could be performed using nonparametric alternatives like quantile or expectile regression.26,27 Both methods estimate a direct relationship between different parts of the response and the covariates. At the moment, they do not allow for the introduction of an additional link function to the predictor(s). Hence, an estimated quantile/expectile may exceed the range of the response. If, at any quantile level, our model predicted more than 100% satisfaction, it would have ceased to be useful for our purposes. An expectile regression model with a flexible link function is in development at the time and a future analysis of patient-reported outcomes with a limited range may opt for a nonparametric distributional regression.
Acknowledgments
We thank all pediatricians who have contributed patients to the survey, and the teams at Helmholtz Center Munich and BIPS Bremen for survey and coordination support. We also thank the patients’ representatives for their valuable input to this study. The survey was funded by a grant from the German Crohn and Colitis Association DCCV eV. Finally, we thank two anonymous referees and the editorial team for their valuable comments that helped to improve this paper.
Author contributions
Fabian Otto-Sobotka set up the statistical models, performed the analyses and wrote the manuscript. Antje Timmer conceived the study, supervised the survey, consulted on the variable selection and treatment and contributed to the manuscript. Jenny Peplies coordinated the survey and critically commented on the paper. All authors contributed toward data analysis, drafting and revising the paper, gave final approval of the version to be published and agree to be accountable for all aspects of the work.
Disclosure
The authors report no conflicts of interest in this work.
References
1. Ware JE
2. Crow R, Gage H, Hampson S, et al. The measurement of satisfaction with healthcare: implications for practice from a systematic review of the literature. Health Technol Assess. 2002;6(32):1–244.
3. Batbaatar E, Dorjdagva J, Luvsannyam A, Amenta P. Conceptualisation of patient satisfaction: a systematic narrative literature review. Perspect Public Health. 2015;135(5):243–250. doi:10.1177/1757913915594196
4. Perneger TV. Adjustment for patient characteristics in satisfaction surveys. Int J Qual Health Care. 2004;16(6):433–435. doi:10.1093/intqhc/mzh090
5. Batbaatar E, Dorjdagva J, Luvsannyam A, Savino MM, Amenta P. Determinants of patient satisfaction: a systematic review. Perspect Public Health. 2017;137(2):89–101. doi:10.1177/1757913916634136
6. Hall JA, Dornan MC. Patient sociodemographic characteristics as predictors of satisfaction with medical care: a meta-analysis. Soc Sci Med. 1990;30(7):811–818.
7. Rahmqvist M. Patient satisfaction in relation to age, health status and other background factors: a model for comparisons of care units. Int J Qual Health Care. 2001;13(5):385–390.
8. Collins K, O’Cathain A. The continuum of patient satisfaction – from satisfied to very satisfied. Soc Sci Med. 2003;57(12):2465–2470.
9. Williams B, Coyle J, Healy D. The meaning of patient satisfaction: an explanation of high reported levels. Soc Sci Med. 1998;47(9):1351–1359.
10. Friedberg MW, Gelb Safran D, Schneider EC. Satisfied to death: a spurious result? Arch Intern Med. 2012;172(14):1112–1113, author reply 1113. doi:10.1001/archinternmed.2012.2060
11. Mulcahy L, Tritter JQ. Pathways, pyramids and icebergs? Mapping the links between dissatisfaction and complaints. Sociol Health Ill. 1998;20(6):825–847. doi:10.1111/1467-9566.00131
12. Timmer A, de Sordi D, Menke E, et al. Modeling determinants of satisfaction with health care in youth with inflammatory bowel disease: a cross-sectional survey. Clin Epidemiol. 2018;10:1289–1305. doi:10.2147/CLEP.S165554
13. Cole TJ, Green PJ. Smoothing reference centile curves: the LMS method and penalized likelihood. Stat Med. 1992;11(10):1305–1319.
14. Rigby RA, Stasinopoulos DM. Generalized additive models for location, scale and shape. J R Stat Soc Ser C Appl Stat. 2005;54:507–544. doi:10.1111/j.1467-9876.2005.00510.x
15. Timmer A, Peplies J, Westphal M, et al. Transition from pediatric to adult medical care – a survey in young persons with inflammatory bowel disease. PLoS One. 2017;12(5):e0177757. doi:10.1371/journal.pone.0177757
16. Buderus S, Scholz D, Behrens R, et al. Chronisch-entzuendliche Darmerkrankungen bei paediatrischen Patienten. Dtsch Arztebl Int. 2015;112:121–127.
17. Timmer A, Stark R, Peplies J, Classen M, Laass MW, Koletzko S. Current health status and medical therapy of patients with pediatric-onset inflammatory bowel disease: a survey-based analysis on 1280 patients aged 10–25 years focusing on differences by age of onset. Eur J Gastroenterol Hepatol. 2017;29(11):1276–1283. doi:10.1097/MEG.0000000000000956
18. Sadlo A, Altevers J, Peplies J, et al. Measuring satisfaction with health care in young persons with inflammatory bowel disease – an instrument development and validation study. BMC Health Serv Res. 2014;14:97. doi:10.1186/1472-6963-14-97
19. Winkler J, Stolzenberg H. Adjustment of the social class index for application in the german health interview and examination survey for children and adolescents. Wismar Discussion Papers. 2009;7.
20. Jöckel K, Babitsch B, Bellach B, Bloomfield K, Hoffmeyer-Zlotnik J, Winkler J Measurement and quantification of sociodemographic characteristics in epidemiological studies. German Working Group on Epidemiological Methods of the GMDS. 1997.
21. Timmer A, Kemptner D, Takses A, Klebl F, Jockel KH. A survey-based index was validated for measuring disease activity in inflammatory bowel disease. An evaluation study. J Clin Epidemiol. 2009;62(7):771–778. doi:10.1016/j.jclinepi.2008.07.020
22. Snaith RP. The hospital anxiety and depression scale. Health Qual Life Outcomes. 2003;1:1–29.
23. Herrmann-Lingen C, Buss U, Snaith RP. HADS-D: Hospital Anxiety and Depression Scale: Deutsche Version. Bern: Hans Huber; 2011.
24. Rose M, Fliege H, Hildebrandt M, et al. Validation of the new German translation version of the “Short Inflammatory Bowel Disease Questionnaire” (SIBDQ). Z Gastroenterol. 2000;38(4):277–286. doi:10.1055/s-2000-14868
25. Kneib T. Beyond mean regression. Stat Model. 2013;13(4):275–303. doi:10.1177/1471082X13494159
26. Koenker R, Bassett G. Regression quantiles. Econometrica. 1978;46(1):33–50. doi:10.2307/1913643
27. Newey WK, Powell JL. Asymmetric least-squares estimation and testing. Econometrica. 1987;55(4):819–847. doi:10.2307/1911031
28. Akaike H. Information measures and model selection. Bull Int Stat Inst. 1983;50:277–290.
29. Moret L, Nguyen J-M, Volteau C, Falissard B, Lombrail P, Gasquet I. Evidence of a non-linear influence of patient age on satisfaction with hospital care. Int J Qual Health Care. 2007;19(6):382–389. doi:10.1093/intqhc/mzm041
30. Eilers PH, Marx BD. Flexible smoothing with B-splines and penalties. J Stat Sci. 1996;11:89–121. doi:10.1214/ss/1038425655
31. Sobotka F, Radice R, Marra G, Kneib T. Estimating the relationship between women’s education and fertility in Botswana by using an instrumental variable approach to semiparametric expectile regression. J R Stat Soc Ser C Appl Stat. 2013;62(1):25–45. doi:10.1111/j.1467-9876.2012.01050.x
 © 2019 The Author(s). This work is published and licensed by Dove Medical Press Limited. The
full terms of this license are available at https://www.dovepress.com/terms
and incorporate the Creative Commons Attribution
- Non Commercial (unported, 3.0) License.
By accessing the work you hereby accept the Terms. Non-commercial uses of the work are permitted
without any further permission from Dove Medical Press Limited, provided the work is properly
attributed. For permission for commercial use of this work, please see paragraphs 4.2 and 5 of our Terms.
© 2019 The Author(s). This work is published and licensed by Dove Medical Press Limited. The
full terms of this license are available at https://www.dovepress.com/terms
and incorporate the Creative Commons Attribution
- Non Commercial (unported, 3.0) License.
By accessing the work you hereby accept the Terms. Non-commercial uses of the work are permitted
without any further permission from Dove Medical Press Limited, provided the work is properly
attributed. For permission for commercial use of this work, please see paragraphs 4.2 and 5 of our Terms.