Back to Journals » Clinical Ophthalmology » Volume 13
Parafoveal vessel changes in primary open-angle glaucoma and normal-tension glaucoma using optical coherence tomography angiography
Authors Onishi AC, Treister AD, Nesper PL, Fawzi AA, Anchala AR
Received 21 February 2019
Accepted for publication 17 June 2019
Published 27 September 2019 Volume 2019:13 Pages 1935—1945
DOI https://doi.org/10.2147/OPTH.S206288
Checked for plagiarism Yes
Review by Single anonymous peer review
Peer reviewer comments 2
Editor who approved publication: Dr Scott Fraser
Alex C Onishi, Alison D Treister, Peter L Nesper, Amani A Fawzi, Anupama R Anchala
Department of Ophthalmology, Feinberg School of Medicine, Northwestern University, Chicago, IL, USA
Correspondence: Anupama R Anchala
Department of Ophthalmology, Feinberg School of Medicine, Northwestern University, 645 North Michigan Avenue, Suite 440, Chicago, IL 60611, USA
Tel +1 312 908 8152
Fax +1 312 503 8152
Email [email protected]
Purpose: To evaluate parafoveal and peripapillary perfusion in healthy, glaucoma suspect, normal-tension glaucoma, and primary open-angle glaucoma subjects.
Patients and methods: This was a retrospective cross-sectional study with optical coherence tomography angiography imaging with RTVue XR Avanti (Optovue, Inc., Fremont, CA) of 56 eyes (14 healthy, 14 glaucoma suspect, 16 normal-tension glaucoma, and 12 primary open-angle glaucoma) at a tertiary academic referral center. Parafoveal and peripapillary superficial vessel density and parafoveal superficial retinal thickness were the main parameters of interest. Area under receiver operating characteristic curves were calculated.
Results: There were significant decreases in parafoveal superficial vessel density in primary open-angle (40.06±4.54%, P<0.001) and normal-tension glaucoma (42.82±5.16%, P=0.010) but not suspect eyes (45.72±4.37%, P=0.916) compared to healthy eyes (48.10±2.82%). Similarly, decreases were observed in parafoveal inner retinal thickness in primary open-angle (83.19±14.29 μm, P<0.001) and normal-tension glaucoma eyes (94.97±12.44 μm, P=0.035), but not suspect eyes (99.93±9.00 μm, P=0.648), compared to healthy controls (107.00±9.55 μm). Only primary open-angle glaucoma eyes displayed significant changes in peripapillary vessel density (37.63±7.19%) compared to healthy controls (49.12±2.80%, P<0.001). Further statistical adjustment for sex and age revealed a significant decrease in parafoveal vessel density in suspects relative to controls (P=0.039). Diagnostic accuracy of parafoveal vessel density was high with an area under the curve of 0.833±0.073 for normal-tension glaucoma and 0.946±0.049 for primary open-angle glaucoma.
Conclusion: Parafoveal vessel density was significantly reduced in glaucomatous eyes, with good diagnostic accuracy. These findings provide further evidence that these changes may be useful in the diagnosis and monitoring of disease in glaucoma patients.
Keywords: macular vessel density, high-tension glaucoma, low-tension glaucoma, retinal imaging
Introduction
Glaucoma is the leading cause of irreversible blindness worldwide, projected to affect more than 110 million people by 2040.1–3 The disease is a progressive optic neuropathy characterized by retinal ganglion cell axonal loss leading to optic disc cupping.4–6 Although the exact pathogenesis is unknown, there is well-established evidence that vascular changes and insufficient blood flow to the optic nerve contribute to the development and progression of disease.7–10 Recent studies using optical coherence tomography angiography (OCTA), a noninvasive imaging modality that can assess microvascular structure and function, have demonstrated decreased peripapillary vascular perfusion and capillary vessel density (VD) in glaucomatous eyes that worsen with increasing severity of disease.11–17 Notably, the vast majority of OCTA studies on glaucoma do not distinguish between normal-tension glaucoma (NTG) and primary open-angle glaucoma (POAG), and the few studies that do have focused primarily on the optic disc and peripapillary vasculature.18,19
Importantly, prior studies have also demonstrated macular structural changes in early glaucoma. High-definition OCT studies have found decreased macular ganglion cell complex thickness in diseased eyes, sometimes preceding the development of visual field defects.20,21 Although less attention has been given to macular retinal vessel perfusion, OCTA studies have reported significant impairment of the macular vasculature, which has been shown to be an effective diagnostic tool for glaucoma.22,23
As glaucomatous changes in the peripapillary microvasculature have already been extensively characterized, our main objective in the current study was to further investigate perfusion in the relatively less-studied macular region. Due to the known differences between low- and high-tension glaucoma,24–27 we were interested in exploring the differences in macular perfusion between the two disease groups. In addition, we sought to evaluate and compare the diagnostic utility of macular and peripapillary vascular OCTA parameters in both types of glaucoma.22,23,28 Rao et al28 have previously reported that baseline intraocular pressure appears to affect the diagnostic accuracy of optic nerve head VD but not macular or peripapillary VD in glaucoma. However, given the relative paucity of data in this area, we were interested in further examination of these questions. In the current study, we used OCTA to assess changes in parafoveal VD and inner retinal thickness, as well as peripapillary VD, in healthy, glaucoma suspect, NTG, and POAG eyes. Since NTG has traditionally been thought to have more vascular pathology compared to POAG,29 we hypothesized that there would be more significant macular VD affection in NTG eyes relative to POAG eyes.
Materials and methods
This was a retrospective cross-sectional study of 56 subjects presenting to the Department of Ophthalmology of Northwestern University, Feinberg School of Medicine between April 2016 and January 2018. Written informed consent was obtained from all patients, and Institutional Review Board (IRB)/Ethics Committee approval was obtained from Northwestern University. This study was conducted in compliance with the Health Insurance Portability and Accountability Act of 1996 and the tenets of the Declaration of Helsinki.
Inclusion criteria were healthy subjects or subjects with either suspected glaucoma or diagnosed primary glaucoma (with or without a history of elevated intraocular pressures). Healthy subjects were required to have IOP ≤21 mmHg as determined on Goldmann applanation tonometry with normal-appearing optic discs (ie, no neuroretinal rim thinning/notching, cup-to-disc ratio <0.5, and no cup-to-disc asymmetry greater than 0.15). NTG subjects had a history of pre-treatment IOP ≤21 mmHg (as determined by chart review), typical glaucomatous optic disc changes (eg, neuroretinal rim thinning/notching), glaucomatous visual field defects on standard automated perimetry (defined as 3 or more contiguous points of −5 dB depression or at least 1 point of −10 dB depression), and open angles on indentation gonioscopy, all of which were verified by a glaucoma expert (ARA). POAG subjects had identical criteria except for a history of pre-treatment IOP >21 mmHg, although glaucoma subjects on glaucoma medications for years with uncharted baseline pre-treatment IOP were also included in the POAG group. We included all comers with severities ranging from mild to severe glaucoma. Glaucoma suspects were defined as having optic disc changes suspicious for glaucoma (eg, cup-to-disc asymmetry) or IOP >21 mmHg with no definite or reproducible visual field changes. All glaucoma subjects were receiving treatment with pressure-lowering drops at the time of OCTA imaging.
Slit lamp examination including IOP measurement was performed on the day of imaging. The anterior segment was evaluated for shallow peripheral anterior chamber depth or crowded anterior chamber angle anatomy, as well as signs of secondary glaucoma. Exclusion criteria included eyes with angle-closure or secondary glaucoma, comorbid retinal vascular diseases, other causes of optic neuropathies, astigmatism (>3 D), high myopia (>6 D), or cataracts with a grade above nuclear opalescence or nuclear color grade three. Eyes with OCT angiograms with scan quality <6 as well as those with segmentation errors were also excluded.
Only one eye per subject was included in the analysis. For subjects with two eligible eyes, we enrolled the eye with better scan quality on OCTA imaging. For those subjects with two eyes with the same OCTA scan quality, we enrolled the eye with the more reliable perimetry test.
Optical coherence tomography angiography
OCTA scans were acquired using the RTVue XR Avanti system (Optovue, Inc., Fremont, CA, USA). This system uses an 840-nm wavelength light source. Signal-to-noise ratio of blood flow detection was optimized with the split-spectrum amplitude-decorrelation angiography (SSADA) algorithm as detailed by Jia et al.30 3×3 mm OCTA scans centered on the fovea and 4.5×4.5 mm OCTA scans centered on the optic nerve head were obtained.
The parafovea was defined as an annular band circumscribing the fovea with an inner ring diameter of 1 mm and an outer ring diameter of 3 mm (Figure 1). The VD was defined as the percent volume occupied by blood vessels with flow detected in the scanned region, and was measured in the superficial inner retinal layers as defined between the inner limiting membrane (ILM) and the inner plexiform layer (IPL) following automated segmentation using standard AngioVue Analytics (Version 2016.1.0.26; Optovue, Inc., Fremont, California, USA).
 |
Figure 1 Optical coherence tomography angiography (OCTA) imaging of disease groups. Notes: Parafoveal and radial peripapillary capillary (RPC) vessel density measurements on en face OCTA images are shown. The parafovea is shown as the area between the two yellow circles on the angiograms centered on the fovea, while the RPC region is shown as the area between the two red circles on the angiograms centered on the optic disc. The measured vessel density is reported on each angiogram.Abbreviations: HC, healthy controls; GS, glaucoma suspects; NTG, normal-tension glaucoma; POAG, primary open angle glaucoma; VD, vessel density. |
The radial peripapillary capillary (RPC) region was defined as a 1-mm wide annular band circumscribing the optic disc. VD was measured between the ILM and the posterior boundary of the retinal nerve fiber layer (RNFL).
Thickness of the parafoveal superficial inner retinal layer segmentation was also measured from the ILM to the IPL as defined on the RTVue XR Avanti system.
High-definition optical coherence tomography (HD-OCT)
RNFL thickness measurements were obtained from macular cube 512×128 scans using the Cirrus HD-OCT system (Carl Zeiss Meditec, Dublin, CA, USA) within 6 months of OCTA imaging for POAG, NTG, and glaucoma suspect eyes.
Standard automated perimetry
Visual field testing for POAG, NTG, and glaucoma suspect eyes was performed using either a Humphrey Field Analyzer II, model 750 (Zeiss Humphrey Systems, Dublin, CA, USA) utilizing the 24-2 Swedish Interactive Thresholding Algorithm (SITA) or a Humphrey Field Analyzer III, which uses the Mixed Guided Progression Analysis (GPA) to determine mean deviation (MD). Visual field testing was performed within 6 months of acquisition of OCTA and HD-OCT scans. Criteria for reliability were (1) fixation loss <20% and (2) false-positive response rate <15%. Unreliable tests were excluded.
Statistical analysis
Analyses of variance (ANOVA) with post-hoc Bonferroni were performed for all comparisons except for mean deviation, where Mann-Whitney tests were utilized, using IBM SPSS (Version 24.0, IBM Corp., Armonk, NY, USA). Following these statistical tests, analyses of covariance (ANCOVA) to control for the covariates of sex and age with post-hoc Bonferroni correction were performed for parafoveal and peripapillary VD, as well as ILM-IPL and RNFL thickness with IBM SPSS. Fitted receiver operating characteristic (ROC) curves were derived using JROCFIT (John Eng, Johns Hopkins University, available at: www.jrocfit.org) for parafoveal VD, peripapillary VD, and ILM-IPL thickness to differentiate between (1) healthy and glaucoma eyes (NTG and POAG eyes combined), (2) healthy and POAG eyes, and (3) healthy and NTG eyes. Linear regression of parafoveal VD and ILM-IPL thickness were performed for all disease groups, and figures were created using Microsoft Excel (Version 15.32, Microsoft Corp, Redmond, WA, USA) and Microsoft PowerPoint (Version 16.24, Microsoft Corp, Redmond, WA, USA). Tables were created using Microsoft Word (Version 16.17, Microsoft Corp, Redmond, WA, USA). For all statistical analyses, P-values <0.05 were considered significant.
Results
Of 92 eyes eligible for this study, 27 were excluded due to coexisting retinal disease or a scan quality <6. Of the 9 remaining subjects with two eligible eyes, only one eye from each subject was selected as described in the methods section. As a result, 14 healthy, 14 glaucoma suspect, 16 NTG, and 12 POAG eyes (a total of 56 eyes) were included in this analysis (Table 1). All subjects included in the study were age 50 or older, and had refractive error within ±5 D sphere and ±3 D cylinder (Table 1). There were no significant differences in age between the various disease groups (Table 2). There were higher proportions of women in the glaucoma suspect and NTG groups relative to the control and POAG groups.
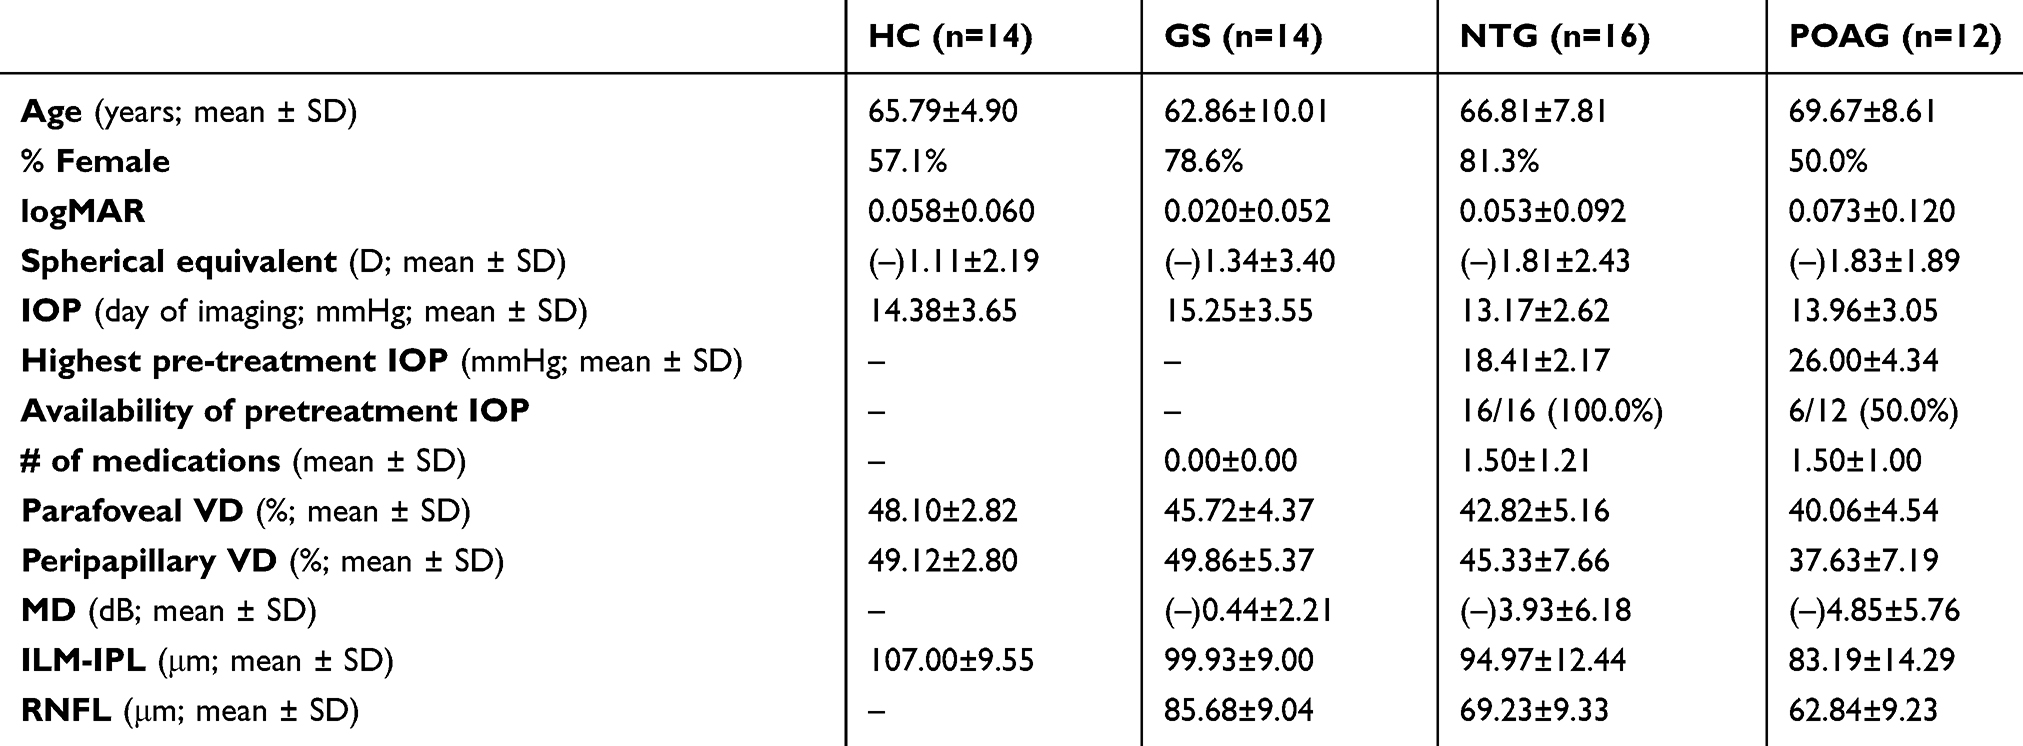 |
Table 1 Demographic and imaging characteristics of subjects |
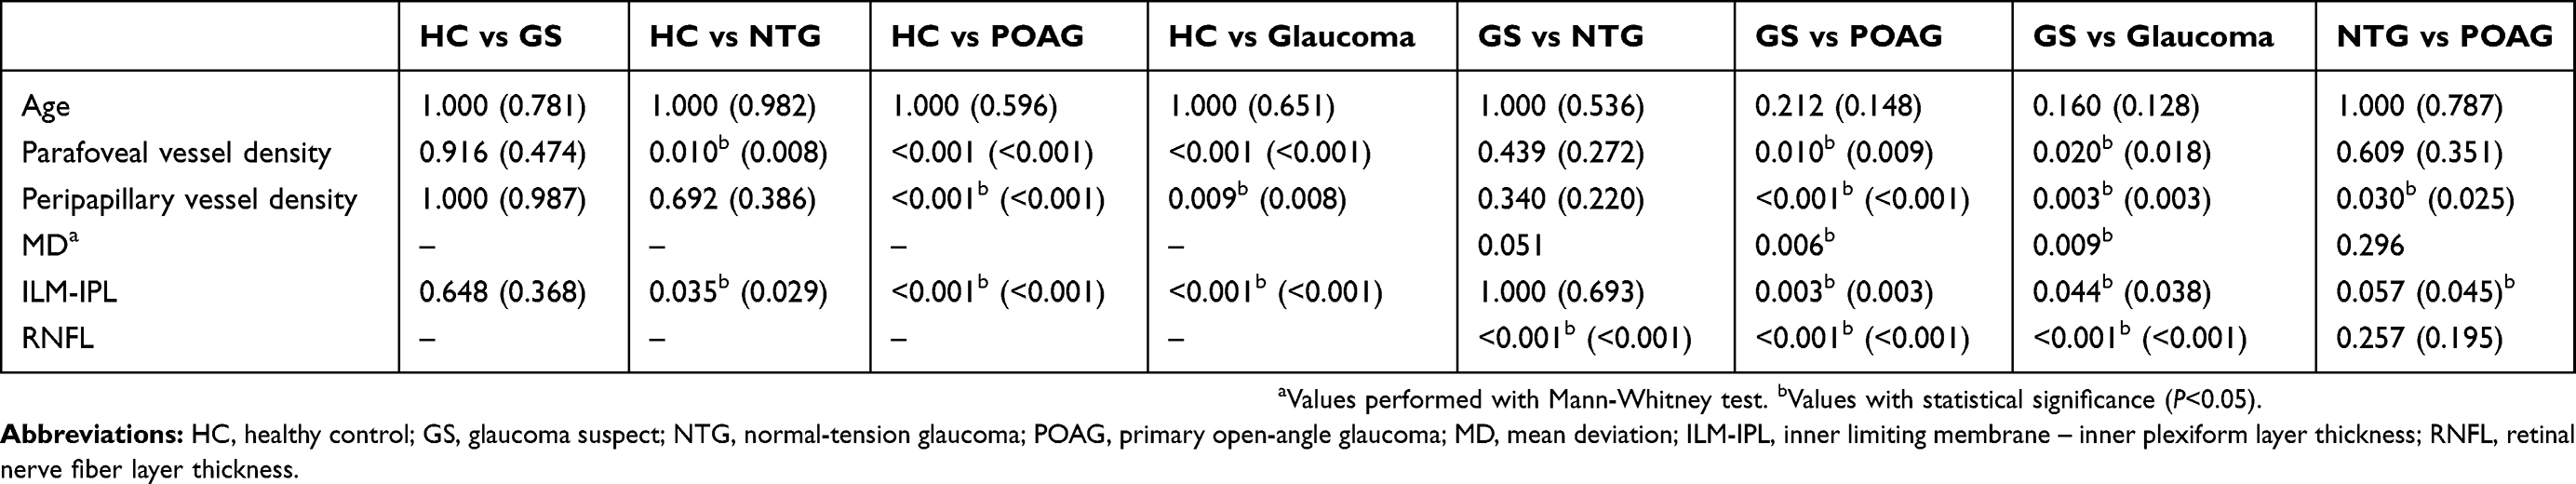 |
Table 2 Statistical comparisons of disease groups |
Compared to healthy eyes (48.10±2.82; Tables 1 and 2, Figure 2), mean parafoveal VD was significantly lower by ANOVA in both POAG (40.06±4.54%, P<0.001) and NTG eyes (42.82±5.16%, P=0.010) without adjustment for age or sex. There was a greater decrease in mean parafoveal VD in POAG eyes compared to NTG eyes, although that difference was not statistically significant. In contrast, peripapillary VD was significantly decreased in POAG eyes (37.63±7.19, P<0.001) but not in NTG eyes (45.33±7.66, P=0.692) relative to healthy controls (49.12±2.80). In addition, there was a significant difference between peripapillary VD of POAG and NTG eyes (P=0.030). There were no significant differences in either parafoveal (45.72±4.37, P=0.916) or peripapillary VD (49.86±5.37, P=1.000) between healthy and glaucoma suspect eyes.
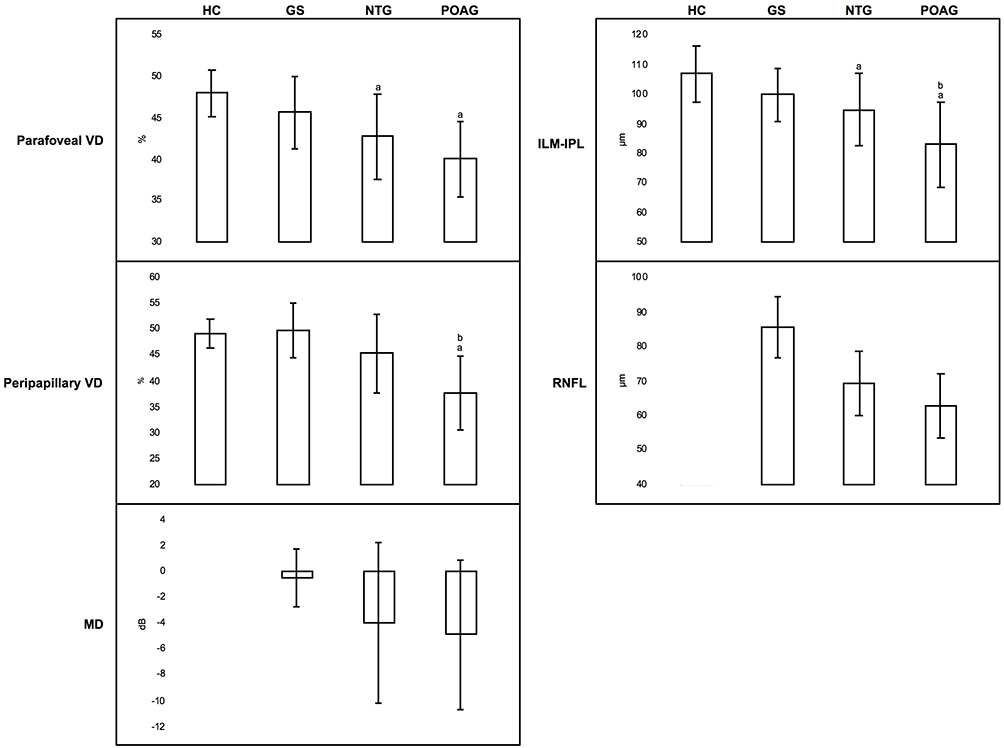 |
Figure 2 Graphical representation of information in Tables 1 and 2. Notes: Means and standard deviations are visually represented. aDenotes statistically significant comparisons with healthy controls (P<0.05) by ANOVA analysis with Bonferroni correction or Tukey analysis. As MD and RNFL thickness were not measured in healthy controls, comparisons with disease groups could not be made. bIndicates statistically significant differences between NTG and POAG groups (P<0.05) by ANOVA analysis with Bonferroni correction or Tukey analysis. Abbreviations: HC, healthy controls; GS, glaucoma suspects; NTG, normal-tension glaucoma; POAG, primary open angle glaucoma; VD, vessel density; MD, mean deviation; ILM-IPL, internal limiting membrane – internal plexiform layer thickness; RNFL, retinal nerve fiber layer thickness. |
Similar to OCTA VD measures, mean macular inner retinal layer thickness was significantly lower in POAG (83.19±14.29 μm, P<0.001) and NTG eyes (94.97±12.44 μm, P=0.035) when compared to healthy eyes (107.00±9.55 μm), unlike the comparison between glaucoma suspect eyes (99.93±9.00 μm, P=0.648) and healthy controls. Interestingly, there was also a difference in ILM-IPL thickness between NTG and POAG groups that was significant by Tukey analysis (P=0.045), but not by ANOVA with Bonferroni correction (P=0.057).
ANCOVA with Bonferroni correction for the purposes of adjusting for age and sex resulted in several key differences, most notably a significant discrepancy in parafoveal VD between healthy controls and glaucoma suspects (P=0.039), as well as now non-significant differences between NTG and POAG groups in peripapillary VD (P=0.212) and ILM-IPL thickness (P=0.180; Table 3).
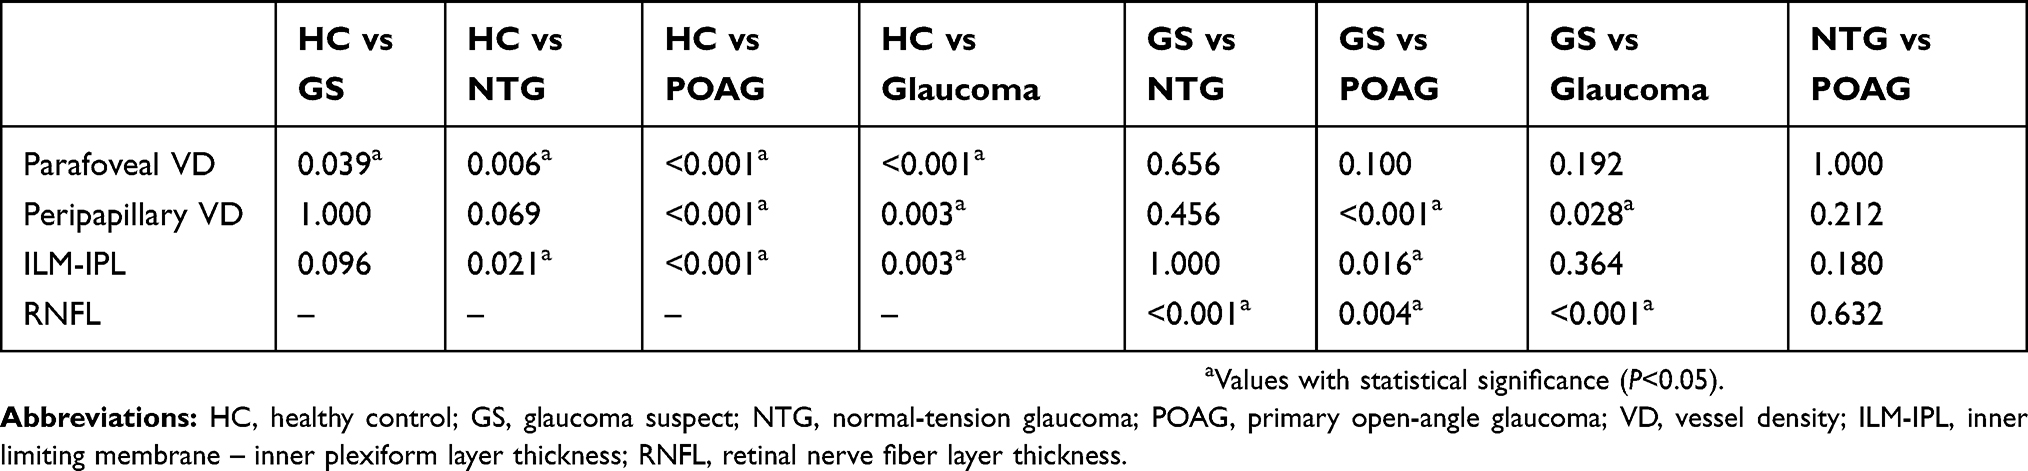 |
Table 3 Statistical comparisons of disease groups with adjustment for sex and age |
Linear regression analyses comparing mean inner retinal thickness and parafoveal VD showed a significant association in NTG (P=0.032) and POAG eyes (P=0.036), as well as when disease groups and healthy eyes were analyzed together (P<0.001; Figure 3).
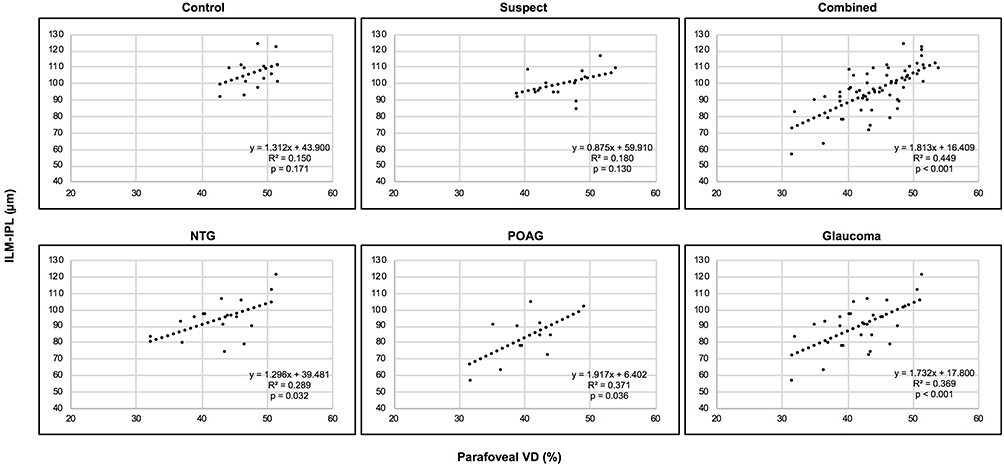 |
Figure 3 Correlation between inner retinal thickness and parafoveal vessel density across disease groups (controls, glaucoma suspects, NTG, POAG, glaucoma, and all groups combined). Abbreviations: NTG, normal-tension glaucoma; POAG, primary open-angle glaucoma; ILM-IPL, mean internal limiting membrane – internal plexiform layer thickness; VD, vessel density. |
Fitted ROC curves (Figure 4) comparing parafoveal VD, peripapillary VD, and mean inner retinal layer thickness showed that parafoveal VD was most successful at discriminating between glaucomatous eyes (NTG and POAG eyes combined) and healthy eyes, with an area under the receiver operating characteristic curve (AUC) of 0.881±0.052 (mean ± standard error). This was followed by inner retinal thickness (AUC =0.856±0.057) and then peripapillary VD (AUC =0.781±0.080). This hierarchy was preserved when analyzing NTG and POAG eyes separately compared to healthy eyes. When comparing NTG to healthy eyes, we found that parafoveal VD had an AUC =0.833±0.073, inner retinal thickness AUC =0.793±0.081, and peripapillary VD AUC =0.702±0.111. Comparisons of POAG with healthy controls resulted in a parafoveal VD AUC =0.946±0.049, inner retinal thickness AUC =0.944±0.055, and peripapillary VD AUC =0.849±0.110.
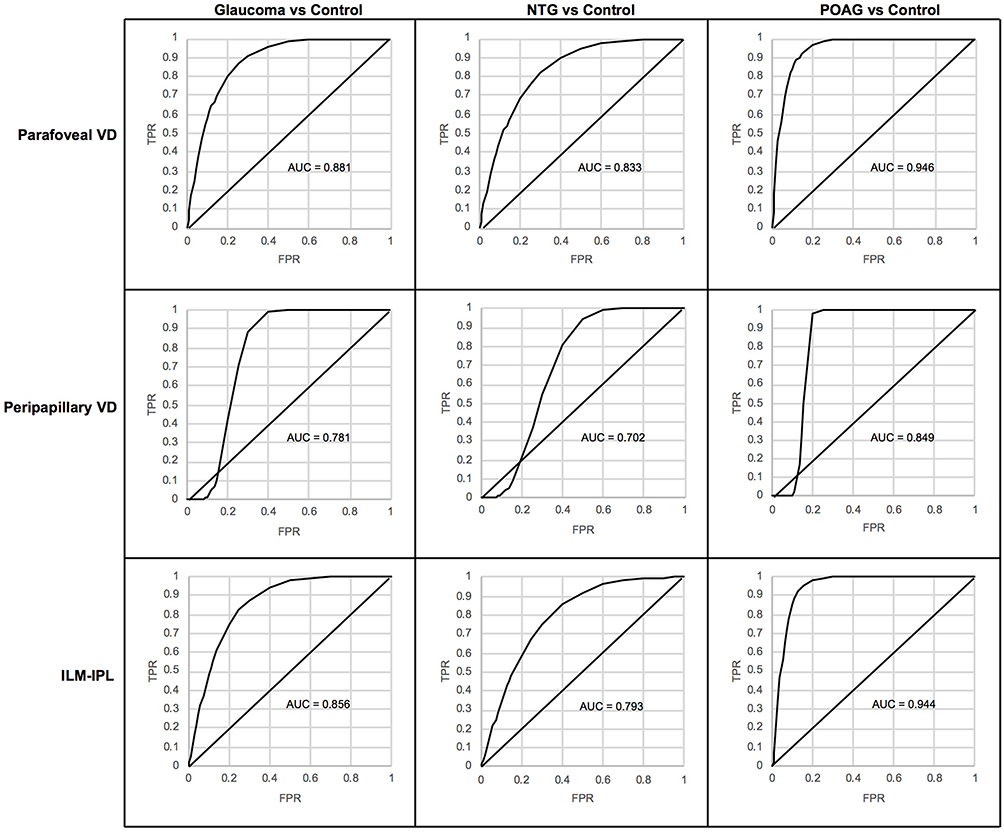 |
Figure 4 Fitted receiver operating characteristic (ROC) curves comparing healthy controls to glaucoma patients. Notes: These eyes were compared across parafoveal vessel density (VD; Top row), peripapillary vessel density (Middle row), and inner limiting membrane – inner plexiform layer thickness (ILM-IPL; Bottom row). Normal- and high-tension glaucoma subjects were analyzed individually as well as when combined into one glaucoma group (Left column). Abbreviations: AUC, area under the curve; TPR, true positive rate; FPR, false positive rate. |
Discussion
In this study, we used OCTA to study superficial parafoveal microvasculature changes in healthy, glaucoma suspect, NTG, and POAG eyes. Using ANOVA, we found statistically significant decreases in parafoveal VD as well as inner retinal thickness in NTG and POAG, but not suspect eyes, relative to healthy controls. Only POAG eyes (and not NTG eyes) showed significantly decreased peripapillary VD compared to healthy eyes. Overall, contrary to our hypothesis, parafoveal and peripapillary VD were quantitatively lower in POAG compared to NTG. While we initially found significant differences in peripapillary VD and ILM-IPL thickness between NTG eyes and POAG eyes, these discrepancies were no longer significant after controlling for sex and age. However, adjustment for these covariates did unmask a potentially significant difference in parafoveal VD between healthy controls and glaucoma suspects.
Although some have argued that NTG and POAG exist along the same disease continuum, there are well-characterized differences including discrepancies in optic nerve topography and visual field defects.24–27 While the underlying pathophysiologic processes are still unknown, IOP appears to be a primary risk factor in POAG whereas other risk factors may exert a larger relative effect in NTG.31 Due to an increased prevalence of comorbidities such as migraines and findings such as optic disc hemorrhages,32 NTG has historically been postulated to be associated with greater vascular compromise than POAG.29 Results from subsequent investigations have generally supported this model,33–37 but have not been universally consistent.38–40 Thus, our findings of absent significant differences in OCTA parameters, and, in fact, quantitatively decreased VD in POAG compared to NTG is notable.
Prior OCTA studies separating NTG and POAG have focused on perfusion of the optic disc and peripapillary area. Using optical microangiography-based OCTA, Bojikian et al19 concluded that while NTG and POAG eyes had lower optic disc perfusion compared to controls, there were no significant differences between the two disease groups. In contrast, Scripsema et al18 found that POAG eyes had significantly lower peripapillary VD than NTG eyes, and theorized that this was due to differences in ocular medications or differences in the underlying pathophysiology between NTG and POAG. These latter findings are somewhat consistent with our study, which identified significantly decreased peripapillary VD in POAG eyes, but not in NTG eyes, compared to healthy eyes (Tables 1–3, Figure 2). These differences were initially found to be significant before controlling for other covariates, but were no longer significant following adjustment. In contrast, parafoveal VD (and ILM-IPL thickness) were quantitatively lower in POAG eyes relative to NTG eyes, though the difference in parafoveal VD was not significant. Importantly, our findings differ from results reported by Xu et al,41 who found decreased parafoveal full retinal thickness VD in NTG eyes relative to POAG eyes in a study population of Chinese subjects. In addition, their investigation revealed a significant decrease in peripapillary VD in NTG eyes compared to POAG eyes, which is not consistent with our findings or those of Scripsema et al,18 but would be supportive of the vascular model of NTG. These conflicting findings may be related to the multi-factorial etiology of NTG or differences between study populations.
Past studies have suggested that quantitative analysis of VD could eventually be useful in the diagnosis of glaucoma.22,23,28 In the current study, superficial parafoveal VD was the most diagnostically accurate parameter in the combined population of glaucomatous eyes (AUC =0.881), as well as in NTG (AUC =0.833) and POAG eyes (AUC =0.946) analyzed separately (Figure 4). This is consistent with the report by Takusagawa et al, who found a high diagnostic accuracy for superficial macular VD (AUC =0.961) relative to full-thickness vessel densities (AUC =0.906) and ganglion cell complex thicknesses (AUC =0.950) in perimetric glaucomatous eyes.23 In a separate study focusing on the macular ganglion cell-IPL vasculature (excluding the RNFL), Richter et al22 reported an AUC of 0.83 for vessel area density, also consistent with our study. In contrast, Rao et al found peripapillary (AUC =0.83) and inside disc VD (AUC =0.73) to be more accurate diagnostic markers for POAG compared to parafoveal VD (AUC =0.63).28
Although the pathophysiologic process of glaucoma is poorly understood, histopathologic studies have demonstrated that glaucoma is associated with loss of retinal ganglion cells (more than 30% of which are in the macula).6,42 At the moment, it is unclear whether VD changes precede ganglion cell loss or are a direct result of loss of neural tissue and thus a marker for both POAG and NTG. In their OCTA study, Shoji et al43 showed that the rate of macular capillary dropout in glaucomatous eyes was significantly faster than in both suspect and healthy eyes over the course of at least one year, whereas the ganglion cell complex thickness did not show significant thinning and did not differ significantly between glaucomatous, suspect, and healthy eyes. In our study, there was a significant decrease in parafoveal VD in suspects relative to controls despite a lack of significant change in ILM-IPL thickness after adjustment for covariates. While our cross-sectional study design precludes judgments on temporality, our results indicate that decreased parafoveal VD may be one of the earliest changes in glaucoma. One previously suggested mechanism for primary vascular involvement in glaucoma is that increased IOP may lead to capillary occlusion and thus a decrease in VD.13,44 Our study findings are significant in revealing macular vessel changes regardless of a history of elevated IOP, which is consistent with the study by Rao et al28 and suggests that macular vascular changes in glaucoma may instead be related to other mechanisms.
Strengths of this study include its differentiation between NTG and POAG subjects and stringent statistical analysis including post-hoc correction for multiple comparisons. However, important limitations include the cross-sectional nature of the study, which prevents determination of a temporal relationship between decreased VD and glaucoma progression. Additionally, while sample sizes were sufficient to detect differences in parafoveal and peripapillary VD between controls and glaucomatous eyes, our study was likely underpowered to detect possible differences between NTG and POAG eyes. Furthermore, the effect of glaucoma eye drops on macular VD offers a potential confounding variable that we were unable to control for. Another limitation is the use of 3×3 mm macular scans, which may not capture all of the macular changes in glaucoma.45
In conclusion, after comparing POAG and NTG subjects to each other and to glaucoma suspects and healthy controls, we provide evidence that both NTG and POAG eyes undergo comparable and significant inner macular capillary vascular compromise as well as inner macular thinning. These findings suggest that there may be a common underlying pathophysiologic process that is not directly related to the high IOP. In addition, our results support a future role for parafoveal VD in the accurate diagnosis of low- and high-tension glaucoma, an important area for continued glaucoma research.
Abbreviations
VD, vessel density; IOP, intraocular pressure; OCTA, optical coherence tomography angiography; NTG, normal-tension glaucoma; POAG, primary open-angle glaucoma; IPL, inner plexiform layer; ILM, inner limiting membrane; RNFL, retinal nerve fiber layer; MD, mean deviation; ROC, receiver operating characteristic; AUC, area under the receiver operating characteristic curve.
Ethics approval and informed consent
Written informed consent was obtained from all patients, and Institutional Review Board (IRB)/Ethics Committee approval was obtained from Northwestern University. This study was conducted in compliance with the Health Insurance Portability and Accountability Act of 1996 and the tenets of the Declaration of Helsinki.
Consent for publication
Written informed consent for publication was obtained from all patients.
Data availability
Data supporting the results reported in the manuscript can be obtained by contacting the corresponding author.
Acknowledgment
We would like to acknowledge Research to Prevent Blindness (New York, NY) which provided an unrestricted grant to Northwestern University. We would also like to acknowledge OptoVue, Inc which provided research instrument support to Northwestern University.
This work was supported by an unrestricted grant to Northwestern University from Research to Prevent Blindness (New York, NY). OptoVue, Inc provided research instrument support to Northwestern University. The sponsor or funding organizations had no role in the design or conduct of this research or the decision to submit for publication.
Author contributions
All authors contributed to data analysis, drafting, or revising the article, gave final approval of the version to be published, and agree to be accountable for all aspects of the work.
Disclosure
The authors report no conflicts of interest in this work.
References
1. Tham YC, Li X, Wong TY, Quigley HA, Aung T, Cheng CY. Global prevalence of glaucoma and projections of glaucoma burden through 2040: a systematic review and meta-analysis. Ophthalmology. 2014;121(11):2081–2090. doi:10.1016/j.ophtha.2014.05.013
2. Quigley HA, Broman AT. The number of people with glaucoma worldwide in 2010 and 2020. Br J Ophthalmol. 2006;90(3):262–267. doi:10.1136/bjo.2005.081224
3. Kingman S. Glaucoma is second leading cause of blindness globally. Bull World Health Organ. 2004;82(11):887–888. doi:10.1590/S0042-96862004001100019
4. Quigley HA. Neuronal death in glaucoma. Prog Retin Eye Res. 1999;18(1):39–57.
5. Harwerth RS, Quigley HA. Visual field defects and retinal ganglion cell losses in patients with glaucoma. Arch Ophthalmol. 2006;124(6):853–859. doi:10.1001/archopht.124.6.853
6. Quigley HA, Dunkelberger GR, Green WR. Retinal ganglion cell atrophy correlated with automated perimetry in human eyes with glaucoma. Am J Ophthalmol. 1989;107(5):453–464. doi:10.1016/0002-9394(89)90488-1
7. Cherecheanu AP, Garhofer G, Schmidl D, Werkmeister R, Schmetterer L. Ocular perfusion pressure and ocular blood flow in glaucoma. Curr Opin Pharmacol. 2013;13(1):36–42. doi:10.1016/j.coph.2012.09.003
8. Flammer J, Orgul S. Optic nerve blood-flow abnormalities in glaucoma. Prog Retin Eye Res. 1998;17(2):267–289.
9. Grieshaber MC, Flammer J. Blood flow in glaucoma. Curr Opin Ophthalmol. 2005;16(2):79–83.
10. Harris A, Rechtman E, Siesky B, Jonescu-Cuypers C, McCranor L, Garzozi HJ. The role of optic nerve blood flow in the pathogenesis of glaucoma. Ophthalmol Clin North Am. 2005;18(3):345–353. doi:10.1016/j.ohc.2005.04.001
11. Lee EJ, Lee KM, Lee SH, Kim TW. OCT angiography of the peripapillary retina in primary open-angle glaucoma. Invest Ophthalmol Vis Sci. 2016;57(14):6265–6270. doi:10.1167/iovs.16-20287
12. Mammo Z, Heisler M, Balaratnasingam C, et al. Quantitative optical coherence tomography angiography of radial peripapillary capillaries in glaucoma, glaucoma suspect, and normal eyes. Am J Ophthalmol. 2016;170:41–49. doi:10.1016/j.ajo.2016.07.015
13. Rao HL, Kadambi SV, Weinreb RN, et al. Diagnostic ability of peripapillary vessel density measurements of optical coherence tomography angiography in primary open-angle and angle-closure glaucoma. Br J Ophthalmol. 2017. 101(8):1066–1070. doi:10.1136/bjophthalmol-2016-309377
14. Yarmohammadi A, Zangwill LM, Diniz-Filho A, et al. Optical coherence tomography angiography vessel density in healthy, glaucoma suspect, and glaucoma eyes. Invest Ophthalmol Vis Sci. 2016;57(9):OCT451–OCT459. doi:10.1167/iovs.15-18944
15. Jia Y, Wei E, Wang X, et al. Optical coherence tomography angiography of optic disc perfusion in glaucoma. Ophthalmology. 2014;121(7):1322–1332. doi:10.1016/j.ophtha.2014.01.021
16. Zhang S, Wu C, Liu L, et al. Optical coherence tomography angiography of the peripapillary retina in primary angle-closure glaucoma. Am J Ophthalmol. 2017;182:194–200. doi:10.1016/j.ajo.2017.07.024
17. Daneshvar R, Nouri-Mahdavi K. Optical coherence tomography angiography: a new tool in glaucoma diagnostics and research. J Ophthalmic Vis Res. 2017;12(3):325–332. doi:10.4103/jovr.jovr_36_17
18. Scripsema NK, Garcia PM, Bavier RD, et al. Optical coherence tomography angiography analysis of perfused peripapillary capillaries in primary open-angle glaucoma and normal-tension glaucoma. Inv Ophthalmol Vis Sci. 2016;57:OCT611–OCT620. doi:10.1167/iovs.15-18945
19. Bojikian KD, Chen CL, Wen JC, et al. Optic disc perfusion in primary open angle and normal tension glaucoma eyes using optical coherence tomography-based microangiography. PLoS One. 2016;11(5):e0154691. doi:10.1371/journal.pone.0154691
20. Hood DC, Raza AS, de Moraes CG, Liebmann JM, Ritch R. Glaucomatous damage of the macula. Prog Retin Eye Res. 2013;32:1–21. doi:10.1016/j.preteyeres.2012.08.003
21. Zhang C, Tatham AJ, Weinreb RN, et al. Relationship between ganglion cell layer thickness and estimated retinal ganglion cell counts in the glaucomatous macula. Ophthalmology. 2014;121(12):2371–2379. doi:10.1016/j.ophtha.2014.06.047
22. Richter GM, Madi I, Chu Z, et al. Structural and functional associations of macular microcirculation in the ganglion cell-inner plexiform layer in glaucoma using optical coherence tomography angiography. J Glaucoma. 2018;27(3):281–290. doi:10.1097/IJG.0000000000000888
23. Takusagawa HL, Liu L, Ma KN, et al. Projection-resolved optical coherence tomography angiography of macular retinal circulation in glaucoma. Ophthalmology. 2017;124(11):1589–1599. doi:10.1016/j.ophtha.2017.06.002
24. Igarashi R, Ochiai S, Sakaue Y, et al. Optical coherence tomography angiography of the peripapillary capillaries in primary open-angle and normal-tension glaucoma. PLoS One. 2017;12(9):e0184301. doi:10.1371/journal.pone.0184301
25. Caprioli J, Spaeth GL. Comparison of the optic nerve head in high- and low-tension glaucoma. Arch Ophthalmol. 1985;103:1145–1149. doi:10.1001/archopht.1985.01050080057020
26. Fazio P, Krupin T, Feitl ME, Werner EB, Carre DA. Optic disc topography in patients with low-tension and primary open angle glaucoma. Arch Ophthalmol. 1990;108:705–708. doi:10.1001/archopht.1990.01070070091042
27. Thonginnetra O, Greenstein VC, Chu D, Liebmann JM, Ritch R, Hood DC. Normal versus high tension glaucoma: a comparison of functional and structural defects. J Glaucoma. 2010;19(3):151–157. doi:10.1097/IJG.0b013e318193c45c
28. Rao HL, Pradhan ZS, Weinreb RN, et al. Regional comparisons of optical coherence tomography angiography vessel density in primary open-angle glaucoma. Am J Ophthalmol. 2016;171:75–83. doi:10.1016/j.ajo.2016.08.030
29. Yamamoto T, Kitazawa Y. Vascular pathogenesis of normal-tension glaucoma: a possible pathogenic factor, other than intraocular pressure, of glaucomatous optic neuropathy. Prog Retin Eye Res. 1998;17(1):127–143.
30. Jia Y, Tan O, Tokayer J, et al. Split-spectrum amplitude-decorrelation angiography with optical coherence tomography. Opt Express. 2012;20(4):4710–4725. doi:10.1364/OE.20.004710
31. Shields MB. Normal-tension glaucoma: is it different from primary open-angle glaucoma? Curr Opin Ophthalmol. 2008;19:85–88. doi:10.1097/ICU.0b013e3282f3919b
32. Drance SM. Disc hemorrhages in the glaucomas. Surv Ophthalmol. 1989;33:331–337.
33. Galassi F, Giambene B, Varriale R. Systemic vascular dysregulation and retrobulbar hemodynamics in normal-tension glaucoma. Inv Ophthalmol Vis Sci. 2011;52(7):4467–4471. doi:10.1167/iovs.10-6710
34. Buckley C, Hadoke PW, Henry E, O’Brien C. Systemic vascular endothelial cell dysfunction in normal pressure glaucoma. Br J Ophthalmol. 2002;86:227–232. doi:10.1136/bjo.86.2.227
35. Su WW, Cheng ST, HO WJ, Tsay PK, Wu SC, Chang SHL. Glaucoma is associated with peripheral vascular endothelial dysfunction. Ophthalmology. 2008;115:1173–1178. doi:10.1016/j.ophtha.2007.10.026
36. Kosior-Jarecka E, Bartosinska J, Lukasik U, et al. Results of nailfold capillaroscopy in patients with normal-tension glaucoma. Curr Eye Res. 2018;16:1–7.
37. Mroczkowska S, Ekart A, Sung V, et al. Coexistence of macro- and micro-vascular abnormalities in newly diagnosed normal tension glaucoma patients. Acta Ophthalmol. 2012;90(7):e553–e559. doi:10.1111/j.1755-3768.2012.02494.x
38. Bossuyt J, Vandekerckhove G, De Backer TL, et al. Vascular dysregulation in normal-tension glaucoma is not affected by structure and function of the microcirculation or macrocirculation at rest. Medicine (Baltimore). 2015;94(2):e425. doi:10.1097/MD.0000000000000874
39. Samsudin A, Isaacs N, Tai MLS, Ramli N, Mimiwati Z, Choo MM. Ocular perfusion pressure and ophthalmic artery flow in patients with normal tension glaucoma. BMC Ophthalmol. 2016;16:39. doi:10.1186/s12886-016-0215-3
40. Mroczkowska S, Benavente-Perez A, Negi A, Sung V, Patel SR, Gherghel D. Primary open-angle glaucoma vs normal-tension glaucoma. JAMA Ophthalmol. 2013;131(1):36–43. doi:10.1001/2013.jamaophthalmol.1
41. Xu H, Zhai R, Zong Y, et al. Comparison of retinal microvascular changes in eyes with high-tension glaucoma or normal-tension glaucoma: a quantitative optic coherence tomography angiography study. Graefes Arch Clin Exp Ophthalmol. In Press 2018;256(6):1179–1186. doi:10.1007/s00417-018-3930-z.
42. Curcio CA, Allen KA. Topography of ganglion cells in human retina. J Comp Neurol. 1990;300:5–25. doi:10.1002/cne.903000103
43. Shoji T, Zangwill LM, Akagi T, et al. Progressive macula vessel density loss in primary open-angle glaucoma: a longitudinal study. Am J Ophthalmol. 2017;182:107–117. doi:10.1016/j.ajo.2017.07.011
44. Burgoyne CF, Downs JC, Bellezza AJ, Suh J-KF, Hart RT. The optic nerve head as a biomechanical structure: a new paradigm for understanding the role of IOP-related stress and strain in the pathophysiology of glaucomatous optic nerve head damage. Prog Retin Eye Res. 2005;24(1):39–73.
45. Rao HL, Riyazuddin M, Dasari S, et al. Diagnostic abilities of the optical microangiography parameters of the 3×3 mm and 6×6 mm macular scans in glaucoma. J Glaucoma. 2018;27(6):496–503. doi:10.1097/IJG.0000000000000952
 © 2019 The Author(s). This work is published and licensed by Dove Medical Press Limited. The
full terms of this license are available at https://www.dovepress.com/terms
and incorporate the Creative Commons Attribution
- Non Commercial (unported, 3.0) License.
By accessing the work you hereby accept the Terms. Non-commercial uses of the work are permitted
without any further permission from Dove Medical Press Limited, provided the work is properly
attributed. For permission for commercial use of this work, please see paragraphs 4.2 and 5 of our Terms.
© 2019 The Author(s). This work is published and licensed by Dove Medical Press Limited. The
full terms of this license are available at https://www.dovepress.com/terms
and incorporate the Creative Commons Attribution
- Non Commercial (unported, 3.0) License.
By accessing the work you hereby accept the Terms. Non-commercial uses of the work are permitted
without any further permission from Dove Medical Press Limited, provided the work is properly
attributed. For permission for commercial use of this work, please see paragraphs 4.2 and 5 of our Terms.