")
Back to Journals » International Journal of Nanomedicine » Volume 12
Paclitaxel-loaded hyaluronan solid nanoemulsions for enhanced treatment efficacy in ovarian cancer
Received 8 October 2016
Accepted for publication 20 December 2016
Published 17 January 2017 Volume 2017:12 Pages 645—658
DOI https://doi.org/10.2147/IJN.S124158
Checked for plagiarism Yes
Review by Single anonymous peer review
Peer reviewer comments 3
Editor who approved publication: Dr Thomas Webster
Joo-Eun Kim, Young-Joon Park
College of Pharmacy, Ajou University, Suwon City, Republic of Korea
Abstract: Paclitaxel-loaded hyaluronan solid nanoemulsions (PTX-HSNs) were successfully fabricated for the delivery of PTX to improve ovarian cancer treatment via active tumor targeting. PTX-HSNs were fabricated using high-pressure homogenization with a microfluidizer and were lyophilized with D-mannitol. Hyaluronan was coated on the outside of the PTX-HSN sphere. The mean size of the PTX-HSNs was maintained less than 100 nm, with a relatively narrow size distribution. The PTX loading content was 3 mg/mL, and encapsulation efficiency (EE) was close to 100%. In vitro cell affinity studies using SK-OV-3 (cluster of differentiation 44 [CD44+]) and OVCAR-3 (CD44-) cells showed that PTX-HSN had a targeting capability hundredfold higher than that of PTX-loaded solid nanoemulsions (PTX-SNs) without hyaluronan. Further, the in vitro PTX release by PTX-SNs and PTX-HSNs lasted more than 6 days without showing a release burst, which was more sustained than that of Taxol®, suggesting a more constant effect on cancer cells at the tumor site than was observed for Taxol. The in vivo toxicity, in vivo antitumor effects, and pharmacokinetics of PTX-HSNs and Taxol were evaluated in nude mice and rats. The maximum tolerated dose (MTD) for PTX-HSNs, PTX-SNs, and Taxol was determined by measuring changes in clinical symptoms after administering 20–50 mg/kg PTX via the caudal vein. The MTD of PTX-HSNs had a dosing capacity greater than 50 mg PTX/kg, which was 2.5-fold higher than that of Taxol when administered as a PTX injection. In vivo, PTX-HSN treatment effectively inhibited tumor growth and showed less toxicity in tumor-transplanted mice compared to that observed for Taxol treatments. The pharmacokinetic parameters of PTX-HSNs were more desirable than those of Taxol. After PTX-HSN treatment, the circulation time of PTX was prolonged and retention of PTX in ovarian tumor tissues increased. Therefore, PTX-HSN is a highly effective nanosystem with a high MTD for delivering PTX to ovarian cancers characterized by CD44 overexpression, enhanced active tumor targeting, and low toxicity.
Keywords: paclitaxel, hyaluronan solid nanoemulsion, targeting, MTD, efficacy
Introduction
Paclitaxel (PTX) is an outstanding chemotherapeutic drug derived from the bark of the Pacific yew. Its mechanism of action involves interference in the normal breakdown of microtubules during cell division, thereby inducing apoptosis1 and mitotic arrest, as well as affecting fundamental cellular functions including cell motility, cell transport, and mitosis.2,3 PTX is a commonly used anticancer drug that possesses pharmacological activity when applied as a single therapeutic agent and is extensively used to treat ovarian, pancreatic, breast, non-small-cell lung, and other cancers.4 However, due to its hydrophobicity, PTX has poor water solubility (1 μg/mL), which limits its clinical application. The clinical preparation of PTX marketed as Taxol® is composed of Cremophor® EL (polyoxyethylated castor oil) and ethanol (1:1, v/v) and is diluted 10- to 20-fold in 5% dextrose solution before administration.
Unfortunately, the Cremophor EL-based formulation can have serious adverse effects, including neurotoxicity, symptoms of acute hypersensitivity, labored breathing, nephrotoxicity, and cardiotoxicity.5 Therefore, to diminish the risk of symptoms of hypersensitivity in patients treated with Taxol, pretreatment with antihistamines and corticosteroids is required.6
Taxol cannot be administered at high doses because of its low maximum tolerated dose (MTD). However, using nanocarriers with a high MTD to deliver PTX may permit the administration of Taxol at high doses for preclinical and/or clinical use as an anticancer agent.7
For these reasons, new formulations such as liposomes, nanoparticles, lipid nanoparticles, and polymeric micelles have been investigated to enhance the targeted delivery of PTX;6,8–10 however, most of the formulations have not been used clinically. Among these, Abraxane® is a successful commercial formulation.11 It is a solvent-free formulation of albumin protein-bound PTX nanoparticles that has been approved by the US Food and Drug Administration (FDA) to treat metastatic breast cancer, lung cancer, and pancreatic cancer.
Abraxane is more effective than Taxol as it can be administered at high doses because of its high MTD. However, the high cost of Abraxane and the life-threatening toxicity caused by its metabolism limit its applicability in cancer chemotherapy treatments. Abraxane is a nonactive targeted delivery system that accumulates in tumors via an enhanced permeability and retention (EPR) effect.8,12 Drugs lacking active cancer-targeting capacities often cause serious side effects and have low antitumor efficacy. Therefore, not only passive but also active tumor-targeting delivery systems for PTX-based chemotherapeutics are urgently needed. Currently, targeted drug delivery is widely exploited to enhance the therapeutic efficacy and to diminish the serious adverse effects of anticancer drugs.13
To enable drug delivery via active targeting of tumor receptors, various targeting molecules are used to deliver PTX to the cancer cells, including hyaluronan/hyaluronic acid (HA), L-biotin, folic acid, lipoprotein, and cholesterol.4,9,13–19 Among these, HA is widely investigated because of its unique properties. Cluster of differentiation 44 (CD44) is a cell surface glycoprotein that is not expressed in normal cells and is overexpressed in tumors; therefore, it can function as a tumor marker. The CD44–HA ligand–receptor pair is well known for its active tumor-targeting efficacy in cancer therapy.14,20–23 The targeting delivery systems such as nanoparticles, polymeric micelles, liposomes, emulsions, and nanogels with HA provide several advantages as drug carriers in both active and passive targeting of tumor receptors for drug delivery.8,10,24,25 However, there are still several limitations, including low tumor-targeting efficacy, low bioavailability, undesirable tissue distribution, low drug loading dose, the need for relatively large injection volumes, low antitumor efficacy, unpredictable toxicity, and an initial drug release burst.
Therefore, we previously developed a PTX-loaded nanoemulsion carrier with a high solubilizing capacity for poorly soluble drugs and an excellent HA-based cell-targeting capacity.26
We investigated the use of HA-coated solid nanoemulsions (HSNs) as a drug carrier system because of its high tumor-targeting efficacy, low toxicity, high biocompatibility, favorable pharmacokinetic profile, and efficient loading rate of PTX as a hydrophobic drug. In this study, we investigated the physicochemical properties of PTX-loaded HA solid nanoemulsions (PTX-HSNs) and evaluated the cellular affinity of PTX-HSNs in CD44-overexpressing SK-OV-3 and CD44-deficient OVCAR-3 cells, in addition to assessing the MTD of PTX in vivo. The in vivo antitumor efficacy and pharmacokinetic properties of PTX were assessed in a nude mouse model of ovarian cancer.
Materials and methods
Materials
PTX was bought from Dabur Pharmaceuticals Company (Mumbai, Maharashtra, India). DL-α-Tocopheryl acetate was purchased from DSM Sinochem Pharmaceuticals (Shanghai, People’s Republic of China). Polysorbate 80 was purchased from Seppic Pharmaceutical Co, Ltd (Puteaux, Paris, France). Ferric chloride (FeCl3), chloromethylbenzoyl chloride, and tetra-n-butyl ammonium hydroxide (TBA) were bought from Sigma Aldrich Co (St Louis, MO, USA). Injectable soybean oil was provided by Croda Health Care (Snaith, UK). HA was purchased from Bioiberica Co, Ltd (Barcelona, Spain). Sodium salicylic acid was purchased from Duksan Chemical Industry (Gyeonggi, Korea). D-Mannitol was purchased from Dr Paul Lohmann Co, Ltd (Emmerthal, Germany). Anti-human/mouse CD44 fluorescein isothiocyanate (FITC) was bought from e-Bioscience (San Diego, CA, USA). sCD44 (human) ELISA kit (ALX-850-053-Kl01) was bought from Enzo Life Sciences Inc (Farmingdale, NY, USA).
The CD44-positive human ovarian cancer cell line SK-OV-3(CD44+), ATCC® HTB-77™, was acquired from the American Type Culture Collection (ATCC, Rockville, MD, USA), and the CD44-negative human ovarian cancer cell line OVCAR-3(CD44–) was acquired from KCLB-00000287 of the Korean Cell Library Bank (Seoul, Korea).
Cell culture medium (RPMI 1640 and Waymouth), penicillin, streptomycin, N-2-hydroxyethylpiperazine-N-2-ethanesulfonic acid (HEPES) buffer solution, and heat-inactivated fetal bovine serum (FBS) were purchased from Gibco Life Technologies, Inc (Waltham, MA, USA). All other chemicals were of reagent grade and were obtained commercially.
Preparation of PTX-HSNs
PTX-HSNs, composed of an oil phase, surfactant, water phase, HA with a molecular weight of 500 kDa as a targeting molecule, and PTX as a water-insoluble drug, were fabricated using a high-pressure homogenization method by using a microfluidizer.27 HA was coated on the surface of the SNs by a chelating covalent bonding attraction. Initially, 30 mg PTX and 2 mg FeCl3 were dissolved in 10 mL ethanol. Subsequently, 10 mL ethanol containing 30 mg PTX and 2 mg FeCl3 was dissolved in a mixture of 7.2 g DL-α-tocopheryl acetate, 0.8 g soybean oil, and 8.0 g Polysorbate 80 at 25°C. The ethanol was subsequently evaporated using a vacuum rotary evaporator, and a mixture solution with FeCl3 in the oil phase was formed in a 200 mL round-bottomed flask. Second, 252 mg of HA dissolved in 84 mL water was added to the formed oil phase by injection under gentle magnetic stirring for 30 min. This two-phase mixture was then slowly added to a microfluidizer chamber, and the emulsions were further homogenized seven times using a high-pressure homogenizer (M-110S, Microfluidizer; Microfluidics, Newton, MA, USA) at 15,000 psi and cooled to less than 20°C. Finally, 5 g of D-mannitol was added to the freshly prepared PTX-HSNs as a cryoprotectant, and the resultant mixture was lyophilized using a freeze-drier (Genesis 25XL, VirTis freeze dryer™; SP Scientific, Warminster, PA, USA).
PTX-SNs were prepared in a manner similar to that of PTX-HSNs without the addition of HA. HSNs were fabricated using the same method described for PTX-HSNs without the addition of PTX.
Characterization of PTX-loaded HSNs
Particle characterization
The particle characteristics (zeta potential, polydispersity, and size) of the PTX-HSNs were measured by dynamic light scattering (DLS) at 25°C using a laser scattering particle analyzer (Malvern Zetasizer NanoZS™; Malvern Instruments Ltd, Malvern, UK). Individually weighed 1.6 g lyophilized samples (HSN, PTX-SN, and PTX-HSN) were reconstituted with 8.4 mL water for injection before measurement recording. The reconstituted solutions were diluted 10-fold with double-distilled water, and all samples were promptly assessed thrice at 25°C.
Morphology
Lyophilized PTX-HSN sample was reconstituted with water before injection as described previously. The morphology of the sample was visualized using a cryo-transmission electron microscope (cryo-TEM; FEI Tecnai G2F20, Eindhoven, the Netherlands).26,28 Approximately 5–10 μL of sample solution was deposited on the copper grid and covered with a porous carbon thin film. The sample drop was blotted with a filter paper to form a thin liquid film (<300 nm) and was then frozen quickly in liquid ethane at temperatures less than −184°C. The resultant thin films of sample solution bridged on the copper grid were immediately visualized using cryo-TEM.
Drug content of PTX-loaded HSNs
HPLC analysis
PTX was assayed using a high-performance liquid chromatography (HPLC) system equipped with a separation module and a UV detector (Agilent 1200 series, Santa Clara, CA, USA).8,9 A pentafluorophenyl silica column (250×4.6 mm, 5 μm; Phenomenex, Torrance, CA, USA) was used for analysis, with column temperature maintained at 30°C±5°C. The mobile phase, consisting of water and acetonitrile (55:45 v/v), was filtered through a 0.22 μm membrane and was degassed via an online degasser. The diluent solution was prepared by mixing 1,000 mL methanol with acetic acid (glacial, 200 μL). The injection volume was 20 μL, the flow rate was approximately 1.2 mL/min, and the PTX wavelength was set at 227 nm. After accurately weighing 6 mg of PTX, assay preparations were made by dissolving in and diluting with diluent solutions in a concentration range of 1–60 μg/mL. The calibration graph was rectilinear, with a correlation coefficient of 0.999. The standard deviation (SD) of accuracy and precision was not more than 3%.
Drug loading efficiency (LE) and encapsulation efficiency (EE)
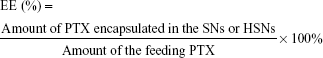
To evaluate the drug EE and LE,29 2 mL of the PTX-SNs and PTX-HSNs was filtered through a 0.22 μm membrane (Acro Disk 50 Vent Devices with Emflon Membrane® II; Pall Co, Port Washington, NY, USA) to remove any PTX that was not entrapped and that could precipitate in the water phase. One milliliter of filtrate was centrifuged at 60,000× g for 1 h with a Beckman TL 100 Ultracentrifuge (Beckman Coulter, Fullerton, CA, USA) to obtain the PTX entrapped in SN and/or HSN. The centrifuged precipitant was dissolved in 1 mL acetonitrile. The drug content encapsulated in the PTX-SNs and PTX-HSNs was measured using the HPLC analytical method described earlier.8,9
The amount of PTX entrapped in the SNs or HSNs was calculated as follows:
|
|
In vitro cell affinity studies
CD44 is highly expressed on the surface of SK-OV-3 cells, but is lowly expressed on that of OVCAR-3 cells. To determine the specific affinity of the PTX-SNs and PTX-HSNs to CD44,9 SK-OV-3 and OVCAR-3 cells were cultured in RPMI 1640 medium containing 10% (v/v) FBS, 100 U/mL penicillin, and 0.1 mg/mL streptomycin under a 5% CO2 humidified atmosphere at 37°C. To determine the binding affinity using a fluorescent method, FITC was encapsulated in SNs and HSNs. Specifically, FITC-labeled SNs and HSNs were obtained by dissolving 0.2 mg of FITC instead of PTX during the preparation of SNs and HSNs. Nonlabeled fluorescent material was removed with a dialysis membrane (molecular weight cut-off [MWCO]: 2,000 Da; Pierce, Waltham, MA, USA). FITC-labeled SNs and HSNs (20 μg/mL) were added to 1×10⁶ cells from each cell line and the cells were incubated at 37°C for 4 h. The cells were subsequently washed twice with phosphate-buffered saline (PBS), treated with 0.1% trypsin for approximately 1 min, washed three times with PBS containing 0.2% FBS and 0.02% NaN3, followed by fixation with 400 μL of 4% paraformaldehyde for 10 min. To determine the affinity for CD44, the ovarian cancer cells treated with FITC-labeled SNs or HSNs were analyzed for cell-associated fluorescence at excitation and emission wavelengths of λ =488 nm and 520 nm, respectively, using a FACSCalibur system™ (Becton Dickinson, San Diego, CA, USA).
In vitro release studies
The 6-day in vitro release studies of PTX-SNs, PTX-HSNs, and Taxol were evaluated using a previously described dialysis method.8–10 Briefly, dialysis membranes (MWCO 12,000–14,000 Da; Spectra/Por, Rancho Dominguez, CA, USA) were stabilized by immersion in the release medium (1 M sodium salicylate and 0.1% Polysorbate 80 in PBS, pH 7.4) for approximately 30 min before use. Subsequently, 1 mL of each of the reconstituted PTX-SNs and PTX-HSNs (3 mg/mL) was added to the dialysis tubing attached to a support, and the release of PTX was determined according to Apparatus 2 of the Unites States Pharmacopeia (USP) dissolution method (paddle method). The release test was performed with 900 mL of the release medium at 100 rpm and 37°C; 1 mL of the released sample was collected at each time point (1, 3, 6, 12, 24, 36, 48, 72, 96, 120, and 144 h). The content of PTX in each sample was measured using the HPLC method described. The release medium was continuously replenished to maintain its volume at 900 mL. To compare the release patterns of Taxol and PTX-HSN, 3 mg/mL Taxol was placed in the dialysis tubing and the release of PTX was measured using the same method as described for the PTX-HSN release measurements.
In vivo toxicity studies
To evaluate the in vivo toxicity of the SNs and HSNs, we confirmed changes in the body weight of nude mice according to the amount of drug administered for 15 days.7 We selected only healthy mice deemed suitable for repeat dose in vivo toxicity testing by breeding for adaptation. Only healthy, 5- to 7-week-old female BALB/cAnNCrjBgi-nu/nu nude mice weighing 18–22 g were selected. All animal experiments were conducted with the approval of the Association for Assessment and Accreditation of Laboratory Animal Care (AAALAC) International (tested at Medicilon/MPI Preclinical Research, Shanghai, People’s Republic of China). The selected nude mice were placed in the breeding mouse cages using a step-by-step (continuous random sorting) sequential randomization method, five mice per cage. Test substances for toxicity were evaluated against saline, Taxol, PTX-SNs, and PTX-HSNs. The PTX-SNs, PTX-HSNs, and Taxol were administered (20–50 mg/kg) to the experimental animals via the caudal vein using a sterilized disposable syringe. Test vials of Taxol, PTX-SNs, and PTX-HSNs were shaken immediately before administration as a bolus injection.
The body weight of each mouse was recorded on the first day and then once each day for 15 days. The mentioned test substances were administered at a repeated dose three times every 3 days. Then, 10% of weight change was determined to be part of significant clinical symptoms. Twenty percent of weight change was determined to be attributable to lethal clinical signs.7
The mortality rate of the treated nude mice was also monitored. Clinical signs were intermittently monitored until 4 h after the agent was administered and then once daily until the end of the study. At the end of the observation period, the surviving nude mice were sacrificed for autopsy, and the safety of the test substances was evaluated.30,31
Antitumor efficacy
The in vivo active and passive tumor-targeting efficacy of the PTX-SNs and PTX-HSNs was assessed using CD44-overexpressing SK-OV-3 human ovarian cancer cells.7 The cell lines were cultured under a 5% CO2 atmosphere at 37°C with RPMI 1640 medium containing 10% (v/v) FBS, 100 U/mL penicillin, and 0.1 mg/mL streptomycin. For transplantation into nude mice, a minimum of 7×10⁸ SK-OV-3 cells were required. The RPMI 1640 medium was supplemented with 0.1 mM nonessential amino acids, 1 mM sodium pyruvate, 1.5 g/L sodium bicarbonate, 100 U/mL penicillin, and 0.1 mg/mL streptomycin, and this was subsequently filtered and stored at 4°C. The medium was warmed to 37°C before use.
The SK-OV-3 and OVCAR-3 cells were treated with a trypsin/ethylenediaminetetraacetic acid (EDTA) solution and were subsequently isolated from the 225 cm2 culture flask; 1×10⁷ cells were dispersed in 0.3 mL of RPMI 1640 medium. To transplant the cancer cells into the nude mice, 0.3 mL of the respective cell suspensions was subcutaneously injected into the flank of each mouse using a 1 mL, 23 gauge syringe. Within 7 days of injection, a tumor could be observed in the left or right flank of the mouse. When the tumor grew to a size of approximately 100 mm3 or more, the nude mice were divided into six groups (G1–G6, n=7 per group) of similar average tumor size. The groups were treated as follows: Group 1 (G1) physiological saline (control) group, Group 2 (G2) Taxol group (positive control, 20 mg/kg), Group 3 (G3) PTX-SN group (20 mg/kg), Group 4 (G4) PTX-HSN group (20 mg/kg), Group 5 (G5) PTX-SN group (50 mg/kg), and Group 6 (G6) PTX-HSN group (50 mg/kg). The drugs were administered via the caudal vein. In the G2–G4 groups, the dose of PTX was equal to 20 mg/kg; in the G5–G6 groups, this was equal to 50 mg/kg. In the G1 group, only hypertonic saline was administered to monitor growth of untreated cancer cells.7 The formulations were administered three times via the caudal vein at 3-day intervals for 6 days. The initial day of administration was designated Day 0. The total observation period was 8–9 weeks. In general, the tail vein cannot be used for multiple injections owing to the damage induced by chemotherapeutics. To avoid tail vein damage during the three administrations, the formulations were administered first from the tip of the tail; we then gradually moved upward until the point where the tail vein enters the mouse body. Proper and accurate intravenous administration also limited necrosis and tissue damage, which were observed when PTX was administered to the extravascular tissue surrounding the tail vein during injection.
To evaluate the anticancer activity of each treatment, changes in tumor size were determined in the treated mice two to three times per week at intervals of approximately 3 days from the time point at which cancer cell growth was first identified. Tumors were measured with vernier calipers and their size was calculated from the length and width according to the following formula:8,32
|
where width was the shortest and length the longest diameter.
Body weight changes in mice were measured using a precision electronic balance once or twice per week, at 3- to 4-day intervals, for 8–9 weeks.8 The experiment was terminated after approximately 8–9 weeks at the discretion of the investigator. The mice were sacrificed, and the tumor, liver, lungs, and kidneys were collected and weighed using a precision electronic balance.8 All experiments were performed at least five times; data are expressed as mean values ± SD values.
The protocols for the animal studies were also approved by the Institute of Laboratory Animal Resources of Yuhan Corporation.
In vivo pharmacokinetic study
The in vivo pharmacokinetics of PTX was determined in male Sprague Dawley rats8–10 (7–8 weeks old and weighing 200–230 g) at Medicilon/MPI Preclinical Research (Shanghai, People’s Republic of China). All in vivo experiments were conducted with the approval of the Association for Assessment and Accreditation of Laboratory Animal Care (AAALAC) International (tested at Medicilon/MPI Preclinical Research). All animal care practices and experimental procedures were conducted according to the Guiding Principles in the Use of Animals in Toxicology, as adopted in 1989, revised in 1999, and amended in 2008 by the Society of Toxicology. The rats were maintained in a clean room (Medicilon/MPI Preclinical Research) at 20°C–23°C and a relative humidity of 50%±5%. Drugs were administered and blood samples were collected according to reported methods, with slight modifications.8–10 Briefly, the femoral artery and vein of the rats were cannulated using a polyethylene tube (PE-50; Becton Dickinson) under anesthesia. The PTX-SNs, PTX-HSNs, and Taxol (10 mg/kg dose) were injected into the femoral vein over 30 s. After drug administration, blood was collected at fixed time points (0.083, 0.25, 0.5, 1, 1.5, 2, 3, 5, 7, and 11 h) and stored until use.9 Blood samples (300 μL) were gathered via the femoral artery. Heparinized sodium chloride (0.9%) solution (20 U/mL heparin) was injected into the cannula immediately after collection of each blood sample. After separation of the blood samples by a centrifugation method, plasma (150 μL) was collected and stored at −70°C until analysis. PTX in the plasma was analyzed using the HPLC method described.
Pharmacokinetic parameters, including total area under the plasma concentration–time curve from time zero to time infinity (AUC), half-life (t½), total body clearance (CL), apparent volume of distribution at steady state (Vss), and mean residence time (MRT) were calculated using the WinNonlin software (Pharsight Co, Cary, NC, USA).10
Tissue distribution
Nude mice (18–22 g) with a tumor size of ~200 mm3 on Day 13–15 after tumor administration were split into three groups: 1) PTX-SN group, 2) PTX-HSN group, and 3) Taxol group. The mice in each group received 10 mg/kg of the respective drug via intravenous injection in the tail vein. After administration, blood was collected at fixed time points (2, 4, and 24 h; n=3 at time point) and was stored until analysis.8,9,32
The experiment was terminated when the tumor volume reached approximately 1,000 mm3 or 4 weeks after administering the test drug at the discretion of the investigator. The mice were sacrificed, and the blood, tumor, liver, lungs, and kidneys were collected/dissected and kept refrigerated until analysis. To measure the content of PTX in tissue, the weight of all tissues was measured, and the tissues were subsequently homogenized in saline solution. Subsequently, PTX was dissolved in methanol and acetonitrile (50:50, v/v) and was centrifuged at 15,000 rpm for 15 min. The supernatant was collected, and the content of PTX in the supernatant was measured using the HPLC method.
All experiments were performed at least three times, and the data were expressed as the mean values ± SD. Analysis of variance (ANOVA) was used for statistical analysis.
Results and discussion
Preparation and characterization of PTX-loaded HSN
The structure and morphology of the PTX-HSNs visualized using Cryo-TEM are shown in Figure 1. As shown in Table 1, the mean diameter of the HSNs, PTX-SNs, and PTX-HSNs as determined by DLS was 79.1±3.99, 57.3±8.43, and 80.3±4.81 nm, respectively. The polydispersity index of the HSNs, PTX-SNs, and PTX-HSNs was 0.18±0.02, 0.22±0.04, and 0.20±0.03, respectively, with a narrow size distribution. The mean particle size of the PTX-HSNs was much larger than that of the PTX-SNs (P<0.05) due to the presence of HA on the surface of the PTX-HSNs. The PTX-HSNs were larger by 10–15 nm compared with the particle size of the PTX-SNs.
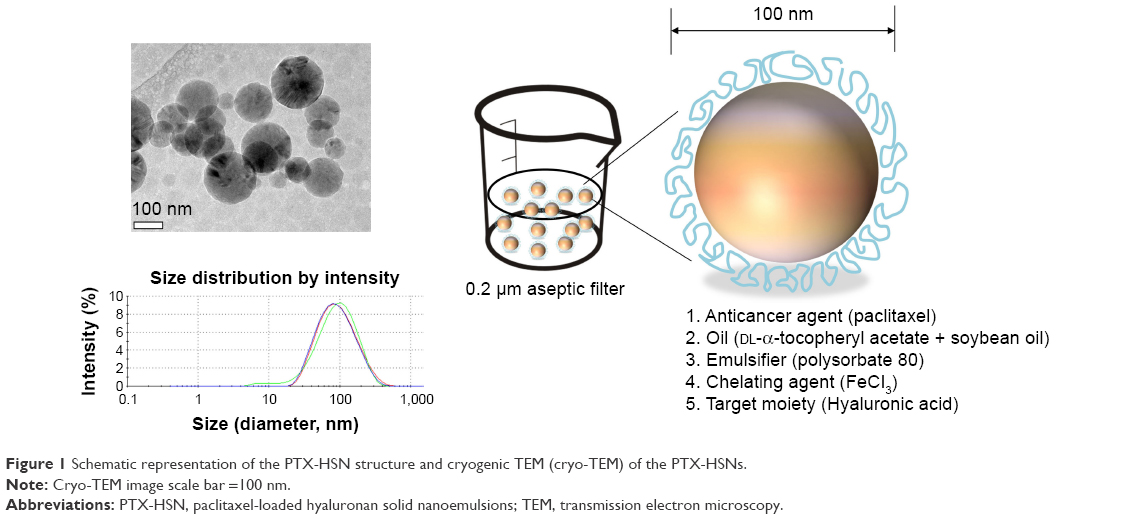 | Figure 1 Schematic representation of the PTX-HSN structure and cryogenic TEM (cryo-TEM) of the PTX-HSNs. |
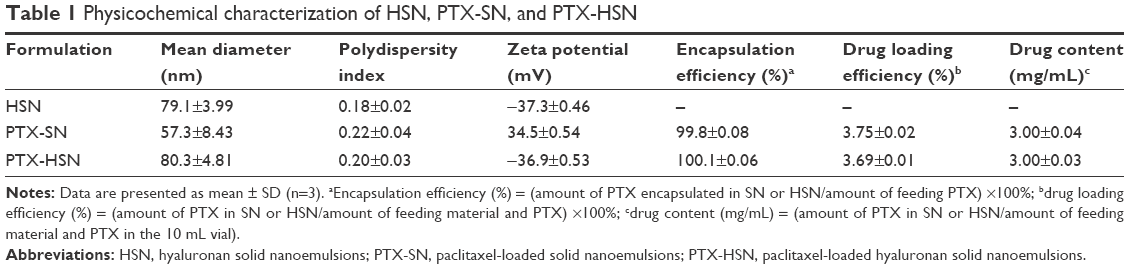 | Table 1 Physicochemical characterization of HSN, PTX-SN, and PTX-HSN |
It is known that particle size alters the pharmacokinetics by affecting tissue distribution and excretion; nanocarriers with a small particle size (<200 nm) show increased drug accumulation in tumor cells because of the EPR effect.33,34 Given that in our study the size of the PTX-SNs and PTX-HSNs was maintained at <100 nm, drug accumulation in tumor cells was expected to be relatively high.
Both the PTX-SNs and HSNs were spherical, although the latter were coated with an HA ring (Figure 1). These data suggested that the inside core of the HSNs contained the nanoemulsions and that the outside was coated with HA in the μ-oxoform covalently bound to ferric chloride in the oil phase,35 which played an important role in the active targeting of cancer cells.23
The zeta potential of the HSNs, PTX-SNs, and PTX-HSNs was −37.3±0.46, 34.5±0.54, and −36.9±0.53 mV, respectively. Although the PTX-SNs had a positive zeta potential value of approximately 34.5 mV, the HSNs and PTX-HSNs were negatively charged, explaining why their surface was coated with HA. In addition, the HSNs and PTX-HSNs had very similar zeta potentials of approximately −36 to −37 mV.
Overall, the zeta potential, particle characteristics, and morphology of the PTX-SNs were very different from those of the HSNs and PTX-HSNs. However, the particle characteristics (size, surface charge, and polydispersity index) of the PTX-HSNs and HSNs were very similar.
Drug content of the PTX-HSNs
As shown in Table 1, the EE and LE of the PTX-SNs (n=3) were 99.8%±0.08% and 3.75%±0.02%, respectively; those of the PTX-HSNs were 100.1%±0.06% and 3.69%±0.01%, respectively, with satisfactory reproducibility. The EE was >99.5%, independent of the PTX content (3.0 mg/mL) for all of the batches of the PTX-SNs and PTX-HSNs tested. These data suggested that PTX was perfectly encapsulated in the oil phase of the SNs.27 Because of the addition of HA, the LE of the PTX-HSNs was slightly different from that of the PTX-SNs; however, this difference was not significant (P>0.05).
During preliminary studies, we determined that the drug content in the PTX-SNs and PTX-HSNs was >6 mg/mL; however, to maintain stability over time, we used <3 mg/mL of PTX for these studies.
In vitro cell affinity studies
To measure the in vitro cell affinity of the PTX-SNs and PTX-HSNs, we used the two human ovarian SK-OV-3(CD44+) and OVCAR-2(CD44−) cell lines.7,36 First, we quantitatively assessed the CD44 expression ratio in CD44-overexpressing SK-OV-3 human ovarian cancer cells and CD44-negative OVCAR-3 human ovarian cancer cells using an sCD44 (human) ELISA kit (Enzo Life Sciences, Farmingdale, NY, USA; ALX-850-053-Kl01). CD44 expression quantity in SK-OV-3 cells was 383.45 ng/mg protein in the cell lysate and 1.79 ng/mg protein in the culture media. CD44 expression quantity in OVCAR-3 cells was 119.57 ng/mg protein in the cell lysate and 0.51 ng/mg protein in the culture media, respectively. The SK-OV-3/OVCAR-3 cell line CD44 expression ratio was 3.2-fold in the cell lysate and 3.5-fold in the culture media, confirming that SK-OV-3 cells expressed 3.2- to 3.5-fold more CD44 than did OVCAR-3 cells. Figure 2 shows the results of the in vitro cell affinity assay of the PTX-SNs and PTX-HSNs for CD44, which was performed to assess the cell-targeting capability of these nanoemulsions toward ovarian cancer cells, which generally overexpress CD44.9
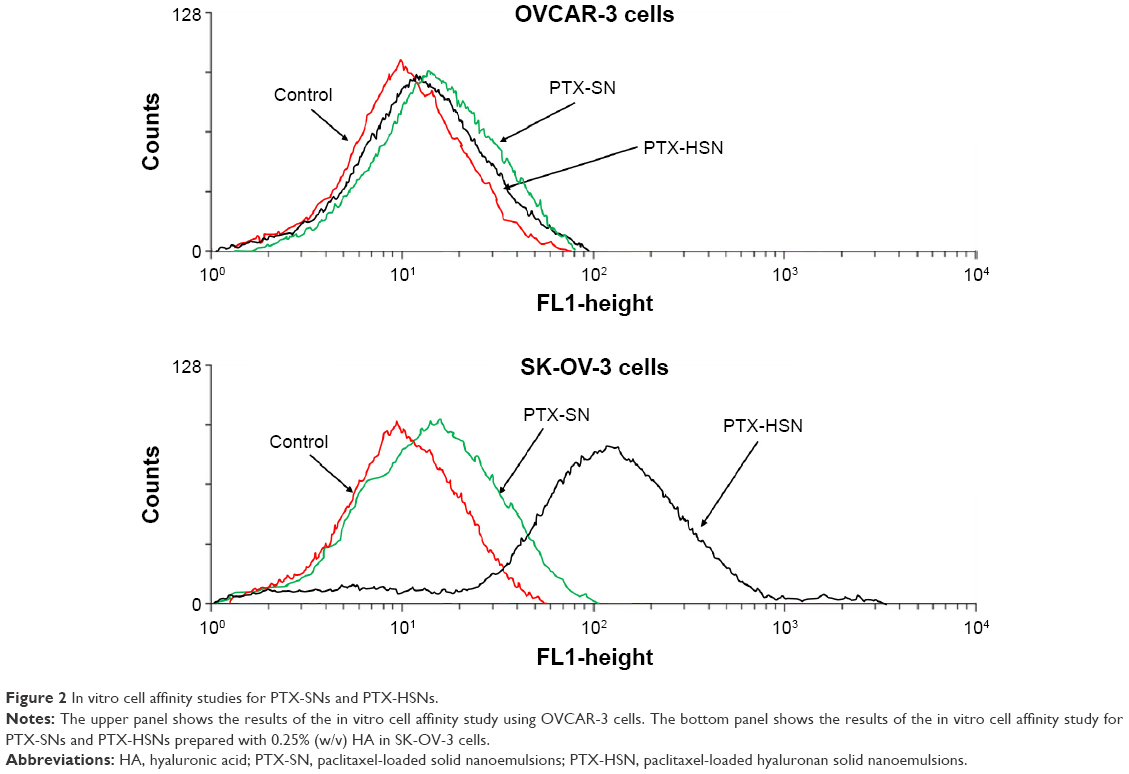 | Figure 2 In vitro cell affinity studies for PTX-SNs and PTX-HSNs. |
The results of the in vitro cell affinity studies of the PTX-SNs and PTX-HSNs prepared with 0.25% (w/v) HA for CD44 using OVCAR-3(CD44−) cells are shown in Figure 2. HA (Figure 2, upper panel) did not bind specifically to CD44 in all of the samples tested. The in vitro cell affinity test of the PTX-SNs and PTX-HSNs using SK-OV-3(CD44+) cells showed that the PTX-SNs without HA had little specific binding to CD44 present on the surface of the cells. In contrast, the PTX-HSNs prepared with 0.25% (w/v) HA showed substantial specific binding to SK-OV-3(CD44+) cells (Figure 2, bottom panel).
PTX-HSNs had a targeting capability hundredfold higher than that of PTX-SNs without HA. Therefore, the PTX-HSNs with HA coated on the surface of the solid nanoemulsions might comprise an excellent drug delivery system for active tumor targeting.26,32
As shown in Figure 2, the results from solid nanoemulsion with HA are consistent with fluorescence-activated cell sorting (FACS) data, which suggests that HA facilitates nanoemulsion attachment to CD44-overexpressing cells.
These results are in agreement with the FACS data, demonstrating that the cell affinity of the PTX-HSNs should result in sufficient cell binding and uptake via the overexpressed CD44 in ovarian cancer cells.9
In vitro release studies
Figure 3 shows the 6-day in vitro release patterns of PTX-SNs, PTX-HSNs, and Taxol in PBS as measured using the same dialysis method described earlier.8–10 The Taxol injection released >80% of PTX within 3 days, whereas the PTX-HSNs released <50% after 3 days and approximately 60% after 6 days. The PTX-SNs and PTX-HSNs showed a sustained-released pattern in which the PTX was continuously released from the oil phase, showing significantly different release characteristics than those of the Taxol injection. Further, the release pattern of the PTX-HSNs was more sustained than that of the PTX-SNs. These data indicated that the in vitro release of PTX was affected not only by the oil phase present in the PTX-SNs, but also by the HA present in the PTX-HSNs. We assume that the PTX-HSNs may circulate and be retained in the cancer cells for an extended period following administration. Considering the time required for the formulations to reach the cancer cells after administration in the body, a sustained release of the drug would be more advantageous than a rapid-releasing formulation as this is therapeutically more beneficial.10 Therefore, PTX-HSNs may be more efficient in delivering drugs via targeted drug release than is observed for Taxol.
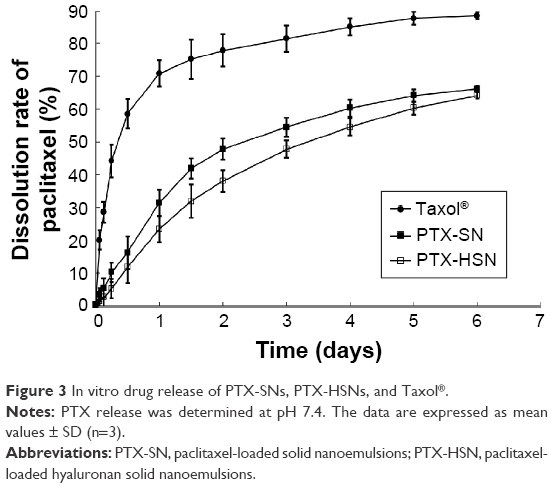 | Figure 3 In vitro drug release of PTX-SNs, PTX-HSNs, and Taxol®. |
In vivo toxicity studies
To determine the in vivo toxicity related to the MTD, the PTX-HSNs and Taxol (20–50 mg/kg) were administered to nude mice via the caudal vein.7 Time-elapsed changes in tumor size were comparatively evaluated for each test group; the results are represented in Figure 4. Symptoms of toxicity included variations in body weight and mortality rate. For the group treated with Taxol, the clinical symptoms included dyspnea, lethargy, and ataxia; however, no negative clinical symptoms were observed in the group treated with the PTX-HSNs.
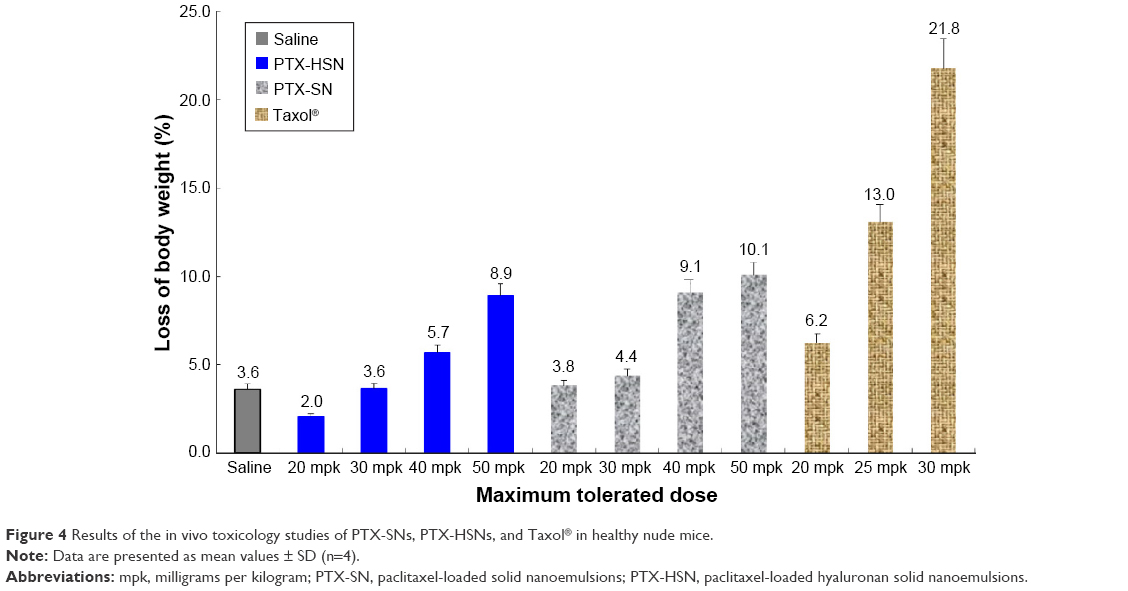 | Figure 4 Results of the in vivo toxicology studies of PTX-SNs, PTX-HSNs, and Taxol® in healthy nude mice. |
As shown in Figure 4, rapid weight loss (approximately 20%) and serious toxicity were observed for the nude mice receiving three repeated doses of 30 mg/kg Taxol.7 Among the tested animals, three mice died during or after Taxol administration. In addition, in the group receiving Taxol, symptoms such as dyspnea, lethargy, and ataxia were observed regardless of the PTX dose. In contrast, slight changes in body weight were observed for the mice in the groups receiving three repeated doses of PTX-SNs and PTX-HSNs (20–50 mg/kg PTX). Therefore, the latter two drug formulations were deemed safer than Taxol.
We observed that 50 mg/kg PTX-HSNs resulted in body weight changes of ≤10%, whereas 50 mg/kg PTX-SNs resulted in body weight changes of ≥10%. In addition, 10% of the weight change caused in the group treated with 50 mg/kg PTX-HSNs did not appear to result in significant clinical signs until the end of the study. However, the group treated with 50 mg/kg PTX-SNs showed significant clinical signs such as dyspnea and ataxia 7 days after administration and until the end of the study. The differences in body weight between mice treated with PTX-SNs and PTX-HSNs were not significant, but the clinical signs and the number of deaths were significantly different. In the case of PTX-SNs, when the in vivo toxicity study was terminated, two premature deaths were noted. In contrast, no deaths were noted in mice treated with PTX-HSNs. Thus, mortality was judged as a significant clinical symptom. Therefore, the PTX-HSNs are relatively safer than the PTX-SNs.
These results suggest that the MTD of the PTX-HSNs is at least ≥50 mg/kg in nude mice. Further, no deaths or specific pathophysiological signs were observed in the groups treated with the PTX-HSNs. On the basis of these data, we predict that the in vivo MTD for Taxol is <30 mg/kg, whereas that of the PTX-HSNs is >50 mg/kg.
Probably, PTX-HSNs show nontoxic and cell-protecting ability because HA almost coated the surface of PTX-HSNs. Therefore, it can be seen that the PTX-HSNs with HA coated on the surface are a safe drug delivery system for active and passive drug targeting.
Antitumor efficacy
We evaluated the in vivo antitumor efficacy by measuring the tumor volume and body weight of nude mice treated with a bolus dose of saline, Taxol, PTX-SNs, or PTX-HSNs at a dose of 20–50 mg/kg in a CD44-overexpressing SK-OV-3 xenograft tumor for 8–9 weeks.7–10 According to the tumor size, the PTX-HSNs had a strong antitumor effect (Figure 5A). Suppression of cancer cell growth was higher in the PTX-SN and PTX-HSN groups than in the Taxol group.
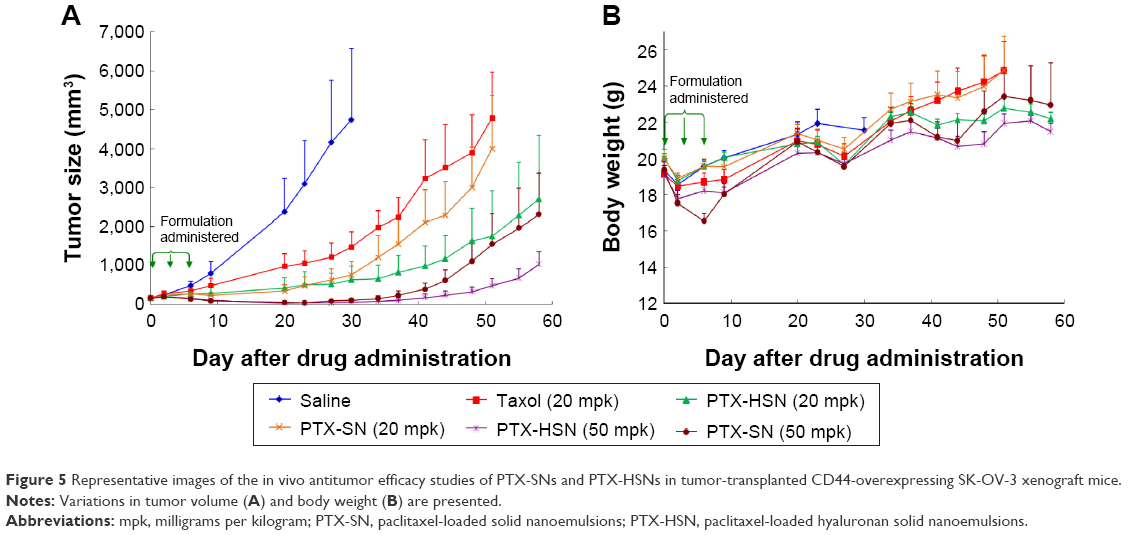 | Figure 5 Representative images of the in vivo antitumor efficacy studies of PTX-SNs and PTX-HSNs in tumor-transplanted CD44-overexpressing SK-OV-3 xenograft mice. |
The PTX-HSNs administered at 20 mg/kg reduced cancer cell growth more efficaciously than did the PTX-SNs administered at 20 mg/kg; cancer cell growth in mice treated with the PTX-SNs (20 mg/kg) was similar to that of tumors treated with Taxol (20 mg/kg).
PTX-HSNs administered at 50 mg/kg reduced cancer cell growth more efficiently than did the PTX-SNs administered at 50 mg/kg after approximately 40 days. The tumors treated with 20 mg/kg PTX-HSNs were similar in size to those treated with 50 mg/kg PTX-SNs.
As shown in Figure 5B, the change in mouse body weight was very similar in all groups, except on Day 7 after formulation administration. There were no significant changes in body weight between mice treated with saline, 20 mg/kg Taxol, 20 mg/kg PTX-HSNs, and 20 mg/kg PTX-SNs. These data could neither confirm any toxicity nor clarify whether the formulations caused serious side effects. However, at 50 days after drug administration, mouse body weight change in the Taxol- and 20 mg/kg PTX-SN–treated groups was greater than 20%, implying that tumor growth had toxic effects. In addition, the mice treated with Taxol and 20 mg/kg PTX-SNs showed obvious body weight growth compared with the mice treated with 20–50 mg/kg PTX-HSNs, indicating that Taxol and PTX-SNs were toxic and resulted in severe adverse effects.
In vivo pharmacokinetic study
The in vivo pharmacokinetic properties of PTX after a bolus administration in rats were evaluated.8–10 The PTX concentrations as assessed using the plasma–time profiles of Taxol, the PTX-SNs, and the PTX-HSNs are presented in Table 2 and Figure 6. The dose of PTX was 10 mg/kg. After a bolus injection of the respective drug formulation to rats, the CL value decreased to 643.8±59.6 mL/h/kg (PTX-HSNs) and 754.6±64.3 mL/h/kg (PTX-SNs), whereas that of Taxol was 2,132.3±370.2 mL/h/kg. The decrease in the in vivo CL correlated with significantly higher AUC values for PTX-SNs (13,563.6±1,231.4 ng·h/mL) and PTX-HSNs (15,784.2±2,055.4 ng·h/mL; P<0.05) than those of Taxol (4,761.6±826.7 ng·h/mL). The AUC values of PTX-HSNs and PTX-SNs were about three times higher than that of Taxol, which indicates that the PTX-HSNs have longer blood vessel retention and circulation times than Taxol.
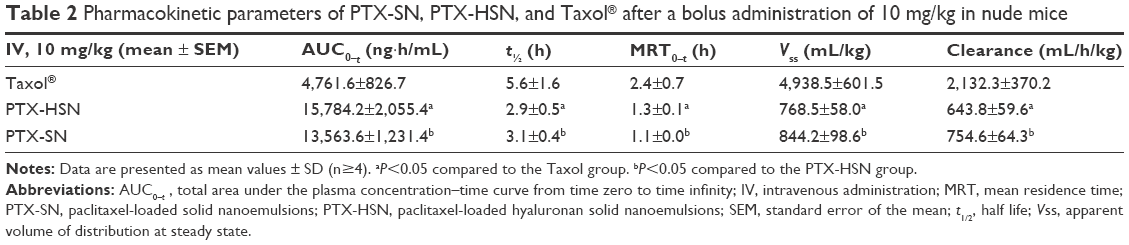 | Table 2 Pharmacokinetic parameters of PTX-SN, PTX-HSN, and Taxol® after a bolus administration of 10 mg/kg in nude mice |
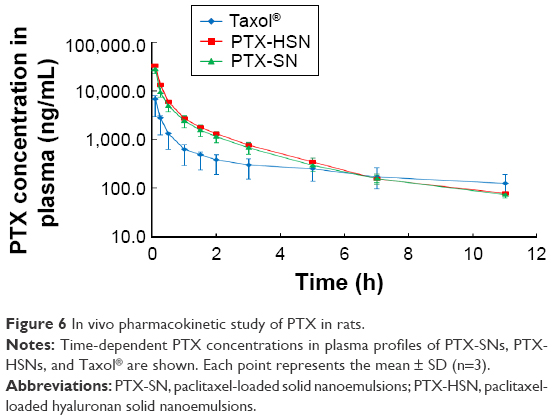 | Figure 6 In vivo pharmacokinetic study of PTX in rats. |
As shown in Table 2, the terminal t½ and MRT of the PTX-SNs and PTX-HSNs were significantly lower than those of Taxol (P<0.05). The Vss values of the PTX-SNs and PTX-HSNs were also significantly lower than those of Taxol (P<0.05). As the Vss value of PTX-HSN was about six times lower than that of Taxol, PTX-HSNs may present a narrower tissue distribution profile than that of Taxol.
Significant differences in pharmacokinetic parameters (AUC, maximum plasma concentration [Cmax], MRT, Vss) between PTX-SNs and PTX-HSNs were not found in male Sprague Dawley rats in the absence of solid tumor implantation. In normal animal models, PTX-HSNs may possess similar pharmacokinetics and tissue distribution profiles as PTX-SNs, because Sprague Dawley rats lack a targeting moiety and/or tissue to facilitate PTX-HSN binding, as well as because the particle size distribution of PTX-HSNs and PTX-SNs was similar.
Therefore, the advantage of HA-coated PTX-HSNs is prolonged circulation, which may increase its preferential and effective accumulation in specific tissues, such as tumors, via the EPR effect, as determined in this pharmacokinetic study.
Tissue distribution
The results of the tissue distribution study showing the concentration of PTX in the liver, kidneys, lungs, blood, and tumor at 2, 4, and 24 h after a caudal tail bolus injection of 10 mg/kg PTX-HSNs, PTX-SNs, or Taxol are shown in Figure 7A–C, respectively.8,9 The blood concentration of PTX at 2, 4, and 24 h following administration of the PTX-HSNs and PTX-SNs was higher than that after administration of Taxol (Figure 7). At 2 h after administration, the PTX concentration in the tumor of PTX-HSN-treated mice was approximately twofold higher than that in PTX-SN- and Taxol-treated mice (Figure 7). In addition, the tissue distribution of the PTX-HSNs was ranked as follows: liver > lungs > kidneys > tumor > blood. At 4 h after administration, the tumor tissue exposed to PTX-HSNs showed significantly (fourfold) more PTX accumulation than was observed for the tumor tissue exposed to Taxol (Figure 7). The drug concentration in the tumor after PTX-HSN treatment was initially increased, but then decreased more slowly in other tissues than after Taxol treatment, which demonstrated the efficiency of PTX and its decreased side effects in nontarget sites. At 24 h after administration, the tumor tissue exposed to the PTX-HSNs showed significantly (2.5-fold) more PTX accumulation than was observed for the tumor tissue exposed to Taxol (Figure 8). However, PTX was cleared from the other tissues/organs after 1 day. It is likely that PTX was rapidly cleared from the blood and did therefore not accumulate in the tissues/organs (Figures 7 and 8).
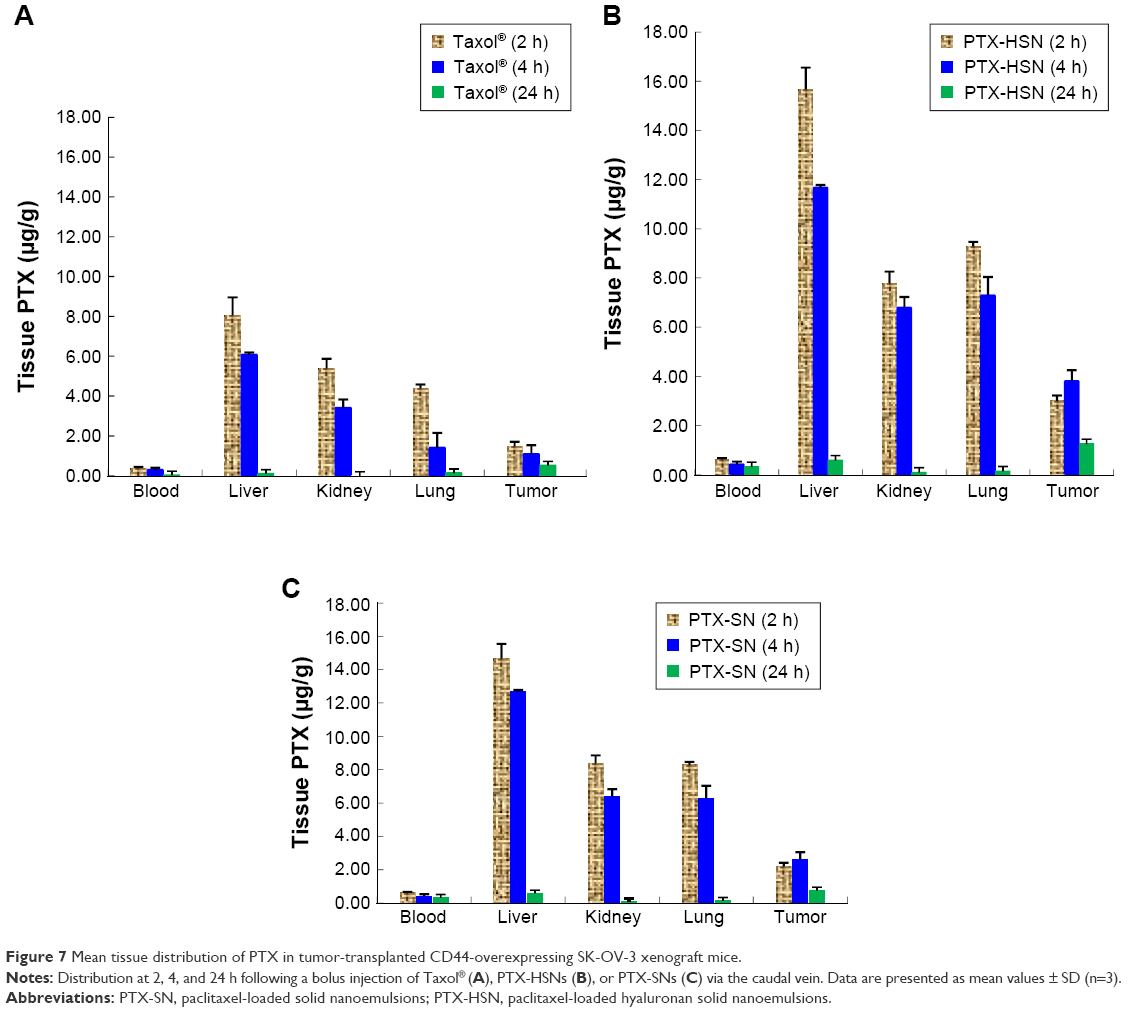 | Figure 7 Mean tissue distribution of PTX in tumor-transplanted CD44-overexpressing SK-OV-3 xenograft mice. |
 | Figure 8 Distribution of PTX in tumor tissue after an intravenous bolus injection (caudal vein) of PTX-SNs, PTX-HSNs, or Taxol® in mice at 2, 4, and 24 h. |
Empirically, at 24 h, the absolute concentration of PTX in the Taxol-treated group in nontumor tissues was higher than that of PTX-HSNs and PTX-SNs. However, we focused on the relative change in PTX concentrations rather than the absolute values. The decrease in tissue PTX concentrations from 2 to 24 h demonstrates rapid CL in the liver or lungs in the PTX-HSN-treated group compared to that in the Taxol-treated group. For example, the concentration of PTX was determined as 7.97 ng/g after 22 h in liver of the mice of the Taxol group, but the concentration of PTX was 15.10 ng/g after 22 h in liver of the mice of the PTX-HSN group. In addition, PTX-SNs were cleared to a greater extent than Taxol, showing a similar pattern as that of PTX-HSNs. However, the tissue distribution profiles up to 24 h could not confirm the full CL of the nanoemulsion in nontumor tissue. In tumor tissues, PTX-HSNs and PTX-SNs showed high accumulation ratios compared to that of Taxol, attributable to a combination of higher absolute amounts and lower relative decreases. While this may result in systemic side effects, the final antitumor efficacy, which is emphasized, is expected to be superior.
Conclusion
In this study, water-insoluble PTX-HSNs were successfully prepared, characterized, and evaluated for the delivery of PTX to ovarian cancer cells and its enhanced antitumor efficacy via active tumor targeting.
This novel targeted drug delivery system consists of particles <100 nm in size, with a relatively narrow size distribution. The drug loading content of PTX was 3 mg/mL and the EE was close to 100%, which demonstrated a highly solubilizing capacity of the emulsions. HA coated on the surface of the particles enhanced the targeting efficacy to cancer cells as demonstrated in the in vitro cell affinity studies.
The in vivo toxicity and antitumor activity studies indicated that PTX-HSNs effectively suppressed tumor growth and reduced toxicity to a greater extent than was observed for Taxol; SK-OV-3 ovarian tumors were eliminated through the use of a highly increased PTX dose. Further, the pharmacokinetic parameters of the PTX-HSNs were superior to those of Taxol. After PTX-HSN treatment, the circulation time of PTX was prolonged in the blood. Further, the retention and accumulation of PTX in ovarian cancer cells increased.
Therefore, PTX-HSNs are highly effective nanosystems for the delivery of PTX with a high MTD to ovarian tumors overexpressing CD44, resulting in enhanced active tumor targeting and low toxicity.
Disclosure
The authors report no conflicts of interest in this work.
References
Othman T, Goto S, Lee J-B, Taimura A, Matsumoto T, Kosaka M. Hyperthermic enhancement of the apoptotic and antiproliferative activities of paclitaxel. Pharmacology. 2001;62(4):208–212. | ||
Orr GA, Verdier-Pinard P, McDaid H, Horwitz SB. Mechanisms of Taxol resistance related to microtubules. Oncogene. 2003;22(47):7280–7295. | ||
Xin D, Wang Y, Xiang J. The use of amino acid linkers in the conjugation of paclitaxel with hyaluronic acid as drug delivery system: synthesis, self-assembled property, drug release, and in vitro efficiency. Pharm Res. 2010;27(2):380–389. | ||
Journo-Gershfeld G, Kapp D, Shamay Y, Kopeček J, David A. Hyaluronan oligomers-HPMA copolymer conjugates for targeting paclitaxel to CD44-overexpressing ovarian carcinoma. Pharm Res. 2012;29(4):1121–1133. | ||
Liebmann J, Cook J, Mitchell J. Cremophor EL, solvent for paclitaxel, and toxicity. Lancet. 1993;342(8884):1428. | ||
Singla AK, Garg A, Aggarwal D. Paclitaxel and its formulations. Int J Pharm. 2002;235(1):179–192. | ||
Liu P, Situ JQ, Li WS, et al. High tolerated paclitaxel nano-formulation delivered by poly (lactic-co-glycolic acid)-g-dextran micelles to efficient cancer therapy. Nanomedicine. 2015;11(4):855–866. | ||
Yang XY, Li YX, Li M, Zhang L, Feng LX, Zhang N. Hyaluronic acid-coated nanostructured lipid carriers for targeting paclitaxel to cancer. Cancer Lett. 2013;334(2):338–345. | ||
Zhao P, Wang H, Yu M, et al. Paclitaxel loaded folic acid targeted nanoparticles of mixed lipid-shell and polymer-core: in vitro and in vivo evaluation. Eur J Pharm Biopharm. 2012;81(2):248–256. | ||
Park JH, Cho HJ, Yoon HY, et al. Hyaluronic acid derivative-coated nanohybrid liposomes for cancer imaging and drug delivery. J Control Release. 2014;174:98–108. | ||
Kim TY, Kim DW, Chung JY. Phase I. Pharmacokinetic study of Genexol-PM, a cremophor-free, polymeric micelle-formulated paclitaxel, in patients with advanced malignancies. Clin Cancer Res. 2004;10(11):3708–3716. | ||
Rivkin I, Cohen K, Koffler J, Melikhov D, Peer D, Margalit R. Paclitaxel-clusters coated with hyaluronan as selective tumor-targeted nanovectors. Biomaterials. 2010;31(27):7106–7114. | ||
Danhier F, Vroman B, Lecouturier N, et al. Targeting of tumor endothelium by RGD-grafted PLGA-nanoparticles loaded with paclitaxel. J Control Release. 2009;140(2):166–173. | ||
Battistini FD, Flores-Martin J, Olivera ME, Genti-Raimondi S, Manzo RH. Hyaluronan as drug carrier. The in vitro efficacy and selectivity of Hyaluronan-Doxorubicin complexes to affect the viability of overexpressing CD44 receptor cells. Eur J Pharm Sci. 2014;65:122–129. | ||
Pires LA, Hegg R, Valduga CJ, Graziani SR, Rodrigues DG, Maranhao RC. Use of cholesterol-rich nanoparticles that bind to lipoprotein receptors as a vehicle to paclitaxel in the treatment of breast cancer: pharmacokinetics, tumor uptake and a pilot clinical study. Cancer Chemother Pharmacol. 2009;63(2):281–287. | ||
Wang Y-S, Jiang Q, Li R-S, et al. Self-assembled nanoparticles of cholesterol-modified O-carboxymethyl chitosan as a novel carrier for paclitaxel. Nanotechnology. 2008;19(14):145101. | ||
Zhan C, Gu B, Xie C, Li J, Liu Y, Lu W. Cyclic RGD conjugated poly (ethylene glycol)-co-poly (lactic acid) micelle enhances paclitaxel anti-glioblastoma effect. J Control Release. 2010;143(1):136–142. | ||
Zhao P, Wang H, Yu M, et al. Paclitaxel-loaded, folic-acid-targeted and TAT-peptide-conjugated polymeric liposomes: in vitro and in vivo evaluation. Pharm Res. 2010;27(9):1914–1926. | ||
Mooberry LK, Nair M, Paranjape S, McConathy WJ, Lacko AG. Receptor mediated uptake of paclitaxel from a synthetic high density lipoprotein nanocarrier. J Drug Target. 2010;18(1):53–58. | ||
Karbownik MS, Nowak JZ. Hyaluronan: towards novel anti-cancer therapeutics. Pharmacol Rep. 2013;65(5):1056–1074. | ||
Liang J, Jiang D, Noble PW. Hyaluronan as a therapeutic target in human diseases. Adv Drug Deliv Rev. 2016;97:186–203. | ||
Lim EK, Kim HO, Jang E, et al. Hyaluronan-modified magnetic nanoclusters for detection of CD44-overexpressing breast cancer by MR imaging. Biomaterials. 2011;32(31):7941–7950. | ||
Mizrahy S, Raz SR, Hasgaard M, et al. Hyaluronan-coated nanoparticles: the influence of the molecular weight on CD44-hyaluronan interactions and on the immune response. J Control Release. 2011;156(2):231–238. | ||
Oh JK, Drumright R, Siegwart DJ, Matyjaszewski K. The development of microgels/nanogels for drug delivery applications. Prog Polym Sci. 2008;33(4):448–477. | ||
Kong M, Park HJ. Stability investigation of hyaluronic acid based nanoemulsion and its potential as transdermal carrier. Carbohydr Polym. 2011;83(3):1303–1310. | ||
Kim J-E, Park Y-J. High paclitaxel-loaded and tumor cell-targeting hyaluronan-coated nanoemulsions. Colloids Surf B Biointerfaces. Epub 2016 Oct 29. | ||
Zhao D, Gong T, Fu Y, et al. Lyophilized Cheliensisin A submicron emulsion for intravenous injection: characterization, in vitro and in vivo antitumor effect. Int J Pharm. 2008;357(1):139–147. | ||
Spernath L, Regev O, Levi-Kalisman Y, Magdassi S. Phase transitions in O/W lauryl acrylate emulsions during phase inversion, studied by light microscopy and cryo-TEM. Colloids Surf A Physicochem Eng Asp. 2009;332(1):19–25. | ||
Liu D, Liu Z, Wang L, Zhang C, Zhang N. Nanostructured lipid carriers as novel carrier for parenteral delivery of docetaxel. Colloids Surf B Biointerfaces. 2011;85(2):262–269. | ||
Dharap SS, Wang Y, Chandna P, et al. Tumor-specific targeting of an anticancer drug delivery system by LHRH peptide. Proc Natl Acad Sci U S A. 2005;102(36):12962–12967. | ||
Pessina A, Albella B, Bayo M, et al. Application of the CFU-GM assay to predict acute drug-induced neutropenia: an international blind trial to validate a prediction model for the maximum tolerated dose (MTD) of myelosuppressive xenobiotics. Toxicol Sci. 2003;75(2):355–367. | ||
Liu D, Liu F, Liu Z, Wang L, Zhang N. Tumor specific delivery and therapy by double-targeted nanostructured lipid carriers with anti-vegfr-2 antibody. Mol Pharm. 2011;8(6):2291–2301. | ||
Davis ME, Chen ZG, Shin DM. Nanoparticle therapeutics: an emerging treatment modality for cancer. Nat Rev Drug Discov. 2008;7(9):771–782. | ||
Fang J, Nakamura H, Maeda H. The EPR effect: unique features of tumor blood vessels for drug delivery, factors involved, and limitations and augmentation of the effect. Adv Drug Deliv Rev. 2011;63(3):136–151. | ||
Mercê ALR, Carrera LCM, Romanholi LKS, Recio MAL. Aqueous and solid complexes of iron (III) with hyaluronic acid: potentiometric titrations and infrared spectroscopy studies. J Inorg Biochem. 2002;89(3):212–218. | ||
Zhang X-Y, Chen J, Zheng Y-F, et al. Follicle-stimulating hormone peptide can facilitate paclitaxel nanoparticles to target ovarian carcinoma in vivo. Cancer Res. 2009;69(16):6506–6514. |
 © 2017 The Author(s). This work is published and licensed by Dove Medical Press Limited. The full terms of this license are available at https://www.dovepress.com/terms.php and incorporate the Creative Commons Attribution - Non Commercial (unported, v3.0) License.
By accessing the work you hereby accept the Terms. Non-commercial uses of the work are permitted without any further permission from Dove Medical Press Limited, provided the work is properly attributed. For permission for commercial use of this work, please see paragraphs 4.2 and 5 of our Terms.
© 2017 The Author(s). This work is published and licensed by Dove Medical Press Limited. The full terms of this license are available at https://www.dovepress.com/terms.php and incorporate the Creative Commons Attribution - Non Commercial (unported, v3.0) License.
By accessing the work you hereby accept the Terms. Non-commercial uses of the work are permitted without any further permission from Dove Medical Press Limited, provided the work is properly attributed. For permission for commercial use of this work, please see paragraphs 4.2 and 5 of our Terms.