Back to Archived Journals » Open Access Journal of Sports Medicine » Volume 9
Pacing in a 94-year-old runner during a 6-hour run
Authors Knechtle B ![]() , Nikolaidis PT
, Nikolaidis PT ![]()
Received 30 October 2017
Accepted for publication 20 December 2017
Published 5 February 2018 Volume 2018:9 Pages 19—25
DOI https://doi.org/10.2147/OAJSM.S155526
Checked for plagiarism Yes
Review by Single anonymous peer review
Peer reviewer comments 2
Editor who approved publication: Prof. Dr. Andreas Imhoff
Beat Knechtle,1,2 Pantelis T Nikolaidis3
1Medbase St. Gallen Am Vadianplatz, St. Gallen, Switzerland; 2Institute of Primary Care, University of Zurich, Zurich, Switzerland; 3Exercise Physiology Laboratory, Nikaia, Greece
Abstract: It is well known that elderly people up to 90 years of age are able to finish a marathon. We have no knowledge, however, how runners at the age of 90 years or older pace during a long run. In this case report, we describe the pacing of a 94-year-old man competing in a 6-hour run in order to prepare for a marathon at the age of 95 years in category M95. In the “6-Stunden-Lauf” held in Brugg, Switzerland, participants have to run as many laps of 0.934 km as possible on a completely flat circuit within 6 hours to achieve as many kilometers as possible. Before and after the competition we measured body weight, percentage of body fat, fat-free mass and percentage of body water using a bioelectrical impedance scale. On the day before the start, 24 hours after the finish and then every 24 hours for the following 4 days, capillary blood samples at a fingertip were drawn to determine hemoglobin, hematocrit, leukocytes, platelets, C-reactive protein, creatine kinase, creatinine and potassium and sodium. The runner achieved 26 laps during the 6 hours, equal to 24.304 km. Lap times increased continuously and running speed decreased nearly linearly. A large main effect of time point (hours) of the race on running speed was observed (p=0.015, h2=0.48) with running speed being slower in the last hour than that in the first hour (3.5±1.4 km/h versus 5.3±0.4 km/h). Body mass decreased by 0.6%, percent body fat by 1.4% and fat-free mass by 0.7%. During recovery, hemoglobin, hematocrit and the number of thrombocytes increased, whereas the number of leukocytes remained unchanged. C-reactive protein was highest on day 1 after the race and decreased by day 4 nearly to zero. Creatine kinase was slightly elevated pre-race, highest the day after the race and remained slightly elevated until day 4. Creatinine and potassium were increased pre-race but returned to normal values during recovery. Sodium remained within normal values on all days. Based on the linear decrease in running speed, we extrapolated for the marathon distance to run a marathon in age group M95 (i.e., male marathoners aged 95–99 years). In the worst-case scenario (i.e., the athlete develops maximal fatigue), he would stop the race before 40 km, in the best scenario (i.e., the athlete develops minimal fatigue), he would achieve an overall race time of ~8.3 hours and in the most probable scenario (i.e., the athlete can continue in the same manner), the final race time will be longer than 11 hours.
Keywords: master athlete, elderly, endurance, performance, running
Introduction
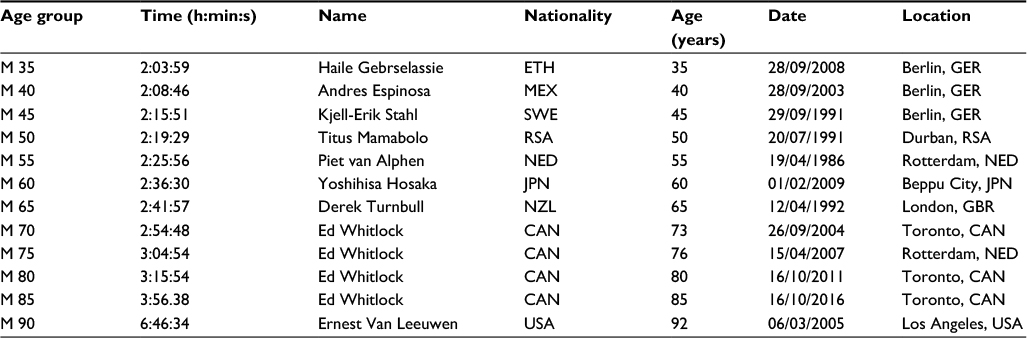
Master athletes (i.e., athletes older than 35 years) are continuously extending their limits in athletic performance.1 It is well known that more and more elderly people older than 75 years are able to run marathons.2–4 In case reports5–7 and analyses from marathon races3,8 or World Championships,9 it has been reported that athletes of over 80 years or even over 90 years are able to finish a marathon. The world record in age group M85 was set by the Canadian Ed Whitlock on October 12, 2016, in Toronto, Canada, in a time of 03:56:38 h:min:s. The world record in age group M90 in marathon running was set on March 6, 2005, in Los Angeles by the US-American Ernest Van Leeuwen in a time of 06:46:34 h:min:s.10 To date, no official world record in age group M95 has been set and accepted by World Master Athletics.
An important aspect in endurance sports such as running is pacing. Pacing describes the tactical behavior of an athlete during a competition.11 Pacing in running has been studied so far for elite athletes over different distances such as a half-marathon,12 a marathon13 and ultra-marathon running races of different distances.14,15
Recently, pacing of age group marathoners competing in the “New York City Marathon” up to the age group 80–84 years has been investigated.16,17 When pacing between the different age group athletes was compared, differences were found between younger and older athletes.18 Athletes in older age groups paced relatively more even compared to athletes in younger age groups, where the trend was more remarkable in the relatively slower athletes. Overall, older runners pace differently with smaller changes during the marathon than younger runners with similar race time.19
We have, however, no knowledge about pacing in marathoners older than 90 years. In this case report, we analyze the pacing of a 94-year-old runner who competed in a 6-hour run in order to prepare for a marathon at the age of 95 years. He has the official European record in the category M90 with 6:48 h:min5 and we expected that he would not be able to run at the age of 94 years at the same running speed of ~6.19 km/h as he did at the age of 90 years.
Methods
The runner
Our runner is a 94-year-old man (71.4 kg, 173 cm, BMI 23.9 kg/m2) who has already successfully completed many 10 km runs, half marathons6 and some marathons in his life at older ages.5 As a master runner, he won several gold medals at the European Championships over 10 km and half marathon in the events of the European Veteran Athletic Association in the older age categories such as M80, M85 and M90.5,6
During the pre-race preparation, during and after the run, his primary care physician monitored all training, competition and recovery phase. The runner provided his written informed consent to the analysis and publication of his data.
As part of his preparation for the next marathon at the age of 95 years in the category M95, he wanted to compete in a 6-hour run for training purposes in order to reach as many kilometers as possible in a long training session. His training in the pre-race preparation consisted of daily running his usual lap during about 1 hour.
The race
On September 24, 2017, the start of the “6-Stunden-Lauf” in Brugg, Switzerland, was held.20 The course is located in Schacheninsel in Brugg. It is a completely flat circuit of 0.934 km where athletes have to run as many laps as possible within the time limit. With an electronic chip at the ankle, each lap is measured by an official timekeeping company. When the athlete enters the last lap, he takes a little sack with the starting number on it and leaves it at the final whistle on the edge of the road. The organizer then measures the distance so that the full distance can be measured exactly.
The organizer offers a buffet where the runners have available to them on each lap drink (e.g., water, tea warm, caffeinated drinks, isotonic sports drink, broth, malt beer, red bull, coffee) as well as food (e.g., pasta, potatoes, bread with various pads such as cheese or jam, salt brezels, chips, peanuts, bars, cakes, chocolate, biscuits, fruits such as bananas, oranges, watermelons, and grapes). Alternatively, the runners can be supported by their own support crews. The runners can also take individual breaks.
At the time of the start in the morning at 06:00 a.m., the temperature was 9.6°C, which rose to 20.7°C in the noon. The sky was practically cloud free.21
Measurement
Before the competition, we measured the body weight, the percentage of body fat, the fat-free mass and the percentage of body water using a bioelectrical impedance scale Tanita BC-545 (Tanita, Arlington Heights, IL, USA) to repeat the measurement after the run. The Tanita method was evaluated and cross-validated using the dilution method for total body water and dual energy X-ray absorptiometry for percent body fat in 104 men and 101 women aged 16–78 years.22 In the same study, a reliability check of Tanita BC-545 was conducted on 28 male runners prior to testing to ensure reliability in determination of percent total body water and no significant difference between the two trials was found (p>0.05) with the intra-class correlation being high (r=0.99).
On the day before the start, 24 hours after the finish and then every 24 hours for the following 4 days, capillary blood samples were drawn from a fingertip. We measured hemoglobin, hematocrit, leukocytes, platelets, C-reactive protein, creatine kinase, creatinine, potassium and sodium. Hematological analysis was performed with the ABX Micros CRP 200 medical lab (HORIBA Medical, Montpellier, France), and the analysis of the serum parameters was done with the Fuji Dri-Chem 4000i analysis system (FUJIFILM Corporation, Tokyo, Japan).
Statistical analysis
Pearson correlation coefficient r examined the relationship of race time and speed with lap. The magnitude of the correlations were evaluated as trivial, r<0.10; small, r=0.10–0.30; moderate, r=0.30–0.50; large, r=0.50–0.70; very large, r=0.70–0.90; and almost perfect r>0.90. A one-way analysis of variance examined the differences among hours (i.e., how many kilometers the athlete achieved hourly) across the race. The magnitude of the differences was classified as trivial (h2<0.01), small (0.01≤h2<0.06), medium (0.06≤ h2<0.14) and large (h2≥0.14). Significance level was set at alpha=0.05. In addition, we analyzed linear regression of running speed by lap to predict race time for the marathon distance. Particularly, we examined three scenarios: pessimistic, moderate or optimistic, and calculated the corresponding marathon race times.
Results
Performance
The athlete achieved 26 laps during the 6 hours, equal to 24.304 km. Lap times increased continuously during the 6 hours (Figure 1) and consequently running speed decreased (Figure 2). A large main effect of the time point (hours) in the race on running speed was observed (p=0.015, h2=0.48) with the running speed in the last hour being slower than that of the first hour (3.5±1.4 km/h versus 5.3±0.4 km/h) (Figure 3). Most laps were completed at a running speed of 4.5 km/h (Figure 4).
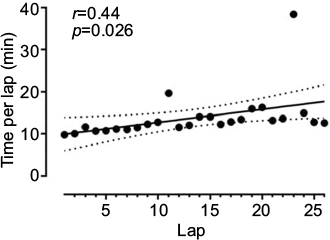 | Figure 1 Lap time during the race. Note: Dash lines represent 95% CIs. |
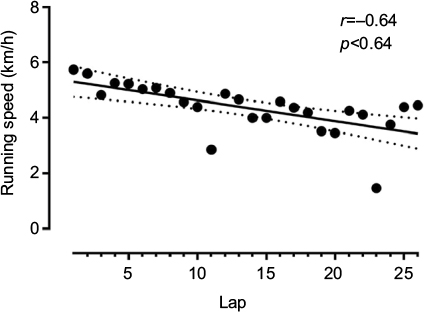 | Figure 2 Race speed by lap. Note: Dash lines represent 95% CIs. |
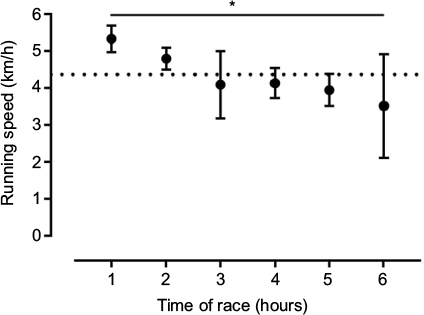 | Figure 3 Race speed by hour of race. Notes: *p<0.05; error bars represent SD. |
 | Figure 4 Distribution of lap speed. Note: Normal distribution is represented by dashed line. |
Changes of anthropometric and laboratory results
During the race, body mass decreased by 0.6%, percent body fat by 1.4% and fat-free mass by 0.7% (Table 1). During the recovery phase, hemoglobin, hematocrit and thrombocytes increased, whereas leukocytes remained unchanged. C-reactive protein was highest on day 1 after the race and decreased by day 4 nearly to zero. Creatine kinase was slightly elevated pre-race, highest the day after the race and remained slightly elevated until day 4. Creatinine and potassium were increased pre-race but returned to normal values during the recovery. Sodium remained within normal values on all days (Table 2).
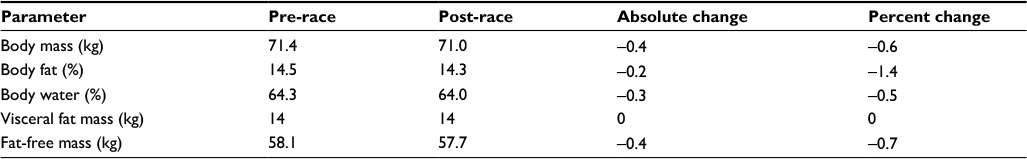 | Table 1 Results of the bioelectrical impedance analysis |
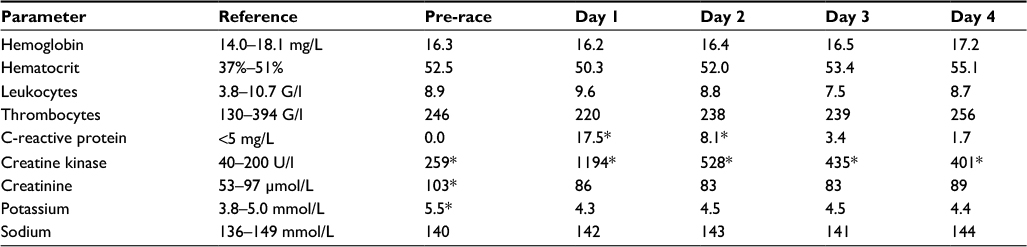 | Table 2 Results of the laboratory analyses Note: *Out of reference. |
Discussion
We found in this 94-year-old runner a continuous and linear decrease in running speed (i.e., positive pacing) during the 6 hours and only some minor changes in anthropometric and laboratory analyses.
Regarding the results of the bioelectrical impedance analysis, the stress on the body can be rated as minor. This is most probably due to the low running speed of ~6 km/h at the beginning and then turning to walking at a mean walking speed of ~4.5 km/h. Regarding the overall performance, mean walking speed was ~4.0 km/h, due to two longer breaks in laps 11 and 24 (Figure 1). The decrease in fat-free mass was most probably due to the depletion of intramyocellular glycogen stores as it has been described for long-distance triathletes.23
Creatine kinase generally increases after a longer run as a measure of skeletal muscle damage24 where the increase depends on the age of the athlete and the length of the race.25,26 An explanation for the relatively low increase in creatine kinase might be the low fat-free mass of the athlete due to his older age. With increasing age, fat-free mass decreases and the decrease in muscle fibers cannot be prevented by increased physical exercise.27 Considering skeletal muscle damage, also C-reactive protein increased. Similarly to creatine kinase, the post-race increase in C-reactive protein depends on age and length of the race.25
Plasma sodium was held with the reference range at pre-race, post-race and during the days after the race. Exercise-associated hyponatremia – defined as plasma sodium concentration below 135 mmol/L – is often found in slow runners.28 To date, old age has not been identified as a potential risk factor for exercise-associated hyponatremia, although elderly marathon runners compete rather slowly.8 Based on these laboratory data, we can assume that running during 6 hours by a trained 94-year-old man has no negative impact on health.
The present 94-year-old runner was not able to increase running speed in the final laps for an end spurt. Recently, a final end spurt has been described in master runners competing in the “New York City Marathon”17 independent of the age.19 On the other hand, older master runners adopt a more even pacing than their younger counterparts, i.e., they present smaller changes in their speed,17 which might explain the absence of an end spurt in the runner of this study. This is most probably due to the age-related decrease in skeletal muscle with changes in fiber type, with a shift toward a higher percentage of type I fibers causing slowdown in master athletes.
When we consider the rather linear increase in lap times with a mainly linear decrease in running speed, we might extrapolate the performance to the marathon distance since this runner intends to run a marathon at the age of 95 years in M95 in 1 year. When we extrapolate his actual running speed, we may consider a pessimistic scenario (i.e., the athlete develops maximal fatigue after the actually completed 24 km), a moderate scenario (i.e., the athlete can continue after 24 km with the same running speed) and an optimistic scenario (i.e., the athlete develops minimal fatigue and/or improves performance due to improvements in training) (Table 3). In the worst-case scenario, the athlete would stop the race before 40 km; in the best scenario, he would achieve an overall race time of ~8.3 hours and in the most probably scenario; and in the final race time will be longer than 11 hours (Table 3).
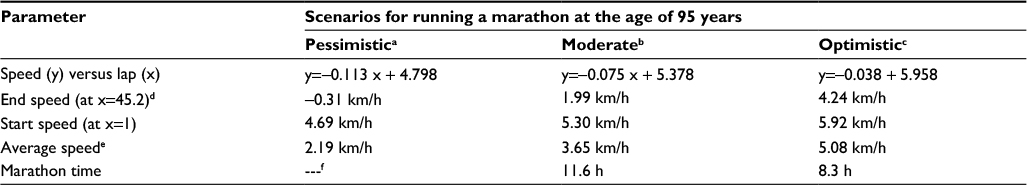 | Table 3 Extrapolation of the actual performance for the marathon distance Notes: aThe pessimistic scenario considers that the athlete develops maximal fatigue, i.e., the highest slope value and the lowest y-intercept value of 95% CI are applied. bThe moderate scenario considers that the speed follows the average trend across time, i.e., the best-fit values are applied. cThe optimistic scenario considers that the athlete develops minimal fatigue, i.e., the lowest slope value and the highest y-intercept value of 95% CI are applied. d42.195 km/0.934 km per lap=45.2 laps. eIt is calculated as the quotient (start speed + end speed)/2. fSince the end speed is negative, the athlete will be expected to abandon the race at the (4.798/0.113=42.4) 43rd lap or 39.6 km. |
This dramatic increase in overall race time from 6:48:55 h:min:s at the age of 90 years5 to ~8.3 hours at his best must be expected regarding the analysis of the development of marathon race times of the outstanding Canadian marathoner Ed Whitlock.29 His age-related performance decline increased after the age of 80 years and was drastically amplified after the age of 85 years despite the exceptional running performances for his advanced age (Table 4).
 | Table 4 Master world records in marathon running following World Master Athletics Note: Data are taken from www.world-masters-athletics.org/records/nonstadiamen.pdf. |
One could also question the quality of the performance level of our runner in order to extrapolate his data for a potential world record in marathon running in M95. Considering the official world records in master marathoners regarding World Master Athletics (Table 4), Ernest Van Leeuwen achieved a marathon race time of 6:46 h:min at the age of 92 years in 2005, whereas the official European record of our runner is 6:48:55 h:min:s, which is only 2 minutes more than the official world record. We think, indeed, that our calculations and extrapolations may be very reliable for a potential future world record in marathon running in M95.
The most likely explanation for a dramatic decrease in running performance from the 8th to the 9th decade is the decrease in maximum oxygen uptake (VO2max). In a 91-year-old man who had completed 627 marathons and 117 ultra-marathons over 42 years, VO2max declined from 43 mL/kg/min to 20 mL/kg/min between the age of 68 and 89 years. It was also found that his marathon times were highly correlated with his VO2max.30 Regarding our runner, he achieved a VO2max of 31 mL/kg/min at the age of 90 years before his marathon of 6:48:55 h:min:s.5 Most probably, our runner will be able to run a marathon at the age of 95 years, with only VO2max as limiting factor. Similarly, in an 81-year-old man who competed in 591 marathons, a curvilinear decrease in marathon race times occurred when he reached the 9th decade. There was a significant relation between the decrease in VO2max and marathon race times, and the decrease in VO2max was strongly correlated with the increase in age.7
Limitations
This case study is limited by the athlete’s physiological, psychological and training characteristics. Strength of the study was its novelty, since limited data existed on pacing of old master runners. Considering the increased participation of master runners in endurance and ultra-endurance races, these findings have practical applications for coaches and fitness trainers working with them. The findings of the present study add to the body of the existing literature17–19 suggesting a relatively even pacing in the older master runners.
Conclusion
In conclusion, a 94-year-old runner shows a linear decrease in running speed during a 6-hour run with no final end spurt. Extrapolation of his actual race performance for a planned marathon at the age of 95 years would lead to an expected marathon race time of ~8.3 hours in the best case.
Acknowledgment
We thank Christina Sonderegger, Medbase St. Gallen Am Vadianplatz, for her technical assistance.
Disclosure
The authors report no conflicts of interest in this work.
References
Lepers R, Stapley PJ. Master athletes are extending the limits of human endurance. Front Physiol. 2016;7:613. | ||
Leyk D, Erley O, Ridder D, et al. Age-related changes in marathon and half-marathon performances. Int J Sports Med. 2007;28(6):513–517. | ||
Lepers R, Cattagni T. Do older athletes reach limits in their performance during marathon running? Age (Dordr). 2012;34(3):773–781. | ||
Knechtle B, Assadi H, Lepers R, Rosemann T, Rüst CA. Relationship between age and elite marathon race time in world single age records from 5 to 93 years. BMC Sports Sci Med Rehab. 2015;6:31. | ||
Mueller SM, Knechtle B, Knechtle P, Toigo M. Physiological alterations after a marathon in the first 90-year-old male finisher: case study. Springerplus. 2014;3:608. | ||
Knechtle B, Kohler G, Rosemann T. Study of a European male champion in 10-km road races in the age group >85 years. Proc (Bayl Univ Med Cent). 2010;23(3):259–260. | ||
Brendle DC, Joseph LJ, Sorkin JD, McNelly D, Katzel LI. Aging and marathon times in an 81-year-old man who competed in 591 marathons. Am J Cardiol. 2003;91(9):1154–1156. | ||
Ahmadyar B, Rosemann T, Rüst CA, Knechtle B. Improved race times in marathoners older than 75 years in the last 25 years in the world’s largest marathons. Chin J Physiol. 2016;59(3):139–147. | ||
Nikolaidis PT, Zingg MA, Knechtle B. Performance trends in age-group runners from 100 m to marathon—The World Championships from 1975 to 2015. Scand J Med Sci Sports. 2017;27(12):1588–1596. | ||
World Masters Athletics. WMA records non stadia - men. Available from: www.world-masters-athletics.org/records/nonstadiamen.pdf. Accessed January 17, 2018. | ||
Abbiss CR, Laursen PB. Describing and understanding pacing strategies during athletic competition. Sports Med. 2008;38(3):239–252. | ||
Hanley B. Pacing profiles and pack running at the IAAF World Half Marathon Championships. J Sports Sci. 2015;33(11):1189–1195. | ||
Hanley B. Pacing, packing and sex-based differences in Olympic and IAAF World Championship marathons. J Sports Sci. 2016;34(17):1675–1681. | ||
Lambert MI, Dugas JP, Kirkman MC, Mokone GG, Waldeck MR. Changes in running speeds in a 100 km ultra-marathon race. J Sports Sci Med. 2004;3(3):167–173. | ||
Tan PL, Tan FH, Bosch AN. Similarities and differences in pacing patterns in a 161-km and 101-km ultra-distance road race. J Strength Cond Res. 2016;30(8):2145–2155. | ||
Breen D, Norris M, Healy R, Anderson R. Marathon pace control in masters athletes. Int J Sports Physiol Perform. Epub 2017 Jul 17. | ||
Nikolaidis PT, Knechtle B. Pacing in age group marathoners in the “New York City Marathon”. Res Sports Med. 2018;26(1):86–99. | ||
Nikolaidis PT, Knechtle B. Do fast older runners pace differently from fast younger runners in the ‘new york city marathon’? J Strength Cond Res. Epub 2017 Jul 24. | ||
Nikolaidis PT, Knechtle B. Effect of age and performance on pacing of marathon runners. Open Access J Sports Med. 2017;8:171–180. | ||
6/12/24 Stundenlauf. The 10th Brugg Ultra 23/24 September 2017. Available from: www.24stundenlauf.ch. Accessed January 17, 2018. | ||
Wetter.com GmbH. Wetterrückblick der Region Aarau. [Weather review of the Aarau region]. http://ch.wetter.com/wetter_aktuell/rueckblick/?id=CH0CH0002. Accessed January 17, 2018. | ||
Jebb SA, Cole TJ, Doman D, Murgatroyd PR, Prentice AM. Evaluation of the novel Tanita body-fat analyser to measure body composition by comparison with a four-compartment model. Br J Nutr. 2000;83(2):115–122. | ||
Mueller SM, Anliker E, Knechtle P, Knechtle B, Toigo M. Changes in body composition in triathletes during an Ironman race. Eur J Appl Physiol. 2013;113(9):2343–2352. | ||
Lippi G, Schena F, Salvagno GL, et al. Acute variation of biochemical markers of muscle damage following a 21-km, half-marathon run. Scand J Clin Lab Invest. 2008;68(7):667–672. | ||
Jastrzębski Z, Żychowska M, Radzimiński Ł, Konieczna A, Kortas J. Damage to liver and skeletal muscles in marathon runners during a 100 km run with regard to age and running speed. J Hum Kinet. 2015;45(1):93–102. | ||
Shin KA, Park KD, Ahn J, Park Y, Kim YJ. Comparison of changes in biochemical markers for skeletal muscles, hepatic metabolism, and renal function after three types of long-distance running: observational study. Medicine (Baltimore). 2016;95(20):e3657. | ||
Faulkner JA, Davis CS, Mendias CL, Brooks SV. The aging of elite male athletes: age-related changes in performance and skeletal muscle structure and function. Clin J Sport Med. 2008;18(6):501–507. | ||
Urso C, Brucculeri S, Caimi G. Physiopathological, epidemiological, clinical and therapeutic aspects of exercise-associated hyponatremia. J Clin Med. 2014;3(4):1258–1275. | ||
Lepers R, Cattagni T. Age-related decline in endurance running performance – an example of a multiple World records holder. Appl Physiol Nutr Metab. 2018;43(1):98–100. | ||
Addison O, Steinbrenner G, Goldberg AP, Katzel LI. Aging, Fitness, and Marathon Times in a 91 Year-old Man Who Competed in 627 Marathons. Br J Med Med Res. 2015;8(12):1074–1079. |
 © 2018 The Author(s). This work is published and licensed by Dove Medical Press Limited. The
full terms of this license are available at https://www.dovepress.com/terms
and incorporate the Creative Commons Attribution
- Non Commercial (unported, 3.0) License.
By accessing the work you hereby accept the Terms. Non-commercial uses of the work are permitted
without any further permission from Dove Medical Press Limited, provided the work is properly
attributed. For permission for commercial use of this work, please see paragraphs 4.2 and 5 of our Terms.
© 2018 The Author(s). This work is published and licensed by Dove Medical Press Limited. The
full terms of this license are available at https://www.dovepress.com/terms
and incorporate the Creative Commons Attribution
- Non Commercial (unported, 3.0) License.
By accessing the work you hereby accept the Terms. Non-commercial uses of the work are permitted
without any further permission from Dove Medical Press Limited, provided the work is properly
attributed. For permission for commercial use of this work, please see paragraphs 4.2 and 5 of our Terms.