")
Back to Journals » Journal of Asthma and Allergy » Volume 16
Ozone Pollution and Acute Exacerbation of Asthma in Residents of China: An Ecological Study
Received 22 May 2023
Accepted for publication 17 August 2023
Published 6 September 2023 Volume 2023:16 Pages 951—960
DOI https://doi.org/10.2147/JAA.S422476
Checked for plagiarism Yes
Review by Single anonymous peer review
Peer reviewer comments 3
Editor who approved publication: Dr Amrita Dosanjh
Yunlei Ma,1 Hanjun Zhao,2 Yinghao Su1
1Department of Respiratory Medicine, Traditional Chinese Medicine Hospital of Hebei Province, Shijiazhuang, People’s Republic of China; 2Department of Respiratory Medicine, Fourth Hospital of Hebei Medical University, Shijiazhuang, People’s Republic of China
Correspondence: Yinghao Su, Department of Respiratory Medicine, Traditional Chinese Medicine Hospital of Hebei Province, 389 Zhongshan Road, Shijiazhuang, 050017, People’s Republic of China, Tel/Fax +86-13785143851, Email [email protected]
Purpose: The evidence for a causal relationship between high-level ozone (O3) exposure and acute exacerbation of asthma among adults is limited, and the conclusions are less definitive.
Patients and methods: Here we collected the daily data on asthma cases, O3 exposure, and meteorological factors from 2010 to 2016 in Shijiazhuang, China. We investigated the risk of asthma exacerbation associated with high-level ozone exposure using a polynomial distributed lag model (PDLM). Using a generalized additive model (GAM), we estimated the interactive effects between O3 and other pollutants as well as meteorological factors on asthma exacerbation.
Results: A total of 7270 patients with asthma were enrolled from 22 governmental hospitals in 13 counties. Each 10 μg/m3 increase in O3 concentration on the exacerbation of asthma was associated with a 1.92% (95% CI = 0.80– 3.03%) higher risk of asthma exacerbation on day lag 7. The cumulative risk of O3 on asthma exacerbation increased by 18.9% (95% CI = 12.8– 25.4%) on the 14th day. High consecutive levels of O3 increase the risk of asthma exacerbation, and the interactive effect of O3 and sulfur dioxide (SO2) appears before the exacerbation onset.
Conclusion: These findings suggested that O3 should be an important risk factor for asthma exacerbation, and health benefits in reducing asthma exacerbation risk would be gained with continued efforts to improve the air quality in China.
Keywords: ozone, asthma exacerbation, PDLM, GAM, interaction
Introduction
Ozone pollution becomes a worrisome risk factor for global morbidity and mortality.1 Although O3 in the stratosphere plays a protective role against ultraviolet irradiation, O3 is one of the key oxidants and greenhouse gases in the atmosphere, contributing to climate change, affecting human and vegetation health.2,3 It should be noted that high concentrations of O3 are now common in densely populated areas and contribute to respiratory conditions.4
Asthma has become the second leading cause of death among chronic respiratory diseases around the world.5 According to the Global Burden of Disease estimated that 420 thousand people around the world died from asthma in 2016, more than 1000 per day. The prevalence of asthma between 2010 and 2012 was 1.24% among individuals aged >14 years and 3.02% among individuals aged <14 years in mainland China. It is estimated that there are approximately 30 million asthmatic patients in China.6,7 Multiple epidemiological studies have shown ongoing associations between high levels of O3 and poor early-life lung growth, development of allergic sensitization, development of asthma, airway inflammation, acutely impaired lung function, respiratory tract infections, and asthma exacerbations.8–10 The Asthma Global Burden Report estimated that appropriate 9–23 million of patients with asthma exacerbation should be attributed to O3.9 Additionally, most of the deaths of asthma occurred due to asthma exacerbations.10 A recent meta-analysis including 67 studies reported that short-term effects of exposure to O3 were associated with asthma exacerbations.11 Available studies focused on the short-term and instantaneous effect of O3 exposure on asthma exacerbation. However, a lack of studies investigated the cumulative and delayed effects between O3 and asthma exacerbation.
Severe air pollution events were reported in Shijiazhuang for a long time between 2010 and 2016. The daily average concentration of O3 was recorded to reach 109.5 μg/m3 in non-heating season.12 In the present study, we aimed to evaluate the lag and cumulative effect of high concentration of O3 on the risk of asthma exacerbation in Shijiazhuang. Then, we further estimated the interactive effect of O3 and SO2, NO2 on asthma exacerbation onset for a strong correlation of SO2 and O3 (r = 0.67), and NO2 and O3 (r = 0.66) found from a previous study.13 Finally, we also investigate the interaction of O3 with meteorological factors.
Methods
Study Area
Shijiazhuang, the capital of Hebei Province, is one of the most heavily polluted cities in Hebei Province and one of the largest transport hubs and industrial cities in the North China Plain. The geographical location of hospitals and air quality monitoring stations in Shijiazhuang is shown in Figure 1.
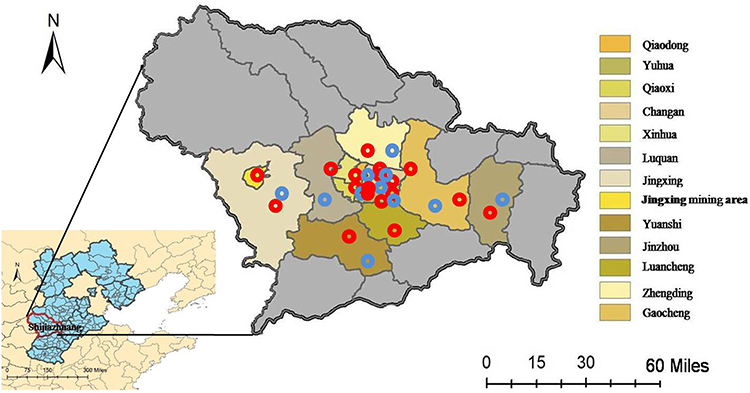 |
Figure 1 The geographical location of hospitals (red circles denote public hospitals) and air quality monitoring stations (blue circles denote air quality monitoring station) in Shijiazhuang. |
Health Data Collection
Daily counts of asthma exacerbation were obtained for the years 2010–2016 from the 22 tertiary hospitals and secondary hospitals. These hospitals accounted for 60% of tertiary hospitals and secondary hospitals and served most of the asthma patients residing in Shijiazhuang. The Electronic Medical System provided patients’ information including gender, age, admission and discharge dates, place of residence, and history of diseases. The data on asthma exacerbation was aggregated by the date of self-reported onset of exacerbation symptoms, rather than by the date of hospital admission. All the patients with the standard diagnostic criteria for asthma exacerbations in primary and secondary diagnoses were included in the analysis. Both emergency department visits and hospital admissions due to asthma were regarded as acute exacerbations of asthma. The asthma exacerbations were identified by the 9th Edition International Classification of Disease (ICD-9) code (J45.000, J45.003, J45.007, J45.100, J45.800, J45.900, 45.902, J45.903, J45.904, and J46.x00) over the study period. The patients were limited to residents in Shijiazhuang City which includes 13 counties (Qiaodong, Qiaoxi, Xinhua, Yuhua, Changan, Zhengding, Luquan, Gaocheng, Jingxing, Jingxing mining area, Yuanshi, Jinzhou, Luancheng) during 2010–2016.
Environmental Data
We used an 8-hour daily maximum O3 concentration to evaluate the risks for asthma exacerbations. The 8-hour maximum concentration represents the highest 8-hour average in the relevant 24-hour period. Available evidence suggested that O3 concentration measured as an 8-hour daily maximum was suitable for estimating the risk of asthma exacerbations.14 Daily average meteorological data including mean temperature (°C) and relative humidity (%) were extracted from the Hebei Meteorological Bureau. All the data on air pollutants and meteorological factors were collected at the national standard weather station in Shijiazhuang.
Statistical Analysis
Firstly, a descriptive analysis was performed to describe the distribution of daily concentration of O3 and asthma exacerbation cases during the study period. The over-dispersed GAMs were then used to examine the associations between O3 and asthma exacerbations for that the number of daily cases follows a quasi-Poisson distribution.15–17 For the cumulative and delayed effects of environmental factors on health outcomes, a PDLM was used to assess the effect of O3 on asthma exacerbation risk. PDLM is the distributed lag non-linear model (DLNM) that defines lag intervals through polynomial variables, which has the advantage of accounting for collinearity between different lag days and is thus more suitable for exploring the cumulative health risks of O3 exposure than single lag days or moving average.18–20 O3 was introduced into the models by establishing a cross-basis function using the PDLM to account for its potentially lagged and nonlinear effects. Degrees of freedom (df) for the splines function were chosen according to the integral generalized cross validation (GCV) method. The GCV scores can be taken as an estimate of the mean square prediction error based on the leave-one-out cross-validation estimation process. Former studies suggested that the acute effect of exposure to air pollutants on the exacerbation of respiratory conditions always happened within 7–14 days.11,21–23 Results of model diagnostics suggested that a 14-day lag period was applicable and robust for our models. Previous studies have limited the lag period to several hours to 7 days which may underestimate the cumulative effect of O3 on asthma exacerbation risk.11 Taken together, 14 days were chosen as the optimal lag period. Time-varying confounders were adjusted in models, including an indicator variable of day of week (DOW) and a binary variable of public holidays. The formula for the main model is summarized as:

Where Yt donates the daily count of asthma exacerbation cases on day t; [E(Yt)] is the expected daily count on day t; t is the calendar time; αis the intercept; β is effect estimate of interest; PDLM is the PDLM for each air pollutants to be examined; air pollutants represents other air pollutants except for O3 and was used to adjust for the influence of other pollutants on asthma exacerbation. tem and hum indicate the daily mean temperature and relative humidity, respectively. s() represents the thin-plate spline function. s(time) was used to control the seasonal and long-term trends. Holiday and DOW were adjusted for the confounding effect of public holidays and the day. The optimal df was assessed by GCV criteria which was automatically selected by R software.24 Finally, the interactions of O3and NO2, SO2, temperature, humidity were explored using a GAM with the thin plate splines function.
R software (Version 3.4.4) was used to conduct all statistical analyses using the “mgcv” package and the “spline” package. Two side p-values less than 0.05 were considered statistically.
Ethical Considerations
The work described was carried out in accordance with The Code of Ethics of the World Medical Association (Declaration of Helsinki), approved by the Ethics Committee of the Hebei Province Hospital of Traditional Chinese Medicine. Written informed consent was assent obtained from all participants prior to enrollment.
Results
Basic Variable Characteristics
The detailed statistical information on air pollutants and meteorological factors is summarized in Table 1. There were 7270 asthma patients involving 4216 males (57.9%) and 3054 females (42.1%). The daily average male-to-female ratio, average patient age, and average count of cases were 1.40, 43.1 years old, and 3.00 per day. The daily average concentrations of O3, NO2, SO2, CO, PM2.5, and PM10 were 90.8µg/m3, 60.3µg/m3, 73.3µg/m3, 2.08µg/m3, 106.9µg/m3, and 185.3µg/m3, respectively. The daily mean temperature and relative humidity were 13.2°C and 60.9%.
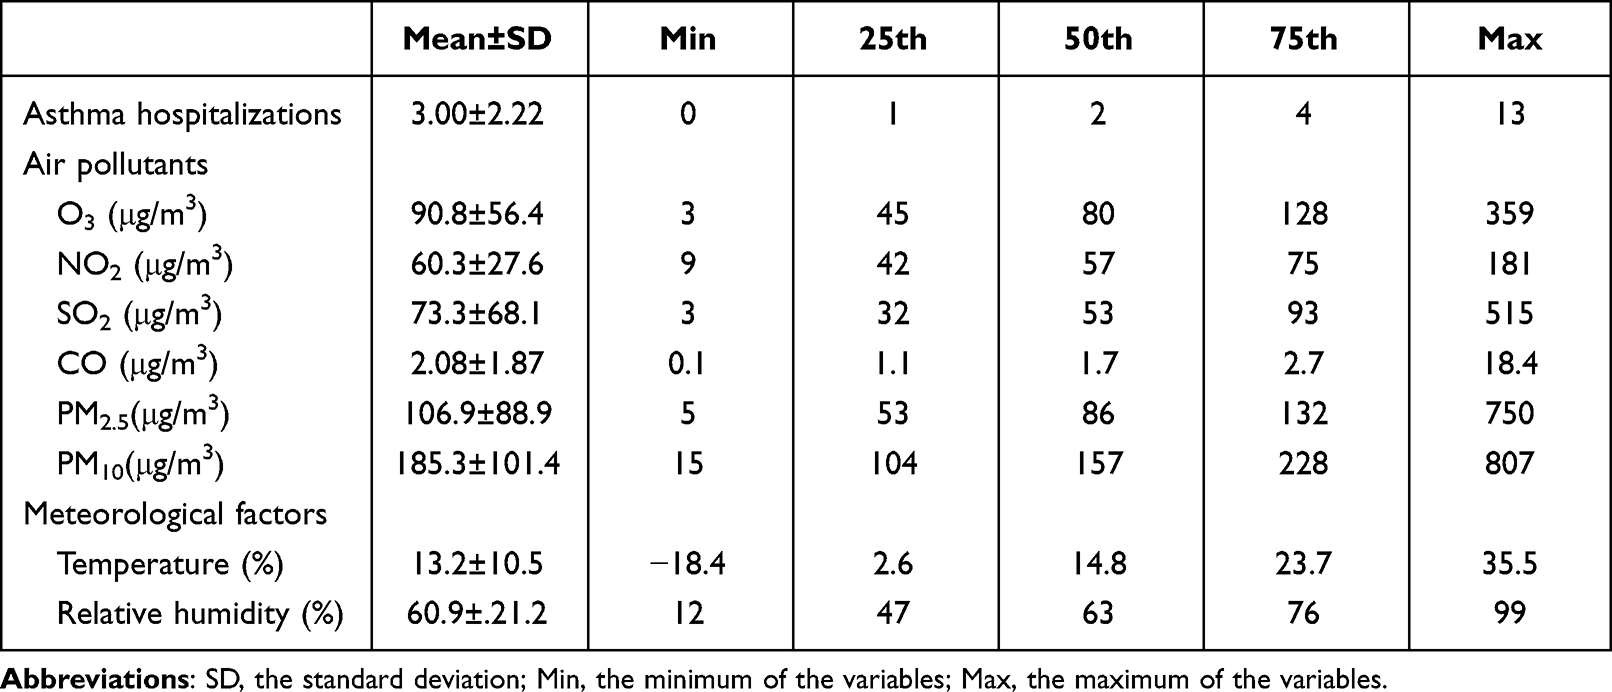 |
Table 1 Descriptive Statistics on Asthma Cases, Air Pollutants, Meteorological Factors in Shijiazhuang During 2010–2016 |
Preliminary Analysis
Figure 2 presents the time-series distributions of the daily asthma exacerbation cases and O3 concentration during the study period in Shijiazhuang. The long-term trend and seasonality of the number of asthma exacerbation cases were both mild. The concentrations of O3 were obviously higher in the warm season (May–October) than in the cold season (November–April).
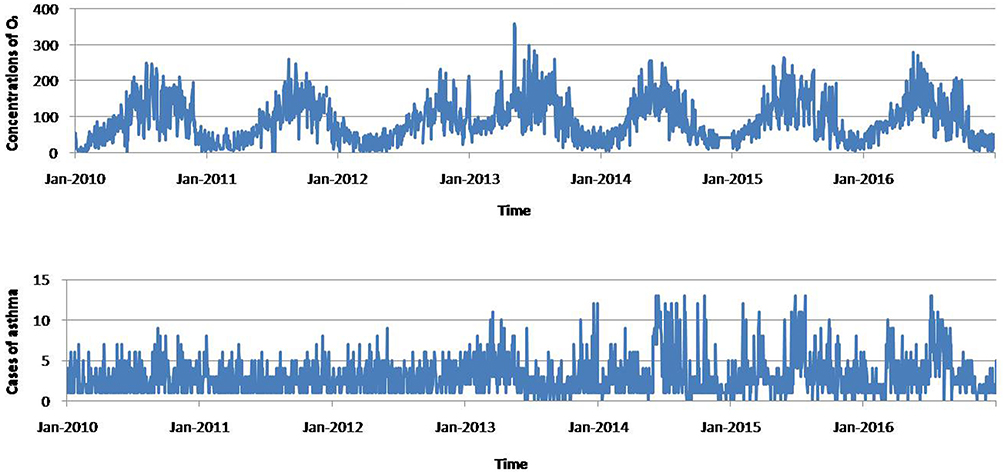 |
Figure 2 The time-series distributions of the daily asthma exacerbation cases and O3 in Shijiazhuang, China from 2010 to 2016. |
Spearman correlation coefficients for asthma exacerbation cases, meteorological factors, and air pollutants are presented in Figure 3, where all correlations were significant at the level of p less than 0.05. A medium level of correlation was observed between O3 exposure and daily asthma exacerbation cases (rs=0.505). The O3 was slightly and positively associated with SO2 (rs=0.401), NO2 (rs=0.336), temperature (rs=0.320), and humidity (rs=0.166) during the study period. The correlation coefficient between PM2.5 and PM10 was as high as 0.968, and therefore only PM2.5 was included in the models to avoid the influence of collinearity.
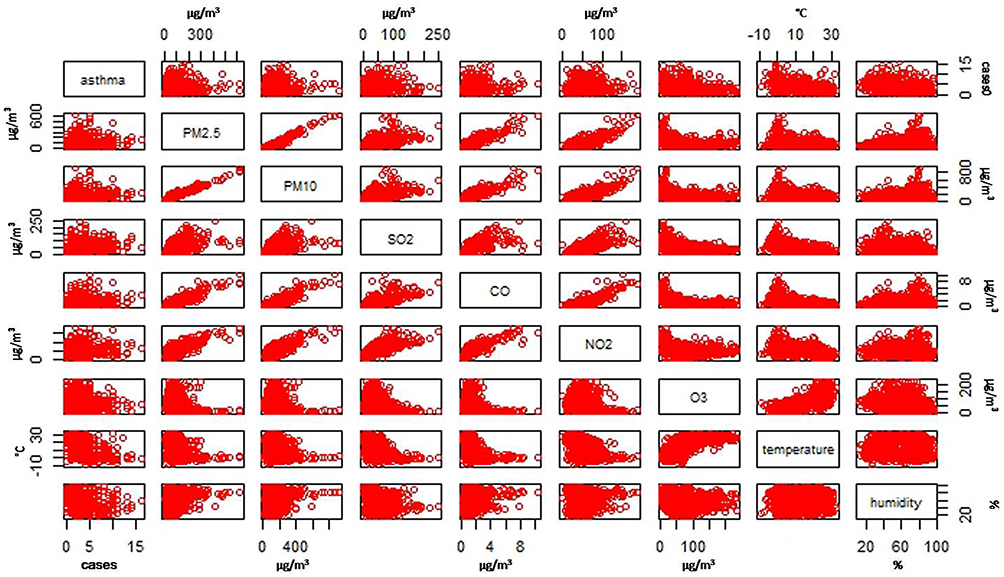 |
Figure 3 Coefficients of Spearman correlation between asthma exacerbation cases and air pollutants and meteorological factors in Shijiazhuang, China from 2010 to 2016. (Y-axis: the cases of asthma, concentration of pollution, relative humidity and temperature. X-axis: the same with the Y-axis). |
Figure 4 shows the exploratory results from the GAM. A nonlinear relationship was found between asthma exacerbation cases and O3, NO2, SO2, CO, PM2.5, PM10 as well as average temperature, while asthma exacerbation cases were linearly associated with relative humidity.
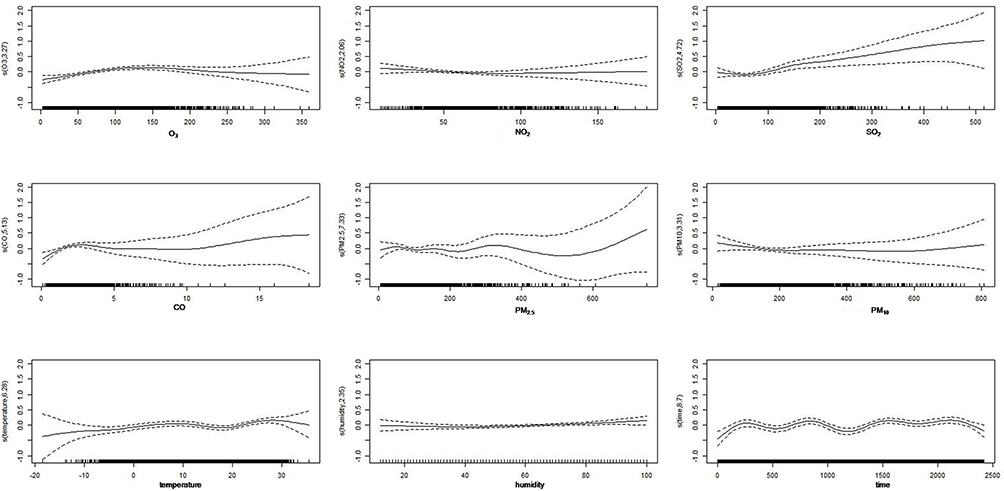 |
Figure 4 Relationship between air pollutants, meteorological variables and asthma exacerbation cases (Y-axis: the predicted value of asthma cases as the independent variables changed. X-axis: the distribution of variables (including ozone, other air pollutants, temperature, humidity and time) in the asthma patients). |
Regression and Interaction Analysis
Table 2 presents the relative risks (RRs) and 95% CIs for asthma exacerbations for different day lags of O3 concentration. The significant association for asthma exacerbations due to O3 occurred on lag 1, lag 5–10. Each 10 μg/m3 increase in O3 led to a 1.92% (95% CI = 0.80–3.03%) increase in the risk of asthma exacerbation on day lag 7. The cumulative effects of O3 on the risk of asthma exacerbation indicated an increasing trend. The cumulative risk increased 18.9% (95% CI = 12.8–25.4%) on the 14th day.
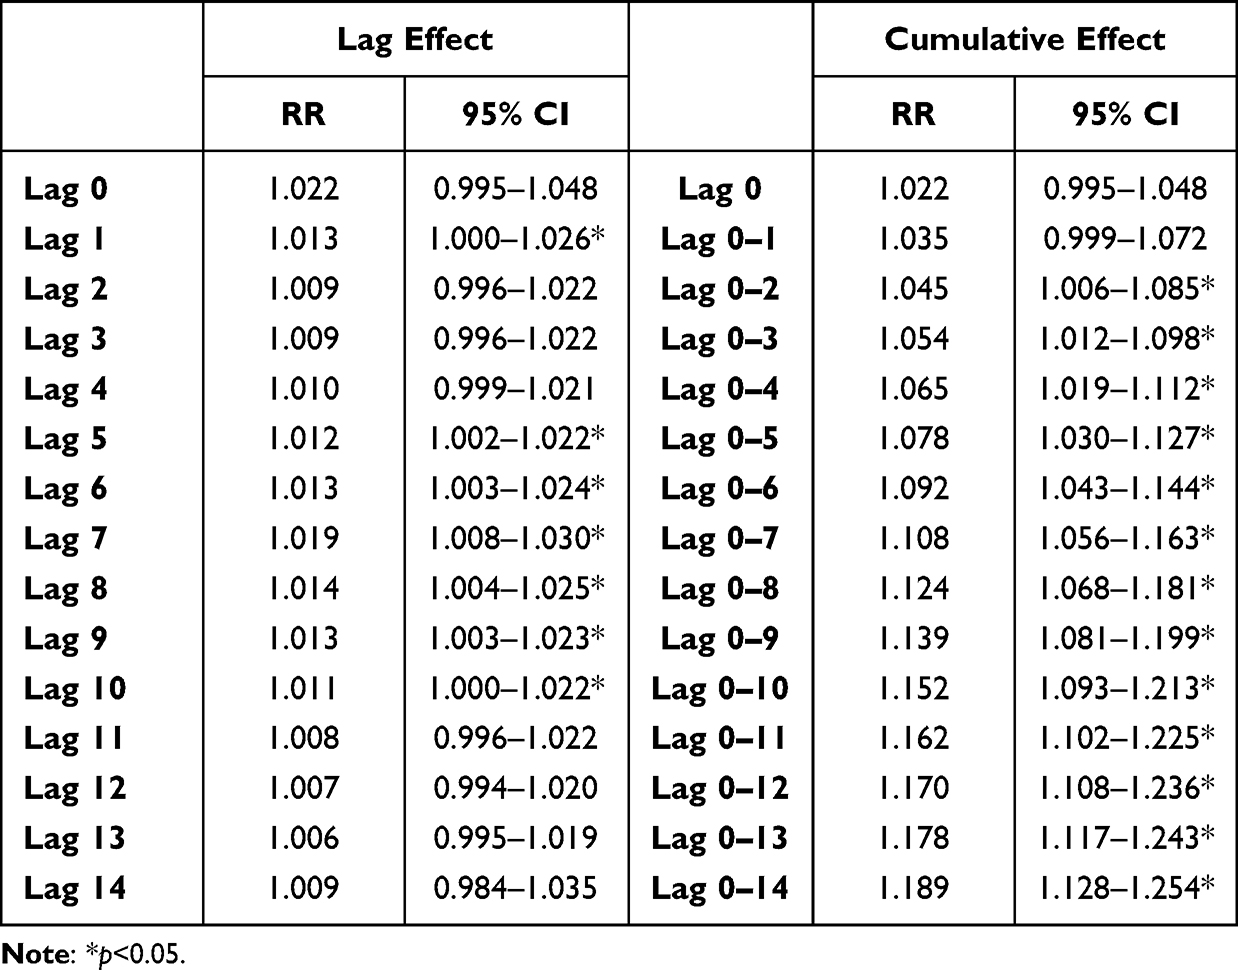 |
Table 2 Relative Risks with 95% CI of Asthma Exacerbations in Shijiazhuang During 2010–2016 Based on 10 μg/m3 Increases in the Fine Particulate Matter (O3) Concentration |
As shown in Figure 5, it is shown the interaction of O3 with NO2, SO2, temperature, and relative humidity on asthma exacerbation cases using the three-dimensional diagram. With controlling for the air pollutants, long-term trends, and seasonality, the risk of asthma exacerbation on days lag 7 increased when the O3 and SO2 concentrations were both at a high level, while its significant interactive effects with NO2, temperature, and humidity were not observed.
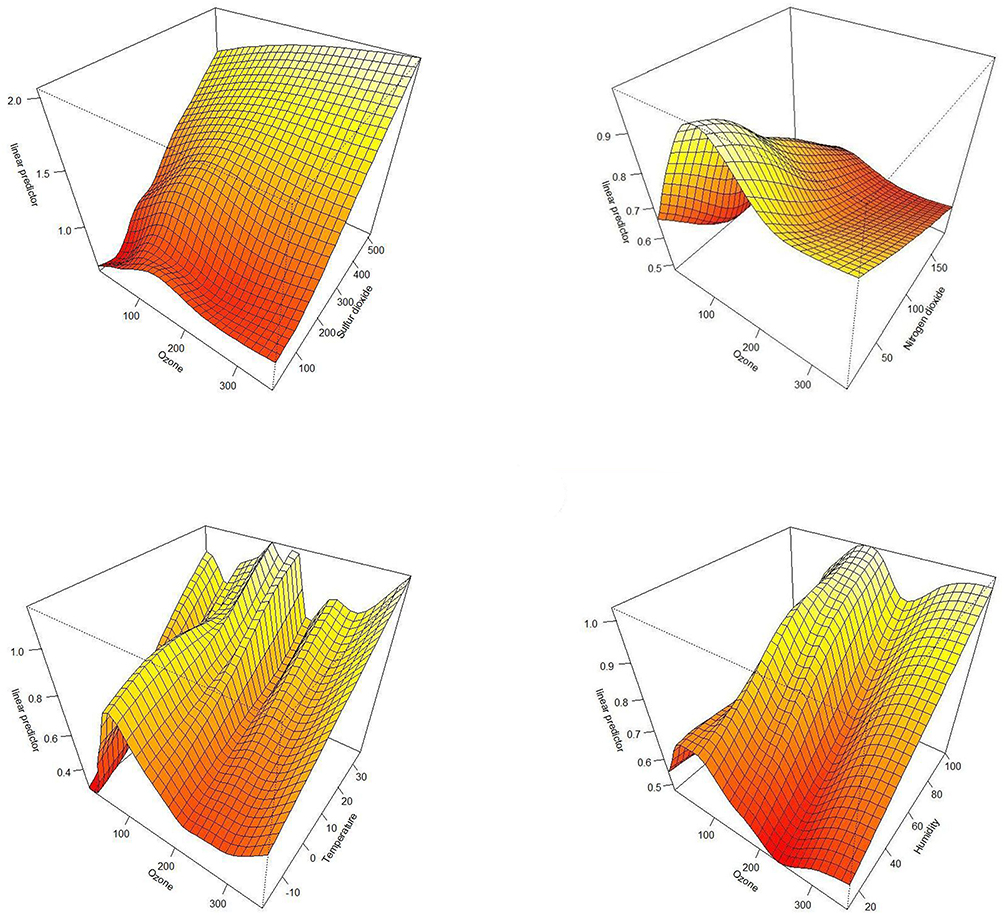 |
Figure 5 The interaction of O3 and SO2, NO2, temperature as well as relative humidity on asthma exacerbation cases at present day in Shijiazhuang, China from 2010 to 2016, the interaction of O3 with SO2 (top left); the interaction of O3 with NO2 (top right); the interaction of O3 with temperature (bottom left); the interaction of O3 with relative humidity (top right). |
Model Diagnostics
The model diagnostic was conducted with the result in Figure 6. There was no obvious autocorrelation in the deviance residual analysis. The result of the model diagnostic showed that PDLMs were robust in our study.
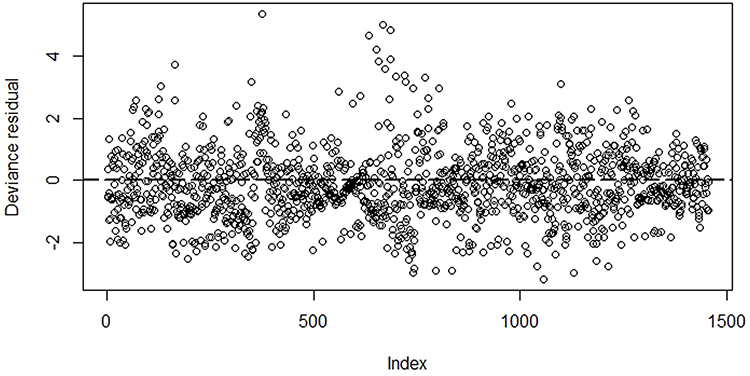 |
Figure 6 The result of model diagnostic of PDLM on 14-day lag. |
Discussion
Our study has extended the previous findings by confirming the association between high-level O3 exposure and acute exacerbation of asthma among Chinese adults and interaction with SO2. The results of this study revealed a positive and significant association of O3 exposure with asthma exacerbation. The cumulative effects of O3 on the risk of asthma exacerbation indicated an increasing trend.
A number of studies have already provided important evidences that ground-level O3 is an established trigger for exacerbating asthma and is associated with higher rates of emergency department visits for asthma.11,25 Accumulating pieces of evidence has shown that ozone-effect on asthma exacerbation almost covered all age groups of populations.26–29 Huang et al and Liu et al found that O3 exposure was significantly associated with increased risks of acute pediatric asthma attacks (aged 0–14; RR = 1.023 on the present day)26 and pediatric asthma ED visits (aged 0–18; RR = 1.009, 95% CI = 1.001–1.017).27 Robles et al provided evidence that worse asthma symptoms were strongly associated with higher O3 exposure in adolescents aged 12–17 years old (β=0.10, 95% CI = 0.004–0.20, p = 0.042).28 Linet al indicated that asthma patients with exacerbation requiring hospitalization were exposed to a higher level of 8-hour daily maximum O3 (aged ≥18 years old; OR 1.009, 95% CI 1.001 to 1.016).29 An all-age study conducted in Texas reported that the estimated risk of O3 exposure on hospital admissions for asthma was highest for children (aged 5–14; RR = 1.047, 95% CI = 1.025–1.069), lower for younger adults (aged 15–64; RR = 1.018, 95% CI = 1.005–1.032) and null for older adults (aged 0–18; RR = 1.002, 95% CI = 0.981–1.023).30 Similar results were observed in our study that an increase in O3 concentration on the exacerbation of asthma was associated with the risk of asthma exacerbation among adults aged 20–65 on day lag 7 (RR = 1.019, 95% CI = 1.008–1.030). Thus, all of this evidence reminds us that public policies on the prevention of asthma exacerbations from high-level O3 should focus on all age groups of asthma patients rather than a particular age group of the population. In addition, the results of a large and comprehensive meta-analysis suggested that O3 measured as 1-hour or 8-hour daily maximum concentration was more consistently associated with asthma exacerbations than 24-hour average concentration and this association was more robust in regions where O3 concentrations were higher.14 Therefore, our study was robust, for the concentration of O3 measured as 8-hour maximum in our study and daily average concentration of O3 remained at high levels during the study period.
Previous studies suggested that an O3 concentration at 80 µg/m3 was a threshold for an increased risk of asthma attacks, and the effect of O3 on asthma exacerbation was significant in children when the concentration was higher than 100 µg/m3.26 Our study reported that each 10 μg/m3 increase in O3 concentration was associated with a 1.92% (95% CI = 0.08–3.03%) increased risk of asthma exacerbation at lag 7 and a 17.8% (95% CI = 11.7–24.3%) increased cumulative risk of asthma exacerbation at the 14th day, taking the median concentration of O3 on 80 µg/m3 in Shijiazhuang during the study period as a reference value. Although Air Quality Standard of World Health Organization showed that the daily maximum 8-hour average ozone concentration of less than 100 µg/m3 can be considered safe, this evidence alarm that O3 has initiated to trigger the exacerbation of asthma among adults when the concentration of O3 reached 80 µg/m3. There will be a great contribution to decreasing the risk of asthma exacerbation to control the concentration of O3 under 80 µg/m3. However, there were more than 100 days per year with the concentration of O3≥80 µg/m3 in Shijiazhuang from 2010 to 2016. It is valuable to focus on that concentration of O3 from 337 major Chinese cities averaged 139 mg/m3 in 2018 and 148 mg/m3 in 2019.(http://www.mee.gov.cn) A lot of efforts still remain to be done in controlling the air pollution in Shijiazhuang and around the country in the future.
Former studies have provided much evidence that O3, NO2, and SO2 exposures were associated with emergency department visits and hospital admissions due to asthma.11 Our study firstly points to the interaction between O3 exposure and SO2, rather than NO2, on asthma exacerbations. This complex interaction is associated with the development and progression of asthma exacerbation.10 There were no direct proofs of interaction between O3 exposure and SO2 on asthma exacerbations in previous available studies, but much indirect evidence suggested that interplay exists between O3 and SO2. There was a strong correlation between O3 and SO2.13,30 A COVID-19 study conducted in 120 Chinese cities suggested that an increase of SO2 was associated with a higher risk of confirmed case counts at a high level of O3.31 Ground-level ozone concentrations are not only affected by emission reduction measures, but also by changes in meteorological conditions. Variations in temperature and relative humidity associated with changes in atmospheric circulation all that influence the photochemical reactions of O3.32 However, we did not find the interactive effect of O3 exposure and temperature as well as relative humidity on asthma exacerbations.
Our study firstly investigated the association between O3 exposure and asthma exacerbations under a high-level O3 concentration and a long lag period. A few limitations in this study were worth mentioning. Firstly, underreporting bias is unavoidable for cases of asthma exacerbations. Confirmed patients of asthma exacerbations may not be diagnosed due to atypical symptoms and included in the study. Then, the time-series study did not consider the personal influence of individual characteristics on the risk of asthma exacerbations, such as socioeconomic conditions and living and working environment. Finally, our study cannot investigate the effect from variations in emissions and meteorology separately.
Conclusions
To conclude, people with asthma disease should avoid exposure to high-level concentrations of O3, especially together with the SO2 pollution, by limiting their outdoor activities to reduce the chance of emergency department visits and hospital admissions due to asthma. The results of our study can be taken into account in designing health precaution guidelines or policies and medical resources for healthcare systems.
Ethics Approval and Consent to Participate
The work described was carried out in accordance with The Code of Ethics of the World Medical Association (Declaration of Helsinki), approved by the Ethics Committee of the Hebei Province Hospital of Traditional Chinese Medicine. Written informed consent was assent obtained from all participants prior to enrollment.
Acknowledgments
We would like to thank Hebei Environmental Protection Bureau and Hebei Meteorological Bureau for sharing the data needed for this study.
Disclosure
The authors report no conflicts of interest in this work.
References
1. GBD 2019 Risk Factors Collaborators, 2020. Global burden of 87 risk factors in 204 countries and territories, 1990–2019: a systematic analysis for the Global Burden of Disease Study. Lancet. 2019;396:1223–1249.
2. Wang YL, Wild O, Chen X, et al. Health impacts of long-term ozone exposure in China over 2013–2017. Environ Int. 2020;144:106030. doi:10.1016/j.envint.2020.106030
3. Zhou M, Wang H, Zhu J, et al. Cause-specific mortality for 240 causes in China during 1990–2013: a systematic subnational analysis for the Global Burden of Disease Study 2013. Lancet. 2016;387(10015):251–272. doi:10.1016/S0140-6736(15)00551-6
4. Tang X, et al. Atmospheric Environment and Chemistry.
5. Cohen AJ, Brauer M, Burnett R, et al. Estimates and 25-year trends of the global burden of disease attributable to ambient air pollution: an analysis of data from the Global Burden of Diseases Study 2015. Lancet. 2017;389(10082):1907–1918. doi:10.1016/S0140-6736(17)30505-6
6. Lin J, Wang W, Chen P, et al. Prevalence and risk factors of asthma in mainland China. Respir Med. 2018;4:137.
7. National Cooperative Group on Childhood A, Institute of Environmental H, Related Product Safety CCfDC. Third nationwide survey of childhood asthma in urban areas of China. Zhonghua Er Ke Za Zhi. 2013;51(10):729–735.
8. Guan WJ, Zheng X-Y, Chung KF, et al. Impact of air pollution on the burden of chronic respiratory diseases in China: time for urgent action. Lancet. 2016;388(10054):1939–1951. doi:10.1016/S0140-6736(16)31597-5
9. Achakulwisut P, Brauer M, Hystad P, et al. Global, national, and urban burdens of paediatric asthma incidence attributable to ambient NO2 pollution: estimates from global datasets. Lancet Planet Health. 2019;3(4):e166–e178. doi:10.1016/S2542-5196(19)30046-4
10. Orellano P, Reynoso J, Quaranta N, et al. Short-term exposure to particulate matter (PM10 and PM2.5), nitrogen dioxide (NO2), and ozone (O3) and all-cause and cause-specific mortality: systematic review and meta-analysis. Environ Int. 2020;142:105876. doi:10.1016/j.envint.2020.105876
11. Zheng X-Y, Orellano P, Lin H-L, et al. Short-term exposure to ozone, nitrogen dioxide, and sulphur dioxide and emergency department visits and hospital admissions due to asthma: a systematic review and meta-analysis. Environ Int. 2021;150:106435. doi:10.1016/j.envint.2021.106435
12. Qu F, Liu F, Zhang H, et al. Comparison of air pollutant-related hospitalization burden from AECOPD in Shijiazhuang, China, between heating and non-heating season. Environ Sci Pollut Res Int. 2019;26(30):31225–31233. doi:10.1007/s11356-019-06242-3
13. Dong GH, Chen T, Liu MM, et al. Gender differences and effect of air pollution on asthma in children with and without allergic predisposition: northeast Chinese children health study. PLoS One. 2011;6(7):e22470. doi:10.1371/journal.pone.0022470
14. Li X, Chen Q, Zheng X, et al. Effects of ambient ozone concentrations with different averaging times on asthma exacerbations: a meta-analysis. Sci Total Environ. 2019;691:549–561. doi:10.1016/j.scitotenv.2019.06.382
15. Zhidong L, Liu Y, Zhang Y, et al. Effect of ambient temperature and its effect modifiers on bacillary dysentery in Jinan, China. Sci Total Environ. 2018;650(Pt 2):2980. doi:10.1016/j.scitotenv.2018.10.053
16. Liu Z, Zhang J, Zhang Y, et al. Effects and interaction of meteorological factors on influenza: based on the surveillance data in Shaoyang, China. Environ Res. 2019;172:326–332. doi:10.1016/j.envres.2019.01.053
17. Liu ZD, Lao J, Zhang Y, et al. Association between floods and typhoid fever in Yongzhou, China: effects and vulnerable groups. Environ Res. 2018;167(718):718–724. doi:10.1016/j.envres.2018.08.030
18. Gasparrini A, Armstrong B, Kenward MG, et al. Distributed lag non-linear models. Stat Med. 2017;29(21):2224–2234. doi:10.1002/sim.3940
19. Gasparrini A, Leone M. Attributable risk from distributed lag models. BMC Med Res Methodol. 2014;14(1):552014. doi:10.1186/1471-2288-14-55
20. Gasparrini A, Guo Y, Hashizume M, et al. Mortality risk attributable to high and low ambient temperature: a multicountry observational study. Lancet. 2015;386(9991):369–375. doi:10.1016/S0140-6736(14)62114-0
21. Li MH, Fan L-C, Mao B, et al. Short-term exposure to ambient fine particulate matter increases hospitalizations and mortality in COPD: a systematic review and meta-analysis. Chest. 2016;149(2):447–458. doi:10.1378/chest.15-0513
22. Valeria B, Faustini A, Stafoggia M, et al. Impact of fine and ultrafine particles on emergency hospital admissions for cardiac and respiratory diseases. Epidemiology. 2010;21(3):414–423. doi:10.1097/EDE.0b013e3181d5c021
23. Sun XW, Chen PL, Ren L, et al. The cumulative effect of air pollutants on the acute exacerbation of COPD in Shanghai, China. Sci Total Environ. 2018;622(623):875–881. doi:10.1016/j.scitotenv.2017.12.042
24. Simon N. Generalized Additive Models: An Introduction with R. Vol. 49. Chapman & Hall/CRC; 2006:360–361.
25. Zheng XY, Ding H, Jiang L-N, et al. Association between air pollutants and asthma emergency room visits and hospital admissions in time series studies: a systematic review and meta-analysis. PLoS One. 2015;10(9):e0138146. doi:10.1371/journal.pone.0138146
26. Huang W, Wu J, Lin X, et al. Ozone exposure and asthma attack in children. Front Pediatr. 2022;10. doi:10.3389/fped.2022.830897
27. Liu L, Liu C, Chen R, et al. Associations of short-term exposure to air pollution and emergency department visits for pediatric asthma in Shanghai, China. Chemosphere. 2021;263:127856. doi:10.1016/j.chemosphere.2020.127856
28. Robles TF, Bai S, Meng YY. Ozone pollution, perceived support at home, and asthma symptom severity in the adolescent sample of the California Health Interview Survey. Int J Behav Med. 2022;30(3):398–408.
29. Ke Z, Liu X, Shi L, et al. Concentration-response of short-term ozone exposure and hospital admissions for asthma in Texas. Environ Int. 2017;104:139–145.
30. Wang Q, Liang Q, Li C, et al. Interaction of air pollutants and meteorological factors on birth weight in Shenzhen, China. Epidemiology. 2019;30:S57–S66. doi:10.1097/EDE.0000000000000999
31. Zhou J, Qin L, Meng X, et al. The interactive effects of ambient air pollutants-meteorological factors on confirmed cases of COVID-19 in 120 Chinese cities. Environ Sci Pollut Res Int. 2021;28(21):27056–27066. doi:10.1007/s11356-021-12648-9
32. Liu J, Wang L, Li M, et al. Quantifying the impact of synoptic circulation patterns on ozone variability in northern China from April to October 2013–2017. Atmos Chem Phys. 2019;19(23):14477–14492. doi:10.5194/acp-19-14477-2019
 © 2023 The Author(s). This work is published and licensed by Dove Medical Press Limited. The full terms of this license are available at https://www.dovepress.com/terms.php and incorporate the Creative Commons Attribution - Non Commercial (unported, v3.0) License.
By accessing the work you hereby accept the Terms. Non-commercial uses of the work are permitted without any further permission from Dove Medical Press Limited, provided the work is properly attributed. For permission for commercial use of this work, please see paragraphs 4.2 and 5 of our Terms.
© 2023 The Author(s). This work is published and licensed by Dove Medical Press Limited. The full terms of this license are available at https://www.dovepress.com/terms.php and incorporate the Creative Commons Attribution - Non Commercial (unported, v3.0) License.
By accessing the work you hereby accept the Terms. Non-commercial uses of the work are permitted without any further permission from Dove Medical Press Limited, provided the work is properly attributed. For permission for commercial use of this work, please see paragraphs 4.2 and 5 of our Terms.