Back to Journals » International Journal of Nanomedicine » Volume 9 » Issue 1
Oxygen supersaturated fluid using fine micro/nanobubbles
Authors Matsuki N, Ishikawa T, Ichiba S, Shiba N, Ujike Y, Yamaguchi T
Received 4 June 2014
Accepted for publication 19 July 2014
Published 23 September 2014 Volume 2014:9(1) Pages 4495—4505
DOI https://doi.org/10.2147/IJN.S68840
Checked for plagiarism Yes
Review by Single anonymous peer review
Peer reviewer comments 3
Noriaki Matsuki,1 Takuji Ishikawa,2 Shingo Ichiba,3 Naoki Shiba,3 Yoshihito Ujike,3 Takami Yamaguchi4
1Department of Biomedical Engineering, Graduate School of Engineering, Okayama University of Science, Okayama, 2Department of Bioengineering and Robotics, Graduate School of Engineering, Tohoku University, Sendai, 3Department of Emergency and Critical Care Medicine, Okayama University Hospital, Okayama, 4Graduate School of Biomedical Engineering, Tohoku University, Sendai, Japan
Abstract: Microbubbles show peculiar properties, such as shrinking collapse, long lifetime, high gas solubility, negative electric charge, and free radical production. Fluids supersaturated with various gases can be easily generated using microbubbles. Oxygen microbubble fluid can be very useful for oxygen delivery to hypoxic tissues. However, there have been no reports of comparative investigations into adding fluids containing oxygen fine micro/nanobubbles (OFMNBs) to common infusion solutions in daily medical care. In this study, it was demonstrated that OFMNBs can generate oxygen-supersaturated fluids, and they may be sufficiently small to infuse safely into blood vessels. It was found that normal saline solution is preferable for generating an oxygen-rich infusion fluid, which is best administered as a 30-minute intravenous infusion. It was also concluded that dextran solution is suitable for drug delivery substances packing oxygen gas over a 1-hour intravenous infusion. In addition, normal saline solution containing OFMNBs was effective for improving blood oxygenation. Thus, the use of OFMNB-containing fluids is a potentially effective novel method for improving blood oxygenation in cases involving hypoxia, ischemic diseases, infection control, and anticancer chemoradiation therapies.
Keywords: microbubble, fine micro/nanobubble, nanobubble, oxygenation, fluid oxygenation
Introduction
Fluid therapy is one of the most common initial interventions in inpatient care. Its role is the maintenance of homeostasis and the balance of fluids, electrolytes, acid-base chemical balance, and nutrition.1,2 It is also a first-line procedure for intravenous drug infusion.3 In therapeutic intervention, crystalloid solutions such as normal saline solution (NSS) or colloid solutions such as dextran and albumin are commonly used.4–6 On the other hand, lipid solutions are often used for the delivery of parenteral nutrition, vitamins, and trace elements.
Hypoxia is a condition of inadequate oxygen supply to the tissues or the body, which can lead to severe tissue damage and can even be life threatening. Tissue hypoxia can develop because of a decrease in cardiac output (ischemic hypoxia), hemoglobin concentration (anemic hypoxia), or oxygen saturation (hypoxic hypoxia), or an increase in the metabolic demands of the body.7 Moreover, hypoxia can affect pharmacologic metabolism, inducing physiological, cellular, and biochemical responses.8–10 Thus, hypoxia is often the most crucial problem to be resolved in the treatment of various diseases, especially considering that both respiration and circulation often become impaired in progressing critical care cases, a combination that can be life threatening. The management of respiration and circulation is the most essential step in intervention.
Therefore, it would be very useful if the first-line intervention of fluid therapy (infusion solution) could improve both respiration (oxygen supply) and circulation at the same time. However, the solubility of oxygen gas in fluid is limited and, to date, there are no simple devices or drugs that can help recover both functions.
Recently, microbubbles have been studied for the purpose of generating supersaturated liquids. Microbubbles are miniature gas bubbles with a diameter of <50 μm.11,12 They have been studied in a wide variety of fields, including agriculture, aquaculture, environmental water quality, and industrial manufacturing. Microbubbles have a number of unique properties that distinguish them from normal macrobubbles.13–15 First, they remain relatively stable in liquid, ie, they rise very slowly, gradually shrink, and finally collapse, a property known as “shrinking collapse”; in contrast, macrobubbles expand, rise rapidly, and burst at the liquid’s surface. In addition, microbubbles have a much higher inner pressure than the local environment, which accelerates the solubility rate of the gas into the liquid (ie, efficient gas solubility). They are also negatively charged, and thus they will not merge to form larger bubbles, and they generate free radicals such as hydroxide. The most beneficial property of microbubbles is the ability to generate supersaturated fluid thanks to their highly efficient gas solubility.
In the medical field, microbubbles have been applied in ultrasonographic diagnostic scanning,16–18 and studied for use in therapeutic applications such as drug-delivery or gene-delivery systems.17–19 Recently, there have been some reports regarding the use of microbubbles with special shell reagents for extending the duration of oxygen delivery using ultrasound for local drug delivery.20–24 However, some problems still need to be resolved, such as the biocompatibility of the shell reagents, microbubble stability, and ultrasonographic damage to the body. Considering the clinical applications for oxygen delivery, an intravenous drip infusion is preferable because infusions possess the flexibility to be administered in large quantities at once and for long periods of time. As this research moves forward, fluids containing oxygen fine micro/nanobubbles (OFMNBs) – which range in size from under 1.5 μm to nanometers in diameter – are expected to be crucial for increasing the dissolved oxygen concentration without elevating the risk of embolism, making them safer for infusion into blood vessels.
It was previously reported that the dissolved oxygen partial pressure (PO2) values of oxygen microbubble suspensions varied by the type and concentration of solvents.25 However, there have been no reports comparing OFMNB fluids to other fluids commonly used in daily medical care. The present study had three goals: 1) to determine whether fine micro/nanobubbles (FMNBs) could be used to efficiently increase the level of dissolved oxygen in liquids; 2) to ascertain which solutions are preferable for use as oxygen-rich infusion fluids; and 3) to investigate whether OFMNB-containing fluids can actually improve blood oxygenation.
Materials and methods
Solutions
Several common solutions were used in this study: 1) NSS (Otsuka Pharmaceutical Co., Ltd., Tokyo, Japan) – a crystalloid solution composed of 0.9% sodium chloride; 2) dextran 40 (Saviosol® Injection; Otsuka Pharmaceutical) – a low-molecular semi-synthetic colloid solution used as a plasma expander; 3) human plasma protein fraction (Kenketsu Albuminate® 4.4% for intravenous injection 4.4 g/100 mL; Nihon Pharmaceutical Co., Ltd., Tokyo, Japan) – an albumin solution classified as a blood-derived colloid solution; and 4) intravenous soybean oil (Intralipid® Fluid Solution 20%; Fresenius Kabi Japan Co., Ltd., Tokyo, Japan) – a lipid solution that supplies essential fatty acids. All dextran, albumin, and lipid solutions were diluted with NSS before being used in the following experiments.
Blood samples
Under general anesthesia, venous blood from a healthy swine was drawn into an autologous blood transfusion bag (Terumo Blood Bag CPDA 200 mL; Terumo Corporation, Tokyo, Japan) and stored in a refrigerator at 4°C. Procedures for the collection of blood were approved by the Ethics Review Committee for Animal Experimentation of Okayama University of Science (Okayama, Japan). Blood samples were taken from the blood bag using a disposable syringe (Terumo Syringe 2.5 mL; Terumo) to prevent the inclusion of air. The blood samples were diluted with NSS containing OFMNBs (OFMNB-NSS) into five separate solutions with blood-to-saline concentration ratios of 10%, 20%, 30%, 40%, and 50%. The blood samples diluted with OFMNB-NSS were then gently shaken for 2 minutes and used in the following experiments.
Generation of OFMNB fluid
Beakers were filled with 150 mL each of the NSS, dextran, albumin, and lipid solutions. Each solution was circulated through a micro/nanobubble (MNB) aerator (AS-MA II; ASUPU Corporation, Shizuoka, Japan) for 15 minutes, with oxygen gas supplied in a flow volume of 1.5 L/minute at 24°C–26°C (Figure 1A). After generating oxygen MNBs, each solution was immediately exposed to sonication (ASU-2; AS ONE Corporation, Osaka, Japan) for a few seconds. Sonication caused the milky-white suspensions containing oxygen MNBs (mostly microbubbles) to change to clear, colorless fluids containing OFMNBs (mostly nanobubbles). In a separate beaker containing 150 mL of ultrapure water, macrobubbles were generated through an aquarium air stone (Round Air Stone S-2S; Daiko Co. Ltd., Nagoya, Japan) for 15 minutes, with oxygen gas supplied in a flow volume of 1.5 L/minute (Figure 1B).
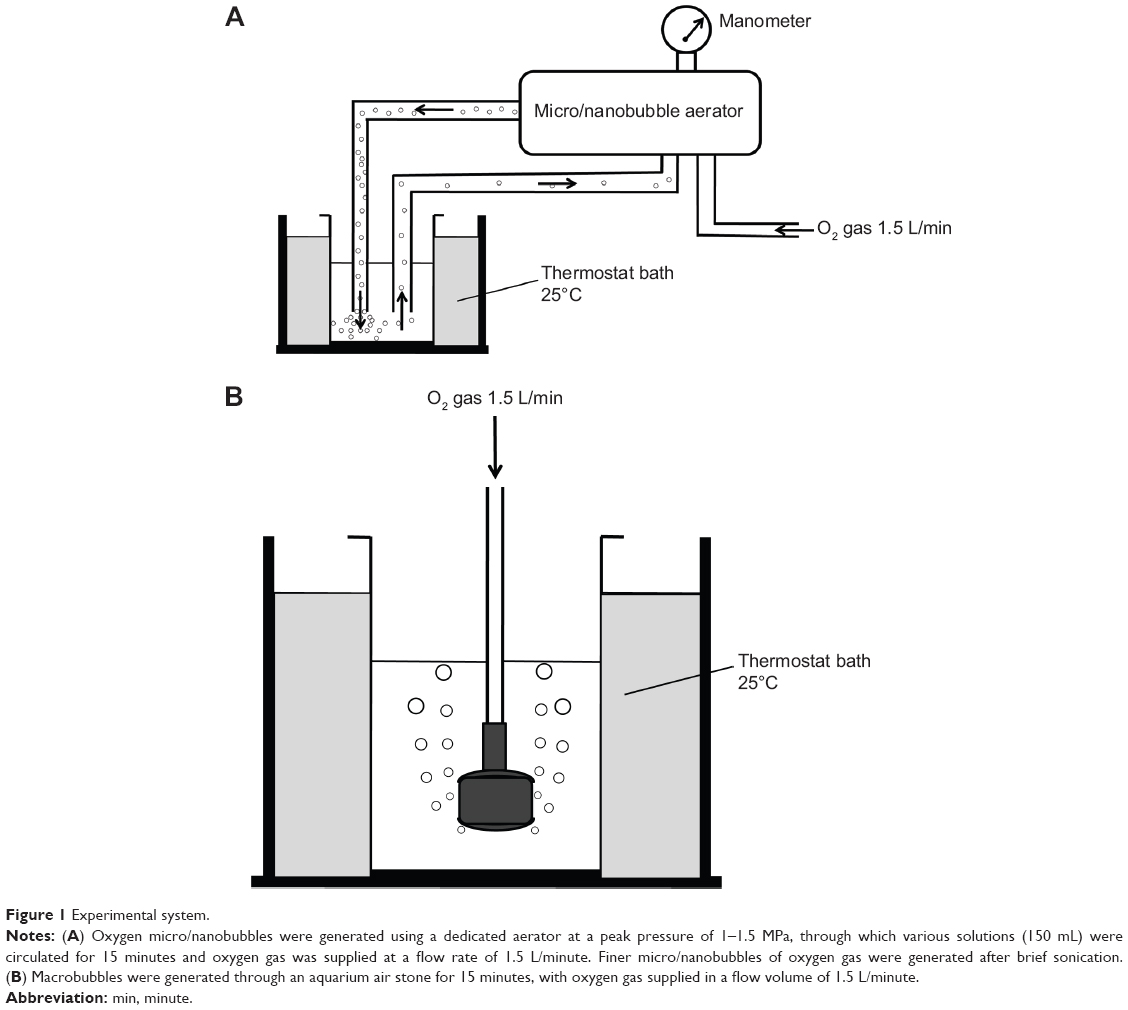 | Figure 1 Experimental system. |
Number and size distribution analysis of MNBs
About 30 mL of the ultrapure water samples containing oxygen MNBs with/without brief sonication were immediately poured into dedicated beakers. The number and size of MNBs contained in the water were then measured using a coulter counter (Multisizer™ 3; Beckman Coulter, Inc., Brea, CA, USA). Each sample was measured at a room temperature of 25°C.
Measurement of PO2 in solutions and blood samples
Exactly 30 seconds after sonication, the PO2 in each OFMNB-containing fluid was immediately measured using a blood gas analyzer (ABL510; Radiometer Medical ApS, Copenhagen, Denmark). After the aforementioned 2 minutes of gentle shaking, the PO2 in each blood sample diluted with OFMNB-NSS was also immediately measured. Each sample was measured using a disposable syringe to prevent the inclusion of air.
Statistical analysis
Data are shown as the mean ± standard error of the mean (SEM) or standard deviation (SD) of the experiments. Statistical analysis was performed using StatMate III software (ATMS Co., Ltd., Tokyo, Japan). Comparisons of means were conducted by Student’s t-tests for two groups or by one-factor analysis of variance (ANOVA), followed by post hoc tests for over three groups. In all analyses, P<0.05 was taken to indicate statistical significance.
Results
Generation of OFMNBs
To confirm the generation of OFMNBs, the bubble size and density in ultrapure water was analyzed using a coulter counter. Figure 2A shows the number and size distribution of oxygen MNBs in the ultrapure water circulated through the MNB aerator. Almost all generated bubbles were categorized as microbubbles, and the diameters of the microbubbles had two peaks: one at <10 μm in diameter (relatively fine microbubbles) and the other at 20–50 μm (relatively large microbubbles). In contrast, the microbubbles generated after brief sonication became considerably finer, with mean diameters of <1.5 μm. Almost all sonication-generated bubbles were categorized as nanobubbles to fine microbubbles, and the density of FMNBs increased approximately 100-fold after sonication (Figure 2B). These results suggest that the brief sonication after microbubble generation through the aerator is an efficient method to generate finer microbubbles.
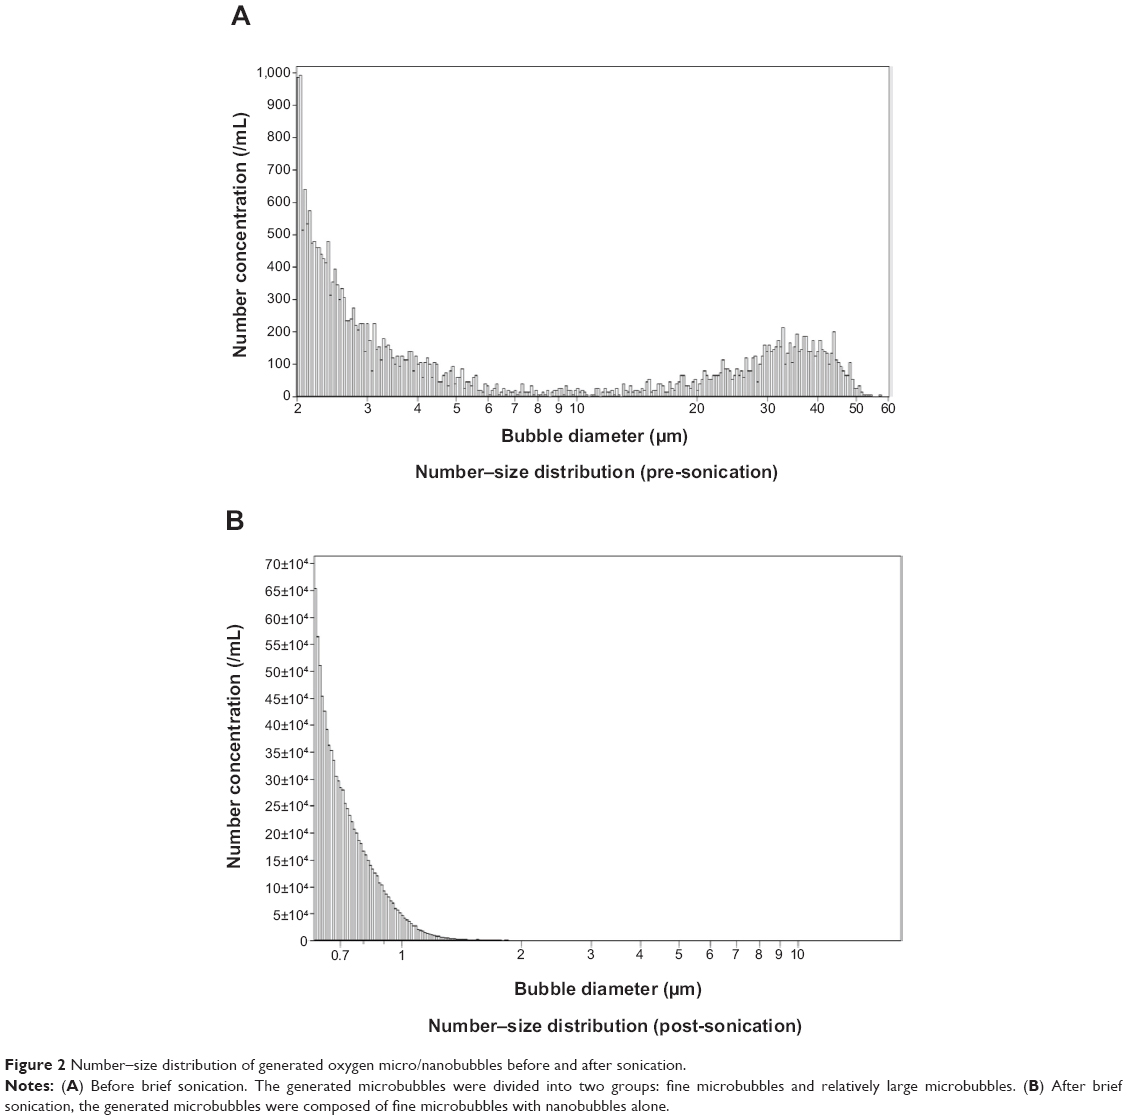 | Figure 2 Number–size distribution of generated oxygen micro/nanobubbles before and after sonication. |
Dissolved oxygen content in water with macrobubbles versus FMNBs
To examine the utility of generating FMNBs to increase the dissolved oxygen content of a liquid, the PO2 in ultrapure water was measured by blood gas analysis, and the pressures were compared between untreated water, water with macrobubbles, and water containing FMNBs (Figure 3). On average, the PO2 values (mean ± SEM) were 171.3±4.2 mmHg in the control water (P<0.01 versus (vs) macrobubbles and FMNBs), 768.1±19.6 mmHg in the macrobubble water (P<0.01 vs control and FMNBs), and 1,053.3±9.2 mmHg in the OFMNB water (P<0.01 vs control and macrobubbles). These findings indicate that OFMNBs can achieve significantly higher PO2 in ultrapure water, and thus may be effective for increasing the PO2 in other fluids.
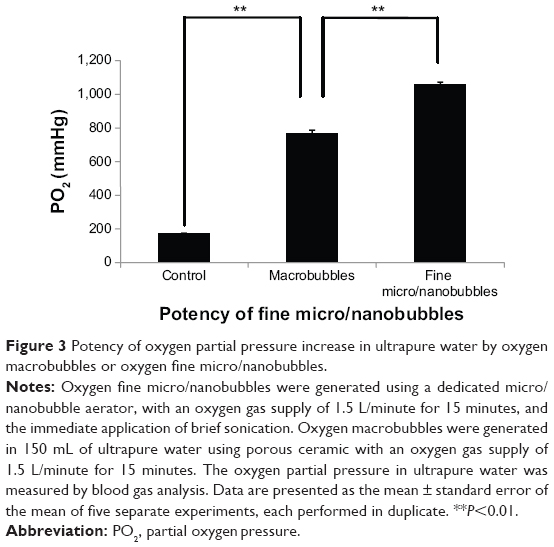 | Figure 3 Potency of oxygen partial pressure increase in ultrapure water by oxygen macrobubbles or oxygen fine micro/nanobubbles. |
Evaluation of dissolved oxygen in infusion solutions by OFMNBs
To examine the effect of common infusion solutions on the PO2 increase following OFMNB treatment, the PO2 over time was measured with blood gas analysis in the following ten solutions: NSS; dextran solution diluted with NSS at 0%, 5%, and 50% NSS concentration; albumin solution diluted with NSS at 0.5%, 1%, and 2% NSS concentration; and lipid solution diluted with NSS at 0%, 5%, and 10% NSS concentration. Figure 4A shows the time course of the PO2 values of the OFMNB-NSS. On average, the PO2 value of the OFMNB-NSS (mean ± SD) was 1,060.8±21.2 mmHg at 0 minutes, 917.0±23.3 mmHg at 15 minutes, 800.3±36.3 mmHg at 30 minutes, 692.9±34.6 mmHg at 60 minutes, and 546.2±12.4 mmHg at 120 minutes after microbubble treatment. The time course of the average PO2 of the OFMNB-NSS had two phases, with a sharp decrease from 0–30 minutes and a moderate decrease from 60–120 minutes.
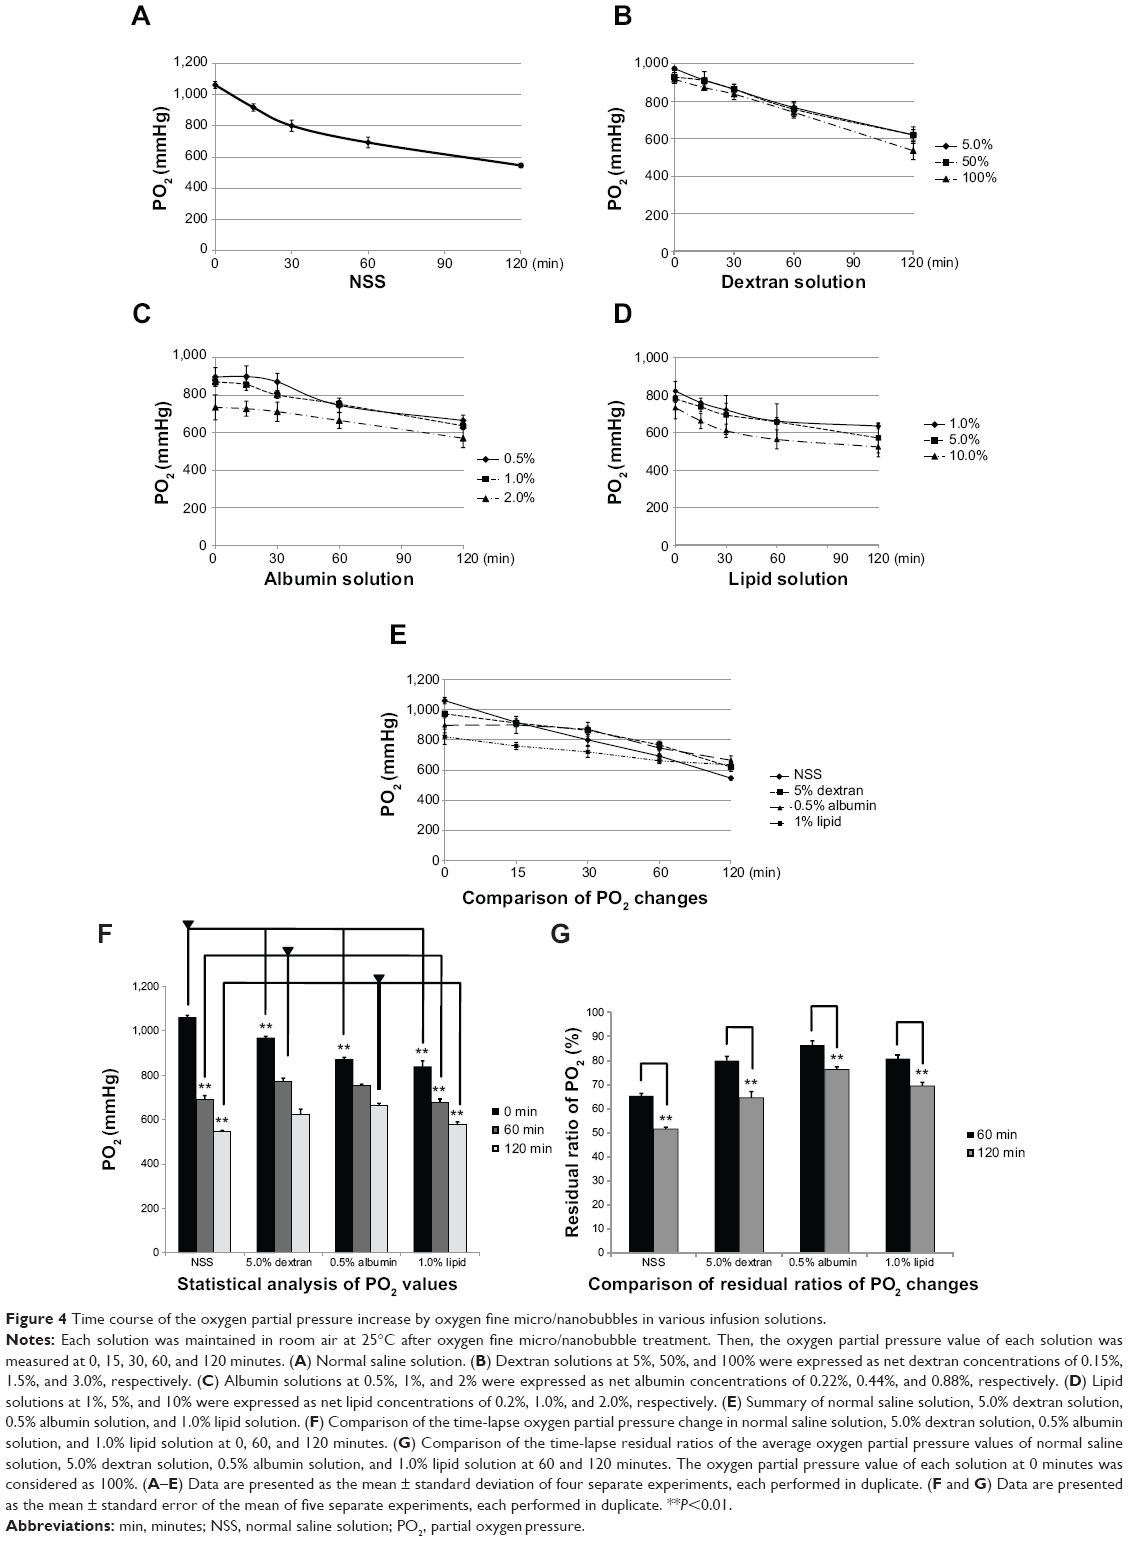 | Figure 4 Time course of the oxygen partial pressure increase by oxygen fine micro/nanobubbles in various infusion solutions. |
Figure 4B shows the time course of the PO2 values of the three dextran solutions diluted with 0%, 5%, and 50% OFMNB-NSS. On average, the PO2 values (mean ± SD) at 0 minutes were 915.8±9.0 mmHg in pure dextran solution, 929.0±23.9 mmHg in dextran solution diluted with 50% NSS, and 973.3±25.5 mmHg in dextran solution diluted with 5% NSS. By 120 minutes after microbubble treatment, these values had decreased to 581.3±28.1 mmHg, 619.6±44.1 mmHg, and 620.1±48.1 mmHg, respectively. The time course of the average PO2 of the dextran solutions containing OFMNBs decreased linearly. In addition, the concentration of the dextran solutions was only slightly affected.
The time course of the PO2 values of albumin solution diluted with NSS (0.5%, 1%, and 2%) and treated with OFMNBs is shown in Figure 4C. The PO2 values were 897.2±49.7 mmHg (mean ± SD) in 0.5% albumin solution, 870.9±21.2 mmHg in 1% albumin solution diluted with NSS, 735.1±67.1 mmHg in 2% albumin solution diluted with NSS at 0 minutes, 899.6±56.7 mmHg, 856.4±30.1 mmHg, and 727.9±40.1 mmHg at 15 minutes, 871.0±46.2 mmHg, 801.6±18.0 mmHg, and 711.9±51.8 mmHg at 30 minutes, 746.2±38.6 mmHg, 752.1±19.0 mmHg, and 665.3±19.8 mmHg at 60 minutes, and 664.9±29.0 mmHg, 636.6±19.8 mmHg, and 570.5±50.7 mmHg at 120 minutes after OFMNB treatment, respectively. Regarding the albumin solutions, macrobubbles indicative of the carbonation process common to any commercial beverages were generated and covered the entire surface of the solution. Thus, albumin solutions with low concentrations of up to 2% were examined. The time course of the average PO2 of the albumin solutions containing OFMNBs decreased moderately.
The time course of the PO2 values of lipid solution diluted with NSS (1%, 5%, 10%) and treated with OFMNBs is shown in Figure 4D. The PO2 values were 821.1±51.2 mmHg (mean ± SD) in 1% lipid solution, 779.7±18.3 mmHg in 5% lipid solution diluted with NSS, 732.4±59.0 mmHg in 10% lipid solution diluted with NSS at 0 minutes, 759.8±23.4 mmHg, 737.5±24.8 mmHg, and 662.1±41.0 mmHg at 15 minutes, 720.4±36.3 mmHg, 694.1±35.3 mmHg, and 711.9±51.8 mmHg at 30 minutes, 661.5±18.2 mmHg, 657.1±50.8 mmHg, and 563.8±96.4 mmHg at 60 minutes, and 635.1±52.5 mmHg, 571.8±14.7 mmHg, and 523.9±79.7 mmHg at 120 minutes after OFMNB treatment, respectively. As highly concentrated lipid solutions had very low PO2 values, experiments were performed using lipid concentrations of up to 10%. The time course of the average PO2 of the lipid solutions containing OFMNBs decreased moderately.
Figure 4E shows the summary of the time course of the PO2 values of NSS, 5.0% dextran solution, 0.5% albumin solution, and 1.0% lipid solution. The PO2 values of each solution gradually decreased over a period of 120 minutes. The effect of dextran, albumin, and lipid was to delay the decrease of PO2 values in solutions.
A comparison of the time-lapse changes of the average PO2 values of NSS, 5.0% dextran solution, 0.5% albumin solution, and 1.0% lipid solution at 0, 60, and 120 minutes is shown in Figure 4F. The means of each group were compared by ANOVA and the repeated measure Tukey’s post hoc test. On average, the PO2 values of NSS after OFMNB treatments were 1,060.8±9.5 mmHg (mean ± SEM) at 0 minutes (P<0.01 vs 60 and 120 minutes), 692.9±15.5 mmHg at 60 minutes (P<0.01 vs 0 and 120 minutes), 546.1±5.6 mmHg at 120 minutes (P<0.01 vs 0 and 60 minutes), 967.8±7.8 mmHg (P<0.01 vs 60 and 120 minutes), 773.6±13.1 mmHg (P<0.01 vs 0 and 120 minutes), 623.8±23.6 mmHg for 5.0% dextran solution (P<0.01 vs 0 and 60 minutes), 897.2±9.5 mmHg (P<0.01 vs 60 and 120 minutes), 746.2±8.5 mmHg (P<0.01 vs 0 and 120 minutes), 664.9±8.9 mmHg for 0.5% albumin solution (P<0.01 vs 0 and 60 minutes), and 838.3±26.3 mmHg (P<0.01 vs 60 and 120 minutes), 676.6±16.7 mmHg (P<0.01 vs 0 and 120 minutes), and 580.1±10.1 mmHg for 1.0% lipid solution (P<0.01 vs 0 and 60 minutes), respectively. Then, comparisons of the mean PO2 values of NSS, 5.0% dextran solution, 0.5% albumin solution, and 1.0% lipid solution at 0, 60, and 120 minutes were conducted by ANOVA and Tukey’s post hoc test at each time point. At 0 minutes, NSS showed the highest PO2 values (P<0.01 vs dextran, albumin, and lipid), followed by dextran (P<0.01 vs NSS, albumin, and lipid), albumin (P<0.01 vs NSS, dextran, and lipid), and lipid, which showed the lowest PO2 values (P<0.01 vs NSS, dextran, and albumin), respectively. However, dextran showed the highest PO2 values (P<0.01 vs NSS and lipid; no statistical significance [NS] vs albumin), followed by albumin (P<0.01 vs lipid; P<0.05 vs NSS; NS vs dextran) and NSS (P<0.01 vs dextran; P<0.05 vs albumin; NS vs lipid), and lipids showed the lowest PO2 values (P<0.01 vs dextran and albumin; NS vs NSS) at 60 minutes, respectively. Albumin showed the highest PO2 values (P<0.01 vs NSS and lipid; NS vs dextran), followed by dextran (P<0.01 vs NSS; NS vs albumin and lipid) and lipid (P<0.01 vs albumin; NS vs dextran and NSS), and NSS showed the lowest PO2 values (P<0.01 vs dextran and albumin; NS vs lipid) at 120 minutes, respectively. These results suggest that the lifespan of OFMNBs was dependent on the solvent.
A comparison of the time-lapse residual ratios of the average PO2 values of NSS, 5.0% dextran solution, 0.5% albumin solution, and 1.0% lipid solution at 60 and 120 minutes is shown in Figure 4G. The mean PO2 values of each group were compared using the paired Student’s t-test. The PO2 value of each solution at 0 minutes was considered as 100%. On average, the residual ratio of the PO2 value of NSS was 65.3%±1.0% (mean ± SEM) at 60 minutes and 51.5%±0.8% at 120 minutes (P<0.01) after OFMNB treatment, 80.0%±1.7% and 64.5%±2.6% for 5.0% dextran solution (P<0.01), 86.4%±1.8% and 76.3%±1.0% for 0.5% albumin solution (P<0.01), and 80.8%±1.4% and 69.4%±1.5% for 1.0% lipid solution (P<0.01), respectively. These results suggest that solutions of albumin or lipids increased the lifespan of OFMNBs.
Blood oxygenation by OFMNB-NSS
To examine the validity of blood oxygenation by OFMNB-NSS, swine venous blood was diluted with OFMNB-NSS at a ratio of 10%–50%. The PO2 values of the diluted blood samples were measured by blood gas analysis after 2 minutes of dilution treatment.
The PO2 values of blood samples at dilution ratios of 10%, 20%, 30%, and 50% with OFMNB-NSS or NSS, respectively, are shown in Figure 5A. Comparisons of means were conducted using the unpaired Student’s t-test. The average PO2 value of the control blood (without dilution) was 62.7±4.0 mmHg. The average PO2 values were 84.4±5.9 mmHg, 72.5±4.8 mmHg in blood at 10% dilution with OFMNB-NSS/NSS (P<0.05), 93.2±8.5 mmHg and 74.0±6.1 mmHg in blood at 20% dilution with OFMNB-NSS/NSS (P<0.05), 115.8±12.2 mmHg and 76.9±6.9 mmHg in blood at 30% dilution with OFMNB-NSS/NSS (P<0.05), and 179.0±23.6 mmHg and 97.9±14.0 mmHg in blood at 50% dilution with OFMNB-NSS/NSS (P<0.05), respectively. The ratios of average PO2 increase in blood samples at dilution ratios of 10%, 20%, 30%, and 50% with OFMNB-NSS or NSS, respectively, are shown in Figure 5B. The average PO2 value of the control blood was considered as 100%. The average PO2 increases were 134.2% and 109.4% in blood at 10% dilution with OFMNB-NSS/NSS, 138% and 117.6% in blood at 20% dilution with OFMNB-NSS/NSS, 148% and 122.3% in blood at 30% dilution with OFMNB-NSS/NSS, and 284.6% and 155.6% in blood at 50% dilution with OFMNB-NSS/NSS, respectively. These results suggested that OFMNB-NSS significantly increased PO2 in blood compared to NSS, and the difference in PO2 value between OFMNB-NSS and NSS increased in accordance with the dilution ratio of the blood.
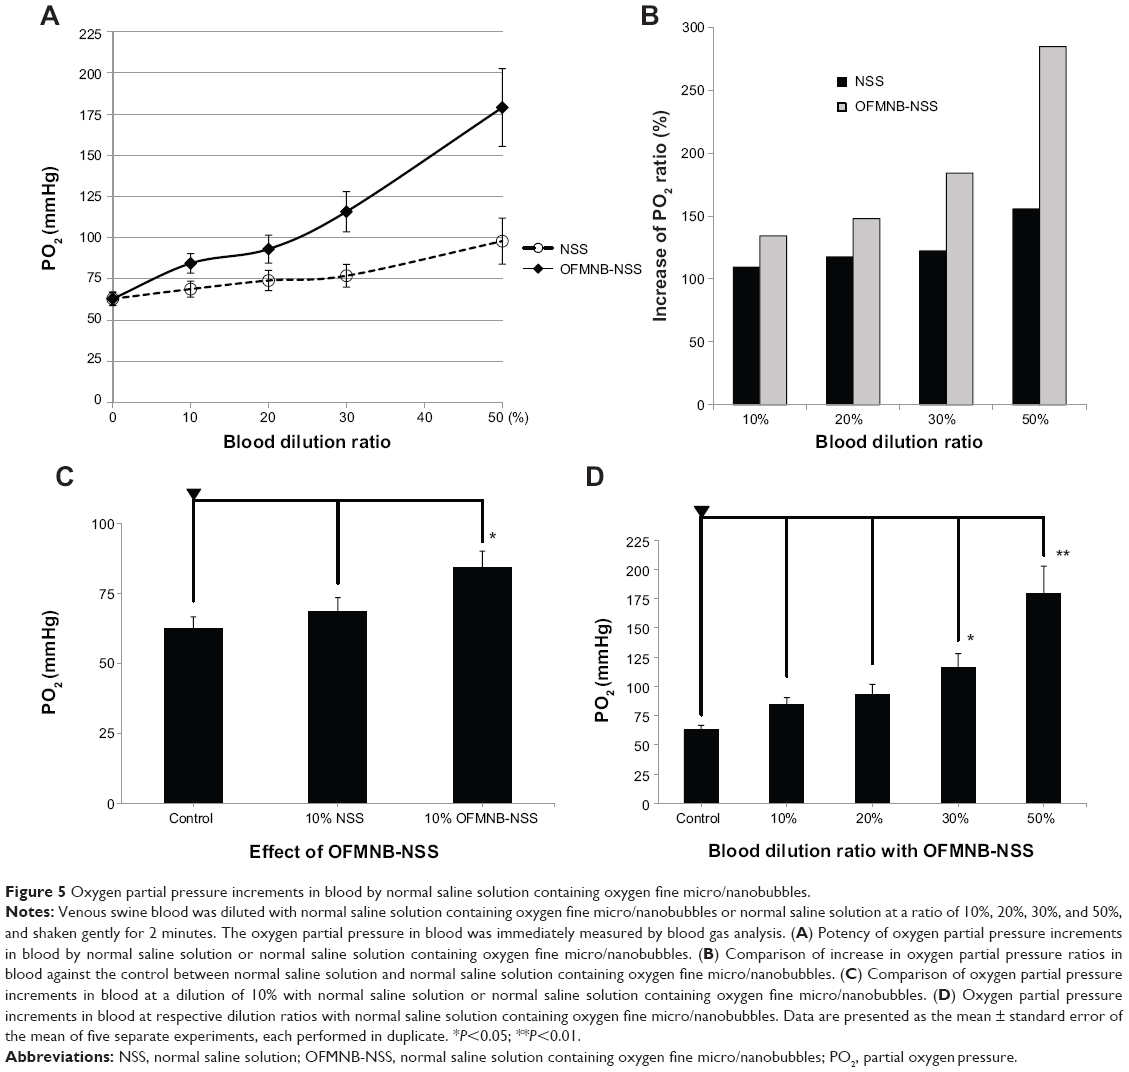 | Figure 5 Oxygen partial pressure increments in blood by normal saline solution containing oxygen fine micro/nanobubbles. |
The PO2 values at 10% dilution of NSS with/without OFMNB in blood are shown in Figure 5C. Mean PO2 values were compared by ANOVA and Tukey’s post hoc test. On average, the PO2 values were 62.7±4.0 mmHg in control venous blood (P<0.05 vs 10% OFMNB-NSS), 68.8±4.8 mmHg in blood at 10% dilution with NSS (P<0.05 vs 10% OFMNB-NSS), and 84.4±5.9 mmHg in blood at 10% dilution with OFMNB-NSS (P<0.05 vs control and 10% diluted blood with NSS). These results suggested that OFMNB-NSS significantly improved the PO2 in blood under hypoxic conditions.
The PO2 values of blood samples at dilution ratios of 10%, 30%, and 50% with OFMNB-NSS, respectively, are shown in Figure 5D. Mean PO2 values were compared using ANOVA and Dunnett’s post hoc test. The reference PO2 value was 62.7±4.0 mmHg in untreated control blood. The average PO2 values were 84.4±5.9 mmHg in blood at 10% dilution with OFMNB-NSS (NS vs control), 93.2±8.5 in blood at 20% dilution with OFMNB-NSS (NS vs control), 115.8±12.2 mmHg in blood at 30% dilution with OFMNB-NSS (P<0.05 vs control), and 179.0±23.6 mmHg in blood at 50% dilution with OFMNB-NSS (P<0.01 vs control). These results suggested that OFMNB-NSS may increase the PO2 value in hypoxic blood in accordance with the dilution ratio (mixing volume). In addition, blood at 30%–50% dilution with OFMNB-NSS significantly improved the PO2 in blood under hypoxic conditions.
Discussion
Microbubbles are miniature gas bubbles in liquids with diameters >50 μm that have a number of unique properties as described below:15–17
- Increased stability (long lifetime)
- Shrinking collapse
- Efficient high gas solubility into liquids
- Negatively charged surface
- Formation of hydroxyl free radicals.
The most beneficial property of microbubbles is the highly efficient oxygen gas solubility in infusion solutions for treatments of various diseases. The mechanism of oxygen supersaturation in liquid can be explained by the Young–Laplace equation and Henry’s law. Microbubbles tend to gradually shrink and then finally collapse. The inertial pressure of microbubbles increases with a reduction in size by the Young–Laplace equation.15 According to the increase in inertial pressure of the microbubble, oxygen in the microbubble dissolves into the surrounding liquid by Henry’s law. In case of the shrinking collapse of the microbubble, the inertial pressure theoretically reaches an infinite value and then the rate that oxygen in the microbubble dissolves into the surrounding liquid rapidly increases. Thus, the smaller the bubble size, the higher the PO2 value in liquids. The generation of much finer nanobubbles is indispensable to increase PO2 in infusion solutions. Finer nanobubbles can increase the PO2 value in fluid to a much greater extent than microbubbles.
Oxygen microbubbles present various promising useful properties to the medical fields.26–28 In the experiments here, almost all generated microbubbles after the application of sonication had diameters of <1.5 μm, which were considered as fine microbubbles, including nanobubbles, suggesting that sonication is a useful method to generate finer microbubbles with nanobubbles (Figure 2B). Sonication may divide generated microbubbles into finer MNBs. The studied FMNBs (diameter <1.5 μm) are thought to be negligibly small and clinically safe enough to be infused into blood vessels because the filter pore sizes in cardiopulmonary bypass machines are generally in the range of 28–40 μm,29 and these FMNBs will eventually shrink and finally collapse.
The PO2 values (1,053.3 mmHg) in water containing OFMNBs were significantly higher than the theoretical PO2 value (760 mmHg) and were about 38.6% greater than the maximum oxygen saturation volume (Figure 3). This efficient and high oxygen gas solubility by FMNBs may be beneficial to oxygenate hypoxic tissues.7,30–32
It was previously reported that the PO2 values in oxygen microbubble solutions were strongly affected by the solvents. NaCl and glucose inhibited increases in PO2 values of oxygen microbubbles in accordance with concentration.25
The increase in PO2 value and the lifespan after OFMNB treatments in common infusion solutions were examined to explore the capability of applying OFMNBs. NSS is a basic crystalloid solution, dextran was used as a semisynthetic colloid solution, albumin for a blood-derived colloid solution, and intravenous soybean oil was used as a lipid solution. In the experiments, the PO2 values of NSS were significantly higher than the other solutions, followed by dextran, albumin, and lipids immediately after OFMNB treatment. However, the PO2 values of dextran were the highest at 60 minutes followed by albumin, although the differences were not significant, and albumin had the highest value at 120 minutes followed by dextran (Figure 4F). Thus, OFMNB-NSS might be useful before or after 30 minutes of drip infusion and dextran solution containing OFMNBs for >1 hour of intravenous drip infusion. Albumin solution derived from blood presents a risk of infection, creates massive bubble formation, and has a relatively high cost; therefore, it might be less useful than dextran in applications for OFMNB fluid. However, the larger dextran molecules have a lower affect on PO2 values than smaller glucose molecules. These differences in molecular properties, such as viscosity and shell formation, are due to the addition of oxygen gas. Moreover, OFMNB lipid solution can be applied for intravenous drip infusion of up to 2 hours. Therefore, dextran, albumin, and lipids, or their analogs, are candidates for drug delivery with oxygen gas.
Finally, it was determined whether hypoxic swine blood was oxygenated by mixing with OFMNB-NSS. In the experiments, OFMNB-NSS increased the PO2 values in blood in accordance with the dilution ratio (Figure 5A). OFMNB-NSS showed significantly higher PO2 values than NSS at 10% dilution in blood (Figure 5C). The mean PO2 value of control blood increased from 62.7 mmHg to 84.4 mmHg by dilution with OFMNB-NSS. Given these data under conditions of pH 7.4 at 37°C, the saturation value of hemoglobin was calculated at 90.7% and 95.6% using the Hill equation, respectively.33,34 The total carbon dioxide was calculated at 920 mL for control blood and 975 mL for blood diluted with 10% OFMNB-NSS with blood volume of 5 L and serum hemoglobin concentration of 15 g/dL.35 This surplus oxygen (55 mL) corresponds to the oxygen consumption per minute of an adult brain, which is insufficient for the whole body. Therefore, the above OFMNB fluid can be locally applied to hypoxic tissues, but is insufficient for general infusion. For general infusion, further development of methods for production of finer nanobubbles with much higher density or shell reagents that can increase the stability of bubbles are needed. On the other hand, the partial pressure of dissolved carbon dioxide in blood decreased in accordance with the dilution ratio (data not shown).
OFMNB fluid can be applied to resuscitation (emergencies), hypoxia, ischemic diseases, sepsis (infection), and anticancer treatments. The brain can survive for longer periods after cardiac arrest by resuscitation. By lifting and lowering the patient’s arms or legs instead of rescue breathing and/or cardiac compression, oxygen supply and circulation can be maintained. Resuscitation (emergencies) and hypoxia are candidates for oxygen supply by general infusion of OFMNB fluid. Ischemic diseases, such as cerebral infarction and myocardial infarction, are candidates for oxygen supply by local infusion of OFMNB fluids. Under septic conditions, such as infection with anaerobic bacteria, local infusion of OFMNB fluid can be effective and can lead to a reduction in the types or volumes of antibiotics. Besides, generated free radicals have various effects on bacteria. In cancer treatment, anticancer drugs followed by radiation therapy may be more effective under aerobic conditions achieved by administration of OFMNB fluids to solvents of anticancer drugs.
Conclusion
FMNBs can generate fluids supersaturated with oxygen and may be negligibly small and clinically safe to infuse into blood vessels. The increase in PO2 in fluids by OFMNBs was affected by solvents. NSS is preferable for generation of oxygen-rich infusion solution, which is a candidate for drip infusion solution for about 30 minutes. On the other hand, dextran solution is suitable for drug delivery of substances with oxygen gas over an hour. Dextran, albumin, and lipids, or their analogs, are candidates for oxygen gas shell reagents in drug delivery systems. In addition, OFMNB-NSS effectively improved blood oxygenation. Use of OFMNB fluids represents an effective novel method for oxygenation of hypoxic conditions for resuscitation in case of cardiac arrest, general hypoxia, or ischemia. However, it has been reported that microbubbles also cause tissue damage as well as free radical production and that oxygen itself can be toxic.28,36–38 Therefore, further studies of FMNBs are required to improve methods to generate OFMNB fluids and to assess the effects of the fluids in the body.
Acknowledgments
This study was supported by Grants-in-Aid for Scientific Research (C) from the Japan Society for the Promotion of Science (JSPS; No. 24500524) and Grant-in-Aid for Specially Promoted Research by The Ministry of Education, Culture, Sports, Science, and Technology (MEXT; No. 25000008 “Integrated Nano-Biomechanics”).
Disclosure
The authors report no conflicts of interest in this work.
References
Biesalski HK, Bischoff SC, Boehles HJ, Muehlhoefer A. Water, electrolytes, vitamins and trace elements – Guidelines on Parenteral Nutrition, Chapter 7. Ger Med Sci. 2009;7:Doc21. | ||
Westphal M. Get to the point in intensive care medicine – the sooner the better? Crit Care. 2013;17(Suppl 1):S8. | ||
Wujtewicz M. Fluid use in adult intensive therapy. Anesthesiol Intensive Ther. 2012;44(2):92–95. | ||
Schick MA, Isbary JT, Stueber T, et al. Effects of crystalloids and colloids on liver and intestine microcirculation and function in cecal ligation and puncture induced septic rodents. BMC Gastroenterol. 2012;12:179. | ||
Sharma P, Benford B, Karaian JE, Keneally R. Effects of volume and composition of the resuscitative fluids in the treatment of hemorrhagic shock. J Emerg Trauma Shock. 2012;5(4):309–315. | ||
Bartels K, Thiele RH, Gan TJ. Rational fluid management in today’s ICU practice. Crit Care. 2013;17(Suppl 1):S6. | ||
Abdelsalam M, Cheifetz IM. Goal-directed therapy for severely hypoxic patients with acute respiratory distress syndrome: permissive hypoxemia. Respir Care. 2010;55(11):1483–1490. | ||
Taylor CT, Moncada S. Nitric oxide, cytochrome C oxidase, and the cellular response to hypoxia. Arterioscler Thromb Vasc Biol. 2010; 30(4):643–647. | ||
Ward DS, Karan SB, Pandit JJ. Hypoxia: developments in basic science, physiology and clinical studies. Anaesthesia. 2011;66(Suppl 2): 19–26. | ||
Donovan L, Welford SM, Haaga J, LaManna J, Strohl KP. Hypoxia – implications for pharmaceutical developments. Sleep Breath. 2010;14(4):291–298. | ||
Kurup N, Naik P. Microbubbles: a novel delivery system. Asian Journal of Pharmaceutical Research and Health Care. 2010;2(3):228–234. | ||
Qin S, Caskey CF, Ferrara KW. Ultrasound contrast microbubbles in imaging and therapy: physical principles and engineering. Phys Med Biol. 2009;54(6):R27–R57. | ||
Takahashi M, Kawamura T, Yamamoto Y, Ohnari H, Himuro S, Shakutsui H. Effect of shrinking microbubble on gas hydrate formation. J Phys Chem B. 2003;107(10):2171–2173. | ||
Takahashi M. ζ potential of microbubbles in aqueous solutions: electrical property of the gas–water interface. J Phys Chem B. 2005; 109(46):21858–21864. | ||
Takahashi M, Chiba K, Li P. Free-radical generation from collapsing microbubbles in the absence of a dynamic stimulus. J Phys Chem B. 2007;111(6):1343–1347. | ||
Badea R, Seicean A, Diaconu B, et al. Contrast-enhanced ultrasound of the pancreas – a method beyond its potential or a new diagnostic standard? J Gastrointestin Liver Dis. 2009;18(2):237–242. | ||
Dijkmans PA, Juffermans LJ, Musters RJ, et al. Microbubbles and ultrasound: from diagnosis to therapy. Eur J Echocardiogr. 2004;5(4):245–256. | ||
Lapotko D. Plasmonic nanobubbles as tunable cellular probes for cancer theranostics. Cancers (Basel). 2011;3(1):802–840. | ||
Juffermans LJ, Dijkmans PA, Musters RJ, et al. Local drug and gene delivery through microbubbles and ultrasound: a safe and efficient alternative for viral vectors? Neth Heart J. 2004;12(9):394–399. | ||
Xu Q, Nakajima M, Liu Z, Shiina T. Biosurfactants for microbubble preparation an application. Int J Mol Sci. 2011;12(1):462–475. | ||
Ferrara KW, Borden MA, Zhang H. Lipid-shelled vehicles: engineering for ultrasound molecular imaging and drug delivery. Acc Chem Res. 2009;42(7):881–892. | ||
Juffermans LJ, Dijkmans PA, Musters RJ, Visser CA, Kamp O. Transient permeabilization of cell membranes by ultrasound-exposed microbubbles is related to formation of hydrogen peroxide. Am J Physiol Heart Circ Physiol. 2006;291(4):H1595–H1601. | ||
Cavalli R, Bisazza A, Giustetto P, et al. Preparation and characterization of dextran nanobubbles for oxygen delivery. Int J Pharm. 2009;381(2): 160–165. | ||
Swanson EJ, Mohan V, Kheir J, Borden MA. Phospholipid-stabilized microbubble foam for injectable oxygen delivery. Langmuir. 2010; 26(20):15726–15729. | ||
Matsuki N, Ichiba S, Ishikawa T, et al. Blood oxygenation using microbubble suspensions. Eur Biophys J. 2012;41(6):571–578. | ||
Barbosa FT, Juca MJ, Castro AA, Duarte JL, Barbosa LT. Artificial oxygen carriers as a possible alternative to red cells in clinical practice. Sao Paulo Med J. 2009;127(2):97–100. | ||
Betit P. Extracorporeal membrane oxygenation: quo vadis? Respir Care. 2009;54(7):948–957. | ||
Kulikovsky M, Gil T, Mattanes I, Karmeli R, Har-Shai Y. Hyperbaric oxygen therapy for non-healing wounds. Isr Med Assoc J. 2009;11(8): 480–485. | ||
Barak M, Katz Y. Microbubbles: pathophysiology and clinical implications. Chest. 2005;128(4):2918–2932. | ||
Bitterman H. Bench-to-bedside review: oxygen as a drug. Crit Care. 2009;13(1):205. | ||
Raoof S, Goulet K, Esan A, Hess DR, Sessler CN. Severe hypoxemic respiratory failure: part 2 – nonventilatory strategies. Chest. 2010; 137(6):1437–1448. | ||
Guo S, Dipietro LA. Factors affecting wound healing. J Dent Res. 2010; 89(3):219–229. | ||
Dash RK, Bassingthwaighte JB. Erratum to: blood HbO2 and HbCO2 dissociation curves at varied O2, CO2, pH, 2,3-DPG and temperature levels. Ann Biomed Eng. 2010;38(4):1683–1701. | ||
Goutelle S, Maurin M, Rougier F, et al. The Hill equation: a review of its capabilities in pharmacological modeling. Fundam Clin Pharmacol. 2008;22(6):633–648. | ||
Scholz AW, Eberle B, Heussel CP, et al. Ventilation–perfusion ratio in perflubron during partial liquid ventilation. Anesth Analg. 2010;110(6): 1661–1668. | ||
Dennery PA. Oxygen administration in the care of neonates: a double-edged sword. Chin Med J (Engl). 2010;123(20):2938–2942. | ||
Wang C, Zhang X, Liu F, Paule MG, Slikker W Jr. Anesthetic-induced oxidative stress and potential protection. Scientific World Journal. 2010; 10:1473–1482. | ||
Allen BW, Demchenko IT, Piantadosi CA. Two faces of nitric oxide: implications for cellular mechanisms of oxygen toxicity. J Appl Physiol (1985). 2009;106(2):662–667. |
 © 2014 The Author(s). This work is published and licensed by Dove Medical Press Limited. The
full terms of this license are available at https://www.dovepress.com/terms
and incorporate the Creative Commons Attribution
- Non Commercial (unported, 3.0) License.
By accessing the work you hereby accept the Terms. Non-commercial uses of the work are permitted
without any further permission from Dove Medical Press Limited, provided the work is properly
attributed. For permission for commercial use of this work, please see paragraphs 4.2 and 5 of our Terms.
© 2014 The Author(s). This work is published and licensed by Dove Medical Press Limited. The
full terms of this license are available at https://www.dovepress.com/terms
and incorporate the Creative Commons Attribution
- Non Commercial (unported, 3.0) License.
By accessing the work you hereby accept the Terms. Non-commercial uses of the work are permitted
without any further permission from Dove Medical Press Limited, provided the work is properly
attributed. For permission for commercial use of this work, please see paragraphs 4.2 and 5 of our Terms.