Back to Journals » International Journal of Nanomedicine » Volume 15
Oxygen Functional Groups on MWCNT Surface as Critical Factor Boosting T2 Relaxation Rate of Water Protons: Towards Improved CNT-Based Contrast Agents
Authors Tomczyk MM ![]() , Boncel S
, Boncel S ![]() , Herman A
, Herman A ![]() , Krawczyk T, Jakóbik-Kolon A
, Krawczyk T, Jakóbik-Kolon A ![]() , Pawlyta M
, Pawlyta M ![]() , Krzywiecki M
, Krzywiecki M ![]() , Chrobak A, Minoshima M, Sugihara F, Kikuchi K, Kuźnik N
, Chrobak A, Minoshima M, Sugihara F, Kikuchi K, Kuźnik N ![]()
Received 14 April 2020
Accepted for publication 18 August 2020
Published 6 October 2020 Volume 2020:15 Pages 7433—7450
DOI https://doi.org/10.2147/IJN.S257230
Checked for plagiarism Yes
Review by Single anonymous peer review
Peer reviewer comments 2
Editor who approved publication: Prof. Dr. Anderson Oliveira Lobo
Mateusz Michał Tomczyk,1 Sławomir Boncel,1 Artur Herman,2 Tomasz Krawczyk,1 Agata Jakóbik-Kolon,1 Mirosława Pawlyta,3 Maciej Krzywiecki,4 Artur Chrobak,5 Masafumi Minoshima,6 Fuminori Sugihara,7 Kazuya Kikuchi,6 Nikodem Kuźnik1
1Faculty of Chemistry, Silesian University of Technology, Gliwice, Poland; 2Department of Semiconductor Materials Engineering, Faculty of Fundamental Problems of Technology, Wroclaw University of Science and Technology, Wrocław, Poland; 3Faculty of Mechanical Engineering, Silesian University of Technology, Gliwice, Poland; 4Institute of Physics – Center for Science and Education, Silesian University of Technology, Gliwice, Poland; 5August Chełkowski Institute of Physics, University of Silesia, Katowice, Poland; 6Graduate School of Engineering, Osaka University, Osaka, Japan; 7Immunology Frontier Research Center, Osaka University, Osaka, Japan
Correspondence: Nikodem Kuźnik; Sławomir Boncel Email [email protected]; [email protected]
Purpose: Salicyl (Sal) – among other oxygen functionalities – multi-walled carbon nanotubes (MWCNTs) and their nanohybrids are investigated as promising contrast agents (CA) in magnetic resonance imaging (MRI) or drug delivery platforms, due to their unique properties. The preliminary results and the literature reports were the motivation to endow high r2 relaxivities, excellent dispersibility in water, and biocompatibility to superparamagnetic MWCNTs nanohybrids. It was hypothesized that these goals could be achieved by, not described in the literature yet, two-stage oxygen functionalization of MWCNTs.
Results: Two structurally different MWCNT materials differing in diameters (44 and 12 nm) and the iron content (4.7% and 0.5%) are studied toward the functionalization effect on the T2 relaxometric properties. MWCNT oxidation is typically the first step of functionalization resulting in “first generation” oxygen functional groups (OFGs) on the surface. Until now, the impact of OFGs on the relaxivity of MWCNT was not truly recognized, but this study sheds light on this issue. By follow-up functionalization of oxidized MWCNT with 4-azidosalicylic acid through [2+1] cycloaddition of the corresponding nitrene, “second generation” of oxygen functional groups is grafted onto the nanohybrid, ie, Sal functionality.
Conclusion: The introduced OFGs are responsible for an almost 30% increase in the relaxivity, which leads to remarkable r2 relaxivity of 951 mM− 1s− 1 (419 (mg/mL)− 1s− 1), the unprecedented value reported to date for this class of CAs. Also, the resulting nanohybrids express low cytotoxicity and superb diffusion after subcutaneous injection to a mouse.
Keywords: multi-walled carbon nanotubes, magnetic resonance imaging, MRI contrast agents, carbon nanotube functionalization, T2 relaxivity
Introduction
One of the major paradigms of medicine development is efficient prevention and diagnosis during the early stages of diseases. Here, diagnosis plays a crucial role, particularly if the first symptoms of pathological changes can be identified. Magnetic resonance imaging (MRI) has been invaluable in this mission due to its non-invasive character, lack of penetration depth limits, and high spatial resolution.1 Despite these numerous advantages, paramagnetic substances, so-called contrast agents (CAs), which increase the relaxation rate of water protons, are often used to increase the diagnostic value of tomography. Yet, despite their utility, there is still a large room for further improvement2,3 which could be accomplished using carbon nanotube (CNT)-based CAs which have recently seen rapid development. Multi-walled carbon nanotubes (MWCNTs) display outstanding features such as chemical stability,4 high electrical conductivity,5 and large surface area.6 These properties make them key candidates for drug delivery systems and potential therapeutics.7 Moreover, one application does not exclude the other, which opens the route to “theranostics” in which agents act both as therapeutics and diagnostics tools.8,9 In such systems, apart from the diagnostic potential of MWCNTs, they can act as selective nanocarriers of drugs (eg, anticancer 5-fluorouracil) attached to the surface through nitrene chemistry or by selective adsorption by appropriate functional groups.8
MRI CAs follow the general mechanism of action based upon the dissipation of energy of water protons excited by a strong magnetic field.10 Since specific relaxation times of protons are translated into a computer image (for instance T1-weighted scanning), CA localized in particular regions in organisms may alter the signal and deliver additional diagnostic value. For this reason, MRI CAs often exhibit magnetic properties – paramagnetism as in the case of common gadolinium complexes or superparamagnetism for superparamagnetic iron oxides (SPIONs), or ferromagnetism as in the case of Fe-filled MWCNTs (Fe@MWCNTs). Currently, two major routes toward MWCNT-CAs have been developed: MWCNTs are decorated with magnetic nanoparticles or magnetic nanoparticles are encapsulated inside MWCNTs. Depending on the type of magnetic nanoparticles MWCNT-CAs may act as T1 CAs, when Gd3+ ions11 or Gd-containing nanoparticles12 are used, while α-Fe,13–16 Fe3+ ions,15,16 and SPIONs17–19 typically lead to T2 CAs.
Decoration of MWCNTs with magnetic species is a step-by-step process involving functionalization of the carbon surface, which yields linkers between MWCNT and magnetic nanoparticles – typically Gd3+ ions11 or SPIONs.18 MWCNT surface can be oxidized by HNO3:H2SO4 mixture to generate carboxylic moieties on the MWCNT surface which act as ligands itself15 or as an anchor for ligands such as aminophenol compounds for Fe3+ ions coordination16 or lactose-glycine adducts which form stable complexes with SPIO.18 On the other hand, ligands for Gd3+ can be also introduced next to the already existing carboxylic groups by follow-up reactions of amino groups introduced through 1,3-dipolar cycloaddition.11 The range of functionalization approaches of MWCNT with magnetic species is very wide and analyzed in detail by us in a separate article.24
One of the major disadvantages of exohedral functionalization with paramagnets is that magnetic species are not protected from the environment by the carbon shell, which may lead to decomposition or transmetalation in vivo, eg, the undesired release of Gd3+ bears the risk of nephrogenic systemic fibrosis.3 While nanohybrids are typically water-dispersible, the effective carbon surface is reduced, making further functionalization more difficult.
In comparison, the encapsulation of magnetic nanoparticles, mainly iron, inside MWCNTs is an inherent consequence of the c-CVD process which forms core-shell structures, where the carbon shell protects the iron core from decomposition. The theranostic functionality of such nanohybrids was assessed for bifunctional agents: (a) improving contrast in MRI and (b) allowing laser ablation of tumors in mice.9 Furthermore, the carbon surface remains exposed, which allows it to be functionalized with a variety of functional groups and compounds necessary to provide it with hydrophilicity, biocompatibility, and other functionalities necessary, eg, for theranostic systems.13 Here, the main route of MWCNT functionalization consists of surface oxidation by wet techniques which themselves produce nanohybrids that can form stable aqueous dispersions.15,16,20 Moreover, carboxylic groups produced in the process are used as covalent or non-covalent anchors for biocompatible polymers, eg, polyethylene glycol (PEG),16,21 polystyrene sulfonate (PSS), or polyethylenimine (PEI).22 Relaxivities r2 reported for these Fe@MWCNT CAs range from 22 mM−1s−1 to 564 mM−1s−1 (Table 1).9,15,16,21,23 The broad scale of these r2-values arises from the fact that multiple Fe@MWCNTs properties have been reported to affect the T2 relaxation rate, including their diameter, length, iron content, phase composition of the magnetic core, size of the iron core, and amount and type of functional groups on the surface24 (Table 1). Based on mainly ferromagnetic and paramagnetic behavior of iron particles inside Fe@MWCNTs, the mode of action as T2 CAs can be compared with, eg, albumin coated ferromagnetic iron oxide nanoparticles where the magnetic core is also separated from water molecules by a large protein coating. We hypothesized that in the case of Fe@MWCNTs main phenomena involved in the T2 relaxation process are the diffusion rate of water inside the induced magnetic field, the strength of the magnetic field, and the distance between the ferromagnetic center and water molecules (Figure 1A-C).25 These factors are generally consistent with the classical outer sphere relaxation mechanism.10,26 Here, increasing distance from the magnetic center lowers an effective magnetic field affecting water molecules; thus, that parameter can be considered constant for Fe@MWCNTs of a particular size, where the thickness of the CNT walls would govern the closest distance of water molecules to the magnetic center.25 Hence, we hypothesized that oxygen functional groups such as hydroxyl and carboxyl groups would play an important role in the relaxation of Fe@MWCNTs improving diffusion rate of water molecules and influence processes such as: (a) the attraction of water molecules towards intrinsically hydrophobic MWCNTs, (b) rapid and efficient exchange of water molecules, (c) increase of dispersibility in an aqueous environment and overall biocompatibility.
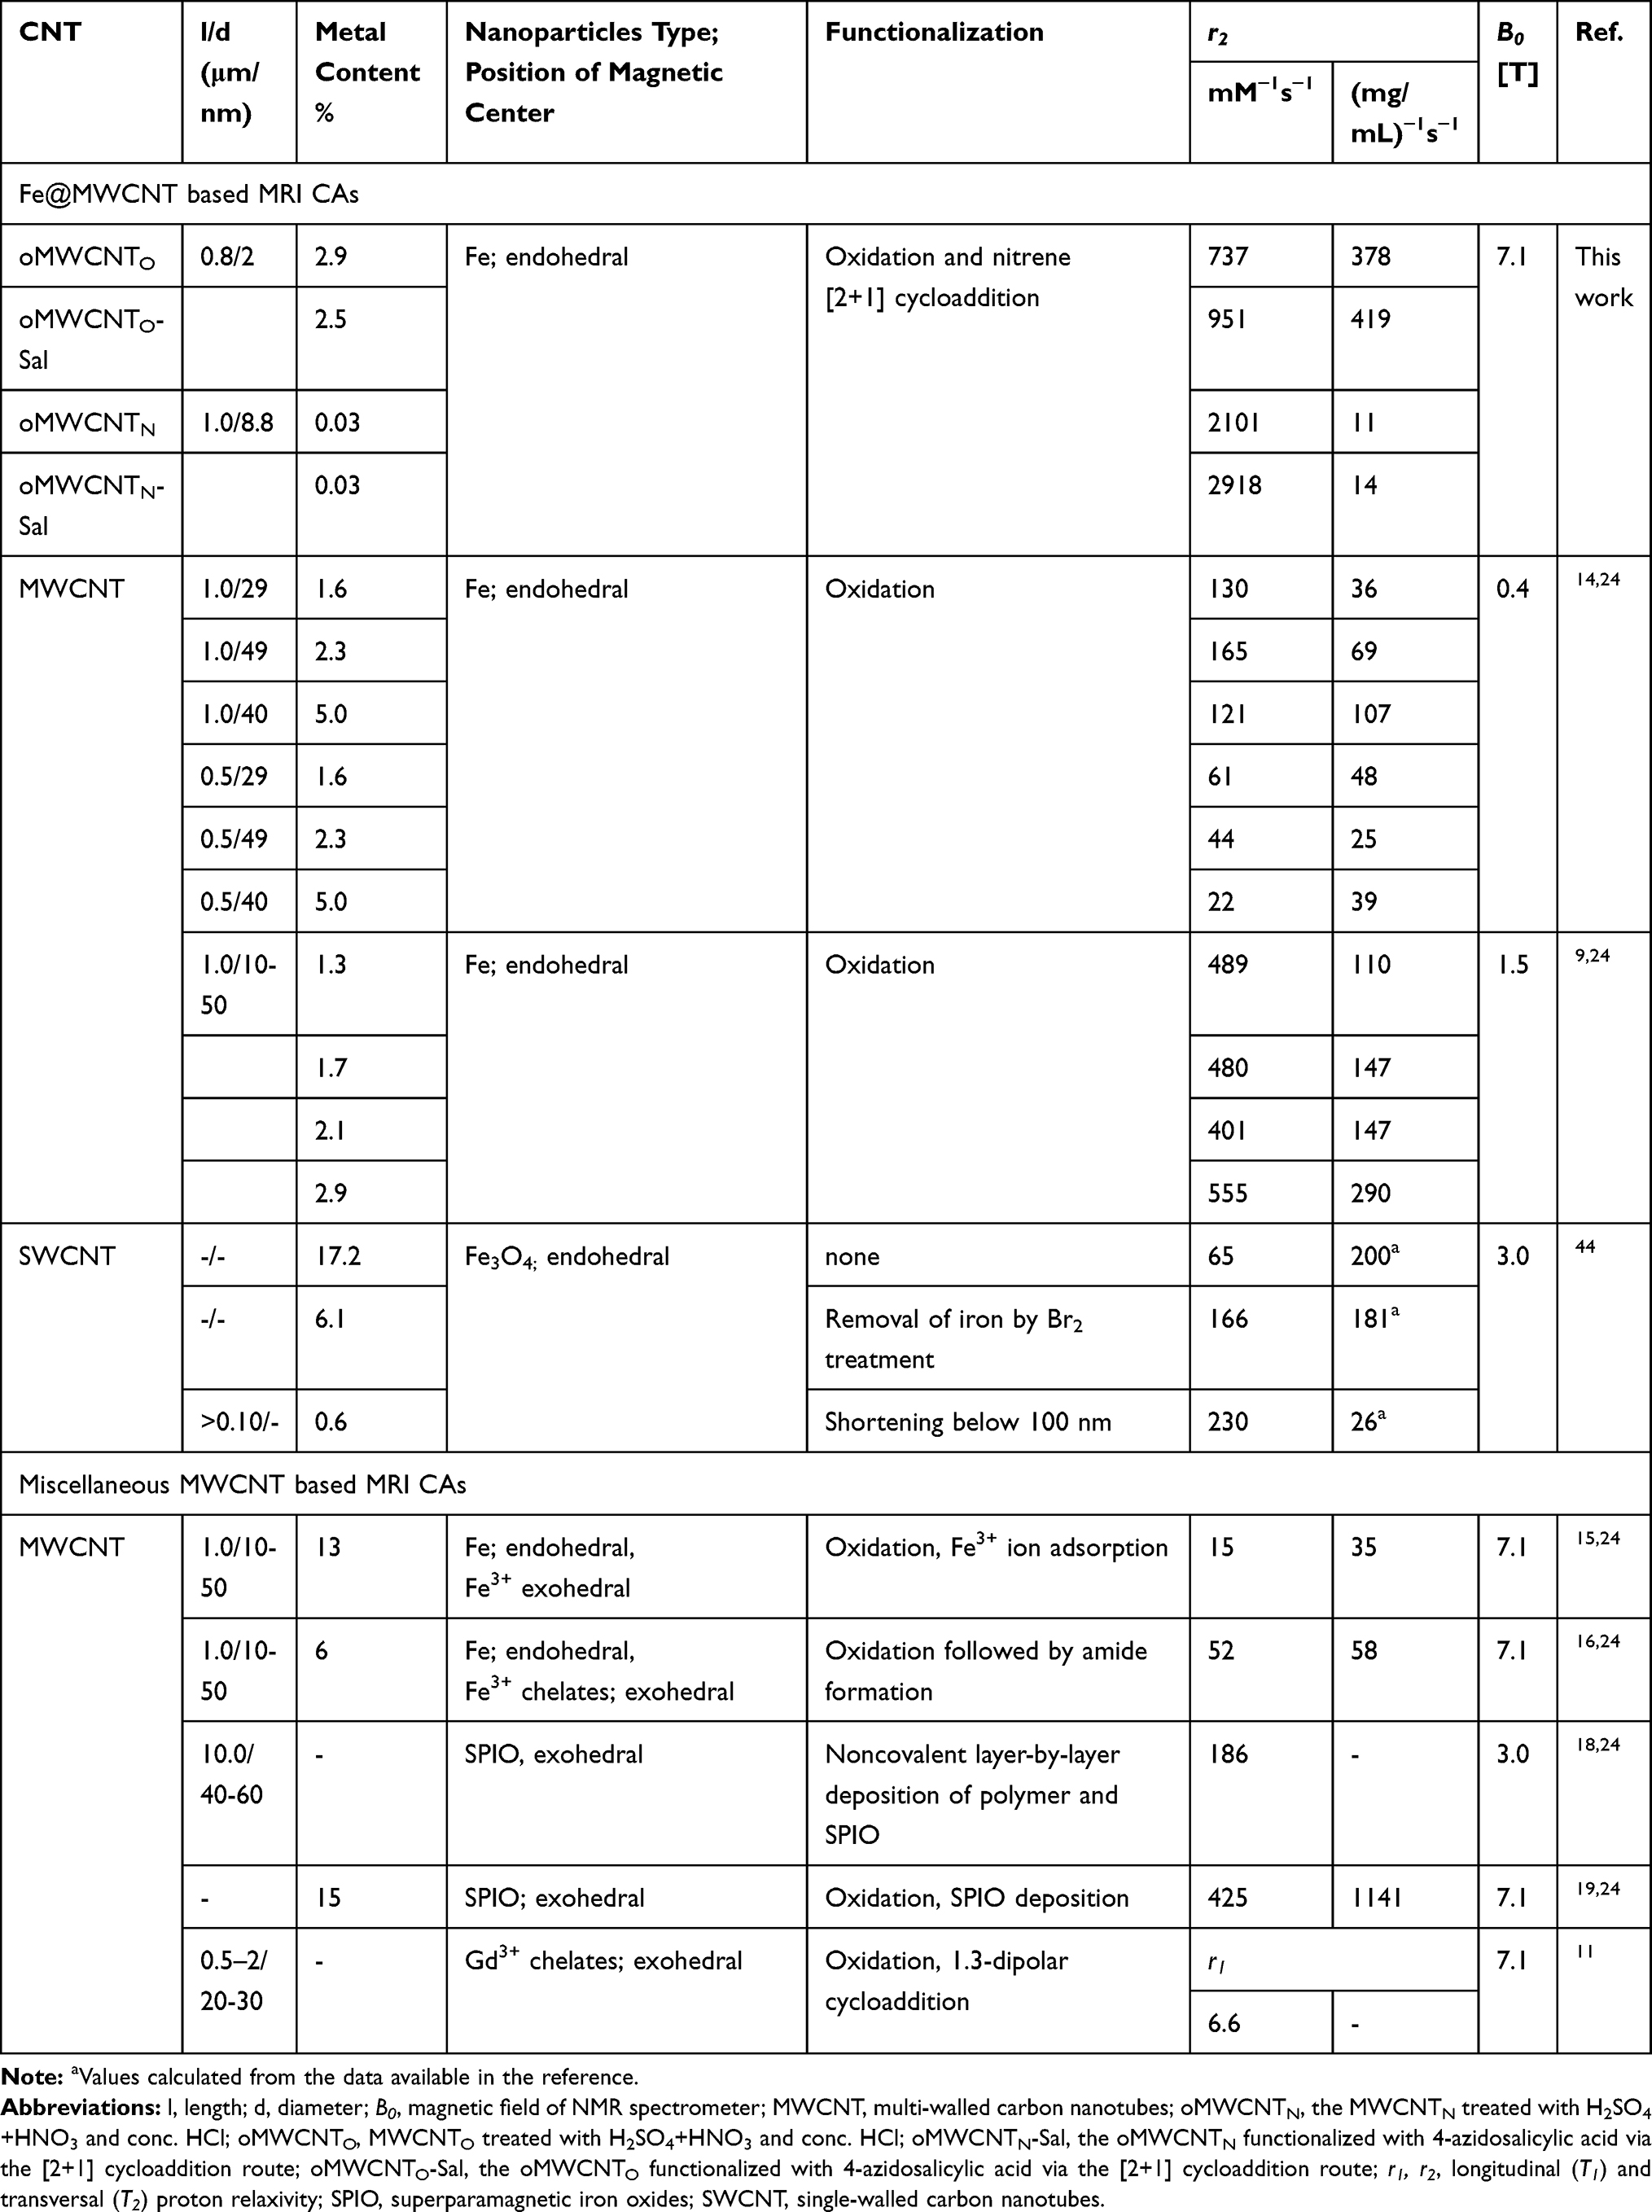 |
Table 1 Representative Examples of Carbon Nanotube-Based Contrast Agents for Magnetic Resonance Imaging |
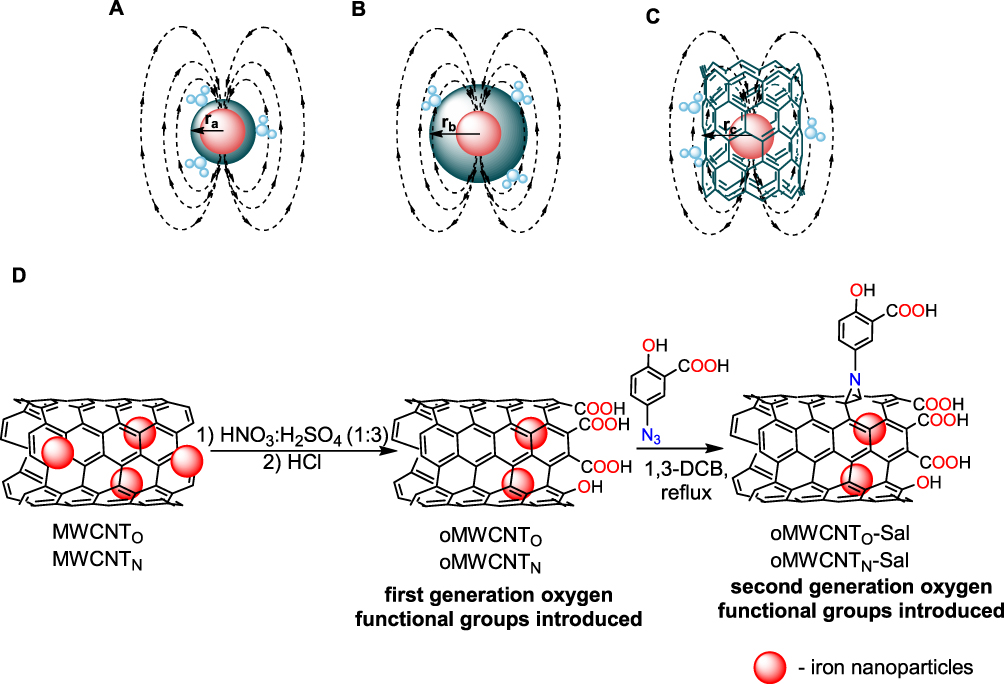 |
Figure 1 Effective magnetic field induced by magnetic species as a function of distance. (A) Molecules closer to the magnetic core relax faster than water molecules in (B) where the protein coating (green circle) radius is higher, or (C) where CNT walls restrict their approach to the magnetic core. (D) Functionalization of MWCNTs – oxidation followed by [2+1] cycloaddition of nitrene generated from 4-azidosalicylic acid. |
To investigate whether the amount of oxygen functional groups (OFGs) affects the relaxometric properties of the Fe@MWCNT models, it was crucial to change the amount of OFGs while maintaining control over the dimensionality of the materials. The oxidation of MWCNTs through the range of wet oxidation techniques is a very useful method for incorporating OFGs on the surface of MWCNTs, but the process is considered as destructive while its outcome strongly depends on the reaction conditions. Furthermore, prolonged oxidation not necessarily increases the amount of the oxygen functional groups on CNTs surface due to the so-called onion effect leading to rapid decomposition of oxidized CNTs walls after achieving a particular level of oxidation.27
To exclude varying dimensions connected with the oxidation process, we accomplished the introduction of “second generation” OFGs on oxidized MWCNTs through a nondestructive process – [2+1] nitrene cycloaddition (Figure 1D). For this purpose, two different types of Fe@MWCNTs were chosen – in-house prepared, large diameter, “our” MWCNTO with high iron loading and commercially available Nanocyl 7000TM MWCNT (MWCNTN) with a small diameter (Table 2). The first-generation OFGs were formed during the oxidation of MWCNTO and MWCNTN to oMWCNTO and oMWCNTN, while the second-generation OFGs were introduced in a non-destructive [2+1]-cycloaddition of salicylic acid nitrene on the surface of oxidized oMWCNTO and oMWCNTN to create oMWCNTO-Sal and oMWCNTN-Sal, respectively. This novel approach significantly increased the number of oxygen functional groups on the Fe@MWCNTs surface which was reflected by increases in the T2 relaxation rates of water protons by as much as 30% at 7.1 T. Our oMWCNTO-Sal nanohybrids achieved the highest r2 relaxivity of 951 mM−1s−1 among all Fe@MWCNT CAs reported to date. Additionally, we present that r2 relaxivity in mM−1s−1 provides information on the effectiveness of paramagnetic center; thus, for very low concentrations in CNT-based CAs even a small increase in relaxation rate leads to high r2 in relaxometric measurements despite low or negligible contrast enhancement in MRI images. To give a detailed picture of CNT-CAs, we propose the use of r2 expressed in (mg/mL)−1s−1 which reflects to the effectiveness of the whole system and directly informs about the concentration of nanoparticles which needs to be applied for achieving a particular effect.
Materials and Methods
Characterization of the Materials
The materials were characterized by TEM, TGA, ICP-AES, XPS, Raman, SQUID, UV-Vis, 1H-NMR, 13C-NMR and MS-TOF spectroscopy, and relaxometric measurements.
High-resolution transmission electron (HR-TEM) micrographs were acquired using an S/TEM TITAN 80–300, EHT 80–300 keV, field emission electron source with a Cs corrector probe for atomic resolution scanning transmission imaging (STEM), 0.1 nm resolution in TEM mode; 0.85 nm STEM resolution; an energy filter, EDX, and 3D tomography. Thermogravimetric analysis (TGA) measurements were carried out using a Mettler Toledo TGA/DSC 2 system. Analyses were conducted at a constant heating rate of 10°C min−1. The inert gas (argon) flow rate was 80 mL min−1, and 70 μL alumina crucibles were used. Inductively coupled plasma-atomic electron spectroscopy (ICP-AES) was utilized for iron determination with a Varian 710-ES spectrometer (Varian, Palo Alto, CA, USA) equipped with a One-Neb nebulizer (Agilent, Santa Clara, USA) and a cyclonic spray chamber. The following parameters were used: an RF power of 1.2 kW, a plasma flow of 15 L min−1 with an auxiliary flow of 1.5 L min−1, a nebulizer pressure of 210 kPa, a pump rate of 15 rpm, and emission lines of Fe: λ = 234.350 nm, λ = 259.940 nm, λ = 238.204 nm, λ = 261.187 nm, and λ = 239.563 nm. An iron standard solution of 1000 mg L−1 (Merck, Germany) was used. Deionized water was purified using a Millipore Elix 10 system to 0.067 μS cm−1 (Millipore SAS, Molsheim, France). The obtained results constituted an average of concentrations obtained from calibration curves for five analytical lines with a standard deviation of less than 1%. The results are expressed as Fe wt%. Prior to ICP-AES analysis, depending on the approximate iron content, MWCNTs (20–100 mg) were introduced into a mixture of concentrated acids HNO3/H2SO4 (1:3 = v/v) (4 mL) and refluxed for 24–48 h until the carbon nanomaterial had completely decomposed. The resulting mixture (10 μL) was diluted to a volume of 10 mL with deionized water. Raman spectra were obtained using an inVia Raman Spectroscope with a single laser beam λ = 633 nm. X-ray photoelectron spectroscopy (XPS) spectra were recorded in a multi-chamber ultra-high vacuum experimental setup (base pressure 2×10⁻⁸ Pa) equipped with a PREVAC EA15 hemispherical electron energy analyzer with a 2D-MCP detector. Samples were irradiated with an Al-Kα X-ray source (PREVAC dual-anode XR-40B source, energy 1486.60 eV). For the survey spectra, the pass energy was set to 200 eV (with a scanning step of 0.9 eV), and the particular energy regions to 100 eV (with a scanning step 0.05 eV). All measurements were performed with the analyzer axis perpendicular to the plane of samples. The binding energy (BE) scale of the analyzer was calibrated to Au 4f7/2 (84.0 eV).28 The recorded data were fitted utilizing CASA XPS® embedded algorithms and relative sensitivity factors. For the background subtraction, the Shirley function was used. Unless otherwise specified, the components were fitted with a sum of Gaussian (70%) and Lorentzian (30%) lines. The full width at half maximum (FWHM) values for the peaks in the same binding energy region were allowed to vary within a narrow range. The estimated uncertainty for the components’ energy position determination was 0.1 eV. The selected magnetic properties were measured using a superconducting quantum interference device (SQUID) (MPMS XL-7, Quantum Design) in the temperature range from 2 K to 300 K and magnetic fields of −7 to +7 T. Thermomagnetic curves were obtained by applying the so-called zero-field cooling (ZFC) and field cooling (FC) procedures. Additionally, to determine the distribution of magnetic moments, the Langevin granulometry technique was used.29,30 Ultraviolet-visible (UV–Vis) spectra were recorded on a Hitachi Y-2910 spectrophotometer in the 190–700 nm range using aqueous solutions. MWCNT (1 mg) was introduced into water (10 mL) and sonicated with a horn sonicator (Hilsher UP200St, 200 W, 26 kHz) for 10 min. As-received samples were used for UV-Vis absorbance measurements, and their absorbance was measured for the following periods: immediately after sonication, and after 1, 2,5, 24, 168, and 240 h. Relaxation measurements (7.1 T) were performed on a Varian Unity Inova 300 MHz spectrometer at 22°C using dispersions with the following concentrations: 0.2 mg mL−1, 0.1 mg mL−1, 0.05 mg mL−1, 0.025 mg mL−1, and 0.0125 mg mL−1. The primary medium was 5% D2O in demineralized water containing 1% (m/v) Pluronic(R) F127. Measurements were repeated twice, and the average value was used for further calculations. Relaxivity r2 was calculated as the slope of T2 either vs molar concentration of iron in mol dm−3 or the mass concentration of MWCNTs in mg mL−1, using the pure medium as the intercept (reference point). Special attention was paid to the optimal shimming of samples because CNT dispersions give very broad proton signals in 1H-nuclear magnetic resonance spectra due to their ferromagnetic and superparamagnetic behaviors. 1H and 13C NMR spectra were recorded at 298 K on an Agilent NMR Magnet-400 MHz (400 MHz for 1H and at 100.5 MHz for 13C). Spectra were calibrated relative to solvent residual protons and carbon chemical shifts DMSO (δ = 2.50 ppm for 1H NMR and δ = 39.50 ppm for 13C NMR). Coupling constants (J) are reported in hertz (Hz). The multiplicity of the signals is given as s (singlet), d (doublet). MS studies were performed with an HR instrument Xevo G2 quadrupole time‐of‐flight equipped with an ESI source. The injections were made either directly or after chromatographic separation (Waters Acquity UPLC system, BEH C18 column, 1.7 μm; 2.1 × 50 mm; acetonitrile/water 90/10% at 0.2 mL min−1). The conditions for ESI were as follows: capillary 3 kV, sampling cone 20, extraction cone 4, source temperature 120°C, desolvation temperature 200°C, cone gas flow 200 L,−1 desolvation gas flow 500 L.−1
MRI Imaging
MRI images were taken on a Bruker BioSpec AvanceIII 117/11 system (11.7 T). The Rapid Acquisition with Refocused Echoes (RARE) imaging method was used for 1H imaging under the following conditions: for mouse imaging, an 8×4 cm field of view, a matrix size of 64×32 (0-filled to 128×64 for output), no slice selection TR/TE = 1000/64 ms, RARE factor of 16, an average of 512 times. For phantom imaging, a field of view of 8×4 cm, a matrix size of 100×50 (0-filled to 128×64 for output), TR = 1500 msec, TE = 13, 39, 65 and 91 msec, a RARE factor of 4, and 128 averages were used.
Animal Experiments
Animal experiments were approved by the Animal Care and Use Committee of the Immunology Frontier Research Center, Osaka University, Japan based on Osaka University Regulations on Animal Experiments regulation available on-line at https://www.osaka-u.ac.jp/en/research/lifescience/files/E36OsakaUniversityRegulationsonAnimalExperiments.docx. The mice used in this experiment were C57bl/6N, purchased from Japan, SLC.
A sample of 50 µL of oMWCNTO-Sal was injected just prior to imaging. The mice were anesthetized by sevoflurane gas during imaging. The pulse sequence was the same as for phantom measurements, the maximum loading space was a 3.5 cm diameter cylinder, and the gradient linear space was less than 4 cm.
Formation of the First Generation of Oxygen Groups – Oxidation of MWCNTs
MWCNTs (1.000 g) were suspended in a mixture of conc. HNO3 (100 mL) and conc. H2SO4 (300 mL) and heated to reflux for 10 min. Then, the suspension was cooled, diluted with water (1 L), and filtered through a Millipore Teflon® filter membrane (0.22 µm pore size) under reduced pressure. The precipitate was washed with water to neutral pH. A black residue was collected, resuspended in deionized water, sonicated for 1 h, and filtered off again. The procedure was repeated three times, and the black residue was dried at 80°C until constant weight.
Purification of MWCNT Using Concentrated HCl(Aq)
MWCNTs (1.000 g) were suspended in conc. HCl (500 mL) and sonicated for 1 h using a bath sonicator. Then, the suspension was heated to reflux vigorously for 6 h, cooled, diluted with water (1 L), and filtered through a Millipore Teflon® filter membrane (0.22 µm pore size) under reduced pressure. The precipitate was washed with water to neutral pH. A black residue was collected, resuspended in deionized water, sonicated for 1 h, and filtered off. The procedure was repeated three times, and the black residue was dried at 80°C until constant weight.
Formation of the Second Generation of Oxygen Functional Groups – [2+1] Cycloaddition of Nitrene of 4-Azidosalicylic Acid to MWCNTs
MWCNTs (50 mg, 4.2 mmol calculated per carbon) were introduced into anhydrous 1,3-dichlorobenzene (50 mL) under N2 atmosphere and sonicated for 1 h. To the dispersion, 4-azidosalicylic acid (1.5 eq, 6.25 mmol, 1132 mg) was added, and the mixture was heated to reflux for 1 h when the complete consumption of the substrate was confirmed by TLC. The post-reaction mixture was cooled and filtered through a Millipore Teflon® filter membrane (0.22 µm pore size). The black residue was washed with CHCl3 (150 mL), MeOH (150 mL), and toluene (150 mL), and then collected, dried under vacuum, and re-suspended in 1 M NaOH (50 mL) with the aid of sonication for 1 h. The dark suspension was then filtered under reduced pressure, and the precipitate was washed with water until the filtrate was colorless. Next, the black residue was collected and sonicated in 1 M HCl (50 mL) for 1 h, filtered off, and washed with water until the filtrate was colorless and its pH was neutral. The black residue was dried at 80 ºC until constant weight.
Synthesis of 4-Azidosalicylic Acid
For the synthetic and spectroscopic details see page 4 of Supplementary information. Supplementary Figures S6 and S7 show 1H and 13C spectra of 4-azidosalicylic acid, while Supplementary Figure S8 shows MS-ESI spectra.
Results
Functionalization of MWCNTs
Introduction of First-Generation OFGs – Oxidation with HNO3:H2SO4 Mixture
The oxidation was performed on both MWCNTO and the MWCNTN reference material by a 10 min-reflux in a nitrating mixture of concentrated HNO3 and H2SO4 (1:3=v/v).31 The procedure significantly decreased the thermal stability of oxidized MWCNTs at higher temperature, as visible in TGA curves shown in Figure 2A-B, due to the introduction of oxygen functional groups. Particularly, the weight loss in the 200–700 ºC range was likely associated with processes such as decarboxylation and decomposition of the phenolic moieties. Thus, the thermal behavior in the above range was used to calculate the degree of functionalization (Supplementary Equation S1).32 It was found that OFGs accounted for 3.5% (w/w) in oxidized oMWCNTO and 7% (w/w) in oMWCNTN which translates into 0.75–2.10 and 0.59–1.56 mmol of OFGs per g for oMWCNTO and oMWCNTN, respectively, depending on the ratio between -OH and -COOH groups introduced.
 |
Figure 2 Chemical composition of functionalized MWCNTs. TGA curves recorded under an N2 atmosphere of (A) MWCNTO and (B) MWCNTN series before and after functionalization. The XPS spectra of MWCNTO, oMWCNTO, and oMWCNTO-Sal obtained for the (C) C 1s region; (D) O 1s region; (E) N 1s region (F) Iron content in MWCNTO and MWCNTN after purification in a mixture of conc. HNO3:H2SO4 and conc. HCl and additionally in oMWCNTO-Sal and oMWCNTN-Sal as measured by ICP-AES. |
Introduction of Second-Generation OFGs – [2+1] Nitrene Cycloaddition
Oxidation can introduce only a limited number of protic functional groups, due to the so-called onion effect on the MWCNT surface.27 The second generation of hydroxyl and carboxyl groups was introduced, aside from already existing ones, directly to sp2 MWCNT skeleton, in a single step through [2+1]-cycloaddition of nitrenes generated in situ from 4-azidosalicylic acid containing both hydroxyl and carboxylic groups.8,33-35 The reaction led to degrees of functionalization of 17.4% for oMWCNTO-Sal and 12.2% for oMWCNTN-Sal in reference to the starting oMWCNTs. The number of second-generation OFGs was calculated using the molar mass of salicylic acid nitrene by the same methodology as for the first generation of OFGs (see SI for the details). The applied methodology led to values of 1.60 and 2.29 mmol of second-generation OFGs (89.7 and 175.6 mg of salicylic acid nitrene) per g of MWCNTs in oMWCNTN-Sal and oMWCNTO-Sal, respectively.
Physical and Chemical Properties of MWCNT CAs
XPS Analysis
Further evidence for the increased number of OFGs during the functionalization of oMWCNTO was obtained by analyzing the C 1s and O 1s regions using XPS, whose results are presented in Figure 2C-E. The C 1s region analysis (Figure 2C) revealed the presence of the expected C-C/C=C main components, accompanied by a relatively broad C-O/C=O peak and a less-intense parasite C-OH component. The presence of oxygen components was confirmed by the O 1s region (Figure 2D). A small number of oxygen-containing groups was observed in MWCNTO with a higher contribution of C-O/C=O over C-OH, while the broadening of the main component in the O 1s region of oMWCNTO was noticed which reflected a higher sp3- signal contribution with respect to MWCNTO. At the same time, the intensities tended to equalize in the oMWCNTO pattern, and it could be observed that for oMWCNTO-Sal, the intensity of the C-OH band dominated the pattern. The final evidence for nitrene functionalization was that the expected C-N signal was found in the C 1s region for oMWCNTO-Sal which was absent in the other samples. In the N 1s region (Figure 2E), an intense N-C signal at 400 eV binding energy was found, accompanied by a weak satellite peak on its higher binding energy side. The component assignment was performed based on accessible databases and literature.28,36,37
ICP Iron Content Analysis
As expected, after MWCNTO and MWCNTN oxidation, the iron content dropped from 4.4% and 0.5% to 2.8% and 0.1% by weight, respectively (Figure 2F). To ensure that both materials were free from any possible metal species contamination during the wet techniques, additional purification was performed using concentrated HCl(aq). While the HCl purification of oMWCNTO did not affect its iron content, the iron content dropped to 0.03% wt. in oMWCNTN. For reference purposes purification of MWCNTO and MWCNTN by concentrated HCl(aq) was also performed and we found that the amount of iron dropped to 3.0% wt. and 0.3% wt., respectively.
TEM Analysis
Analysis of TEM images shows typical surface “exfoliation” for oxidation procedure in oMWCNTN and only slightly in oMWCNTO (Figure 3). Furthermore, it can be seen that [2+1] cycloaddition of salicylic acid nitrene did not damage the MWCNT surface. Additionally, two types of iron/iron oxide nanoparticles in the material were identified (Supplementary Figure S1A-D). In the pristine MWCNTO and MWCNTN we observed a high amount of round-shaped exohedral metal particles with a diameter of 26.5±10.7 nm and 14.5±7.5 nm, respectively. These nanoparticles were removed in the course of oxidation with HNO3:H2SO4 mixture and conc. HCl purification. The second type of particles, endohedral iron nanoparticles, remained in all samples, regardless of the functionalization stage. While in Fe-rich MWCNTO the amounts of these nanoparticles are substantial, only a few of them were detected in MWCNTN material. These nanoparticles typically have a needle-like structure, which tightly fills nanotube inner cavity and varies in size. Therefore, we decided to measure two dimensions – length and diameter – to describe nanoparticles. For MWCNTO series average length and diameter are 69.8±68.5 nm and 17.5±10.3 nm, respectively, while for MWCNTN these values are 15.5±4.0 and 5.2±2.3 nm, respectively.
 |
Figure 3 Transmission Electron Microscopy images of (A) pristine MWCNTO, (B) oMWCNTO, (C) oMWCNTO-Sal, (D) pristine MWCNTN, (E) oMWCNTN, and (F) oMWCNTN-Sal. |
Raman Spectroscopy
Raman spectroscopy is a valuable tool for assessing the quality of CNTs and monitoring their chemical functionalization.38,39 Typically, an increase in the ID/IG ratio is associated with the incorporation of defects during functionalization, but it cannot be quantitatively linked with the number of incorporated OFGs.32 For both of the studied pristine materials, harsh oxidation conditions led to an expected relative increase in the ID/IG ratio suggesting the introduction of structural defects (Supplementary Figure S2A and B). Only a slight increase in the ID/IG ratio was observed for oMWCNTO-Sal and a negligible change for oMWCNTN-Sal with respect to the oxidized MWCNTs, suggesting that functionalization does not damage sidewall probably due to formation of open-configuration adduct which preserves C-sp2 hybridization in the place of addition.
Magnetic Properties of the Materials
The influence of oxidation on the magnetic properties of pristine MWCNTs was studied by superconducting quantum interference device (SQUID) magnetometer experiments, which provided valuable insight into the form of iron nanoparticles in MWCNTs and the change of their character during the transformations. The impact of the magnetic components in the nanocomposites is another important factor in the resulting properties of potential MRI CAs. Magnetic susceptibility Ms is one of such properties and can, to some extent, be correlated with r2 relaxivity; thus, with increasing Ms increase of r2 is expected.40
Zero-field-cooled and field-cooled (ZFC-FC) thermomagnetic curves of the MWCNTO samples are presented in Figure 4A. The shape of the FC part indicated the ferromagnetic behavior with a Curie point above 300 K. At low temperatures, a small contribution of paramagnetism can be observed in the hyperbolic increase in the magnetization with decreasing temperature. The difference in the ZFC and FC curves revealed some thermal blocking effects, usually attributed to magnetic anisotropy, which disappeared near room temperature. For samples with a lower Fe-content (pristine MWCNTN and oMWCNTN), similar magnetic characteristics in the ZFC-FC thermomagnetic curves could be observed in Figure 4B. Compared with the Fe-rich samples, a higher contribution of the paramagnetic component and a significant decrease in the saturation magnetization of the ferromagnetic part was observed.
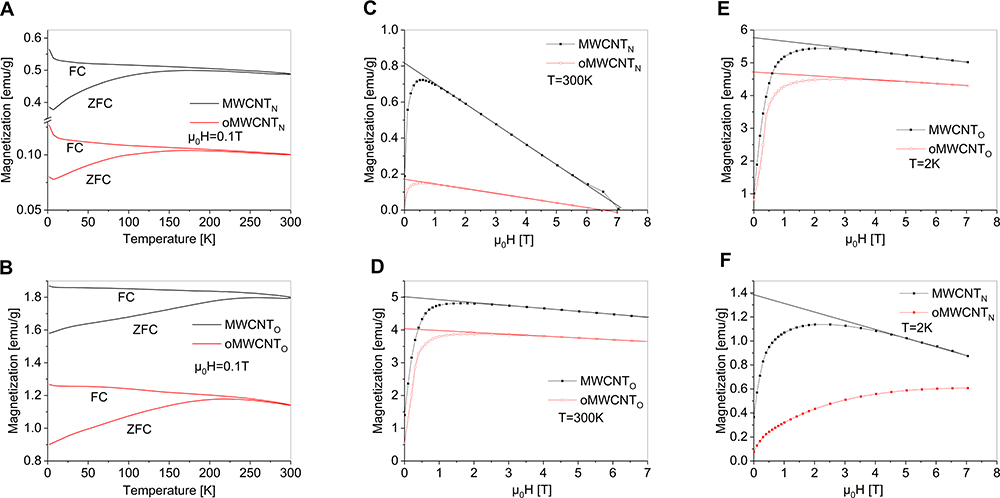 |
Figure 4 Thermomagnetic Zero-field cooled – Field cooled magnetization curves at 0.1 T: (A) MWCNTO and oMWCNTO (B) MWCNTN, and oMWCNTN. Magnetic isotherms: (C) at 300 K for MWCNTO and oMWCNTO; (D) at 300 K for MWCNTN and oMWCNTN; (E) at 2 K for MWCNTO and oMWCNTO; (F) at 2 K for MWCNTN and oMWCNTN. |
Generally, the examined samples showed ferromagnetic and diamagnetic characteristics (Figure 4C-F). The diamagnetic component (the linear decrease of magnetization with the increasing magnetic field) was attributed to the non-magnetic, carbonaceous part of the samples, as well as the sample holder; thus, it was not suitable for analysis. However, these two components could be separated by simply subtracting the diamagnetic line determined in higher fields when the ferromagnetic part achieved saturation. The straight lines in Figure 4C represent such an approach, and the y-intercept represented the saturation magnetization Ms of the ferromagnetic component (5.02 and 4.05 emu g−1 for MWCNTO and oMWCNTO, respectively). Focusing on those values, a decrease in Ms caused by sample oxidation was observed. In the case of oMWCNTO, a magnetic remanence of 1.78 emu g−1 appeared. Similar magnetic isotherms determined at 2 K were depicted in Figure 4E, and in both cases, the superposition of ferro- and diamagnetism was observed. Also, in both non-oxidized and oxidized samples, magnetic remanence (Mr) related to the magnetic anisotropy (as visible in the ZFC-FC curves) was detected. For MWCNTN samples (Figure 4D and F) one could observe a higher contribution of the paramagnetic component and a significant decrease in the saturation magnetization of the ferromagnetic part, compared with the Fe-rich samples. In this case, sample oxidation led to a remarkable decrease in Ms, and in contrast to the previous cases, magnetic remanence was not observed. The summary of magnetic properties is presented in Table 2. Furthermore, the Langevin granulometry technique was performed for MWCNTN samples were ferromagnetic and paramagnetic parts of 2K-magnetic isotherms were well separated (Figure 4F).29,30 The analysis of the paramagnetic component shows the distribution of magnetic moments of atoms or clusters (superparamagnetism) of MWCNTN (Supplementary Figure S3A) and oMWCNTN (Supplementary Figure S3B). It can be observed that oxidation increases the number of clusters with magnetic moments between 1–5 µB (Bohr magneton) associated with ionic Fe forms reducing the amount of Fe clusters with high magnetic moments (26 µB) observed in pristine MWCNTN sample.
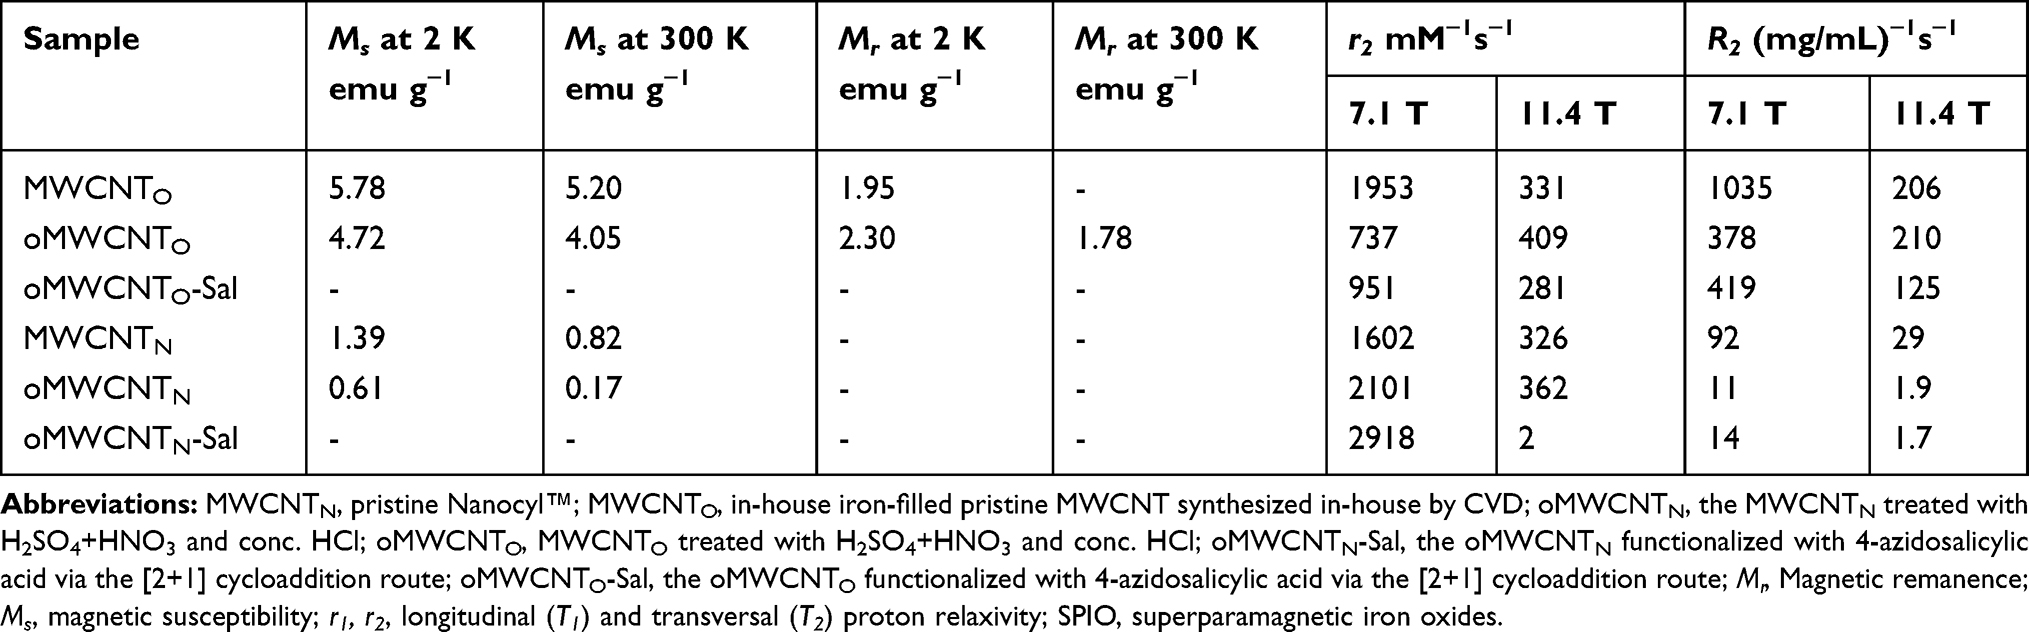 |
Table 2 Summary of Magnetic and Relaxometric Properties of Studied Multi-Walled Carbon Nanotubes as Contrast Agents for Magnetic Resonance Imaging |
The T2 relaxivity of MWCNTN was measured using a Carr-Purcell-Meibloom-Gill pulse sequence on a 300 MHz Varian NMR spectrometer. All measurements were made in 1% Pluronic(R) F127 in 5% D2O/H2O mixture, the measurement results are summarized in Table 2, while Figure 5A-B shows a curve of 1/T2 against a concentration of oMWCNTO-Sal (see Supplementary Figure S4A-F for curves of other samples).
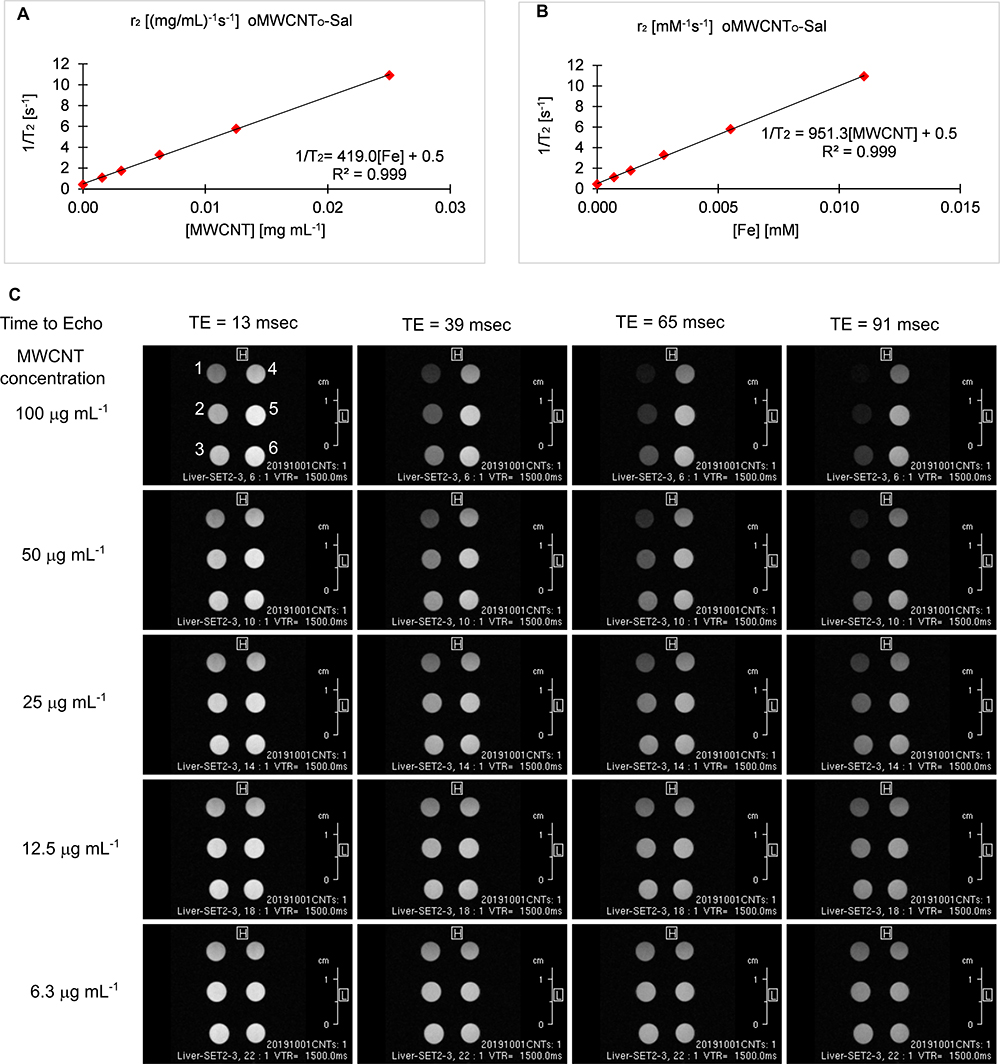 |
Figure 5 Relaxivity r2 plots in: (A) mM-1s-1 (B) (mg/mL)-1s-1 for oMWCNTO-Sal and (C) T2-weighted images of (1) MWCNTO (2) oMWCNTO (3) oMWCNTO-Sal, (4) MWCNTN, (5) oMWCNTN, (6) oMWCNTN-Sal dispersions in PCR tubes at different MWCNT concentration with different time to echo (TE) and constant time to repetition TR = 1500 ms. |
It was observed that the highest relaxivities were recorded for materials with the highest saturation magnetizations. Acceleration of the relaxation rate in relaxometric measurements was significant for T2, while T1 relaxation was independent of the concentration of MWCNTs which was also observed in our previous study.16
It is expected that a promising T2 CA should show considerably reduced T2 relaxation time increasing darkness in T2-weighted images. The MWCNTO samples yielded darker images compared with the MWCNTN samples in phantom MRI studies as shown in Figure 5C. At a long time to echo (TE), none of MWCNTN samples did show efficient contrast enhancement. For MWCNTO, oMWCNTO, and oMWCNTO-Sal the reduction of T2 was much more pronounced – to the point where the image was dark in the case of pristine MWCNTO. The relaxation times obtained from phantom MRI measurements allowed us to calculate r2 in a much higher magnetic field of MRI scanner of 11.7 T by recovering relaxation times from signal intensities in MRI images at the lowest and highest concentration for each sample. These data, presented in Table 2, are different from our initial relaxometric measurements at the lower magnetic field (7.1 T) and are the effect of actual visual contrast. Observed relaxivities for MWCNTO samples are lower in both mM−1s−1 and (mg/mL)−1s−1 than in 7.1 T magnetic field. Furthermore, relaxation in (mg/mL)−1s−1 decreased with decreasing iron content, and in opposition to r2 at 7.1 T, it was the lowest in 2-step functionalized oMWCNTo-Sal and oMWCNTN-Sal with values of 125.2 and 1.7 (mg/mL)−1s−1 respectively.
Such a selective acceleration of transverse (T2) relaxation time is a beneficial feature that could help obtain high-performance contrast effects in T2-weighted images. The obtained relaxivity r2 values are reported in two respects. The one reported in mM−1s−1 is the slope of 1/T2 vs molarity of total iron present in the hybrids. This way of presenting relaxivity is commonly used for classical gadolinium T1 and SPIONs – T2 contrast agents and is shown in Figure 5A.
The concentration of the paramagnetic element is clearly defined, easy to calculate, and refers directly to the metal content and the entire mass of the well-defined compound. In the case of nanocomposites, this method of presenting relaxivity is also common and again refers to the actual molar content of the magnetic component in the material. This methodology may, however, lead to confusion, since a low “molarity” of the paramagnetic element translates into a high relaxivity. While the total mass of the material has no impact on the relaxivity, it affects the pharmacokinetic properties. For the latter reason, the relaxivity values are also presented by recalculating the total weight of the hybrid in the measured sample (mg/mL) shown in Figure 5B. Additionally, as presented in Table 2, the so-expressed relaxivity in (mg/mL)−1s−1 was directly related to the magnetization of the nanocomposite.
The recorded relaxivities – described by the overall reliable statistics and repeatability – reached high levels which may have further enhanced the visual contrast achieved by very small doses.24 Functionalized oMWCNTO-Sal exceeded the effectiveness of straightforwardly oxidized MWCNTs described by Wang et al19 and Ding et al.13 However, the functionalization method developed and applied in this paper significantly increased the stability of the nanotube dispersion (Supplementary Figure S5). This promising modification would be crucial in all biomedical applications. Additionally, the values reported here were 4–10 times higher than those for currently used iron oxide contrast agents, ie, SPIONs.2,41
The overall low in vitro toxicity of MWCNT dispersions, promising phantom MRI results, as well as analysis of the previously reported data justified in vivo experiments to investigate the potential of using oMWCNTO-Sal as CAs, especially from the point of view of MWCNT retention in the internal organs. A 50 µL subcutaneous injection of an aqueous dispersion of 0.1 mg mL−1 of oMWCNTO-Sal (modified) and oMWCNTO (control) showed that both probes were clearly visible on the day of injection and the contrast was on the same level (Figure 6). Differences between both materials appeared during 2 months after injection. Over that time, less hydrophilic oMWCNTO diffused only partially into the tissue, while oMWCNTO-Sal were much more mobile to the point where the injection site can hardly be recognized.
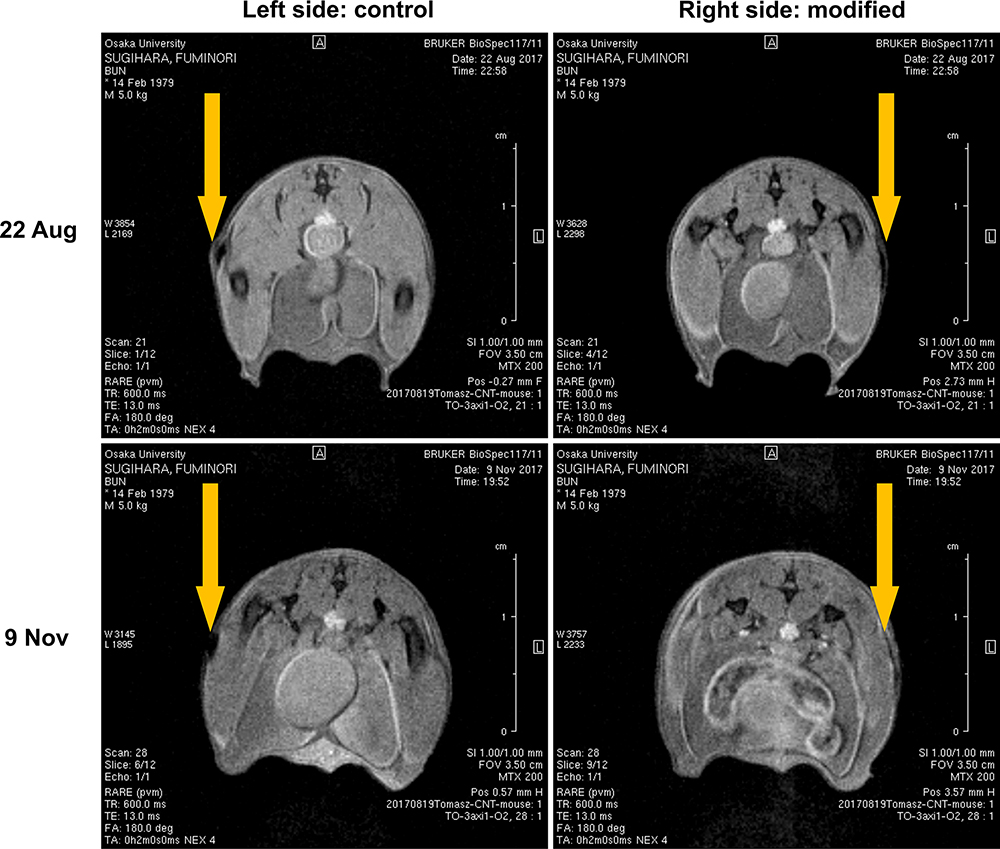 |
Figure 6 Diffusion of oMWCNTO-Sal (modified) and oMWCNTO (control) after subcutaneous injection in a mouse leg during a 2-month period. |
Cytotoxicity Assay
All MWCNTs showed negligibly or only slightly reduced cell viability at 10 µg mL−1. At 100 µg mL−1, only one oxidized compound (oMWCNTN) significantly decreased the cell viability by 40%, while the cell viability remained at the level of over 80% after treatment with salicylic acid nitrene of oxidized MWCNTs (Figure 7). Low cytotoxicity of pristine MWCNTs, despite the presence of a high amount of metallic impurities, as visible in Supplementary Figure S1, can be explained by a lack of interaction with the cell membrane of non-functionalized material. On the other hand, oxidized and nitrene-functionalized MWCNTs revealed dose-dependent cytotoxicity only at higher concentrations.
 |
Figure 7 Cytotoxicity of MWCNTs against HeLa cells. |
Discussion
Oxidized Fe-filled MWCNTO is the simplest example of Fe@MWCNT-based CAs that can be further used to develop more advanced diagnostic and therapeutic models.24 Yet, only a few studies have addressed factors contributing to the relaxometric properties of Fe@MWCNTs.14,23 So far, two main properties were recognized to have the strongest impact on the transversal relaxivity of Fe@MWCNTs, ie, the size and the amount of iron-based nanoparticles. Here, we hypothesized that those properties were directly connected with the magnetic properties of Fe@MWCNTs, but one important factor was omitted – the role of oxygen functional groups present on the surface. In previous studies of Fe@MWCNT CAs, OFGs were not considered as an important element in the proton relaxation process and the relation between the amount of OFGs and r2 was not analyzed.9,13,14,23 In other studies, those protic groups were often used as an anchor of, eg, polymer molecules that restrict distance of the closest approach between water molecules and the particles.21 While the transverse relaxation T2 is dominated by the translational diffusion of water through the large magnetic field gradient – generated by the paramagnetic core in Fe@MWCNT – amount of water molecules and the distance to Fe@MWCNT surface can be crucial in achieving high relaxivities. In our work, the non-destructive introduction of second-generation OFGs via [2+1]-cycloaddition of salicylic acid nitrene on the surface of magnetically different oxidized MWCNTO and MWCNTN increased the relaxivities by 30% and 40%, ie, to 951 mM−1s−1 and 2918 mM−1s−1 in oMWCNTO-Sal and oMWCNTN-Sal, respectively. While these, very high r2 values in mM−1s−1 of oMWCNTN-Sal have little practical value due to lack of actual contrast enhancement in phantom MRI, transversal relaxivity of oMWCNTO-Sal at 7.1 T is close to recently developed, more conventional, SPIO-based CAs which also achieved the top relaxivities of 589.3 mM−1s−1.40
Oxidized Fe@MWCNTs with very similar behavior of magnetic core, length and diameter to “our” MWCNTO were studied by Maciejewska et al, where the focus was concentrated on revealing Fe@MWCNT length and diameter influence on transversal relaxivity. There, longer MWCNTs with the length of ~1 µm achieved higher r2 than shorter MWCNTs (~0.5 µm). Unfortunately, r2 values up to 171 mM−1s−1 are hardly comparable with our results as iron content for relaxometric calculations was measured before HNO3:H2SO4 purification step. Whereas, it must have been much lower since in our samples of MWCNTO and MWCNTN oxidized through very similar protocol iron content dropped from 4.5% to 2.8% and from 0.5% to 0.1%, respectively. Taking that into account, r2 reported there are expected to be higher, thus being closer to r2 of 564 mM−1s−1 reported by Vittorio et al for his model of Fe@oMWCNTs or our oMWCNTO with r2 of 737 mM−1s−1.
In our study, during nitrene functionalization, twice as many OFGs were located on the surface of the MWCNT close to the magnetic core, allowing this increase to be linked with the enhanced relaxometric properties of both studied Fe@MWCNT types. Furthermore, both functionalized materials showed an expected increase in hydrophilicity, since the number of OFGs capable of interacting with water molecules increased. In case of oMWCNTO-Sal and oMWCNTN-Sal, compared with oMWCNTO and oMWCNTN, the strength of the induced magnetic field was expected to be lower due to the increased contribution of functionalization in the total mass of samples. Furthermore, the distance between the ferromagnetic center and water molecules in the materials was expected to remain constant since the thickness of the layer of salicylic acid molecules was small (>1 nm) compared with the outer tube diameter (8.8–21 nm). Thus, the only factor that could significantly impact the relaxivity of oMWCNTO-Sal and oMWCNTN-Sal was the diffusion rate of water inside the magnetic field. When the number of OFGs in those samples doubled, it was expected that the number of water molecules in the effective magnetic field also increased due to more interactions between water molecules and the functional groups. This relationship was in fact observed, but only at a lower, 7.1 T magnetic field, whereas at the higher magnetic field of phantom MRI scanner (11.7 T) one can observe that mass relaxivity is directly connected with the amount of iron in the sample or its magnetic susceptibility suggesting a change in the mechanism of relaxation.14 A higher magnetic field used in our phantom MRI experiment might lead to the increased importance of local magnetic fields strength over the diffusion of water molecules in relaxometric processes. Thus, changing the regime of relaxation from diffusion-driven to slow dephasing or static dephasing regime where magnetic anisotropy overwhelms outer-sphere mechanism.42
Nevertheless, most of the medical MRI spectrometers work in much lower field (around 3 T) in contrary to our MRI scanner (11.7 T) or even NMR spectrometer (7.1 T) used for relaxation measurements. Thus, the results recorded at the lower magnetic field are more reliable and have much more practical value so far. Furthermore, the achieved relaxivities, especially those expressed in mM−1s−1, were very high for MWCNTO and MWCNTN series with superior measured molar r2 relaxivities for oMWCNTN and oMWCNTN-Sal of 2101 mM−1s−1 and 2918 mM−1s−1, respectively. Indeed, these values were nearly three times higher than Fe-rich oMWCNTO and oMWCNTO-Sal which had relaxivities of 737 and 951 mM−1s−1, respectively. Yet, the opposite relationship was observed when comparing mass relaxivities where MWCNTN exhibited relaxivities from 11–14 (mg/mL)−1s−1, while MWCNTO values were in the range of 378–419 (mg/mL)−1s−1. Here, the Nanocyl™ derivative with a very low iron content (oMWCNTN-Sal) showed practically no MRI contrast potential as calculated per weight concentration (mg/mL), as also confirmed by phantom MRI. To explain this phenomenon, the correlation between the CAs relaxivity and the CAs dose injected into the medium needs to be understood. It must also be kept in mind that effective T2 CAs must reduce the T2 relaxation time by nearly 100 times to strongly enhance the signal in MRI images.43
This observation led to the conclusion that the balance between magnetic iron/functionalization must be carefully maintained; otherwise, the resulting biocompatible hybrid would have no application as MRI CAs. This is of particular importance if MWCNTs are functionalized with high molecular weight polymers which significantly decrease the amount of paramagnetic in the final nanohybrid. A similar observation was made for ultrashort SWCNTs (US-SWCNTs) with a low iron content of 0.63 wt.% studied by Ananta et al. The authors achieved an r2 as high as 230 mM−1s−1 but did not significantly improve the contrast in MRI images, unlike for SWCNTs, which had a higher iron content of 6.1% or 17.2%. These Fe-rich SWCNTs showed lower r2 relaxivities of 166 and 65 mM−1s−1, respectively, but gave higher negative MRI contrast under the same conditions.44 In our opinion, our interpretation of these data, together with our investigations, strongly suggests that for hybrid nanomaterials such as CNT-based CAs, it is important to calculate both relaxivity values since the mass relaxivity provides direct information on the amount of hybrid nanomaterial that needs to be injected to obtain significant MRI contrast, while molar relaxivity informs about the efficiency of the paramagnetic center. This parameter is of the greatest importance for the future in vivo applications.
One of the most beneficial aspects of our work is a study of two structurally different models of MWCNT. This approach allowed us to formulate important conclusions which have been addressed only to some extent when modeling new nanohybrids for MRI applications. Additionally, we show that a fairly simple increase of surface oxygen functional groups can increase proton transverse relaxation rate by 30% without modification of the magnetic core properties, nanotube dimensions, or increasing the paramagnetic center concentrations regardless of the Fe@MWCNT structure.
Moreover, we observed that the relaxivity of studied Fe@MWCNT models strongly depends on strength of the magnetic field, implying that the process of relaxation of MWCNT-based CAs is even more complex than in case of well-established magnetic particles such as Gd-complexes or SPIO. We confirm that at lower (7.1 T) magnetic fields, the outer-sphere mechanism of proton relaxation dominates in the samples with an increased amount of oxygen functional groups leading to higher r2 relaxivities and better performance of oMWCNTO-Sal over oMWCNTO.
Conclusion
This study demonstrated a novel and efficient method to functionalize oxidized MWCNTs via the [2+1]-cycloaddition of nitrenes, particularly salicylic acid nitrene generated by the thermal decomposition of 4-azidosalicylic acid. Salicylic acid-functionalized Fe@MWCNT models oMWCNTO and oMWCNTN contained at least twice as many oxygen functional groups close to the carbon surface, which translated to a 30–40% increase in the r2 relaxivity for functionalized oMWCNTs. These results also clearly indicated the important role of OFGs in the T2 relaxation process of Fe@MWCNT nanohybrids, most likely via the increase in the water diffusion rate near the magnetic iron core. The enhancement in the outer-sphere mechanism was more effective at lower magnetic fields (7.1 T), whereas at a very high magnetic field of 11.7 T its importance diminished. Furthermore, we showed that the molar r2 relaxivity of nanohybrid CAs, while being an important factor, was not the best representation of relaxometric effectiveness of such CAs. Instead, mass relaxivity expressed in (mg/mL)−1s−1 gave more direct information on the nanohybrid CAs concentration necessary to obtain a particular contrast enhancement and also allowed to verify whether the values were satisfactory from the biomedical point-of-view to be assessed. Comparing these results with other ferromagnetic nanohybrid CAs, we outlined the new relationships between the molecular architecture and r2 relaxivity which can be used to design new CAs and MWCNT-based theranostics. Moreover, the proposed and developed oMWCNTO-Sal showed the highest molar relaxivity r2 of 951 mM−1s−1 [419 (mg/mL)−1s−1] among Fe@MWCNTs at 7.1 T, while also showing a very high contrast enhancement confirming their applicability as MRI CAs.
Funding
This work was financially supported by Silesian University of Technology BKM/534/RCh-2/0044. Mateusz Michał Tomczyk acknowledges the EU’s Horizon 2020 for funding the OCTA project under grant agreement No 778158. The authors acknowledge the ESPEFUM laboratory at the Institute of Physics – CSE, Silesian University of Technology for access to the XPS experimental setup. The authors are thankful to Prof. Dawid Janas for the acquisition of Raman spectra. Sławomir Boncel greatly acknowledges financial support from the Silesian University of Technology Rector’s Professorial Grant No. 04/020/RGP18/0072. Sławomir Boncel is very grateful for the financial support from the National Science Centre (Poland) Grant No. 2019/33/B/ST5/01412 in the framework of OPUS program.
Disclosure
The authors report no other potential conflicts of interest in this work.
References
1. Weishaupt D, Köchli VD, Marincek B. Spin and the Nuclear Magnetic Resonance Phenomenon.
2. Laurent S, Henoumont C, Stanicki D, et al. MRI Contrast Agents: From Molecules to Particles..
3. Hao D, Ai T, Goerner F, et al. MRI contrast agents: basic chemistry and safety. J Magn Reson Imaging. 2012;36:1060–1071. doi:10.1002/jmri.23725
4. Thostenson ET, Ren Z, Chou T-W. Advances in the science and technology of carbon nanotubes and their composites: a review. Compos Sci Technol. 2001;61:1899–1912.
5. Charlier JC, Blase X, Roche S. Electronic and transport properties of nanotubes. Rev Mod Phys. 2007;79:677–732. doi:10.1103/RevModPhys.79.677
6. Zhang M, Wang W, Wu F, et al. Magnetic and fluorescent carbon nanotubes for dual modal imaging and photothermal and chemo-therapy of cancer cells in living mice. Carbon. 2017;123:70–83. doi:10.1016/j.carbon.2017.07.032
7. Amenta V, Aschberger K. Carbon nanotubes: potential medical applications and safety concerns. Wires Nanomed Nanobi. 2015;7:371–386. doi:10.1002/wnan.1317
8. Boncel S, Herman AP, Budniok S, et al. In vitro targeting and selective killing of T47D breast cancer cells by purpurin and 5-fluorouracil anchored to magnetic CNTs: nitrene-based functionalization versus uptake, cytotoxicity, and intracellular fate. ACS Biomater Sci Eng. 2016;2:1273–1285. doi:10.1021/acsbiomaterials.6b00197
9. Ding X, Singh R, Burke A, et al. Development of iron-containing multiwalled carbon nanotubes for MR-guided laser-induced thermotherapy. Nanomedicine. 2011;6:1341–1352.
10. Lauffer RB. Paramagnetic metal complexes as water proton relaxation agents for NMR imaging: theory and design. Chem Rev. 1987;87:901–927. doi:10.1021/cr00081a003
11. Servant A, Jacobs I, Bussy C, et al. Gadolinium-functionalised multi-walled carbon nanotubes as a T1 contrast agent for MRI cell labelling and tracking. Carbon. 2016;97:126–133. doi:10.1016/j.carbon.2015.08.051
12. Chen B, Zhang H, Du N, et al. Magnetic-fluorescent nanohybrids of carbon nanotubes coated with Eu, Gd Co-doped LaF3 as a multimodal imaging probe. J Colloid Interface Sci. 2012;367:61–66. doi:10.1016/j.jcis.2011.08.084
13. Ding W, Lou C, Qiu J, et al. Targeted Fe-filled carbon nanotube as a multifunctional contrast agent for thermoacoustic and magnetic resonance imaging of tumor in living mice. Nanomed Nanotechnol Biol Med. 2016;12:235–244. doi:10.1016/j.nano.2015.08.008
14. Maciejewska BM, Warowicka A, Baranowska-Korczyc A, et al. Magnetic and hydrophilic MWCNT/Fe composites as potential T2-weighted MRI contrast agents. Carbon. 2015;94:1012–1020. doi:10.1016/j.carbon.2015.07.091
15. Kuźnik N, Tomczyk MM, Boncel S, et al. Fe3+ ions anchored to Fe@o-MWCNTs as double impact T2 MRI contrast agents. Mater Lett. 2014;136:34–36. doi:10.1016/j.matlet.2014.07.174
16. Kuźnik N, Tomczyk MM, Wyskocka M, et al. Amalgamation of complex iron(III) ions and iron nanoclusters with MWCNTs as a route to potential T2 MRI contrast agents. Int J Nanomedicine. 2015;10:3581–3591. doi:10.2147/IJN.S81381
17. Cabana L, Bourgognon M, Wang JTW, et al. The shortening of MWNT-SPION hybrids by steam treatment improves their magnetic resonance imaging properties in vitro and in vivo. Small. 2016;12:2893–2905. doi:10.1002/smll.201502721
18. Liu Y, Hughes TC, Muir BW, et al. Water-dispersible magnetic carbon nanotubes as T2-weighted MRI contrast agents. Biomaterials. 2014;35:378–386. doi:10.1016/j.biomaterials.2013.09.079
19. Wang JTW, Cabana L, Bourgognon M, et al. Magnetically decorated multiwalled carbon nanotubes as dual MRI and SPECT contrast agents. Adv Funct Mater. 2014;24:1880–1894.
20. Liu Y, Muir BW, Waddington LJ, et al. Colloidally stabilized magnetic carbon nanotubes providing MRI contrast in mouse liver tumors. Biomacromolecules. 2015;16:790–797. doi:10.1021/bm501706x
21. Baranowska-Korczyc A, Jasiurkowska-Delaporte M, Maciejewska BM, et al. PEG–MWCNT/Fe hybrids as multi-modal contrast agents for MRI and optical imaging. RSC Adv. 2016;6:49891–49902. doi:10.1039/C6RA09191A
22. Yin M, Wang M, Miao F, et al. Water-dispersible multiwalled carbon nanotube/iron oxide hybrids as contrast agents for cellular magnetic resonance imaging. Carbon. 2012;50:2162–2170. doi:10.1016/j.carbon.2012.01.026
23. Vittorio O, Duce SL, Pietrabissa A, Cuschieri A. Multiwall carbon nanotubes as MRI contrast agents for tracking stem cells. Nanotechnology. 2011;22:095706. doi:10.1088/0957-4484/22/9/095706
24. Kuźnik N, Tomczyk MM. Multiwalled carbon nanotube hybrids as MRI contrast agents. Beilstein J Nanotechnol. 2016;7:1086–1103. doi:10.3762/bjnano.7.102
25. Renshaw PF, Owen CS, McLaughlin AC, et al. Ferromagnetic contrast agents: a new approach. Magn Reson Med. 1986;3:217–225. doi:10.1002/mrm.1910030205
26. Koenig SH, Kellar KE. Theory of 1/T1 and 1/T2 NMRD profiles of solutions of magnetic nanoparticles. Magn Reson Med. 1995;34:227–233. doi:10.1002/mrm.1910340214
27. Kolanowska A, Wasik P, Ziȩba W, Terzyk AP. Selective carboxylation: versus layer-by-layer unsheathing of multi-walled carbon nanotubes: new insights from the reaction with boiling nitrating mixture. RSC Adv. 2019;9:37608–37613. doi:10.1039/C9RA08300F
28. Software used for XPS data analysis: CasaXPS version 2.3.19.
29. Chrobak A, Haneczok G, Che G, et al. PSS. 2011;2698:2692–2698.
30. Gutowski MW, Takacs L, Franco V, Varga LK. Langevin granulometry of the particle size distribution. J Phys a Math Gen. 2004;37:6027–6041. doi:10.1088/0305-4470/37/23/005
31. Herman AP, Boncel S. Oxidised carbon nanotubes as dual-domain synergetic stabilizers in electroconductive carbon nanotube flexible coatings. RSC Adv. 2018;8:30712–30716. doi:10.1039/C8RA05902K
32. Datsyuk V, Kalyva M, Papagelis K, et al. Chemical oxidation of multiwalled carbon nanotubes. Carbon. 2008;46:833–840. doi:10.1016/j.carbon.2008.02.012
33. Holzinger M, Vostrowsky O, Hirsch A, et al. Sidewall functionalization of carbon nanotubes. Communications. 2001;40:4002–4005.
34. Ujjain SK, Bhatia R, Ahuja P, Attri P. Highly conductive aromatic functionalized multi-walled carbon nanotube for inkjet printable high performance supercapacitor electrodes. PLoS One. 2015;10:1–12. doi:10.1371/journal.pone.0131475
35. Bhatia R, Ujjain SK. Soluble single-walled carbon nanotubes for photovoltaics. Mater Lett. 2017;190:165–168. doi:10.1016/j.matlet.2017.01.008
36. Lindau I, Pianetta P, Yu KY, Spicer WE. Photoemission of gold in the energy range 30-300 eV using synchrotron radiation. Phys Rev B. 1976;13:492–495. doi:10.1103/PhysRevB.13.492
37. X-ray Photoelectron Spectroscopy (XPS) Reference Pages. https://srdata.nist.gov/xps/main_search_menu.aspx
38. Jorio A, Pimenta MA, Souza Filho AG, et al. Characterizing carbon nanotube samples with resonance Raman scattering. New J Phys. 2003;5:139. doi:10.1088/1367-2630/5/1/139
39. Murphy H, Papakonstantinou P, Okpalugo TIT. Raman study of multiwalled carbon nanotubes functionalized with oxygen groups. J Vac Sci Technol B Microelectron Nanom Struct. 2006;24:715. doi:10.1116/1.2180257
40. Zhou Z, Tian R, Wang Z, et al. Artificial local magnetic field inhomogeneity enhances T2 relaxivity. Nat Commun. 2017;8:1–10. doi:10.1038/ncomms15468
41. Wang Y-XJ. Superparamagnetic iron oxide based MRI contrast agents: current status of clinical application. Quant Imaging Med Surg. 2011;1:35–44. doi:10.3978/j.issn.2223-4292.2011.08.03
42. Yung K. Empirical models of transverse relaxation for spherical magnetic perturbers. Magn Reson Imaging. 2003;21:451–463. doi:10.1016/S0730-725X(02)00640-9
43. Hendrick RE, Haacke EM. Single-walled carbon nanotube materials as T2 -weighted MRI contrast agents. 1993;44106:137–148.
44. Ananta JS, Matson ML, Tang AM. et al. Single-walled carbon nanotube materials as T2-weighted MRI contrast agents. J Phys Chem C;2009. 19369–19372. doi:10.1021/jp907891n
 © 2020 The Author(s). This work is published and licensed by Dove Medical Press Limited. The
full terms of this license are available at https://www.dovepress.com/terms
and incorporate the Creative Commons Attribution
- Non Commercial (unported, 3.0) License.
By accessing the work you hereby accept the Terms. Non-commercial uses of the work are permitted
without any further permission from Dove Medical Press Limited, provided the work is properly
attributed. For permission for commercial use of this work, please see paragraphs 4.2 and 5 of our Terms.
© 2020 The Author(s). This work is published and licensed by Dove Medical Press Limited. The
full terms of this license are available at https://www.dovepress.com/terms
and incorporate the Creative Commons Attribution
- Non Commercial (unported, 3.0) License.
By accessing the work you hereby accept the Terms. Non-commercial uses of the work are permitted
without any further permission from Dove Medical Press Limited, provided the work is properly
attributed. For permission for commercial use of this work, please see paragraphs 4.2 and 5 of our Terms.