Back to Journals » Drug Design, Development and Therapy » Volume 20
Optimized UPLC-MS/MS Method for the Simultaneous Quantification of Pazopanib and GSK-1268997 and Its Application to Drug-Drug Interaction Studies
Authors Cao L, Wang P, Li R, Fu H, Wu J, Xia H, Xie S, Zeng C
Received 1 January 2026
Accepted for publication 28 March 2026
Published 23 April 2026 Volume 2026:20 589066
DOI https://doi.org/10.2147/DDDT.S589066
Checked for plagiarism Yes
Review by Single anonymous peer review
Peer reviewer comments 2
Editor who approved publication: Dr Muzammal Hussain
Lu Cao,1,2 Peiqi Wang,1 Ruibin Li,1 Haoxin Fu,1 Jun Wu,1 Hailun Xia,1 Saili Xie,3 Congcong Zeng4
1Department of Pharmacy, The First Affiliated Hospital of Wenzhou Medical University, Wenzhou, Zhejiang, People’s Republic of China; 2Zhejiang Key Laboratory of Intelligent Cancer Biomarker Discovery and Translation, First Affiliated Hospital, Wenzhou Medical University, Wenzhou, Zhejiang, People’s Republic of China; 3Healthcare Center, The First Affiliated Hospital of Wenzhou Medical University, Wenzhou, Zhejiang, People’s Republic of China; 4Department of Traditional Chinese Medicine, The First Affiliated Hospital of Wenzhou Medical University, Wenzhou, Zhejiang, People’s Republic of China
Correspondence: Congcong Zeng, Email [email protected] Saili Xie, Email [email protected]
Introduction: Pazopanib, an oral vascular endothelial growth factor receptor tyrosine kinase inhibitor (VEGFR-TKI), is approved for treating advanced renal cell carcinoma (RCC). However, pazopanib can cause hypertension, often necessitating co-administration with antihypertensives like nicardipine. Given their shared metabolic pathway via cytochrome P450 3A4 (CYP3A4), this study investigated their potential drug-drug interaction (DDI).
Methods: An ultra performance liquid chromatography tandem mass spectrometry (UPLC-MS/MS) method was developed for the simultaneous quantification of pazopanib and its metabolite, GSK-1268997. This method was applied to in vitro inhibition studies using rat liver microsomes (RLM) and human liver microsomes (HLM), as well as to an in vivo pharmacokinetic study in rats, to evaluate the impact of nicardipine on pazopanib metabolism.
Results: The assay was linear over the concentration ranges of 20– 60,000 ng/mL for pazopanib and 10– 30,000 ng/mL for GSK-1268997. The intra- and inter-day precision (relative standard deviations, RSD%) for the analytes ranged from 1.5% to 14.5%, with accuracy (relative errors, RE%) within ± 10.2%. The method also demonstrated acceptable selectivity, stability, matrix effect, and recovery. In vitro, nicardipine inhibited the metabolism of pazopanib in both RLM and HLM. In rats, co-administration of nicardipine significantly increased pazopanib exposure. The AUC(0–t) and AUC(0–∞) of pazopanib were increased by 4.03- and 4.31-fold, respectively, while the maximum plasma concentration (Cmax) was increased by 1.60-fold. Conversely, the plasma clearance (CLz/F) was decreased by 78.26%.
Discussion: The findings demonstrated that nicardipine significantly inhibited the metabolism of pazopanib both in vitro and in vivo, leading to substantially increased systemic exposure of pazopanib. This clinically significant finding suggests that, when these two drugs are used in combination, plasma drug concentrations should be closely monitored and the need for dose adjustment should be considered.
Keywords: pazopanib, nicardipine, GSK-1268997, UPLC-MS/MS
Introduction
Vascular endothelial growth factor receptor tyrosine kinase inhibitor (VEGFR-TKI) is a type of targeted oral therapy that inhibits angiogenesis by blocking VEGF signaling, thereby hindering tumour growth.1 These drugs are used to treat various cancers, including renal cell carcinoma (RCC), endocrine tumours, sarcomas, and thyroid neoplasms.2,3 Pazopanib, a second-generation VEGFR-TKI,4 is approved for the treatment of advanced RCC and previously treated advanced soft-tissue sarcoma.5,6 It is metabolised by cytochrome P450 3A4 (CYP3A4). GSK-1268997, a hydroxylated form of pazopanib, is its primary metabolite.7 A study has shown that GSK-1268997 exhibits VEGFR inhibitory potency similar to pazopanib in vitro.8
However, VEGFR-TKIs frequently cause cardiovascular adverse effects, with hypertension being the primary manifestation.1,6,9 Touyz and Herrmann et al conducted a systematic analysis of 77 studies on VEGF pathway-related drugs and found that severe hypertension complications occurred in approximately 7.4% of patients.10 Pazopanib also exhibits platelet-derived growth factor receptor (PDGFR) inhibitory activity, which may promote atherosclerosis and hypertension.11,12 Given that hypertension is a common comorbidity in cancer patients and a frequent adverse effect of pazopanib, many patients receiving pazopanib require concomitant antihypertensive therapy. Therefore, understanding potential drug-drug interactions (DDI) between pazopanib and commonly used antihypertensive agents is clinically essential.
Nicardipine is a dihydropyridine calcium channel blocker (CCB) widely used for treating hypertension and angina.13 Importantly, previous studies have demonstrated that nicardipine inhibits the metabolism of tacrolimus via CYP3A4.14 Given that pazopanib is also a substrate of CYP3A4, co-administration of nicardipine may significantly alter pazopanib pharmacokinetics, potentially increasing the risk of toxicity or reducing therapeutic efficacy.
To enable this investigation, a sensitive and reliable ultra performance liquid chromatography tandem mass spectrometry (UPLC-MS/MS) method was firstly developed and validated for the simultaneous quantification of pazopanib and its primary metabolite GSK-1268997. Compared with previous methods (Table 1), our method addressed the issues of lacking metabolite standards and relying on semi-quantification (relative determination). This method provided a reliable foundation for subsequent in vitro and in vivo DDI studies.
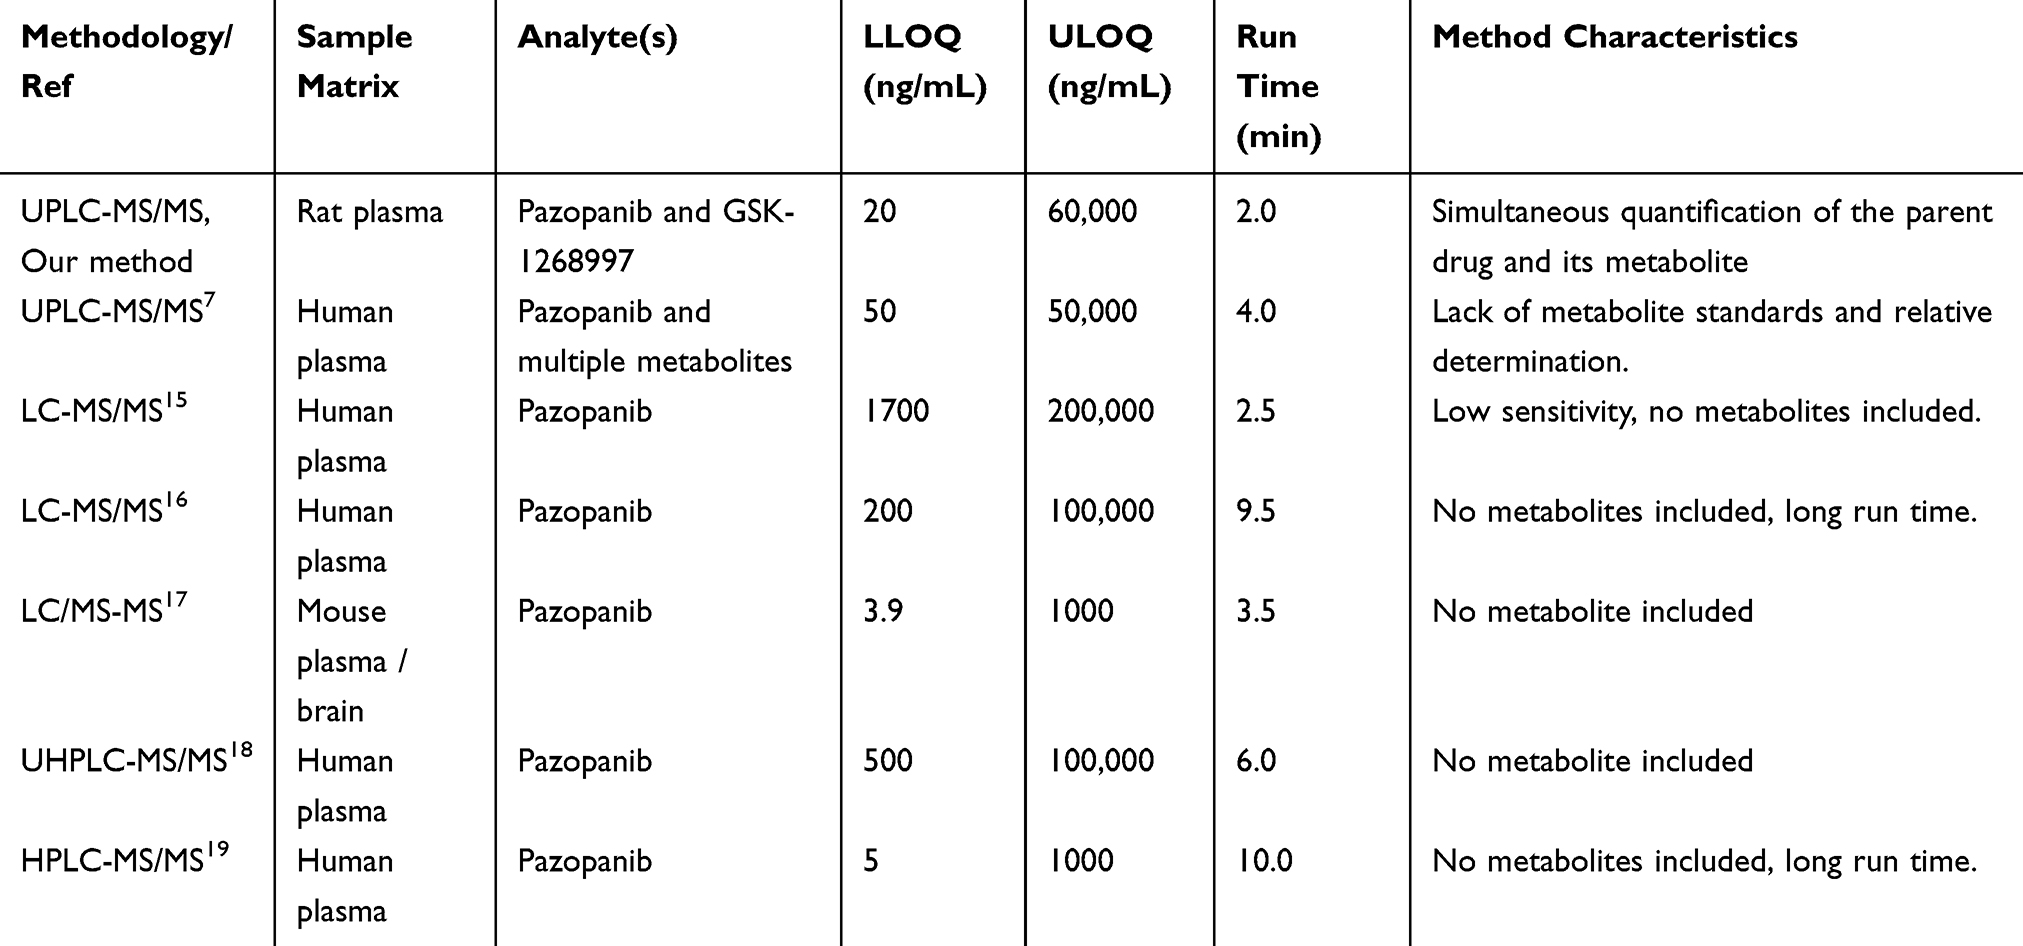 |
Table 1 Summary of Methods for the Measurement of Pazopanib in the Literatures |
To date, no studies have investigated the DDI between pazopanib and nicardipine. Accordingly, we examined the effect of nicardipine on pazopanib metabolism in both rat liver microsomes (RLM) and human liver microsomes (HLM). Additionally, a pharmacokinetic study was performed in Sprague-Dawley rats following the co-administration of pazopanib and nicardipine to evaluate the changes in the pharmacokinetic parameters of pazopanib. This study provided a reference for clinical evaluation of the interaction between pazopanib and nicardipine.
Materials and Methods
Chemicals and Reagents
Pazopanib (98%), GSK-1268997 (98%), and nicardipine (98%) were purchased from Shanghai Canspec Scientific Instruments Co., Ltd. (Shanghai, China). Sunitinib (98%), used as the internal standard (IS), was obtained from Shanghai Macklin Biochemical Technology Co., Ltd. (Shanghai, China). The chemical structures of these compounds are shown in Figure 1. HLM was sourced from iPhase Pharmaceutical Services Co., Ltd. (Beijing, China). HPLC-grade acetonitrile and methanol were purchased from Merck (Darmstadt, Germany). Ultra-pure water was generated using a Milli-Q system (Millipore, Bedford, USA). All other reagents and chemicals were of analytical grade.
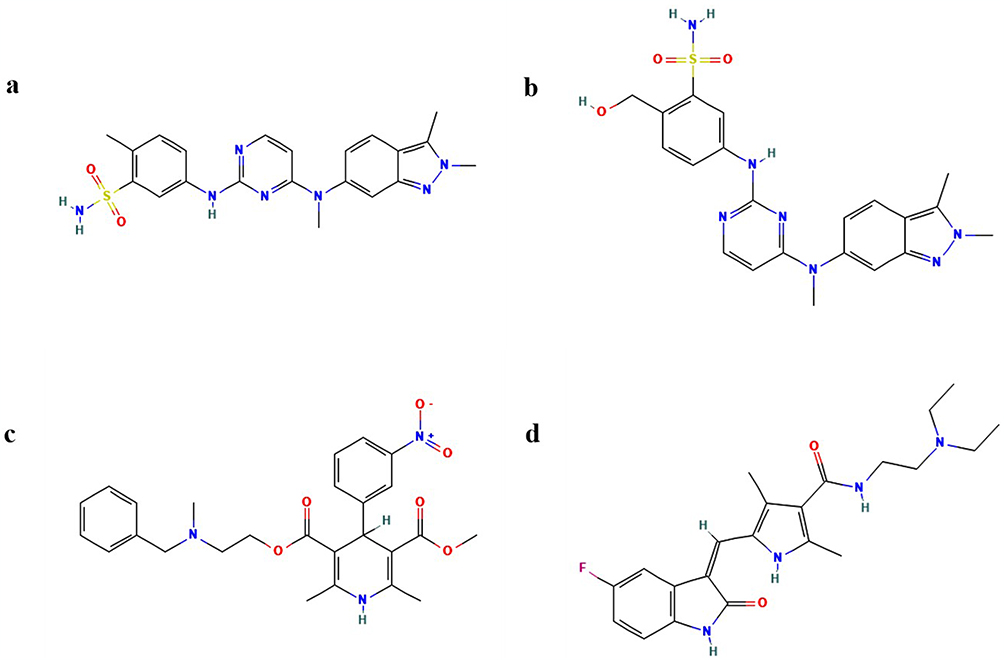 |
Figure 1 Schematic chemical structures of pazopanib (a), GSK-1268997 (b), nicardipine (c) and sunitinib (d). |
UPLC-MS/MS Analytical Conditions
Pazopanib and its primary metabolite (GSK-1268997) were analyzed using a Waters Acquity UPLC I-Class system coupled with a Waters Xevo TQ-S system, equipped with an electrospray ionization (ESI) interface. The column operating temperature was set to 40°C, and the injector temperature was 10°C. The mobile phase consisted of 0.1% formic acid (A) and acetonitrile (B), at a flow rate of 0.40 mL/min. Gradient program was conducted as follows: 0–0.5 min at 90% A, 0.5–1.0 min decreasing to 10%, 1.0–1.4 min maintaining 10%, 1.4–1.5 min increasing back to 90%, continuing until 2.0 min. The injection volume was 2.0 µL.
Mass spectrometric detection was performed in positive ionization mode using multiple reaction monitoring (MRM) to increase the sensitivity and specificity of the analysis. The parent and product ions of pazopanib, GSK-1268997 and IS were m/z 437.94→357.00, m/z 454.00→436.00 and m/z 399.30→286.96, respectively. The optimal MS parameters are summarized in Table 2.
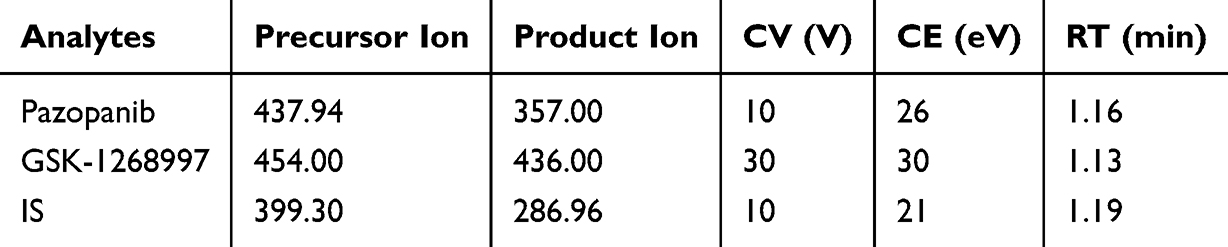 |
Table 2 Specific Mass Spectrometric Parameters and Retention Times (RTs) for the Analytes and IS, Including Cone Voltage (CV) and Collision Energy (CE) |
Preparation of RLM
This experiment was conducted on six Sprague-Dawley rats (weight 200 ± 10 g) after euthanasia, and liver tissue was immediately obtained. After weighing the liver, it was placed in an ice bath and homogenized using 0.01 mM phosphate-buffered saline (PBS) containing 0.25 mM sucrose. The homogenate was centrifuged twice at 11,000 rpm for 15 min each time, and the supernatant was collected while discarding the precipitate. The supernatant was then subjected to ultracentrifugation at 75,600 × g for 2 h. After removing the final supernatant, the obtained microsomal pellet was resuspended in 1× PBS and stored at −80°C for subsequent experiments. The microsomal preparation procedure was based on the method published by Wang et al.20 The protein content of the RLM was measured using a Bradford protein assay kit (Thermo Scientific, Waltham, MA, USA).21
Calibration Standards and Quality Control
The calibration standard concentrations of pazopanib diluted with methanol were 20, 50, 200, 500, 1000, 5000, 10,000 and 60,000 ng/mL. The concentrations of GSK-1268997 were 10, 50, 200, 500, 1000, 5000, 10,000 and 30,000 ng/mL. The lower limit of quantification (LLOQ) was 20 ng/mL for pazopanib and 10 ng/mL for GSK-1268997, and the upper limit of quantification (ULOQ) was 60,000 ng/mL and 30,000 ng/mL, respectively. The concentrations of the three quality control (QC) samples were 40, 24,000 and 48,000 ng/mL for pazopanib, and 20, 12,000 and 24,000 ng/mL for GSK-1268997. The IS working solution was prepared by dissolving sunitinib in methanol, then diluting it to a concentration of 200 ng/mL. All chemical reagents and solutions were stored at −80°C and allowed to reach room temperature before use.
Sample Preparation
In this experiment, protein precipitation technology was used to pretreat the samples. The specific implementation process included: adding 10 µL of IS working solution (concentration of 200 ng/mL) to 100 µL of plasma sample, followed by the addition of 300 µL of acetonitrile to achieve protein precipitation. After thorough mixing, the plasma sample was vortexed for 2 min, then centrifuged at 13,000 rpm for 10 min. Finally, 100 µL of the obtained supernatant was transferred to a sample container for subsequent UPLC-MS/MS analysis.
Method Validation
This research established and verified a rapid, stable and sensitive UPLC-MS/MS method for assessing the selectivity, sensitivity, linearity, precision, accuracy, matrix effect, recovery and stability. To ensure the precise and lawful identification of all substances, we meticulously carried out method validation in strict adherence to the directives from the U.S. Food and Drug Administration.22
To evaluate the selectivity, potential interfering signals near the retention times of each analyte were examined to ensure no endogenous or exogenous interference was present. A weighted least squares regression approach was applied for curve fitting. Sensitivity was determined by identifying the LLOQ, which was defined by a signal-to-noise ratio exceeding 10 times.
Precision and accuracy were evaluated using five replicates of QC samples at low, medium, and high concentrations of pazopanib and GSK-1268997, as well as at the LLOQ levels. Recovery and matrix effects were assessed using the QC samples at low, medium, and high concentrations. Intra-day and inter-day precision and accuracy were determined on the same day and over three consecutive days, respectively. Recovery was calculated by comparing the peak areas of samples before and after plasma extraction. The matrix effect was evaluated by comparing the peak areas of post-extraction spiked samples with those of pure standard solutions.
Stability assessments were conducted for pazopanib and GSK-1268997 using five replicate QC samples at low, medium and high concentrations. The analytes were tested under various storage conditions, including 3 h at room temperature, three weeks at −80°C, 4 h at 10°C in the autosampler after sample preparation, and three freeze-thaw cycles between −80°C and room temperature.
Enzyme Reaction of Pazopanib Using RLM and HLM
Pazopanib was dissolved in Dimethyl sulfoxide (DMSO) to prepare a concentration range of 0.5 to 100 μM, corresponding to a gradient designed around its Michaelis-Menten constant (Km). Each 200 μL incubation mixture consisted of 1× PBS, RLM or HLM at a final protein concentration of 0.3 mg/mL, 1 mM nicotinamide adenine dinucleotide phosphate (NADPH) as the cofactor, and varying concentrations of pazopanib. After mixing the reaction solution, the reaction was pre-incubated at 37°C for 5 min, followed by the addition of 1 mM NADPH to initiate the reaction and continued incubation for 30 min. The reaction was terminated by placing it at −80°C. After the samples were frozen for 1 h, the mixture was added 20 μL of the IS working solution (200 ng/mL) and 400 μL of acetonitrile. The mixture was vortexed for 2 min, centrifuged at 13,000 rpm for 10 min, and the supernatant of 100 μL was transferred to the sample vial and injected into UPLC-MS/MS for quantification of analytes.
Study on the Effect of Nicardipine on the Metabolic Process of Pazopanib in RLM and HLM
A 200 μL incubation mixture was prepared containing 1× PBS buffer, 0.3 mg/mL of RLM or HLM, 1 mM NADPH, along with nicardipine and pazopanib. The inhibitory effect of nicardipine on the metabolism of pazopanib was evaluated both in RLM and HLM through the half-maximal inhibitory concentration (IC50). The concentration of pazopanib was set according to the corresponding Km value, and the concentration of nicardipine was designed at a gradient of 0, 0.01, 0.1, 1, 10, 25, 50, and 100 μM. To elucidate the inhibitory mechanism of nicardipine on pazopanib, nicardipine was tested in the RLM system at concentrations of 0, 6.45, 12.90 and 25.80 μM, while pazopanib was tested at concentrations of 0.56, 1.13, 2.26, and 4.52 μM. In HLM, nicardipine was detected at concentrations of 0, 0.59, 1.18 and 2.36 μM, and pazopanib was detected at concentrations of 1.11, 2.22, 4.44, and 8.88 μM.
Animal Experiments
The Sprague-Dawley rats (with a weight range of 190–210 g) were supplied by the Animal Experiment Centre of the First Affiliated Hospital of Wenzhou Medical University (Zhejiang, China). All animal procedures were approved by the Institutional Animal Ethics Committee (Approval No. WYYY-IACUC-AEC-2025-002). Twelve Sprague-Dawley rats were selected for this study and were randomly divided into a control group (pazopanib) and an experimental group (nicardipine + pazopanib), with six rats in each group. The rats in the experimental group were first given nicardipine orally at a dose of 6 mg/kg.23 30 min later, both groups were given 40 mg/kg pazopanib orally.24 Blood samples were collected from the tail vein at the following time points after pazopanib administration: 0.5, 1, 1.5, 2, 2.5, 3, 3.5, 4, 6, 8, 12 and 24 h. The blood samples were then centrifuged at 8000 rpm for 10 min, and 100 μL of the supernatant was carefully collected as samples for subsequent plasma analysis.
Statistical Analysis
The GraphPad Prism 9.5 software (GraphPad, San Diego, CA) was used to generate the Km, IC50, the Lineweaver-Burk plot, and the mean plasma concentration-time curve. Non-compartmental analysis was conducted using DAS 3.0 software (Shanghai University of Traditional Chinese Medicine, China), and key pharmacokinetic parameters were obtained. Furthermore, SPSS 26.0 software (IBM Corp., Armonk, NY, US) was used for the t-test, and the p-value < 0.05 was regarded as statistically significant.
Results
Method Validation
As shown in Figure 2, the UPLC-MS/MS technique for quantifying pazopanib, GSK-1268997 and IS in plasma was established. Notably, no interference at the retention time was detected between pazopanib, GSK-1268997 and IS. The calibration curve of pazopanib exhibited a good linearity over the concentration range of 20–60000 ng/mL, with a linear regression equation of y = 0.00110954*x + 0.0156809 (r2 = 0.998). The LLOQ was set at 20 ng/mL. Similarly, the calibration curve of GSK-1268997 showed a good linearity within the range of 10–30,000 ng/mL, with a linear regression equation of y = 0.000705265*x + 0.00406308 (r2 = 0.998), and its LLOQ was set at 10 ng/mL.
 |
Figure 2 Representative MRM chromatograms of pazopanib, GSK-1268997 and IS in samples: blank plasma (a), blank plasma spiked with standard solutions (b), and plasma sample from rat orally administered pazopanib (c). |
The precision and accuracy of the method were evaluated by analyzing the LLOQ and low, medium, and high QC samples in both intra-day and inter-day assays. As summarized in Table 3, all relative standard deviations (RSD%) and relative errors (RE%) were within 15%, conforming to the predefined acceptance criteria. As shown in Table 4, the mean extraction recoveries of pazopanib and GSK-1268997 in rat plasma were consistent and satisfactory, ranging from 88.5% to 99.7% and 90.6% to 98.9%, respectively. The matrix effects ranged from 94.0% to 109.7% for pazopanib and from 88.9% to 105.1% for GSK-1268997, indicating no significant matrix suppression or enhancement was observed. These results were in full compliance with standard bioanalytical validation guidelines. In addition, the stability was assessed under various storage and processing conditions. As demonstrated in Table 5, the RSD% values for all QC samples were within ± 15%, thereby confirming the stability of both analytes under the conditions of the study.
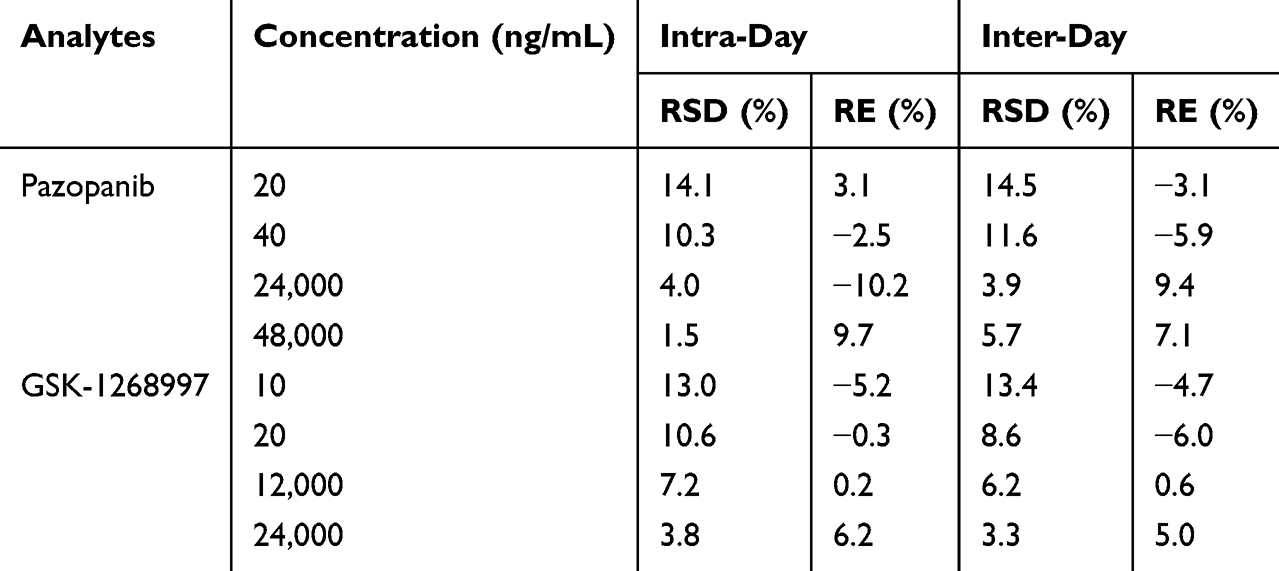 |
Table 3 Precision and Accuracy of Pazopanib and Its Metabolite GSK-1268997 in Rat Plasma (n = 5) |
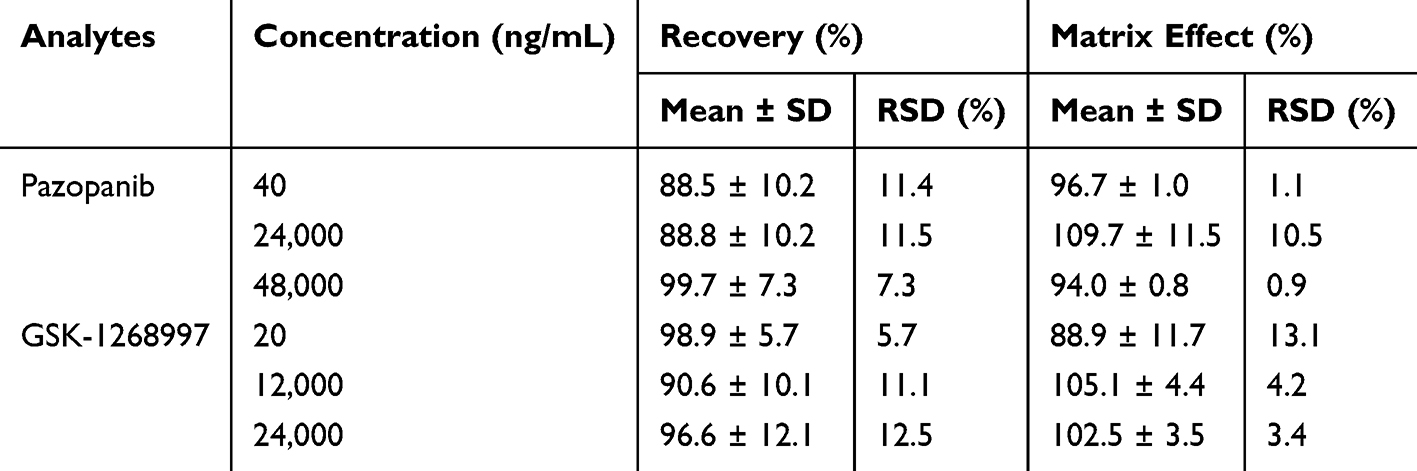 |
Table 4 Recovery and Matrix Effect of Pazopanib and GSK-1268997 in Rat Plasma (n = 5) |
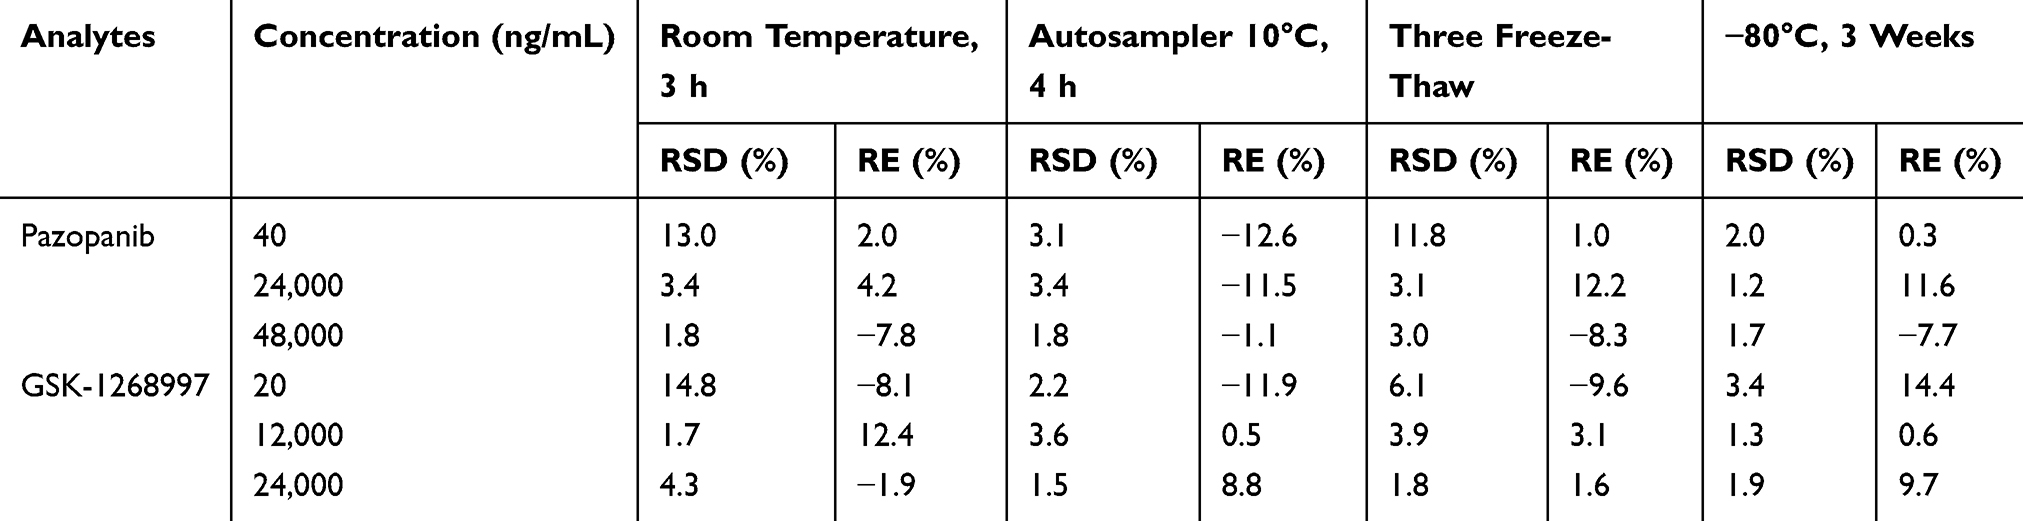 |
Table 5 Stability Results of Pazopanib and GSK-1268997 in Rat Plasma (n = 5) |
Effect of Nicardipine on the Enzyme Kinetics of Pazopanib in vitro
The Km values of pazopanib were determined by plotting the reaction rate against the substrate concentration (Figure 3). In RLM and HLM, the Km values were 2.26 μM and 4.44 μM, respectively. In this study, nicardipine exhibited an inhibition rate of 87.11%, indicating strong potential for DDI with pazopanib.
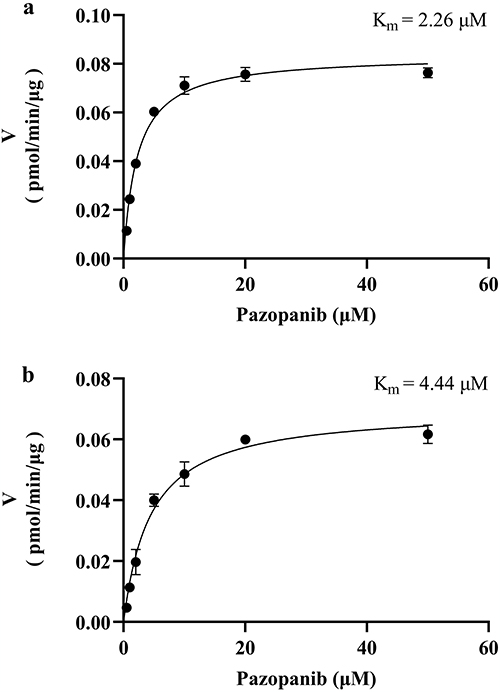 |
Figure 3 Michaelis–Menten kinetics of pazopanib in RLM (a) and HLM (b), n = 3. |
The IC50 curves of nicardipine in RLM and HLM are shown in Figure 4. The IC50 values indicated the effectiveness of the inhibition on pazopanib metabolism. The IC50 value of nicardipine was 12.90 μM in RLM and 1.18 μM in HLM, respectively. This suggested that nicardipine exhibited a stronger inhibitory effect in HLM than in RLM. Subsequently, the inhibition mechanism of nicardipine on pazopanib was investigated in both RLM and HLM.
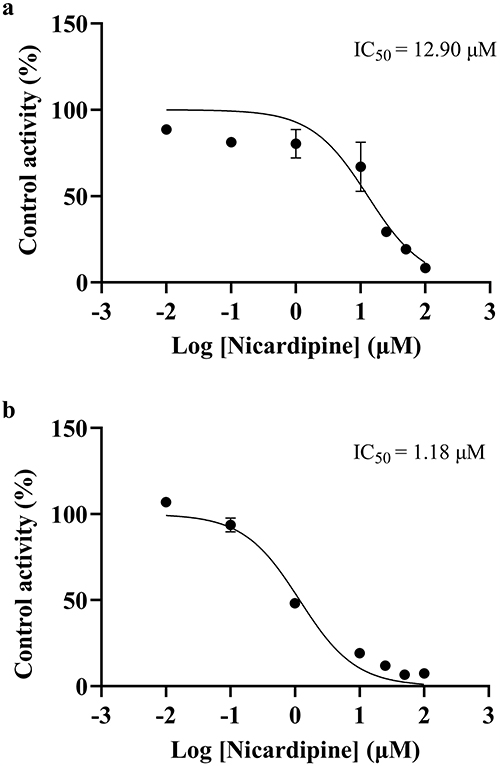 |
Figure 4 IC50 curves of nicardipine on pazopanib metabolism in RLM (a) and HLM (b), n = 3. |
Figure 5 showed the inhibition mechanism of nicardipine on the metabolism of pazopanib in RLM, where nicardipine exhibited competitive inhibition, competing for the same enzyme binding site as pazopanib, with an inhibition constant (Ki) value of 7.73 μM. However, the mechanism of nicardipine inhibition was altered in HLM. Figure 6 showed that the metabolic inhibition of pazopanib by nicardipine exhibited mix-type inhibition, with Ki and α values of 3.46 μM and 0.18, respectively.
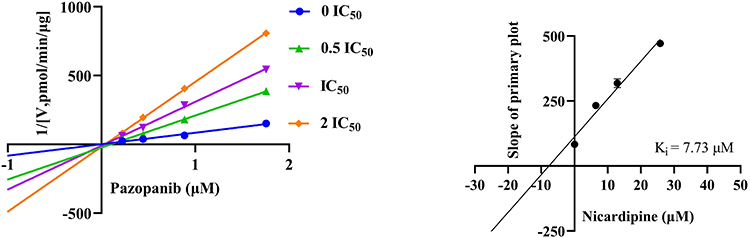 |
Figure 5 Lineweaver–Burk plot and the secondary plot for Ki in the inhibition of pazopanib metabolism by nicardipine with various concentrations in RLM, n = 3. |
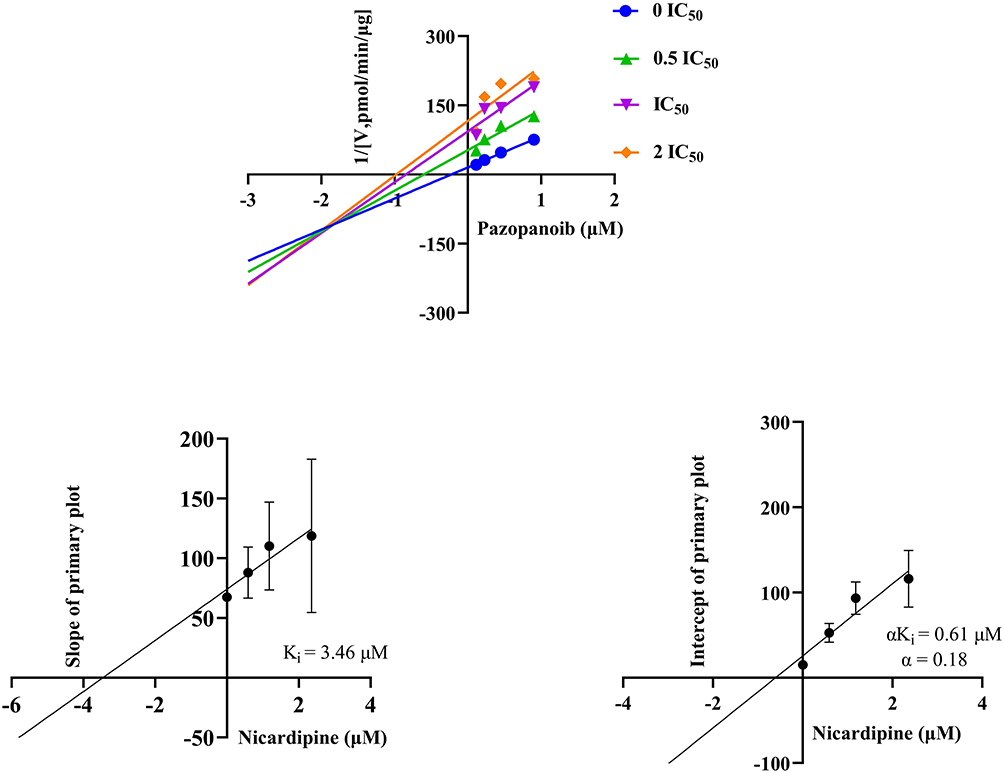 |
Figure 6 Lineweaver–Burk plot, the secondary plot for Ki, and the secondary plot for αKi in the inhibition of pazopanib metabolism by nicardipine with various concentrations in HLM, n = 3. |
Animal Study
Figure 7 shows the mean plasma concentration-time curves of pazopanib and GSK-1268997 in rat plasma. The key pharmacokinetic parameters are detailed in Tables 6 and 7. The AUC(0–t), AUC(0–∞) and maximum plasma concentration (Cmax) of pazopanib were increased by approximately 4.03-fold, 4.31-fold and 1.60-fold, respectively, compared to the control group. The plasma clearance (CLz/F) was decreased by approximately 78.26%, while the differences in other pharmacokinetic parameters were not statistically significant. The AUC(0–t) and AUC(0–∞) of GSK-1268997 were increased by approximately 4.54-fold and 5.02-fold, respectively, compared to the control group. The CLz/F was decreased by approximately 79.09%. Nicardipine significantly increased the plasma levels and systemic exposure of pazopanib in rats by inhibiting its metabolism. Other pharmacokinetic differences were not statistically significant.
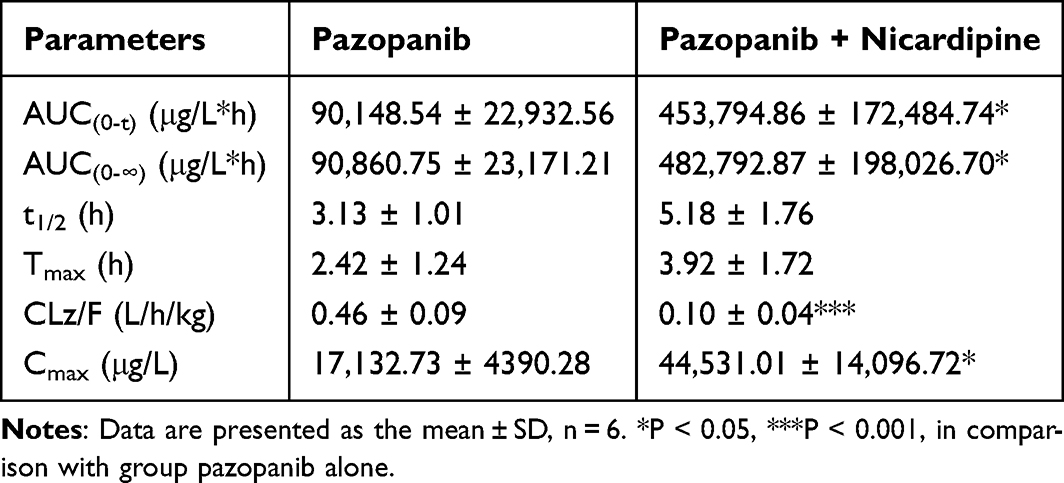 |
Table 6 The Main Pharmacokinetic Parameters of Pazopanib in Sprague-Dawley Rats |
 |
Table 7 The Main Pharmacokinetic Parameters of GSK-1268997 in Sprague-Dawley Rats |
 |
Figure 7 Mean plasma concentration–time curves of pazopanib (a), and GSK-1268997 (b) in rats. Data are presented as the mean ± SD, n = 6. |
Discussion
As a key regulator of angiogenesis, VEGF plays a crucial role in the development and progression of RCC. The abnormal activation of its signaling pathway is a significant driving factor in the disease.25 The use of VEGFR-TKI has broadened therapeutic strategies for advanced RCC.
VEGFR-TKIs, such as pazopanib, sunitinib, axitinib, and cabozantinib, represent a class of targeted anticancer agents.26 These drugs are now extensively applied in oncology and have shown efficacy in extending survival and, in some cases, achieving tumour remission. Pazopanib, a second-generation VEGFR-TKI, is among the most commonly prescribed agents for RCC.27 However, its use is frequently associated with adverse effects, particularly hypertension.28 Given that pazopanib is primarily metabolized by CYP3A429 and that many cardiovascular drugs, including the CCB nicardipine, are known CYP3A4 inhibitors,23,30,31 the potential for clinically significant DDI warrants investigation. Therefore, this study was designed to evaluate the metabolic interaction between pazopanib and nicardipine using both in vitro and in vivo approaches.
In our study, we firstly established and validated an UPLC-MS/MS method to analyze pazopanib in rat plasma, using sunitinib as the IS. According to the nature of the samples to be tested and the purpose of analysis, we used an aqueous solution of 0.1% formic acid and acetonitrile as the mobile phase. The experimental results showed that adding formic acid to the mobile phase increased the sensitivity of the samples and improved their peak shape. In addition, the gradient elution was more favorable for the separation of analytical peaks, and the one-step protein precipitation pretreatment of the sample with acetonitrile also resulted in satisfactory recoveries.32 Our assay offered distinct advantages. It enabled accurate quantification of both analytes using authentic standards, provided high sensitivity (LLOQ of 20 ng/mL for pazopanib and 10 ng/mL for GSK-1268997), and featured a short run time of 2.0 min, making it well-suited for high-throughput pharmacokinetic and DDI studies.
The results demonstrated that nicardipine inhibited the metabolism of pazopanib both in vivo and in vitro. The metabolic studies of pazopanib in vitro found that the IC50 of nicardipine for pazopanib was 12.90 μM and 1.18 μM in RLM and HLM, respectively, suggesting that nicardipine exhibited a moderate inhibitory effect on the metabolism of pazopanib. Further experiments showed that there were species differences in the inhibitory mechanism of nicardipine on pazopanib. In RLM, nicardipine inhibited pazopanib metabolism by a competitive inhibitory mechanism, whereas in HLM, pazopanib metabolism was inhibited by a mix-type inhibitory mechanism.
In vivo experiments from Sprague-Dawley rats showed the changes in the pharmacokinetic parameters of pazopanib, providing an evidence for the DDI between pazopanib and nicardipine. After combined administration of pazopanib and nicardipine in rats, the AUC(0–t) and AUC(0–∞) of pazopanib were increased by 4.03-fold and 4.31-fold, respectively, and the Cmax was increased by 1.60-fold, suggesting that nicardipine increased the oral bioavailability of pazopanib. Conversely, the CLz/F of pazopanib was decreased to approximately 78.26%, which indicated that nicardipine significantly inhibited the metabolism of pazopanib, resulting in a decrease in its clearance from the body. Compared to the control group, co-administration of pazopanib with nicardipine resulted in increased exposure and decreased plasma clearance of GSK-1268997. Previous literature had shown that the CYP3A4 inhibitor ketoconazole strongly impaired the metabolism of pazopanib,33 which supported the experimental findings. Previous studies have shown that co-administration of almonertinib with nicardipine significantly increases the systemic exposure of almonertinib. Compared with the use of almonertinib alone, co-administration of nicardipine resulted in increases for almonertinib in AUC(0–∞), AUC(0–t), and Cmax of 0.95-fold, 0.87-fold, and 1.01-fold, respectively.23 These findings were consistent with those observed in the present study.
Within the CYP450 family, CYP3A4 is responsible for the metabolism of numerous clinically used drugs and is a frequent site of pharmacokinetic interactions.34 The DDI between pazopanib and nicardipine may be attributed to the inhibition of the CYP3A4 enzymatic pathway. These findings have important clinical implications: co-administration of pazopanib with potent CYP3A4 inhibitors such as nicardipine should be approached with caution, and therapeutic drug monitoring may be warranted to avoid pazopanib-related toxicity. Furthermore, this study provides a valuable foundation for future preclinical and clinical investigations of pazopanib combination therapies.
Conclusion
In summary, the UPLC-MS/MS was first established and validated for the analysis of pazopanib and GSK-1268997 in rat plasma. This study further employed the technique to examine pazopanib pharmacokinetics and its DDI with nicardipine. The in vitro experiment showed that nicardipine inhibited the metabolism of pazopanib. Subsequently, an in vivo study in Sprague-Dawley rats showed that the exposure of pazopanib was significantly increased when co-administered with nicardipine. These findings suggest that concurrent use of pazopanib and nicardipine warrants careful monitoring to ensure the safety and efficacy of pazopanib in clinical applications.
Abbreviations
VEGFR-TKI, vascular endothelial growth factor receptor tyrosine kinase inhibitor; UPLC-MS/MS, ultra performance liquid chromatography tandem mass spectrometry; RCC, renal cell carcinoma; RLM, rat liver microsomes; HLM, human liver microsomes; CYP3A4, cytochrome P450 3A4; PDGFR, platelet-derived growth factor receptor; CCB, calcium channel blocker; DDI, drug-drug interaction; IS, internal standard; ESI, electrospray ionization; MRM, multiple reaction monitoring; PBS, phosphate-buffered saline; NADPH, nicotinamide adenine dinucleotide phosphate; LLOQ, lower limit of quantification; ULOQ, upper limit of quantification; QC, quality control; DMSO, Dimethyl sulfoxide; Km, Michaelis-Menten constant; IC50, half-maximal inhibitory concentration; RSD%, relative standard deviations; RE%, relative errors; Ki, inhibition constant; Cmax, the maximum plasma concentration; CLz/F, plasma clearance.
Author Contributions
All authors made a significant contribution to the work reported, whether that is in the conception, study design, execution, acquisition of data, analysis and interpretation, or in all these areas; took part in drafting, revising or critically reviewing the article; gave final approval of the version to be published; have agreed on the journal to which the article has been submitted; and agree to be accountable for all aspects of the work.
Funding
This research was supported by Wenzhou Science and Technology Bureau (Y20220407).
Disclosure
The authors declare that they have no known competing financial interests or personal relationships that could have appeared to influence the work reported in this paper.
References
1. Du YX, Li X, Ji SW, et al. Hypertension toxicity of VEGFR-TKIs in cancer treatment: incidence, mechanisms, and management strategies. Arch Toxicol. 2025;99(1):67–15. doi:10.1007/s00204-024-03874-4
2. Das S, Phillips S, Lee CL, et al. Efficacy and toxicity of anti-vascular endothelial growth receptor tyrosine kinase inhibitors in patients with neuroendocrine tumours - A systematic review and meta-analysis. Eur J Cancer. 2023;182:43–52. doi:10.1016/j.ejca.2022.12.031
3. Li W, Feng C, Di W, et al. Clinical use of vascular endothelial growth factor receptor inhibitors for the treatment of renal cell carcinoma. Eur J Med Chem. 2020;200:112482. doi:10.1016/j.ejmech.2020.112482
4. Henriques SC, Leblanc A, Simões S, et al. Unveiling the potential of C(max)f(2) factor applied to pilot bioavailability/bioequivalence studies-a case study with pazopanib drug products. Pharmaceutics. 2024;16(12). doi:10.3390/pharmaceutics16121579
5. Sternberg CN, Davis ID, Mardiak J, et al. Pazopanib in locally advanced or metastatic renal cell carcinoma: results of a randomized Phase III trial. J Clin Oncol. 2010;28(6):1061–1068. doi:10.1200/JCO.2009.23.9764
6. Van Der Graaf WT, Blay JY, Chawla SP, et al. Pazopanib for metastatic soft-tissue sarcoma (PALETTE): a randomised, double-blind, placebo-controlled Phase 3 trial. Lancet. 2012;379(9829):1879–1886. doi:10.1016/S0140-6736(12)60651-5
7. Paludetto MN, Puisset F, Le Louedec F, et al. Simultaneous monitoring of pazopanib and its metabolites by UPLC-MS/MS. J Pharm Biomed Anal. 2018;154:373–383. doi:10.1016/j.jpba.2018.03.013
8. Deng Y, Sychterz C, Suttle AB, et al. Bioavailability, metabolism and disposition of oral pazopanib in patients with advanced cancer. Xenobiotica. 2013;43(5):443–453. doi:10.3109/00498254.2012.734642
9. Yoshida Y, Takahashi M, Komine K, et al. Correlation between efficacy and cardiovascular adverse events in patients with advanced solid cancer who received VEGF pathway inhibitors: hypertension within the first eight weeks is associated with favorable outcomes of patients treated with VEGF pathway inhibitors. Intern Med. 2025;64(2):177–185. doi:10.2169/internalmedicine.3373-23
10. Touyz RM, Herrmann J. Cardiotoxicity with vascular endothelial growth factor inhibitor therapy. NPJ Precis Oncol. 2018;2:13. doi:10.1038/s41698-018-0056-z
11. Andrae J, Gallini R, Betsholtz C. Role of platelet-derived growth factors in physiology and medicine. Genes Dev. 2008;22(10):1276–1312. doi:10.1101/gad.1653708
12. Chintalgattu V, Ai D, Langley RR, et al. Cardiomyocyte PDGFR-beta signaling is an essential component of the mouse cardiac response to load-induced stress. J Clin Invest. 2010;120(2):472–484. doi:10.1172/JCI39434
13. Ayub A, Zamir A, Imran I, et al. Clinical pharmacokinetics and pharmacodynamics of nicardipine; a systematic review. Expert Opin Drug Metab Toxicol. 2024;20(11–12):1053–1067. doi:10.1080/17425255.2024.2402481
14. Sassi MB, Gaies E, Salouage I, et al. Involvement of CYP 3A5 in the interaction between tacrolimus and nicardipine: a case report. Curr Drug Saf. 2015;10(3):254–256. doi:10.2174/1574886310666150512105459
15. Jolibois J, Schmitt A, Royer B. A simple and fast LC-MS/MS method for the routine measurement of cabozantinib, olaparib, palbociclib, pazopanib, sorafenib, sunitinib and its main active metabolite in human plasma. J Chromatogr B Analyt Technol Biomed Life Sci. 2019;1132:121844. doi:10.1016/j.jchromb.2019.121844
16. Cardoso E, Mercier T, Wagner AD, et al. Quantification of the next-generation oral anti-tumor drugs dabrafenib, trametinib, vemurafenib, cobimetinib, pazopanib, regorafenib and two metabolites in human plasma by liquid chromatography-tandem mass spectrometry. J Chromatogr B Analyt Technol Biomed Life Sci. 2018;1083:124–136. doi:10.1016/j.jchromb.2018.02.008
17. Minocha M, Khurana V, Mitra AK. Determination of pazopanib (GW-786034) in mouse plasma and brain tissue by liquid chromatography-tandem mass spectrometry (LC/MS-MS). J Chromatogr B Analyt Technol Biomed Life Sci. 2012;901:85–92. doi:10.1016/j.jchromb.2012.06.004
18. Shiraiwa K, Suzuki Y, Tanaka K, et al. Development of a high-throughput quantification method for pazopanib using ultra-performance liquid chromatography-tandem mass spectrometry and its clinical application in patients with soft tissue tumors. Ther Drug Monit. 2021;43(3):416–421. doi:10.1097/FTD.0000000000000821
19. Toh YL, Pang YY, Shwe M, et al. HPLC-MS/MS coupled with equilibrium dialysis method for quantification of free drug concentration of pazopanib in plasma. Heliyon. 2020;6(4):e03813. doi:10.1016/j.heliyon.2020.e03813
20. Wang Z, Sun W, Huang CK, et al. Inhibitory effects of curcumin on activity of cytochrome P450 2C9 enzyme in human and 2C11 in rat liver microsomes. Drug Dev Ind Pharm. 2015;41(4):613–616. doi:10.3109/03639045.2014.886697
21. Kielkopf CL, Bauer W, Urbatsch IL. Methods for measuring the concentrations of proteins. Cold Spring Harb Protoc. 2020;2020(4):102277. doi:10.1101/pdb.top102277
22. Awosemo O, Neelakantan H, Watowich S, et al. Development & validation of LC-MS/MS assay for 5-amino-1-methyl quinolinium in rat plasma: application to pharmacokinetic and oral bioavailability studies. J Pharm Biomed Anal. 2021;204:114255. doi:10.1016/j.jpba.2021.114255
23. Chen D, Chen J, Shen Y, et al. Optimization of a sensitive and reliable UPLC-MS/MS method to simultaneously quantify almonertinib and HAS-719 and its application to study the interaction with nicardipine. Pharm Biol. 2024;62(1):874–881. doi:10.1080/13880209.2024.2425648
24. Westerdijk K, Desar IME, Steeghs N, et al. Imatinib, sunitinib and pazopanib: from flat-fixed dosing towards a pharmacokinetically guided personalized dose. Br J Clin Pharmacol. 2020;86(2):258–273. doi:10.1111/bcp.14185
25. Qin Q, Tachibana I, Margulis V, et al. A review of neoadjuvant therapy for localized and locally advanced renal cell carcinoma. Cancers. 2025;17(2). doi:10.3390/cancers17020312
26. Urquhart AJ, Glass CH, Humphries TLR, et al. Head-to-head comparison of tyrosine kinase inhibitors in renal cell carcinoma using patient-derived cell culture. Per Med. 2025;22(2):83–91. doi:10.1080/17410541.2025.2473303
27. Narayan V, Liu T, Song Y, et al. Early increases in blood pressure and major adverse cardiovascular events in patients with renal cell carcinoma and thyroid cancer treated with VEGFR TKIs. J Natl Compr Canc Netw. 2023;21(10):1039–1049.e10. doi:10.6004/jnccn.2023.7047
28. Kunitake M, Goto A, Sakai Y, et al. Exploring Predictors of Hypertension Development With Pazopanib and Examining Predictive Performance Over Time. In Vivo. 2024;38(4):1882–1890. doi:10.21873/invivo.13643
29. Agarwal N, Mangla A. Elderberry interaction with pazopanib in a patient with soft‑tissue sarcoma: a case report and literature review. Mol Clin Oncol. 2024;20(5):36. doi:10.3892/mco.2024.2734
30. Lee JM, Yoon JH, Maeng HJ, et al. Physiologically Based Pharmacokinetic (PBPK) modeling to predict CYP3A-mediated drug interaction between saxagliptin and nicardipine: bridging rat-to-human extrapolation. Pharmaceutics. 2024;16(2). doi:10.3390/pharmaceutics16020280
31. Sorkin EM, Clissold SP. Nicardipine: a review of its pharmacodynamic and pharmacokinetic properties, and therapeutic efficacy, in the treatment of angina pectoris, hypertension and related cardiovascular disorders. Drugs. 1987;33(4):296–345. doi:10.2165/00003495-198733040-00002
32. Wei L, Zhu P, Chen X, et al. An ultra high performance liquid chromatography with tandem mass spectrometry method for simultaneous determination of thirteen components extracted from Radix Puerariae in rat plasma and tissues: application to pharmacokinetic and tissue distribution study. J Sep Sci. 2020;43(2):418–437. doi:10.1002/jssc.201900824
33. Weiss J, Foerster KI, Weber M, et al. Does the circulating ketoconazole metabolite N-deacetyl ketoconazole contribute to the drug-drug interaction potential of the parent compound? Eur J Pharm Sci. 2022;169:106076. doi:10.1016/j.ejps.2021.106076
34. Zhou SF, Xue CC, Yu XQ, et al. Clinically important drug interactions potentially involving mechanism-based inhibition of cytochrome P450 3A4 and the role of therapeutic drug monitoring. Ther Drug Monit. 2007;29(6):687–710. doi:10.1097/FTD.0b013e31815c16f5
 © 2026 The Author(s). This work is published and licensed by Dove Medical Press Limited. The
full terms of this license are available at https://www.dovepress.com/terms
and incorporate the Creative Commons Attribution
- Non Commercial (unported, 4.0) License.
By accessing the work you hereby accept the Terms. Non-commercial uses of the work are permitted
without any further permission from Dove Medical Press Limited, provided the work is properly
attributed. For permission for commercial use of this work, please see paragraphs 4.2 and 5 of our Terms.
© 2026 The Author(s). This work is published and licensed by Dove Medical Press Limited. The
full terms of this license are available at https://www.dovepress.com/terms
and incorporate the Creative Commons Attribution
- Non Commercial (unported, 4.0) License.
By accessing the work you hereby accept the Terms. Non-commercial uses of the work are permitted
without any further permission from Dove Medical Press Limited, provided the work is properly
attributed. For permission for commercial use of this work, please see paragraphs 4.2 and 5 of our Terms.