Back to Archived Journals » Open Access Journal of Sports Medicine » Volume 6
Optimal V̇O2max-to-mass ratio for predicting 15 km performance among elite male cross-country skiers
Authors Carlsson T, Carlsson M, Hammarström D, Rønnestad BR, Malm C, Tonkonogi M
Received 27 July 2015
Accepted for publication 15 September 2015
Published 16 December 2015 Volume 2015:6 Pages 353—360
DOI https://doi.org/10.2147/OAJSM.S93174
Checked for plagiarism Yes
Review by Single anonymous peer review
Peer reviewer comments 3
Editor who approved publication: Prof. Dr. Andreas Imhoff
Tomas Carlsson,1,2 Magnus Carlsson,1,2 Daniel Hammarström,3 Bent R Rønnestad,3 Christer B Malm,2 Michail Tonkonogi1
1School of Education, Health and Social Studies, Dalarna University, Falun, 2Sports Medicine Unit, Umeå University, Umeå, Sweden; 3The Lillehammer Research Center for Medicine and Exercise Physiology, Lillehammer University College, Lillehammer, Norway
Abstract: The aim of this study was 1) to validate the 0.5 body-mass exponent for maximal oxygen uptake (V̇O2max) as the optimal predictor of performance in a 15 km classical-technique skiing competition among elite male cross-country skiers and 2) to evaluate the influence of distance covered on the body-mass exponent for V̇O2max among elite male skiers. Twenty-four elite male skiers (age: 21.4±3.3 years [mean ± standard deviation]) completed an incremental treadmill roller-skiing test to determine their V̇O2max. Performance data were collected from a 15 km classical-technique cross-country skiing competition performed on a 5 km course. Power-function modeling (ie, an allometric scaling approach) was used to establish the optimal body-mass exponent for V̇O2max to predict the skiing performance. The optimal power-function models were found to be race speed = 8.83 • (V̇O2max m-0.53)0.66 and lap speed = 5.89 • (V̇O2max m-(0.49+0.018lap))0.43e0.010age, which explained 69% and 81% of the variance in skiing speed, respectively. All the variables contributed to the models. Based on the validation results, it may be recommended that V̇O2max divided by the square root of body mass (mL • min-1 • kg-0.5) should be used when elite male skiers’ performance capability in 15 km classical-technique races is evaluated. Moreover, the body-mass exponent for V̇O2max was demonstrated to be influenced by the distance covered, indicating that heavier skiers have a more pronounced positive pacing profile (ie, race speed gradually decreasing throughout the race) compared to that of lighter skiers.
Keywords: allometric scaling, maximal oxygen uptake, cross-country skiing, pacing
Introduction
Much time and effort is spent by athletes performing expensive physiological tests in sport science laboratories to monitor their physiological status and provide valuable information for follow-up and optimization of the training process. Hence, it is important to use validated tests, where the test variables are indicators of competitive performance, in each discipline, in the specific sport; otherwise, the test results could potentially mislead the athletes in their training. Moreover, to adequately evaluate an athlete’s performance capability via physiological tests, it is essential to determine how each test variable should be expressed relative to body mass (eg, absolute expression, simple ratio-standard scaled expression, or expression scaled with a specific body-mass exponent). The optimal body-mass exponent for indicating performance in a specific sport discipline predominantly depends on the magnitude of the counteracting forces (eg, gravitational force, air resistance, and friction) that the athlete must overcome by muscle-force generation.1–4 The varying influence of body mass on different disciplines emphasizes the importance of validating a test variable concerning the suggested optimal body-mass exponent as a performance indicator in the specific sport discipline.
A test variable that indicates performance in many endurance sports is the maximal oxygen uptake ( O2max). In cross-country skiing, O2max has been correlated with distance-race (5–50 km) performances for different groups of skiers (eg, elite, juniors, and recreational),5–9 and these correlations were generally based on O2max expressed absolutely (L · min−1) or as a simple ratio standard (mL · min−1 · kg−1). Moreover, it was previously suggested that the allometrically scaled O2max, expressed as mL · min−1 · kg−0.67, would be a better predictor of performance in distance races compared to the simple ratio-standard scaled expression.10 Theoretically, this O2max expression will partition out the differences in body size (eg, body mass) in accordance with the “surface law”, which emphasizes that when body mass and volume increase, there is a disproportionate reduction in the surface area.11 Another proposed exponent is derived from the discovery that the metabolism of species, which differ markedly in body mass, is normalized by a 0.75 body-mass exponent; an explanation for this proportionality is the “theory of elasticity” in which it is suggested that the absorption and release of energy from the body’s structures (eg, tendons) can influence the relationship between body mass and metabolic rate.12 A body-mass exponent of 0.75 has also been proposed to reflect physiological capabilities, such as metabolic rate, cardiac output, and oxygen-consumption rate13 that are variables that are closely related to O2max. In a more recent study, a body-mass exponent of 0.73 was suggested to eliminate the body-size differences in O2max for a large group of elite athletes from different sports.14
In cross-country skiing, the 0.67 body-mass exponent for O2max is suggested to be appropriate if the objective is to equalize skiers for differences in body mass;4 therefore, if O2max (mL · min−1 · kg−0.67) is used for the evaluation of cross-country skiers, it will indicate the “physiological capability” related to the aerobic energy-supply system. Hence, if the magnitude of the counteracting forces for the specific skiing discipline is “body-mass neutral”, the 0.67 exponent would also optimally indicate the skiing performance. However, the performance in distance races has been shown to be positively related to body mass of the skiers,4,15 indicating that heavier skiers are preferred compared to lighter skiers.4 To determine the “performance capability” of cross-country skiers, the influence of body mass needs to be considered by using an allometric scaling approach that uses both O2max and body mass as predictor variables. The scaling of O2max was based on a previously described allometric scaling approach, which has several advantages over the simple ratio-standard scaling method.16 This approach has been used to explain the performance in different endurance sports, such as cycling,17,18 running,16,19 and cross-country skiing,20,21 based on the athletes’ O2max and body mass.
Previously, it was showed that a body-mass exponent of 0.48 for O2max, ie, expressed as mL · min−1 · kg−0.48, was optimal for explaining the performance in a 15 km classical-technique skiing competition among elite male skiers;21 to facilitate the usage of this finding, it was suggested to use a body-mass exponent of 0.5, ie, O2max divided by the square root of body mass (mL · min−1 · kg−0.5), for evaluating an elite male skier’s performance capability in 15 km races. This suggestion is supported by a previous study that reported that O2max expressed as mL · min−1 · kg−0.5 was a better estimate of performance capability among world-class male skiers than the use of the 0.67 body-mass exponent.3 Moreover, in the aforementioned study,21 the 95% confidence interval (CI) for the body-mass exponent for O2max did not include either 0 or 1, which suggests that the commonly used absolute and simple ratio-standard scaled expression should not be used for evaluating elite male skiers’ performance capabilities in 15 km classical-technique skiing races. Hence, to make an appropriate evaluation of an elite skier’s performance capability, it is important to use the O2max-to-mass ratio that optimally indicates the performance.
In cross-country skiing, the International Ski Federation competitions are performed on homologated courses (ie, specific norms for height differences and an equal proportion of uphill, downhill, and undulating terrain sections). Therefore, it may be suggested that the 0.5 body-mass exponent for O2max is a general indicator of performance in 15 km classical technique skiing races in elite male cross-country skiing. However, because there are a variety of elements that could potentially affect the performance, validation of the previously suggested 0.5 body-mass exponent is necessary. To investigate the predictive validity of the 0.5 exponent, performance in a 15 km classical technique skiing competition performed on a new (homologated) course for a new sample of elite male skiers is required; therefore, one purpose of this study was to determine whether the 0.5 body-mass exponent for O2max optimally predicts a “new” 15 km performance.
It has previously been reported that the body-mass exponent for O2max is affected by the course inclination;21 hence, lighter elite male skiers are preferred when a large proportion of the counteracting force is induced by gravity. Consequently, skiers with a lower body mass will, in general, have a relatively faster skiing speed in steep uphill sections than their heavier counterparts, whereas heavier skiers, in general, are favored in downhill, flat, and moderate uphill sections.3,4 Another factor related to variations in skiing speed is the skier’s ability to choose a pacing strategy according to his/her physiological status and the characteristics of the race. Previous studies, with race distances ranging from 1.4 to 30 km, demonstrated that cross-country skiers adopted a positive pacing profile (ie, race speed gradually decreasing throughout the race).8,22,23 The reduction in skiing speed between the first and second parts of a race is (for elite male skiers) correlated with O2max expressed as a simple ratio standard.22 A body-mass exponent of 1 for this relationship may indicate that lighter skiers are progressively more favored during the latter part of a race. Furthermore, the reduced overall skiing speed during the second part is reflected by a reduction in speed on uphill sections.22,23 If more time is spent in ascents and uphill skiing is associated with a higher body-mass exponent for O2max, the distance covered would likely influence the body-mass exponent.
The aim of this study was 1) to validate the 0.5 body-mass exponent for O2max as the optimal predictor of performance in 15 km classical technique skiing competitions among elite male cross-country skiers and 2) to evaluate the influence of distance covered on the body-mass exponent for O2max among elite male skiers. We postulated that the optimal body-mass exponent for O2max to indicate the performance in 15 km classical-technique skiing competitions among elite male skiers would be 0.5 and that the optimal body-mass exponent would increase for each new lap of the 15 km race.
Methods
Study design
The subjects completed an incremental treadmill roller-skiing test to determine their O2max. Performance data were collected from a 15 km Scandinavian Cup competition performed using the classical technique with an interval start.
Subjects
Twenty-four Swedish and Norwegian elite male (age: 21.4±3.3 years [mean ± standard deviation]; stature: 180.4±6.0 cm; body mass: 75.5±6.3 kg) cross-country skiers, competing at the national and international levels, volunteered to participate in the study. All the subjects provided written informed consent to participate. The test procedures were performed in accordance with the World Medical Association’s Declaration of Helsinki – Ethical Principles for Medical Research Involving Human Subjects 2008, and the study was approved by the Regional Ethical Review Board, Uppsala, Sweden.
Maximal oxygen uptake test
O2max tests were conducted in the sport science laboratories at Dalarna University (n=19), Umeå University (n=1), and Lillehammer University College (n=4). All the tests commenced with roller skiing on a motor-driven treadmill (Dalarna University: OJK-2, Telineyhtymä, Kotka, Finland; Umeå University and Lillehammer University College: RL 3500; Rodby Innovation AB, Vänge, Sweden) using the diagonal-stride technique, and the subjects used roller skis (Pro-Ski C2; Sterners Specialfabrik AB, Dala-Järna, Sweden) provided by the sport science laboratories. Throughout the O2max test, parameters of expired air were continuously analyzed using a metabolic cart in mixing-chamber mode (Jaeger Oxycon Pro; Erich Jaeger GmbH, Hoechberg, Germany), which was calibrated according to the specifications of the manufacturer before each test. To investigate whether the oxygen-uptake measurements in the laboratories differed, the subjects’ oxygen uptake (mL · min−1 · kg−1) at a submaximal intensity, during the O2max tests, was analyzed. The equipment in the laboratory that performed the largest number of O2max tests was used as a reference, and a CI was calculated for the subjects’ oxygen uptakes. Thereafter, mean oxygen-uptake calculations, at the same work intensity, were performed for the other two sport science laboratories and these mean values were comprised in the CI calculated for the reference laboratory; hence, no difference in the oxygen-uptake measurements was found.
Based on the individual ski ranking, the subjects were assigned to one of two test protocols for the incremental treadmill roller-skiing test for determining O2max to avoid a too short time of volitional exhaustion. The starting treadmill speeds/inclinations for the first minute of the O2max test were 10.0 km · h−1/3.0° for the lower ranked subjects (n=8) and 11.0 km · h−1/4.0° for the higher ranked subjects (n=16). Thereafter, the inclination was increased by 1° every minute up to 10° while maintaining a constant treadmill speed. Subsequently, while maintaining an inclination of 10°, the speed was increased by 0.5 km · h−1 every 60 seconds and 30 seconds for the subjects with lower and higher ski rankings, respectively. In all, 2 minutes and 5 minutes after the time of volitional exhaustion, capillary blood samples were collected from a fingertip and the samples were analyzed to determine blood lactate concentrations (Bla) (Biosen 5140; EKF-diagnostic GmbH, Barleben, Germany). The O2max was defined as the highest mean oxygen uptake during a 60-second period when meeting the criterion of a plateau in oxygen uptake despite an increased exercise intensity. The plateau was identified as previously described24 and was based on the recognition of data points that fell outside (and below) the extrapolated CI for the O2–work rate relationship.
Performance data
The 15 km competition utilized a 5 km course (Figure 1), which met the International Ski Federation’s norms of homologated competition courses. The course consisted of 162 m of total climbing, a maximal altitude difference of 48 m, and a maximal continuous climbing section of 44 m. Time-base stations (EMIT eLine Base Station; EMIT AS, Oslo, Norway) were used to calculate the lap-split times and finish times. Consequent to different positions of the time-base stations for start, lap-split, and completion times, the distance of lap 1 was 5.22 km (A–B), lap 2 5.25 km (B–B), and lap 3 5.00 km (B–C). The weather conditions during the race were snow with an air temperature of −2°C and a snow temperature of −3°C, with stable track and waxing conditions.
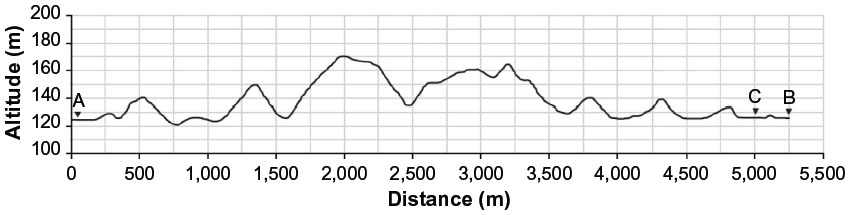 | Figure 1 Course profile of the 5 km lap in the 15 km competition, where triangles represent time-base stations for start (A), lap split (B), and finish (C). |
To control for the potential influence of waxing on the skiing results, the subjects completed a questionnaire to evaluate the waxing of their skis (glide and grip) using a 0–100 mm visual analog scale (VAS). The subjects’ completion times and lap-split times were converted to mean skiing speeds (hereafter referred to as race speed and lap speed, respectively), which were used as competitive performance measures for subsequent scaling analyses. The fastest skier out of 275 participants completed the 15 km race at a race speed of 6.60 m · s−1.
Statistical analyses
To establish the optimal body-mass exponent for O2max with regard to race performance, a previously used power-function model21 was applied to predict the race speed in the 15 km race:

where race speed is the mean skiing speed for the actual race (m · s−1), β0 is a constant, O2max is the maximal oxygen uptake (L · min−1), m is the body mass (kg), ε is the multiplicative error ratio, and β1 and β2 are the scaling exponents used to predict the race speed based on the independent variables O2max and m. Log transformation of Model 1 yielded:

Linearization of the model allowed linear regression to be used, by fitting a least-squares regression line to the log-transformed data,16 to estimate the constant β0 and the scaling exponents β1 to β2.
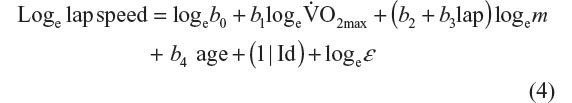
To evaluate how O2max, body mass, lap number, and age influenced the lap speed, the following power-function model was applied:

where lap speed is the mean skiing speed for the actual lap (m · s−1); b0 is a constant; O2max is the maximal oxygen uptake (L · min−1); m is the body mass (kg); lap is the number of the lap coded as lap 1=0, lap 2=1, and lap 3=2; e is the base of the exponential function; age is the age of the subject (years); (1|Id) is a control for random effects to account for potential within-subjects variation25 (Id represents the identifier number of the subjects and the random effect is evaluated by intraclass correlation coefficient = (σId)2/((σId)2+(σ)2)); ε is the multiplicative error ratio; and b1, b2, b3, and b4 are the scaling exponents used to predict the lap speed based on the independent variables of O2max, m, lap, and age, respectively. Log transformation of Model 3 yielded:
Model 4 enabled linear regression to be used, by fitting a least-squares regression line to the log-transformed data, to estimate the constant b0 and the scaling exponents b1 to b4.
Pearson’s product–moment correlation coefficient test was used to evaluate the linear relationships between O2max and race speed. Correlation analyses were also performed to investigate the potential relationships between VAS ski-waxing data and race speed. The partial r2 for the model variables to describe loge race speed and loge lap speed was calculated to determine each variable’s unique contribution to the model. A one-way repeated measures analysis of variance (ANOVA) was used to compare lap speeds. The statistical analyses were processed using the R statistical data program, Version 2.13.2 (R Development Core Team, Auckland, New Zealand) and IBM SPSS Statistics software, Version 20 (IBM Corporation, Armonk, NY, USA), with all the tests performed at an alpha of 0.05.
Results
Test results and performance data
The O2max values obtained were 5.39±0.57 · L · min−1, 620±60 mL · min−1 · kg−0.5, or 71.5±6.4 mL · min−1 · kg−1. The time of volitional exhaustion was 446±58 seconds, and the maximal Bla was 14.9±2.6 mmol · L−1. The race speed was 5.83±0.41 m · s−1, and the lap speeds for the three consecutive laps were 6.08±0.39, 5.76±0.42, and 5.66±0.43 m · s−1. The one-way repeated measures ANOVA displayed a significant effect of lap number on the pacing-induced lap speeds (F2,46=221.32, P<0.001, partial η2=0.906). Post hoc tests using Bonferroni’s correction revealed a consecutive reduction in lap speed for each new lap (lap 1 vs lap 2, P<0.001; lap 2 vs lap 3, P<0.001). Results of the ski-waxing questionnaire using the VAS were 71±12 and 70±21 mm for the ski-waxing categories, ski glide and ski grip, respectively.
Correlations were found between race speed and O2max when expressed both absolutely (r=0.76, P<0.001) and as a simple ratio standard (r=0.76, P<0.001), whereas the correlation coefficient was 0.83 (P<0.001) for the relationship between allometric-scaled O2max (mL · min−1 · kg−0.5) and race speed. There were no correlations between race speed and VAS ski-waxing categories, ski glide (r=−0.07, P=0.73) and ski grip (r=0.10, P=0.64).
Modeling race speed
Statistical modeling based on Model 2 yielded:

Model 5 explained 69% of the variance in loge race speed (P<0.001), with the constant (P<0.001), loge O2max (P<0.001), and loge m (P=0.014) all contributing to the model.
The partial r2 values for the model variables (loge O2max) and (loge m) were 65% and 11%, respectively. Retransformation of Model 5 yielded:

which explained 69% of the variance in race speed for the 15 km competition (P<0.001; Figure 2A). To permit comparisons of the model variable estimate for β2 with corresponding body-mass exponents for O2max from the previous studies, the CI for the 0.53 body-mass exponent was calculated that ranged from 0.94 to 0.12.
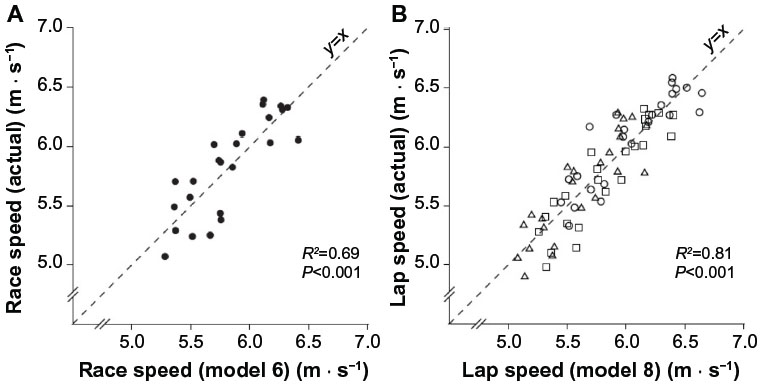 | Figure 2 Relationships between model and actual (A) race speeds in the 15 km competition and (B) lap speeds for the three consecutive 5 km laps, where lap 1 is represented by circles, lap 2 squares, and lap 3 triangles. |
Modeling lap speed
Statistical modeling based on Model 4 yielded:
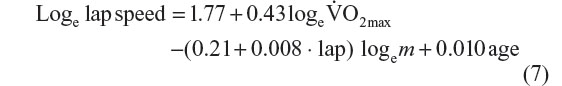
Model 7 explained 81% of the variance in the loge lap speed (P<0.001). The constant (P<0.001), loge O2max (P<0.001), lap (P<0.001), loge m (P=0.044), and age (P<0.001) all contributed to the model, and the variance component intraclass correlation coefficient was 0.76. The partial r2 values for the model variables (loge O2max), (loge m), (lap · loge m), and (age) were 13%, 3%, 15%, and 10%, respectively. Retransformation of Model 7 yielded:

which explained 81% of the variance in lap speed (P<0.001; Figure 2B).
Discussion
The present finding of an optimal body-mass exponent for O2max of 0.53 as an indicator of performance in the 15 km classical technique race among elite male cross-country skiers is close to the value of 0.48 determined previously.21 The result of the validation, where performance data were collected from a new sample of skiers and on a new course, supports the use of the 0.5 body-mass exponent as the optimal indicator of performance in 15 km classical technique skiing competition among elite male skiers, which is consistent with the previous recommendations.3,21 Therefore, we recommend that O2max divided by the square root of body mass should be used for evaluating elite male skiers’ performance capability in 15 km classical technique skiing races. The CI for the body-mass exponent did not include either 0 or 1, which is consistent with the previous results.21 Consequently, the use of absolute or simple ratio-standard scaled expressions of O2max should be avoided if the objective is to adequately evaluate an elite male skier’s performance capability in 15 km races. Hence, the use of simple ratio-standard scaling tends to underestimate the performance capability of heavy skiers and overestimate the performance capability of light skiers, whereas the reversed misinterpretation would occur if the absolute expression of O2max is used as a performance indicator. Notably, in this context, world-class skiers would have higher O2max values than less successful skiers, independent of which expression is used for evaluation.3 However, if the objective is to evaluate the performance capability in 15 km classical technique races of a homogeneous group of elite male skiers, O2max expressed as mL · min−1 · kg−0.5 is recommended.
Moreover, the results presented in Model 6 indicate that skiers with the same body mass whose O2max differs by 1% will differ in their performance by ~0.66% compared to the skiers with higher oxygen uptake. For example, if the race performance of the “average skier” in this sample (body mass =75.5 kg and O2max =5.4 L · min−1) is compared with a skier with the same body mass but a 1% difference in O2max, the performance-related difference in the actual race would be 17 seconds. Conversely, two skiers with the same O2max who differ in the body mass by 1% will likely differ in their performance by 0.35%, in favor of the lighter skier, and corresponds to a 9-second completion time difference when the “average skier” is compared with a 1% lighter skier with the same O2max.
Previously, these performance-related differences based on O2max and body mass were reported as 1% and 0.48%, respectively.21 There could be several reasons for this slight difference, but the most likely explanation is related to the course-profile differences even though both courses were homologated and the total climbing distance was equal (162 m in the current study vs 161 m in the previous study21); the 5 km course in the current study had seven uphill sections with a height difference of more than 10 m, whereas the corresponding number of uphill sections for the 5 km course in the previous study was 3. Hence, in a performance perspective, the relatively shorter uphill sections did not disfavor the subjects with a lower O2max or a larger body mass as much as the course with longer uphill sections. Moreover, another potential reason to the performance-related difference can be related to differences in track conditions as suggested by the mean race-speed differences (5.83 vs 5.23 m · s−1) when the studies are compared, despite qualitatively equal subjects (O2max: 5.39 vs 5.34 L · min−1). However, for both of these performances, the optimal O2max-to-mass ratio was “O2max divided by the square root of body mass”, but its importance for the race speed differed somewhat depending on the course profile. The presented model to predict race speed is related to the actual competition, and its relevance for other skiing competitions is limited; however, the optimal O2max-to-mass ratio appears to be relevant for the evaluation of an elite male skier’s performance capability in 15 km classical-technique skiing competitions. To further evaluate the generalizability of the 0.5 body-mass exponent for O2max and its relevance for predicting performance for other competition distances and races performed using freestyle technique, competitions in both techniques, on new courses, and during different snow conditions are warranted.
The current study also revealed that the body-mass exponent for O2max is influenced by the distance covered, which was demonstrated by the lap number’s contribution to the body-mass exponent in Model 8; consequently, the O2max-to-mass ratio decreased for each new lap. This finding indicates that heavier skiers, with a relatively low simple ratio-standard scaled O2max, had a more pronounced positive pacing profile compared with lighter skiers. Elite male skiers with large body mass (ie, a large muscle mass) could, in general, generate higher skiing speeds than lighter skiers in the two main subtechniques of classical technique (ie, diagonal-stride and double-poling techniques).26 It appears that the heavier skiers use their ability to generate a high skiing speed at the beginning of the race, where the skiers might want to possibly gain a high-ranking position at the first intermediate time. This finding is supported by a previously reported relationship between mean speed in the start section of a time trial and total lean mass of the elite male skiers.22
To generate a high skiing speed, a large proportion of the energy supply comes from anaerobic processes, which increase the concentration of metabolites related to fatigue. This relationship was supported by a previous study in which a positive pacing profile resulted in a higher rate of perceived exertion and accumulation of fatigue-related metabolites.27 Hence, it appears that skiers with a more pronounced positive pacing profile reduce their race speed toward the end of a race to avoid critical homeostatic disturbances. It has also been shown that a reduced overall skiing speed during the second part of a race, as observed in the current study, is reflected by a reduction in speed on uphill sections.22,23 Consequently, when the time spent in uphill skiing increases, lighter skiers, who are favored in ascents,21 are progressively more favored during the latter part of a distance race. In summary, this finding suggests that skiers’ pacing profile is influenced by their body mass and that heavy skiers may benefit from a somewhat reduced speed during the first part of a distance race. However, the extent to which the pacing profile adopted is influenced by body mass must be further investigated.
Another novel finding in the current study was that the subjects’ age was a covariate in Model 8, in which lap speed was approximately 1.0% higher per year. This finding was, to some extent, supported by a previous observation that older participants selected a more optimal pacing profile in marathons.28 However, the age-related influence on lap speed might also be associated with physiological factors and technical aspects. For example, gross efficiency and skiing economy appear to improve with increasing age in elite skiers.29 Further investigations are necessary to clarify which factors contribute to the age-related improvement in distance-performance capability in cross-country skiing.
Conclusion
Based on the validation results, it may be recommended that O2max divided by the square root of body mass (mL · min−1 · kg−0.5) should be used when the elite male skiers’ performance capability in 15 km classical technique races is evaluated. Moreover, the body-mass exponent for O2max was demonstrated to be influenced by the distance covered, indicating that heavier skiers have a more pronounced positive pacing profile (ie, race speed gradually decreasing throughout the race) compared to lighter skiers.
Acknowledgments
The authors thank the athletes for their participation, and they are also grateful to Mengjie Han for his assistance with the statistical analyses. The current paper includes the work based on the doctoral thesis submitted30 by the first author.
Disclosure
The authors report no conflicts of interest in this work.
References
Nevill AM, Jobson SA, Davison RCR, Jeukendrup AE. Optimal power-to-mass ratios when predicting flat and hill-climbing time-trial cycling. Eur J Appl Physiol. 2006;97(4):424–431. | |
Swain DP. The influence of body mass in endurance bicycling. Med Sci Sports Exerc. 1994;26(1):58–63. | |
Bergh U. The influence of body mass in cross-country skiing. Med Sci Sports Exerc. 1987;19(4):324–331. | |
Bergh U, Forsberg A. Influence of body mass on cross-country ski racing performance. Med Sci Sports Exerc. 1992;24(9):1033–1039. | |
Carlsson M, Carlsson T, Hammarström D, Tiivel T, Malm C, Tonkonogi M. Validation of physiological tests in relation to competitive performances in elite male distance cross-country skiing. J Strength Cond Res. 2012;26(6):1496–1504. | |
Ng AV, Demment RB, Bassett DR, et al. Characteristics and performance of male citizen cross-country ski racers. Int J Sports Med. 1988; 9(3):205–209. | |
Staib JL, Im J, Caldwell Z, Rundell KW. Cross-country ski racing performance predicted by aerobic and anaerobic double poling power. J Strength Cond Res. 2000;14(3):282–288. | |
Larsson P, Henriksson-Larsen K. Combined metabolic gas analyser and dGPS analysis of performance in cross-country skiing. J Sports Sci. 2005;23(8):861–870. | |
Larsson P, Olofsson P, Jakobsson E, Burlin L, Henriksson-Larsen K. Physiological predictors of performance in cross-country skiing from treadmill tests in male and female subjects. Scand J Med Sci Sports. 2002;12(6):347–353. | |
Ingjer F. Maximal oxygen uptake as a predictor of performance ability in women and men elite cross-country skiers. Scand J Med Sci Sports. 1991;1(1):25–30. | |
Schmidt-Nielsen K. Scaling: Why is Animal Size so Important? Cambridge: Cambridge University Press; 1984. | |
McMahon T. Size and shape in biology. Science. 1973;179(79):1201–1204. | |
West GB, Brown JH, Enquist BJ. A general model for the origin of allometric scaling laws in biology. Science. 1997;276(5309):122–126. | |
Jensen K, Johansen L, Secher NH. Influence of body mass on maximal oxygen uptake: effect of sample size. Eur J Appl Physiol. 2001;84(3):201–205. | |
Heil DP, Hollins J, Reinking BW, Stevens K. The influence of upper body power on the body mass scaling exponent of cross country skiing. In: Linnamo V, editor. Science and Nordic Skiing II. Oxford: Meyer and Meyer Sport; 2013:129–135. | |
Nevill AM, Ramsbottom R, Williams C. Scaling physiological measurements for individuals of different body size. Eur J Appl Physiol Occup Physiol. 1992;65(2):110–117. | |
Jobson SA, Woodside J, Passfield L, Nevill AM. Allometric scaling of uphill cycling performance. Int J Sports Med. 2008;29(9):753–757. | |
Nevill AM, Jobson SA, Palmer GS, Olds TS. Scaling maximal oxygen uptake to predict cycling time-trial performance in the field: a non-linear approach. Eur J Appl Physiol. 2005;94(5–6):705–710. | |
Nevill AM, Rowland T, Goff D, Martel L, Ferrone L. Scaling or normalising maximum oxygen uptake to predict 1-mile run time in boys. Eur J Appl Physiol. 2004;92(3):285–288. | |
Carlsson M, Carlsson T, Knutsson M, Malm C, Tonkonogi M. Oxygen uptake at different intensities and sub-techniques predicts sprint performance in elite male cross-country skiers. Eur J Appl Physiol. 2014;114(12):2587–2595. | |
Carlsson T, Carlsson M, Felleki M, et al. Scaling maximal oxygen uptake to predict performance in elite-standard men cross-country skiers. J Sports Sci. 2013;31(16):1753–1760. | |
Andersson E, Supej M, Sandbakk Ø, Sperlich B, Stöggl T, Holmberg HC. Analysis of sprint cross-country skiing using a differential global navigation satellite system. Eur J Appl Physiol. 2010;110(3):585–595. | |
Bilodeau B, Rundell KW, Roy B, Boulay MR. Kinematics of cross-country ski racing. Med Sci Sports Exerc. 1996;28(1):128–138. | |
Poole DC, Wilkerson DP, Jones AM. Validity of criteria for establishing maximal O2 uptake during ramp exercise tests. Eur J Appl Physiol. 2008;102(4):403–410. | |
Pawitan Y. In All Likelihood: Statistical Modeling and Inference Using Likelihood. New York: Oxford University Press Inc.; 2001. | |
Stöggl T, Enqvist J, Müller E, Holmberg HC. Relationships between body composition, body dimensions, and peak speed in cross-country sprint skiing. J Sports Sci. 2010;28(2):161–169. | |
Thompson KG, MacLaren DP, Lees A, Atkinson G. The effect of even, positive and negative pacing on metabolic, kinematic and temporal variables during breaststroke swimming. Eur J Appl Physiol. 2003;88(4–5):438–443. | |
March DS, Vanderburgh PM, Titlebaum PJ, Hoops ML. Age, sex, and finish time as determinants of pacing in the marathon. J Strength Cond Res. 2011;25(2):386–391. | |
Ainegren M, Carlsson P, Tinnsten M, Laaksonen MS. Skiing economy and efficiency in recreational and elite cross-country skiers. J Strength Cond Res. 2013;27(5):1239–1252. | |
Carlsson T. The importance of body-mass exponent optimization for evaluation of performance capability in cross-country skiing [Doctoral thesis]. Umeå: Department of Community Medicine and Rehabilitation, Umeå University; 2015. |
 © 2015 The Author(s). This work is published and licensed by Dove Medical Press Limited. The
full terms of this license are available at https://www.dovepress.com/terms
and incorporate the Creative Commons Attribution
- Non Commercial (unported, 3.0) License.
By accessing the work you hereby accept the Terms. Non-commercial uses of the work are permitted
without any further permission from Dove Medical Press Limited, provided the work is properly
attributed. For permission for commercial use of this work, please see paragraphs 4.2 and 5 of our Terms.
© 2015 The Author(s). This work is published and licensed by Dove Medical Press Limited. The
full terms of this license are available at https://www.dovepress.com/terms
and incorporate the Creative Commons Attribution
- Non Commercial (unported, 3.0) License.
By accessing the work you hereby accept the Terms. Non-commercial uses of the work are permitted
without any further permission from Dove Medical Press Limited, provided the work is properly
attributed. For permission for commercial use of this work, please see paragraphs 4.2 and 5 of our Terms.