Back to Journals » Journal of Pain Research » Volume 11
Optimal cut-off points of lumbar pedicle thickness as a morphological parameter to predict lumbar spinal stenosis syndrome: a retrospective study
Authors An SJ ![]() , Choi SI
, Choi SI ![]() , Kang KN, Yoon SH, Kim YU
, Kang KN, Yoon SH, Kim YU ![]()
Received 22 March 2018
Accepted for publication 3 July 2018
Published 4 September 2018 Volume 2018:11 Pages 1709—1714
DOI https://doi.org/10.2147/JPR.S168990
Checked for plagiarism Yes
Review by Single anonymous peer review
Peer reviewer comments 2
Editor who approved publication: Professor E Alfonso Romero-Sandoval
Sang Joon An,1 Soo Il Choi,2 Keum Nae Kang,3 Syn-Hae Yoon,3 Young Uk Kim2
1Department of Neurology, Catholic Kwandong University of Korea College of Medicine, International St. Mary’s Hospital, Incheon, Republic of Korea; 2Department of Anesthesiology and Pain Medicine, Catholic Kwandong University of Korea College of Medicine, International St. Mary’s Hospital, Incheon, Republic of Korea; 3Department of Anesthesiology and Pain Medicine, National Police Hospital, Seoul, Republic of Korea
Purpose: Lumbar spinal stenosis syndrome (LSSS) is induced by factors such as ligamentum flavum hypertrophy, facet joint hypertrophy and disc degeneration. However, the role of lumbar pedicle (LP) in LSSS has yet to be evaluated. We devised a new morphological parameter called the lumbar pedicle thickness (LPT) to evaluate the connection between LSSS and the LP. We hypothesized that the LPT is a major morphological parameter in the diagnosis of LSSS.
Patients and methods: The LPT data were collected from 136 patients diagnosed with LSSS. A total of 99 control subjects underwent lumbar spine magnetic resonance imaging (MRI) as part of a detailed medical assessment. Axial T2-weighted magnetic resonance (MR) images were acquired from all the participants. Using our picture archiving and communication system, we analyzed the thickness of the LP at the level of L5 vertebra on MRI.
Results: The average LPT was 9.46±1.81 mm in the control group and 13.26±1.98 mm in the LSSS group. LSSS patients showed a significantly greater LPT (P<0.001) than the control group. The receiver operating characteristic (ROC) curve analysis showed an optimal cutoff point of 11.33 mm for the LPT, with 83.8% sensitivity, 83.8% specificity and area under the curve of 0.92 (95% confidence interval [CI], 0.89–0.96).
Conclusion: A higher LPT was associated with a higher possibility of LSSS, suggesting its importance in the evaluation of patients with LSSS.
Keywords: lumbar pedicle, lumbar pedicle thickness, lumbar spinal stenosis syndrome, diagnosis
Introduction
Lumbar spinal stenosis syndrome (LSSS) is a common cause of structural abnormalities associated with the spinal cord, including narrowing of the spinal canal.1 Patients usually present with leg pain, with intermittent claudication or low back pain manifesting as a primary clinical feature. LSSS seriously affects patients’ quality of life, increasing not only the economic burden on the society but also the morbidity and suffering of patients interfering with their ability to work.2,3 The structural abnormalities associated with LSSS are caused by facet joint hypertrophy, hypertrophy of the ligamentum flavum (LF), mechanical compression of the lumbar spinal nerve roots and disc degeneration combined with osteophytes.4–6 Studies involving morphologic analysis showed that the cross-sectional area of the dural sac and spinal canal, facet joint hypertrophy and LF thickness are associated with LSSS, aging and disc degeneration.7,8 However, few studies have investigated the role of lumbar pedicle (LP) in LSSS. The coronal view of LP reveals an oval shape, especially at the L4 or L5 vertebra with the main axis inclined horizontally.9 The morphological features suggest that the transverse pedicle width is not constant. Thus, the thickness of the LP is an important morphologic parameter in the identification of irregular hypertrophy. Therefore, in order to evaluate the connection between LSSS and thickness of the LP, we devised a new morphological determinant called the lumbar pedicle thickness (LPT). We hypothesized that the LPT is an important morphologic determinant in the diagnosis of LSSS. We used magnetic resonance imaging (MRI) to compare the LPT between LSSS patients and normal controls.
Patients and methods
Patients
The institutional review board (IRB) of Catholic Kwandong University College of Medicine, Incheon, Republic of Korea, reviewed and approved this project (IRB protocol number: IS17RISI0078). All patients provided written informed consent to review their medical records. Patients who had visited our Spine Center between April 2015 and September 2017 and were diagnosed with LSSS were retrospectively reviewed. Patients older than 50 years were included if they had clinical manifestations pathognomonic of LSSS such as low back pain and/or neurogenic intermittent claudication, with the maximum stenosis associated with L5, and MRI findings within 12 months of the diagnosis available for review. Patients were excluded if they had a history of lumbar surgery or spinal injury, congenital spine defect, and history of spinal interventions such as kyphoplasty or anatomic anomalies.
A total of 136 patients were enrolled after the LSSS diagnosis was confirmed by an experienced, board-certified neuroradiologist. The LSSS group included 52 (37.5%) men and 84 (62.5%) women with a mean age of 64.70±7.18 years (range, 52–81 years; Table 1). We compared the LPT in patients with and without LSSS by including a group of control patients who had undergone lumbar MRI as part of a detailed medical examination. Patients in the control group had no LSSS-related symptoms. The control group consisted of 99 patients (46 men and 53 women) with a mean age of 66.85±8.33 years (range, 50–83 years; Table 1). The LPT in the control group was similarly examined at the L5 vertebra.
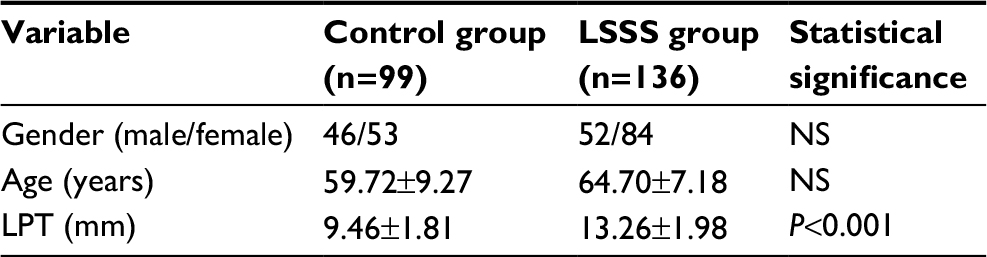 | Table 1 Study participants: characteristics of control and LSSS groups Note: Data represent mean±SD or number of patients. Abbreviations: LSSS, lumbar spinal stenosis syndrome; NS, not statistically significant (P>0.05); LPT, lumbar pedicle thickness. |
Imaging parameters
MRI examinations were performed using 3T Avanto (Siemens Healthcare, Erlangen, Germany) with 3T scanners (Achieva; Philips Healthcare, Best, the Netherlands). The lumbar MRI examinations were conducted using axial T2-weighted images obtained with a slice thickness of <3 mm, 0.9 mm intersection gap, 6507 ms/120 ms repetition time/echo time, 150×150 field of view and 256×241 matrix. All the MRI data were transferred from the MRI unit to an INFINITT system (INFINITT Healthcare Co., Seoul, Korea).
Image analysis
The axial T2-weighted MRI was acquired at the L5 vertebra for individual patient data. A picture archiving and communication system was used to measure the LPT as a linear line at the L5 pedicle level, representing the maximum thickness level of the pedicle on MRI (Figure 1).
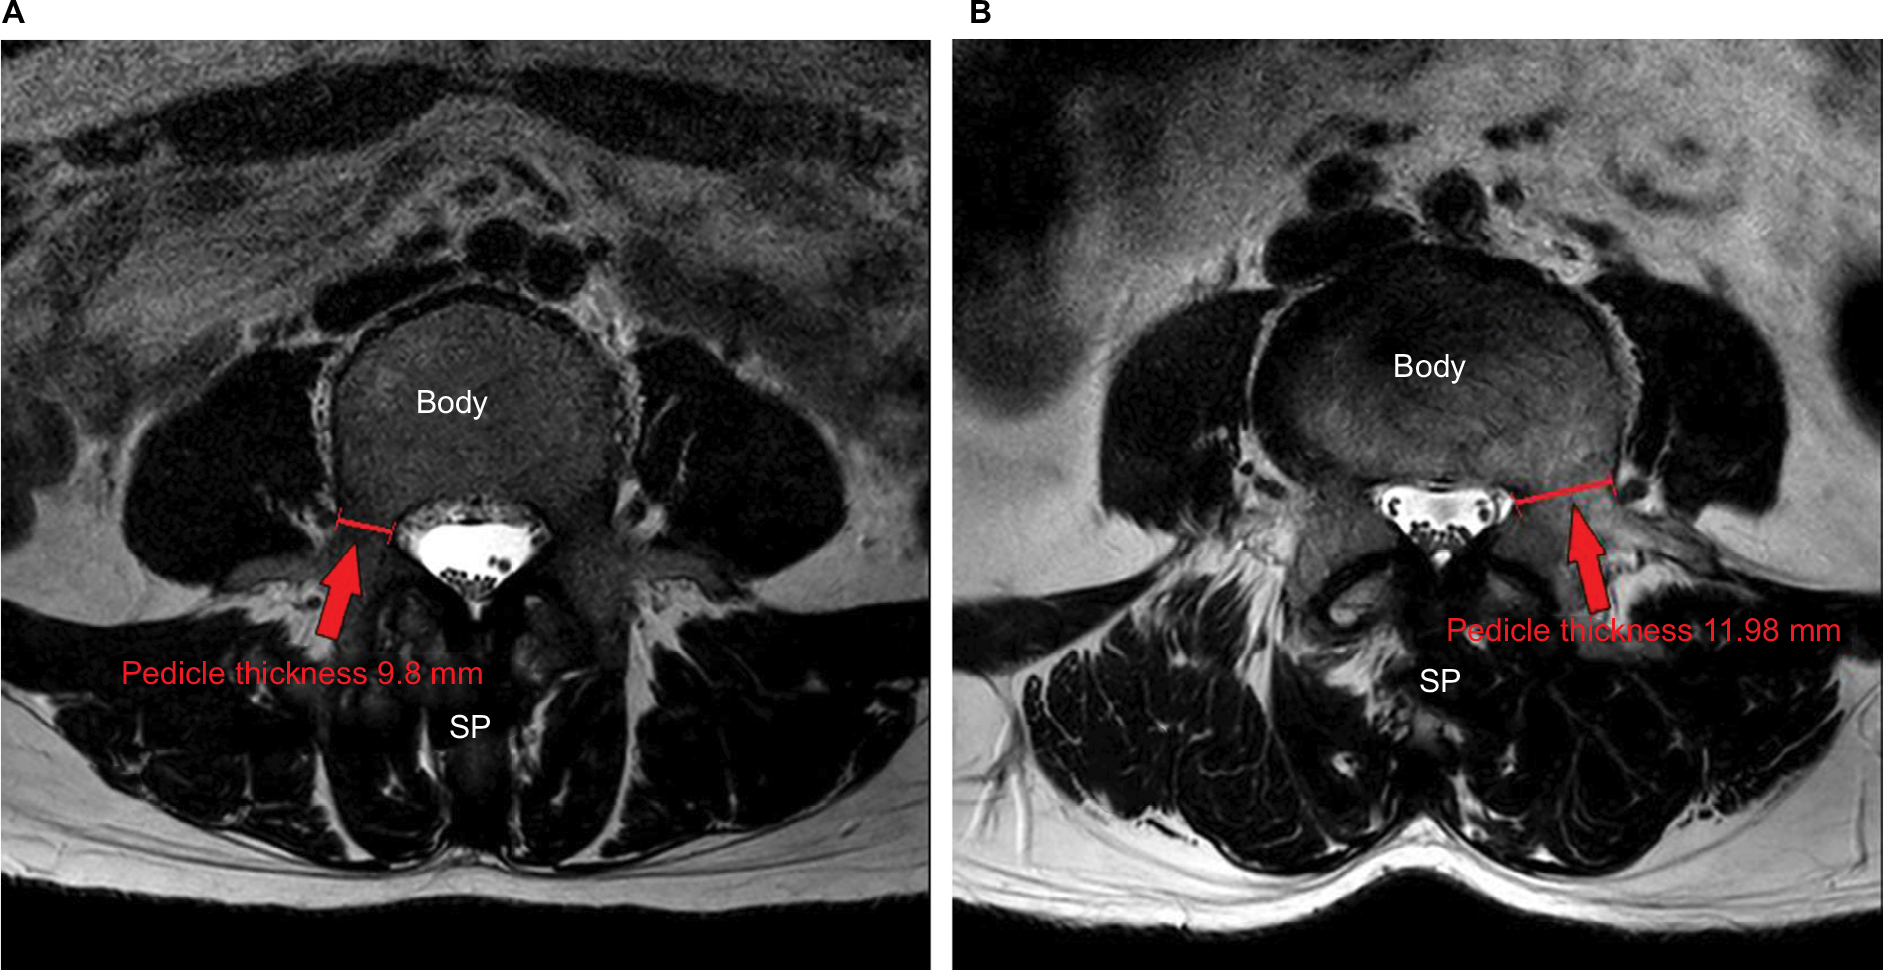 | Figure 1 Measurement of LPT was carried out at the L5 vertebra on T2-weighted MR images. Notes: (A) Control group. (B) LSSS group. Abbreviations: LPT, lumbar pedicle thickness; MR, magnetic resonance; LSSS, lumbar spinal stenosis syndrome; SP, spinous process. |
Statistical analysis
The data were expressed as mean±standard deviation (SD). Unpaired t-tests were used to compare the LPT between the control and the LSSS groups. P-values <0.05 were considered as statistically significant. The relationship between the LPT and age-related changes was analyzed using a one-way ANOVA. The validity of the LPT for diagnosis was estimated using receiver operating characteristic (ROC) curves, optimal cutoff values, area under the curve (AUC), sensitivity and specificity with 95% confidence intervals (CIs). SPSS version 22 for Windows (IBM Corporation, Armonk, NY, USA) was used for the statistical analysis
Results
Age and sex were not significantly different between the groups (Table 1). The mean LPT of the control group was 10.19±1.65 mm in people aged 50–59 years, 8.34±1.52 mm in people aged 60–69 years and 8.35±1.43 mm in the people aged 70–79 years (Table 2). In the control group, we found no statistically significant relationships between LPT and age-related changes in the one-way ANOVA (F=15.920; df=2; P=0.999). The mean LPT of the LSSS group was 12.84±1.78 mm in patients aged 50–59 years, 13.49±2.20 mm in patients aged 60–69 years and 13.14±1.53 mm in patients aged 70–79 years (Table 3). In the LSSS group, we found no statistically significant relationships between the LPT and age-related changes (F=1.213; df =2; P=0.300). The average LPT was 9.46±1.81 mm in the control group and 13.26±1.98 mm in the LSSS group. LSSS patients showed significantly greater LPT (P<0.001) than the control subjects (Table 1). Regarding the validity of LPT as a prognostic indicator of LSSS, the ROC curve analysis showed an optimal cutoff point at 11.33 mm, with 83.8% sensitivity, 83.8% specificity (Table 4) and AUC of 0.92 (95% CI, 0.89–0.96; Figure 2).
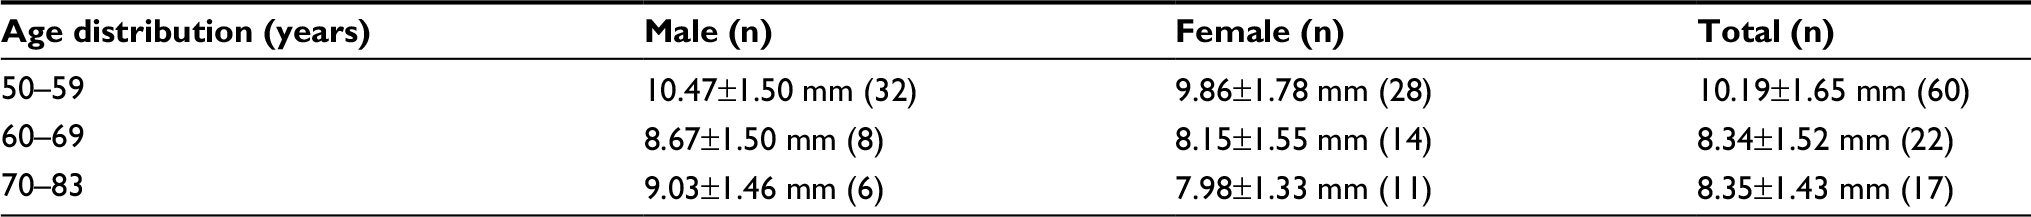 | Table 2 Age distribution of patients with mean LPT of the control group Note: Data represent mean±SD. Abbreviation: LPT, lumbar pedicle thickness. |
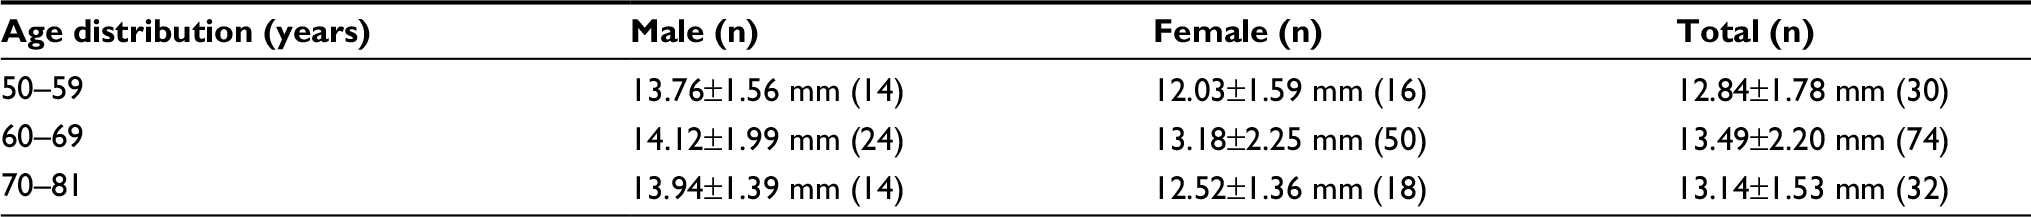 | Table 3 Age distribution of patients with mean LPT of the LSSS group Note: Data represent mean±SD. Abbreviations: LPT, lumbar pedicle thickness; LSSS, lumbar spinal stenosis syndrome. |
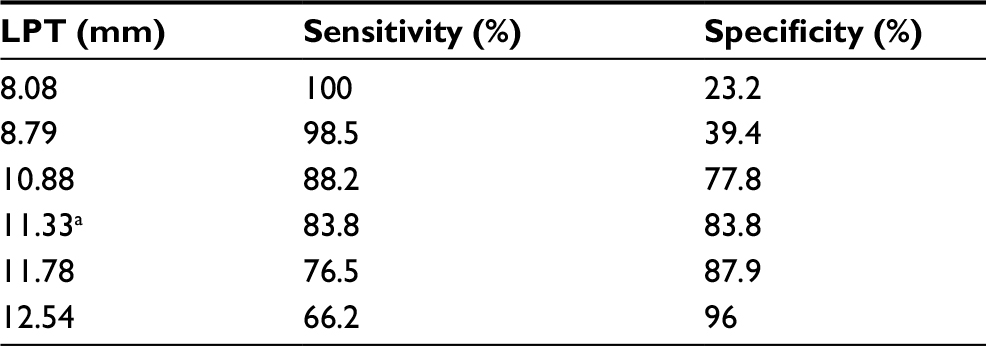 | Table 4 Sensitivity and specificity of each cutoff point of the LPT Note: aThe best cutoff point on the ROC curve. Abbreviations: LPT, lumbar pedicle thickness; ROC, receiver operating characteristic. |
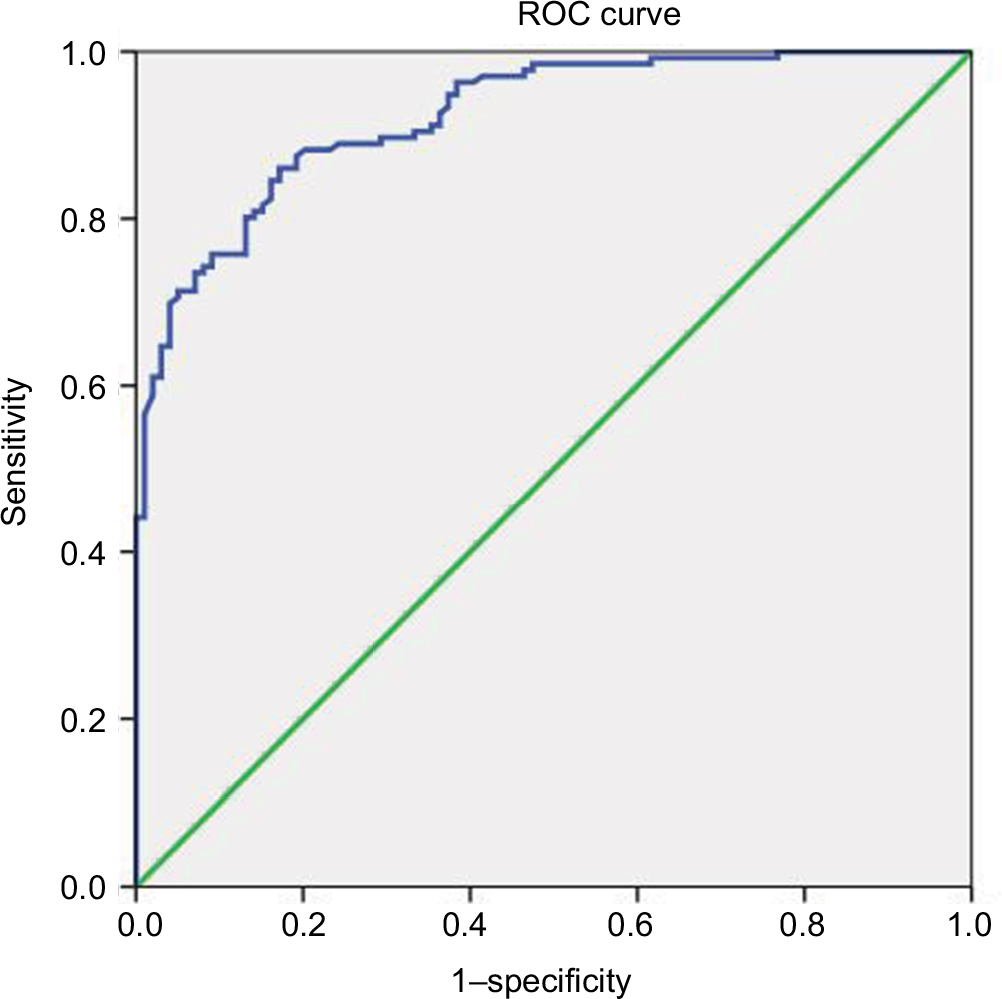 | Figure 2 ROC curve of LPT for prediction of LSSS. Note: The best cutoff point of LPT was 11.33 mm, with a sensitivity of 83.8%, a specificity of 83.8% and AUC 0.92. Abbreviations: ROC, receiver operating characteristic; LPT, lumbar pedicle thickness; LSSS, lumbar spinal stenosis syndrome; AUC, area under the curve. |
Discussion
LSSS is a common spinal disorder diagnosed in the elderly population, causing low back or buttock pain and intermittent neurogenic claudication.10,11 LSSS results from multiple pathogenic risk factors, including a decrease in the area of the cauda equina, hypertrophy of LF, loss of intervertebral disk height and hypertrophy of the facet joints.12 Several studies investigated the association between LF, dural sac area and spinal canal area on MRI and the signs and symptoms of LSSS. Park et al13 reported that the LF is significantly thinner in patients with intervertebral disc herniation than in those with LSSS. Altinkaya et al14 demonstrated that the LF thickening was correlated with age, body mass index and disc degeneration. Ogikubo et al15 found a significant relationship between shorter walking distances and a smaller dural sac area. Kim et al7 reported that a larger dural sac area was associated with a longer subjective walking distance before the onset of claudication. However, few studies investigated the role of LP in LSSS. Despite morphological analysis of LP performed using computed tomography of lumbar vertebrae,9,16,17 radiological measurements of plain vertebrae18 and cadaveric studies,19,20 no previous studies correlated LSSS and LP as a morphologic parameter on MRI. To the best of our knowledge, this study is the first of its kind to propose an optimal cutoff value of LPT to predict LSSS. The coronal view of LP revealed an oval shape, especially at the L5 vertebra, with the main axis inclined horizontally. The morphological features suggest that the transverse pedicle width is not constant.9 Sethi et al21 reported individual anatomical variations in the pedicle axis, width and body habitus. Mughir et al22 emphasized the critical role of pedicle morphology in spinal analysis.
However, the association between LSSS and LP as a morphological parameter in MRI has not been reported previously. Furthermore, no objective morphological indicators of LP were available. We assumed that the thickness of LP represented an objective, precise and clear measure of LSSS. In our study, for the first time, the LPT was measured using T2-weighted MRI.
The results demonstrate a correlation between the LPT and LSSS. Patients with LSSS had significantly higher LPT values compared with the control subjects.
The positive correlation between LPT and LSSS is explained by the increase in LPT associated with an increased incidence of LSSS. In our study, the best cutoff point for LPT was 11.33 mm, with 83.8% sensitivity, 83.8% specificity and AUC of 0.92 (95% CI, 0.89–0.96). We suggested that LPT is the precise, objective, clear morphological parameter to predict LSSS. Our interpretation of these associations suggested that a thickened LP may be related to continuous stress, which might increase the LSSS. This etiology may alter the morphologic features of the LP. In this study, we strictly controlled age range to reduce age bias.
This study only included individuals aged above 50 years because Mughir et al22 reported that pedicle morphology in young and adult population varied in all the parameters. We measured the LPT at the L5 level to obtain the most accurate measurements of thickness. A previous study reported that lengthening of L5 pedicles produced larger increases in spinal canal volume compared with lengthening of L4 pedicles.23
This current study has several limitations. First, several methods used to evaluate LSSS, such as spinal canal area, dural sac area, sedimentation signs, morphologic grading and ligament flavum thickness were found effective at discriminating LSSS.24–33 However, we only assessed the measurement of LPT, suggesting that our results may have limitations regarding measurement of other morphological changes or epidural pressure. Second, the enrolled patients included a small number of LSSS patients. The baseline characteristics of the patient population such as body mass index, weight and height varied widely. Third, minor errors were associated with the measurement of LPT on MRI. Even though we tried to measure these morphological parameters in the axial images that best showed LP at the most stenotic level of the L5 body, the axial images may be nonhomogeneous because of differences in the cutting angle or the level in MRI resulting from anatomic variations and technical factors. In addition, a 3.0 mm slice of axial T2-weighted magnetic resonance (MR) image was thicker than the ideal slice. Fourth, the principal methodological limitation was the retrospective study design. The fifth limitation is that the measurement of LPT was only limited to L5 level in this study, leaving out the other part of the lumbar spine such as L3 and L4 levels, which is one of the major parts of the lumbar spinal stenosis. Furthermore, more studies are needed on pedicle height, which is directly related to foraminal stenosis. Finally, there is a limitation on the patient group. Patients with congenitally thick pedicle were not completely excluded from the study. There is also a lack of research on the thickness of the pedicle of younger patients without symptoms. Along with these studies, changes in the thickness of the pedicle due to aging should be further studied in the future.
Despite these limitations, this is the first study to document that the LPT was associated with LSSS, highlighting an important etiological parameter underlying LSSS, for appropriate clinical management.
Conclusion
Our results demonstrate that LPT is a sensitive measure for the assessment of LSSS. With regard to LSSS, the optimal cut-off value was 11.33 mm, with 83.8% sensitivity, 83.8% specificity and AUC of 0.92. The findings should assist clinical evaluation of patients with LSSS.
Author contributions
All authors contributed toward data analysis, drafting and critically revising the paper and agree to be accountable for all aspects of the work
Disclosure
The authors report no conflicts of interest in this work.
References
Lim TH, Choi SI, Cho HR, et al. Optimal Cut-Off Value of the Superior Articular Process Area as a Morphological Parameter to Predict Lumbar Foraminal Stenosis. Pain Res Manag. 2017;2017:7914836–5. | ||
Chen E, Tong KB, Laouri M. Surgical treatment patterns among Medicare beneficiaries newly diagnosed with lumbar spinal stenosis. Spine J. 2010;10(7):588–594. | ||
Gao M, Zou J, Zhang Z, Luo Z, Yang H. Evaluation of the influence of pedicle-lengthening osteotomy on lumbar stability. Am J Transl Res. 2016;8(5):2070–2078. | ||
Barry M, Livesley P. Facet joint hypertrophy: the cross-sectional area of the superior articular process of L4 and L5. Eur Spine J. 1997;6(2):121–124. | ||
Hughes A, Makirov SK, Osadchiy V. Measuring spinal canal size in lumbar spinal stenosis: description of method and preliminary results. Int J Spine Surg. 2015;9:8. | ||
Ohba T, Ebata S, Fujita K, Sato H, Devin CJ, Haro H. Characterization of symptomatic lumbar foraminal stenosis by conventional imaging. Eur Spine J. 2015;24(10):2269–2275. | ||
Kim YU, Kong YG, Lee J, et al. Clinical symptoms of lumbar spinal stenosis associated with morphological parameters on magnetic resonance images. Eur Spine J. 2015;24(10):2236–2243. | ||
Kolte VS, Khambatta S, Ambiye MV. Thickness of the ligamentum flavum: correlation with age and its asymmetry-an magnetic resonance imaging study. Asian Spine J. 2015;9(2):245–253. | ||
Makino T, Kaito T, Fujiwara H, Yonenobu K. Analysis of lumbar pedicle morphology in degenerative spines using multiplanar reconstruction computed tomography: what can be the reliable index for optimal pedicle screw diameter? Eur Spine J. 2012;21(8):1516–1521. | ||
Haig AJ, Tomkins CC. Diagnosis and management of lumbar spinal stenosis. JAMA. 2010;303(1):71–72. | ||
Genevay S, Atlas SJ. Lumbar spinal stenosis. Best Pract Res Clin Rheumatol. 2010;24(2):253–265. | ||
Park HJ, Kim SS, Lee YJ, et al. Clinical correlation of a new practical MRI method for assessing central lumbar spinal stenosis. Br J Radiol. 2013;86(1025):20120180. | ||
Park JB, Chang H, Lee JK. Quantitative analysis of transforming growth factor-beta 1 in ligamentum flavum of lumbar spinal stenosis and disc herniation. Spine. 2001;26(21):E492–E495. | ||
Altinkaya N, Yildirim T, Demir S, Alkan O, Sarica FB. Factors associated with the thickness of the ligamentum flavum: is ligamentum flavum thickening due to hypertrophy or buckling? Spine. 2011;36(16):E1093–1097. | ||
Ogikubo O, Forsberg L, Hansson T. The relationship between the cross-sectional area of the cauda equina and the preoperative symptoms in central lumbar spinal stenosis. Spine. 2007;321429(13):1423–1428. | ||
Bernard TN, Seibert CE. Pedicle diameter determined by computed tomography. Its relevance to pedicle screw fixation in the lumbar spine. Spine. 1992;17(6 Suppl):S160–163. | ||
Li B, Jiang B, Fu Z, Zhang D, Wang T. Accurate determination of isthmus of lumbar pedicle: a morphometric study using reformatted computed tomographic images. Spine. 2004;29(21):2438–2444. | ||
Mitra SR, Datir SP, Jadhav SO. Morphometric study of the lumbar pedicle in the Indian population as related to pedicular screw fixation. Spine. 2002;27(5):453–459. | ||
Kim NH, Lee HM, Chung IH, Kim HJ, Kim SJ. Morphometric study of the pedicles of thoracic and lumbar vertebrae in Koreans. Spine. 1994;19(12):1390–1394. | ||
Marchesi D, Schneider E, Glauser P, Aebi M. Morphometric analysis of the thoracolumbar and lumbar pedicles, anatomo-radiologic study. Surg Radiol Anat. 1988;10(4):317–322. | ||
Sethi A, Lee A, Vaidya R. Lumbar pedicle screw placement: Using only AP plane imaging. Indian J Orthop. 2012;46(4):434–438. | ||
Mughir AM, Yusof MI, Abdullah S, Ahmad S. Morphological comparison between adolescent and adult lumbar pedicles using computerised tomography scanning. Surg Radiol Anat. 2010;32(6):587–592. | ||
Li P, Qian L, Wu WD, Wu CF, Ouyang J. Impact of pedicle-lengthening osteotomy on spinal canal volume and neural foramen size in three types of lumbar spinal stenosis. Bone Joint Res. 2016;5(6):239–246. | ||
Barz T, Melloh M, Staub LP, Lord SJ, Lange J, Merk HR. Increased intraoperative epidural pressure in lumbar spinal stenosis patients with a positive nerve root sedimentation sign. Eur Spine J. 2014;23(5):985–990. | ||
Lønne G, Ødegård B, Johnsen LG, Solberg TK, Kvistad KA, Nygaard ØP. MRI evaluation of lumbar spinal stenosis: is a rapid visual assessment as good as area measurement? Eur Spine J. 2014;23(6):1320–1324. | ||
Kim SH, Koh WU, Park SJ, et al. Clinical experiences of transforaminal balloon decompression for patients with spinal stenosis. Korean J Pain. 2012;25(1):55–59. | ||
Park SH, Lee PB, Choe GY, Moon JY, Nahm FS, Kim YC. Therapeutic effect of epidurally administered lipo-prostaglandin e1 agonist in a rat spinal stenosis model. Korean J Pain. 2014;27(3):219–228. | ||
An JW, Koh JC, Sun JM, et al. Clinical Identification of the Vertebral Level at Which the Lumbar Sympathetic Ganglia Aggregate. Korean J Pain. 2016;29(2):103–109. | ||
Manchikanti L, Pampati V, Kaye AD, Hirsch JA. Therapeutic lumbar facet joint nerve blocks in the treatment of chronic low back pain: cost utility analysis based on a randomized controlled trial. Korean J Pain. 2018;31(1):27–38. | ||
Sanie MS, Ghobadifar MA. Risks and Pitfalls of Epidural Injections during Management of Lumbar Disc Herniation: Few Comments. Korean J Pain. 2015;28(3):217–218. | ||
Byun JM, Park HS, Woo JH, Kim J. The effects of a forceful transforaminal epidural steroid injection on radicular pain: a preliminary study. Korean J Pain. 2014;27(4):334–338. | ||
Kim SY. Radiculopathy caused by discal cyst. Korean J Pain. 2014;27(1):86–89. | ||
Lee MH, Han CS, Lee SH, et al. Motor Weakness after Caudal Epidural Injection Using the Air-acceptance Test. Korean J Pain. 2013;26(3):286–290. |
 © 2018 The Author(s). This work is published and licensed by Dove Medical Press Limited. The
full terms of this license are available at https://www.dovepress.com/terms
and incorporate the Creative Commons Attribution
- Non Commercial (unported, 3.0) License.
By accessing the work you hereby accept the Terms. Non-commercial uses of the work are permitted
without any further permission from Dove Medical Press Limited, provided the work is properly
attributed. For permission for commercial use of this work, please see paragraphs 4.2 and 5 of our Terms.
© 2018 The Author(s). This work is published and licensed by Dove Medical Press Limited. The
full terms of this license are available at https://www.dovepress.com/terms
and incorporate the Creative Commons Attribution
- Non Commercial (unported, 3.0) License.
By accessing the work you hereby accept the Terms. Non-commercial uses of the work are permitted
without any further permission from Dove Medical Press Limited, provided the work is properly
attributed. For permission for commercial use of this work, please see paragraphs 4.2 and 5 of our Terms.