Back to Journals » Diabetes, Metabolic Syndrome and Obesity » Volume 13
Optimal Body Fat Percentage Cut-Off Values in Predicting the Obesity-Related Cardiovascular Risk Factors: A Cross-Sectional Cohort Study
Authors Macek P ![]() , Biskup M
, Biskup M ![]() , Terek-Derszniak M
, Terek-Derszniak M ![]() , Stachura M
, Stachura M ![]() , Krol H
, Krol H ![]() , Gozdz S
, Gozdz S ![]() , Zak M
, Zak M ![]()
Received 5 February 2020
Accepted for publication 19 April 2020
Published 12 May 2020 Volume 2020:13 Pages 1587—1597
DOI https://doi.org/10.2147/DMSO.S248444
Checked for plagiarism Yes
Review by Single anonymous peer review
Peer reviewer comments 2
Editor who approved publication: Prof. Dr. Juei-Tang Cheng
Pawel Macek,1,2 Malgorzata Biskup,1,3 Malgorzata Terek-Derszniak,3 Michal Stachura,4 Halina Krol,1,5 Stanislaw Gozdz,1,6 Marek Zak1
1Department of Physical Activity, Posturology, and Gerontology, Institute of Health Sciences, Collegium Medicum, The Jan Kochanowski University, Kielce, Poland; 2Department of Epidemiology and Cancer Control, Holycross Cancer Centre, Kielce, Poland; 3Department of Rehabilitation, Holycross Cancer Centre, Kielce, Poland; 4Department of Economics and Finance, Faculty of Law and Social Sciences, The Jan Kochanowski University, Kielce, Poland; 5Clinical Oncology Clinic, Holycross Cancer Centre, Kielce, Poland; 6Research and Education Department, Holycross Cancer Centre, Kielce, Poland
Correspondence: Marek Zak
Department of Physical Activity, Posturology, and Gerontology, The Institute of Health Sciences, Collegium Medicum, The Jan Kochanowski University, ul. Zeromskiego 5, Kielce 25-369, Poland
Tel +48 41 349 69 09
Fax +48 41 349 69 16
Email [email protected]
Background: Reliable obesity assessment is essential in evaluating the risk of cardiovascular risk factors (CRFs). Non-availability of clearly defined cut-offs for body fat percentage (BF%), as well as a widespread application of surrogate measures for obesity assessment, may result in incorrect prediction of cardio-metabolic risk.
Purpose: The study aimed to determine optimal cut-off points for BF%, with a view of predicting the CRFs related to obesity.
Patients and Methods: The study involved 4735 (33.6% of men) individuals, the Polish-Norwegian Study (PONS) participants, aged 45– 64. BF% was measured with the aid of bioelectrical impedance analysis (BIA) method. The gender-specific cut-offs of BF% were found with respect to at least one CRF. A P-value approach, and receiver operating characteristic curve analyses were pursued for BF% cut-offs, which optimally differentiated normal from the risk groups. The associations between BF% and CRFs were determined by logistic regression models.
Results: The cut-offs for BF% were established as 25.8% for men and 37.1% for women. With the exception of dyslipidemia, in men and women whose BF% was above the cut-offs, the odds for developing CRFs ranged 2– 4 times higher than those whose BF% was below the cut-offs.
Conclusion: Controlling BF% below the thresholds indicating an increased health hazard may be instrumental in appreciably reducing overall exposure to developing cardio-metabolic risk.
Keywords: obesity, body fat percentage, cardiovascular risk factor, cut-off, public health
Introduction
Being overweight and obesity are commonly acknowledged key risk factors for non-communicable diseases (NCDs).1,2 Obesity is deemed an independent cardiovascular risk factor (CRF).2 Other CRFs: age, gender, hypertension, dyslipidemia, diabetes mellitus, smoking, unhealthy diet, physical inactivity, and family history.3–6 In 2016, 11% of men and 15% of women in the world population were obese.7 According to the World Health Organization (WHO), prevalence of obesity in the world population is an epidemic and causes more deaths than underweight.7,8 Based on the prognosis, obesity is expected to affect 18% of men, and 21% of women in 2025.9 In line with WHO definition, overweight and obesity are construed as an excessive or abnormal accumulation of fat in the body creating a health hazard.7 Adipose tissue biology is an essential factor affecting CVDs,10 while obesity – a generally acknowledged social phenomenon, as well as one of the key public health issues.11,12
One of the most commonly applied, severe measures of obesity is body mass index (BMI). Given the scale of the problem, the determination of overweight and obesity thresholds based on BMI was deemed essential in terms of public health considerations.13 In 1998, WHO proposed the standards for international assessment of BMI classifying overweight ≥25 kg/m−2, and obesity ≥30.0 kg/m−2.14,15 In 2004, WHO experts initiated consultations on the revision of the existing BMI cut-off thresholds for Asian populations. No attempt has been made, however, to have the cut-offs for each population redefined separately, and consequently the existing international classification guidelines have been retained.16
BMI is not an exact measure in obesity assessment,17,18 as it fails to take into account the differences in body composition related to, eg, age, gender, ethnicity and race.18,19 Other commonly applied measures in obesity assessment, especially central obesity, are waist circumference (WC), and waist-to-hip ratio (WHR). Like BMI, they are based on simple anthropometric measurements and easy to calculate.20,21 They also have clearly defined gender-specific cut-offs for obesity, and according to some authors are more sensitive in predicting overall risk of CVDs.20,22
Some investigators believe the body fat content (BF) rather than BMI to be a more effective indicator of actual obesity.23 In line with the clinical definition of obesity, its assessment should preferably be based on fat content percentage (BF%) which can be measured, while making use of the presently available methods (inter alia, dual energy X-ray absorptiometry – DXA and bioelectrical impedance analysis – BIA).24 Although DXA has long been considered the gold standard in accurate body composition assessment, it is also an expensive, time-consuming, high-tech, and difficult to apply in clinical practice.24 An alternative to DXA is BIA, relatively cheap and simple to apply, which may be used for inpatients, as well as in field trials, especially when there is a shortage of both specialist diagnostic equipment and qualified medical personnel on site.25 BIA has been used in assessing body composition in large epidemiological studies (ie, MONICA, NHANES).26 Although the studies indicate that BIA and DXA methods are interchangeable at a population level, a reported lack of compatibility at an individual level, regardless of the BMI value, may be rather hard to accommodate by clinicians.27
Even though the BMI thresholds for overweight and obesity, as established by WHO, are well defined, it is far from obvious what the actual cut-offs for BF% are. It is commonly believed that BF≥25% for men and BF≥35% for women put the individuals in the obese category.28,29 On the other hand, this position is not reflected in the official WHO reports, thus opening the way for addressing the issue of the actual cut-off thresholds for obesity based on BF%, as well as on the impact of excessive accumulation of body fat on overall risk of developing cardiovascular diseases (CVDs).30 The study aimed to determine optimal cut-off points for body fat content in seniors and younger individuals, with a view to predicting the obesity-related cardiovascular risk factors.
Patients and Methods
The Polish-Norwegian Study (PONS)
The PONS Project, ie, “Establishment of infrastructure for population health research in Poland”, pursued in collaboration with Norwegian researchers, aimed at collecting population data, with a view to assessing the main determinants of individual health, and generally addressing the causes of morbidity and mortality in Poland. Within the period spanning Sept. 2010 - Dec. 2011, all men and women aged 45–64 (n=110,000), residents of both urban and rural districts were invited to attend the PONS study. Ultimately, within 16 months, 12% (n=13,172) of the target population were recruited to the PONS study, including 4799 Kielce residents. The study protocol embraced an individual Health Status Questionnaire, medical examination, basic anthropometric measurements, and biological blood and urine sampling. More detailed information on the recruitment for the PONS study may be found in our previously published paper, i.e.31
Data Verification
In pursuance of the statutory right to access personal data, the present study made use of pertinent data on PONS participants, ie, permanent Kielce residents. The verification covered the representative sample of 4799 (33.7% of men) survey participants. Based on the assessment of the data completeness, all cases (n=64) of missing information necessary to define the established study endpoints (Figure S1: Supplementary Materials) were removed from the database. Ultimately, 4735 (33.6% of men) participants, mean age 55.1 years, were pronounced eligible for a detailed assessment.
Anthropometric Measurements
Body weight with an accuracy of up to 0.1 kg, and percentage of body fat was assessed by BIA method using Tanita S.C.-240 MA tetra polar body composition analyser. The analyser complies with NAWI CLASS III standards for the scales in use for medical measurements, boasts European Union CE0122 certification, and meets the requirements of Medical Device Directive (MDD 93/42/EEC. Measurements frequency was 50 kHz, measurements current 90 μA, and measurements range 150–1200Ω). All measurements were taken using the standard settings. The prior-measured body height, age, and gender were manually entered into the analyser. During the actual measuring procedure, the subjects were minimally dressed, barefoot, and instructed to maintain a stable posture by keeping contact with all four electrodes of the analyser with their feet. BF% was assessed with the aid of the device’s built-in equations. Growth was measured with the accuracy of up to 0.1 cm in an upright position with a Seca height measure. BMI was calculated as the quotient of body weight in kilograms divided by the body height in meters squared (kg/m−2). Anthropometric measurements of body circumferences were made with a metric tape with an accuracy of 0.1cm. WC was measured at the navel or at the waistline. Hip circumference was measured at the widest part of the hips. WHR and WHTR were calculated as the ratio of the circumference of the waist to the circumference of the hips and the circumference of the waist to the height of the body, respectively. Systolic (SBP) and diastolic (DBP) blood pressure was measured by a blood pressure monitor Omron (Model M3 Intellisense) and calculated as an average of two consecutive readings taken by medical personnel.
Laboratory Measurements
Serum measurements were completed in an onsite laboratory against applicable reference standards. Fasting blood glucose (FBG), total cholesterol (TC), high-density lipoproteins (HDL-C) and triglycerides (TG) concentrations were determined using enzymatic methods. The estimation of low-density lipoprotein cholesterol (LDL-C) level was performed using Friedewald’s equation for TG level less than 400 mg/dl. Laboratory tests were performed with CB 350iWiener Lab (Table S1: Supplementary Materials).
Definitions of the Outcomes
Hypertension was defined as SBP≥140 and DBP≥90 mm/Hg, or self-reported hypertension under treatment. Dyslipidemia was defined as TC≥190 mg/dl and/or HDL-C<40 mg/dl for men (HDL-C<45 mg/dl for women) and/or LDL-C≥115 mg/dl and/or TG≥150 mg/dl, or self-reported dyslipidemia under treatment. Diabetes mellitus was defined as FBG>126 mg/dl, or self-reported diabetes mellitus under treatment. Clustered CRF’s ≥1, ≥2, and 3 were defined as at least one, two, or exactly three risk factors, respectively.
The Individual Health Status Questionnaire
Smoking status, alcohol consumption, and physical activity were established in line with the Health Status questionnaire constraints. Smoking status and alcohol consumption were categorised in much the same way, ie, never (never or former), and current smoker or drinker. Moderate to vigorous physical activity at leisure (MVPA) was calculated against International Physical Activity Questionnaire (long version). MVPA was calculated based on the number of days and duration of physical activity in leisure time.
Statistical Analysis
Basic characteristics of the variables under study are presented as means ± standard deviations, as well as numbers and percentages. The significance of the differences encountered in the groups of men and women, respectively, was established by an independent t-test (continuous variables), or chi-square test (categorized variables). The homogeneity of variance was examined by the F-test. Within both gender groups separately, the cut-offs of BF% variable were established with respect to variable ≥1 CRF (at least one of CRF). This was implemented on the basis of series of chi-square independence tests, duly evaluated for the contingency tables crated each time for the following pair of variables: ≥1 CRF and dichotomised BF% for particular gender.32 The above-referenced dichotomizations were accomplished for every consecutive unique value of a particular sample (ie, percentage of body fat within a gender group), whilst discarding the four lowest and the four highest unique values (due to some computational factors). Consequently, the cut-offs for BF% were established as 25.8% for men, and 37.1% for women (Figure 1).
 |
Figure 1 Percentage body fat cut-off by at least one of CRF, separately for men and women. |
Receiver Operating Characteristics (ROC) Curve Analyses were applied to have the so obtained estimates subsequently verified. The same sex-specific cut-offs were noted for the predictive variable BF% (≥1 CRF was a binary classifier). The ROC analysis was applied to determine the discriminatory power of BF% in differentiating adults with at least 1 CRF (hypertension, dyslipidemia, diabetes mellitus). Optimal cut-off values were determined as a specific point on the curve whereupon Youden index (defined as sensitivity + specificity-1) was at the maximum. The area under the curve (AUC), ranging between 0 and 1 (a worthless and a perfect test, respectively), was used to predict cardio-metabolic risk based on BF%. Sex-specific correlation of BF% and BMI (as continuous variables) was examined with the aid of Spearman’s rank correlation coefficients. Distributions of study variables were determined by Shapiro–Wilk test. Association between BF% and BMI (as categorical variables) was examined by chi-square test. Unadjusted and adjusted odds ratios (ORs) and 95% confidence intervals (CIs) were determined in line with the logistic regression models. Covariates for adjusted ORs were age, smoking history, alcohol drinking, and MVPA status. Confidence intervals were based on the profiled function of the credibility logarithm. Population attributable risk (PAR%) due to a risk factor, which could be reduced, should this risk factor be eliminated, was calculated whilst making use of the gender-specific cut-offs for BF% for each single and clustered CRFs separately, in compliance with the following formula:33,34
(1)
where:
P was a percentage of persons with BF% above gender-specific cut-offs
OR was the age-adjusted ORs for CRFs in the subjects, whilst making use of the gender-specific cut-offs for BF%.
P values <0.05 were deemed statistically significant. All statistical analyses were completed with the aid of R v. 3.5.3.
Sensitivity Analysis
Two separate sensitivity analyses were carried out at two different stages of the main analysis.
Stage 1 – Identification of the cut-off points for BF%. Due to potential changes in the subjects’ body composition resulting from specific types of cancer, clinical stage, and the actual method of oncological treatment applied, all cases (n=191) with confirmed cancer in medical history were excluded from the study database. Subsequently, much as in the main analysis, the gender-specific cut-offs for BF% were established with respect to at least one CRF. Consequently, BF% cut-offs for men changed slightly (25.6% as per the sensitivity analysis, and 25.8% as per the main analysis), while for women they remained unaltered (Figure S2: Supplementary Materials). Therefore, all the analyses at issue were based on the gender-specific cut-offs estimated against the results yielded by the main analysis.
Stage 2 – assessment of the associations of single and clustered CRFs under study with respective BF% categories. All subjects (n=679) with self-reported CVDs (Figure S1: Supplementary Materials) were excluded from the study database. Subsequently, the adjusted logistic regression models were fitted with the same set of CRFs and covariates, as in the main analysis.
Results
The study protocol covered 4735 individuals from different age groups (age range 45–64 years); men accounting for 33.6% of the population sample (Table 1). The mean values of body height, weight, BMI, WC, WHR, WHTR, SBP, DBP, FBG, TG and hypertension, diabetes mellitus, ≥2 and 3 CRFs were significantly higher in men than in women. Men were also found to consume alcohol more frequently. Despite higher mean values of BF% indexes and higher incidence of obesity in men, women had significantly higher mean values of BF%. The mean BF%, concentrations of HDL-C, LDL-C and TC, were significantly higher in women than in men.
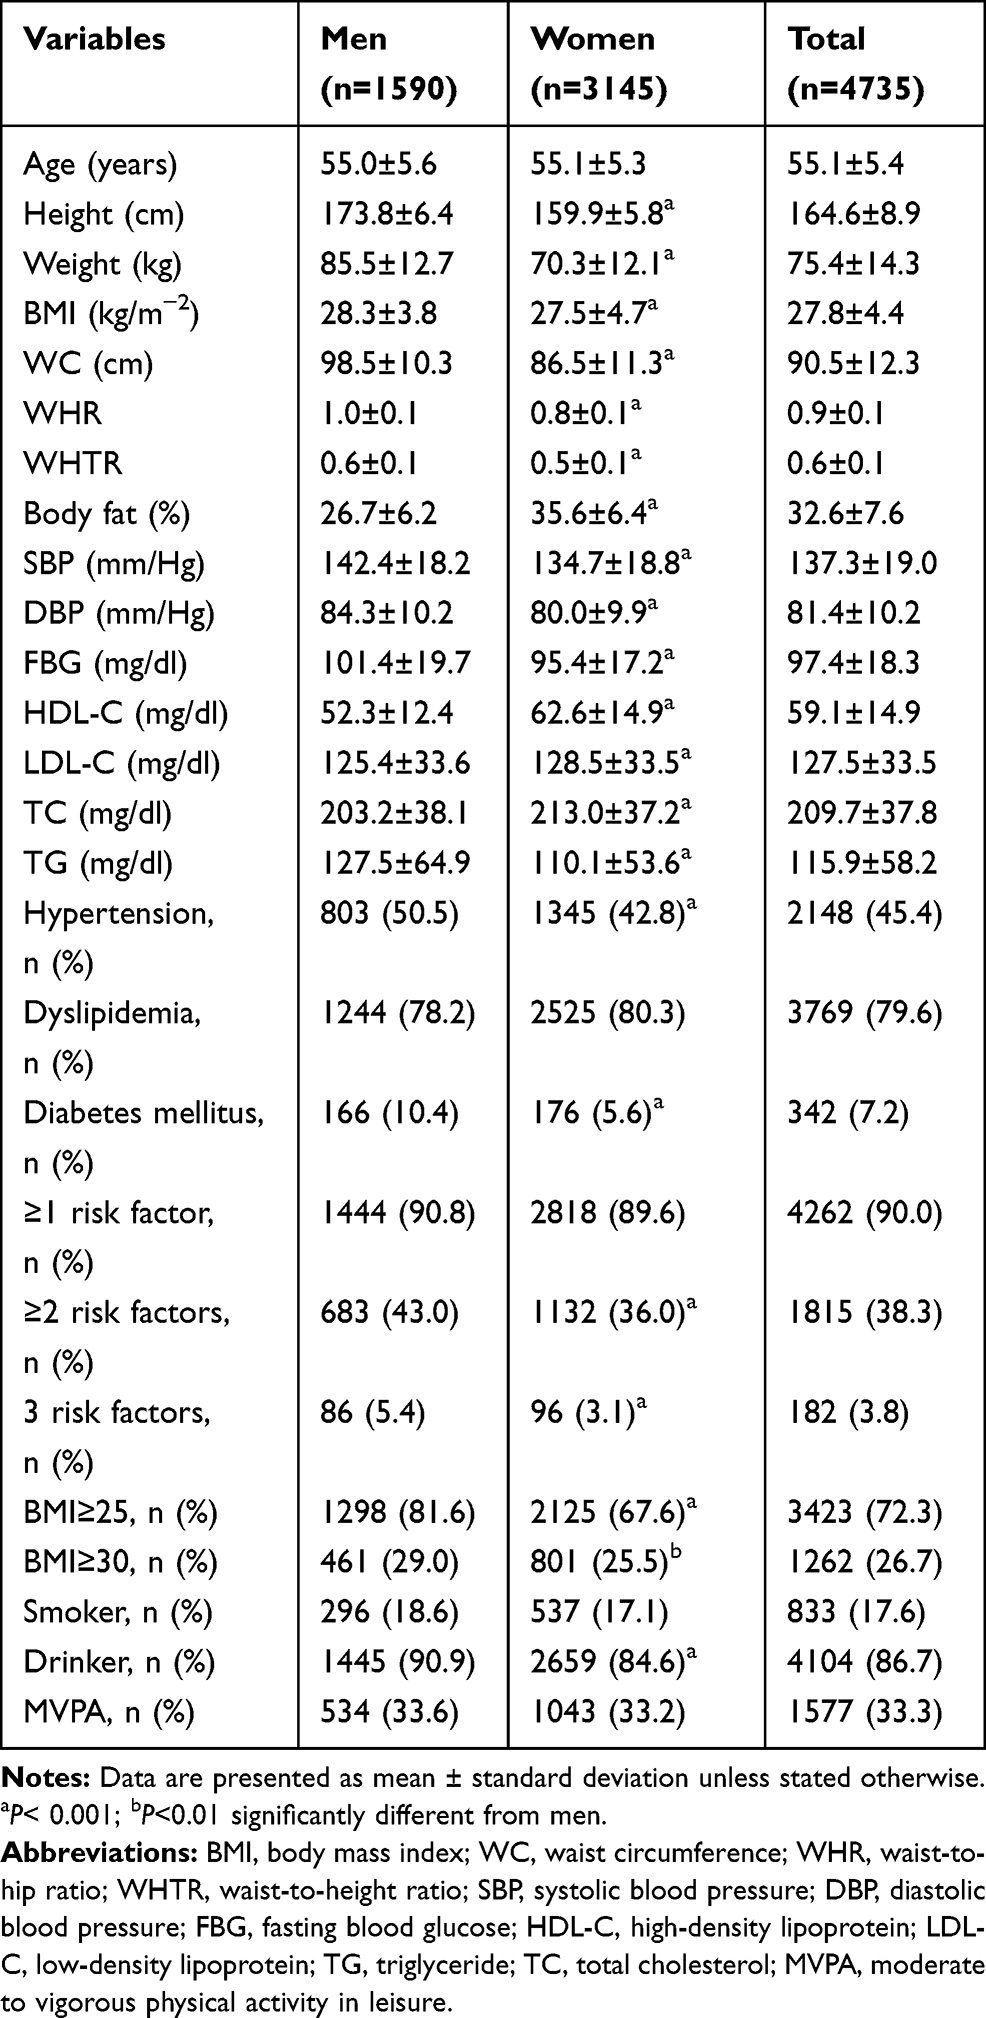 |
Table 1 Basic Characteristics of the Study Group Total, and Stratified by Gender |
With the exception of dyslipidemia, the prevalence of other single and clustered CRFs under study was higher in men than in women (Figure 2). The prevalence of ≥1 CRF in men with 20–25% BF was 87.7%, which was equivalent to that of women with 30–35% BF (87.2%). Dynamic increase of hypertension and ≥2 CRFs prevalence was observed in men with 20% BF, and in women with more than 30% BF. The prevalence ≥2 CRFs in men with 30–35% BF was 56.4%, which corresponded to women with 40–45% BF (51.6%). The prevalence of ≥3 CRFs in women who had 25–30% BF was over 5 times lower than in men with similar BF% (Table S2: Supplementary Materials).
 |
Figure 2 The association between BF% and prevalence of CRFs, stratified by gender in different BF fat groups. |
The percentage of men and women in particular BF% categories (different body fat groups) was highly differentiated (Figure 3). The cumulative percentage of observations in the groups of up to 30% of BF was 4 times higher in men (73.7%) than in women (18.4%). The BF content ranging 20–30% pertained to 62.6% of men and only 16.9% of women. In more than half of the women (56.2%) the BF content ranged 30–40%.
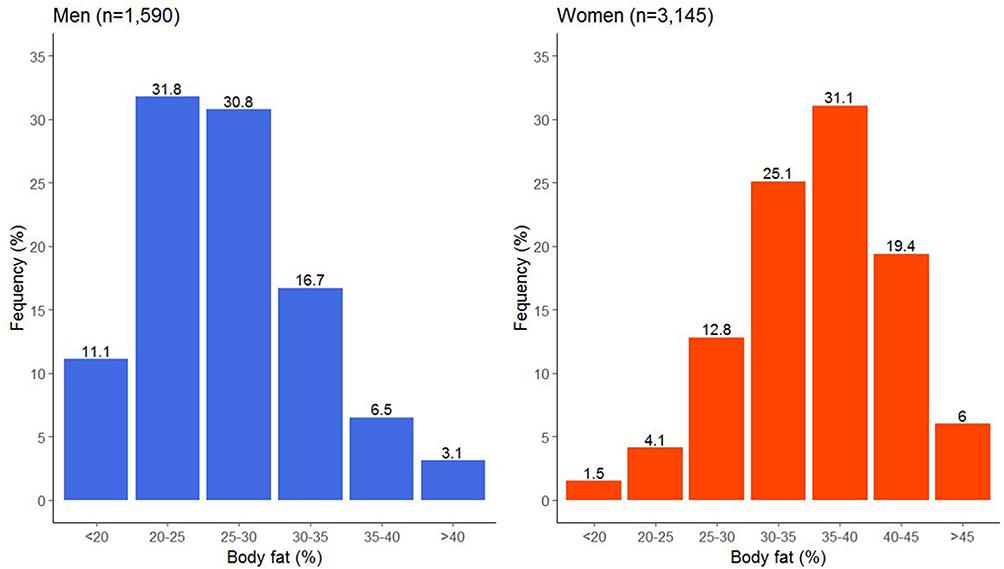 |
Figure 3 Percentage frequency by gender in the different body fat groups. |
Sex-specific correlations of BF%, and BMI were highly significant. Spearman’s rank correlation coefficients were 0.8 and 0.9 for men, and women, respectively. The association between the estimated BF% categories, and the commonly accepted BMI categories was also significant (Table S3: Supplementary Materials). In both genders, more than 90% of individuals with BF% below the cut-off threshold were usually of normal weight. Similarly, over 90% of men and women with BF% above the cut-offs were obese.
Based on the ROC analysis, in both men and women, the classification of cases into risk groups with and without ≥1 CRF proved to pertain more to specificity than sensitivity (Table 2). Based on the estimated cut-offs for BF%, almost 72% of men and 73% of women could then be correctly classified into the groups without ≥1 CRF. The probability of ≥1 CRF increased almost twofold in men, and more than 1.5-fold in women with the BF% exceeding the cut-offs.
 |
Table 2 Optimal BF% Cut-Offs for Screening Single and Clustered Cardiovascular Risk Factors |
The odds for CRFs were strongly related to BF% content (Table S4: Supplementary Materials). Based on the adjusted regression models (Figure 4), with the exception of dyslipidemia in the men with BF≥25.8%, the odds for developing hypertension and diabetes mellitus was more than 2.5 times higher in men with BF≥25.8%, and about 3 times higher in men with clustered CRFs, than in the men with BF<25.8%. In the women with BF≥37.1% the odds for developing hypertension, diabetes mellitus, and ≥2 CRFs was about 2.5 times higher, while in the women with 3 CRFs about 3 times higher than in the women with BF<37.1%. The chance for ≥1 CRF in the women with BF≥37.1% was about twice as high as in the women with BF% below the cut-off threshold. The sensitivity analysis (Table S5: Supplementary Materials) did not deviate considerably from the principal results. The ORs values were similar and, with the exception of 3 CRFs, generally differed about 0.1 from the adjusted ORs.
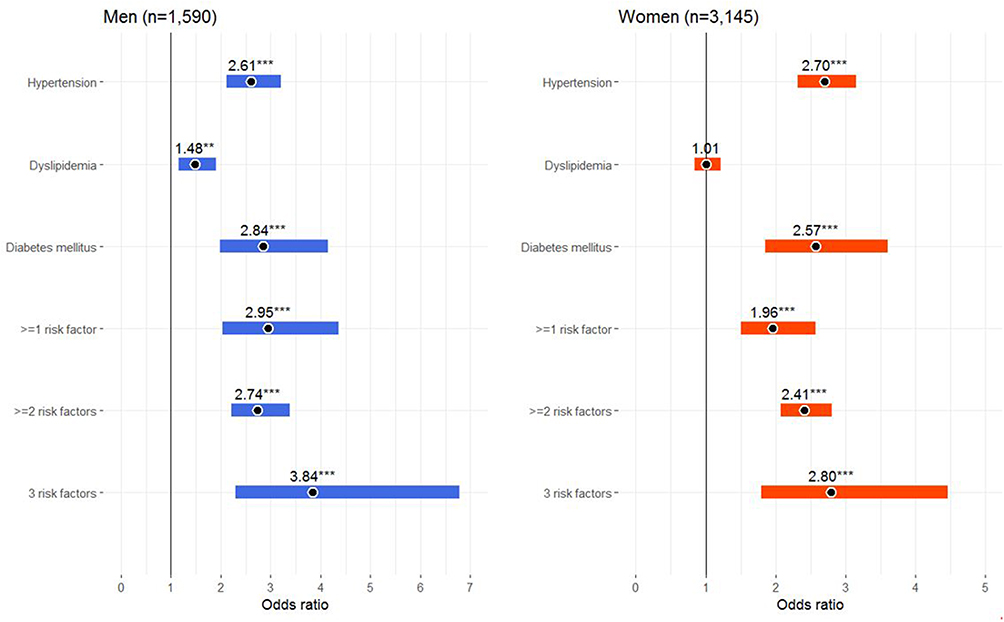 |
Figure 4 Adjusted ORs (95% CIs) of BF% categories for single and clustered CRFs, stratified by gender. Notes: **P<0.01; ***P<0.001 vs BF<25.8 for men and BF<37.1 for women. |
Table 3 presents the age-adjusted ORs (95% CIs) and PAR (%) for single and clustered CRFs by gender-specific cut-offs for BF%. The percentage of men and women with BF% above the cut-off thresholds was 50.8% and 42.7%, respectively. Based on PAR analysis (%), controlling BF% below the gender-specific cut-offs would prevent (except for dyslipidemia) about 50% of single and clustered CRFs cases in men, and 30–40% of cases in women. Controlling BF% below the cut-off thresholds would prevent 18.6% of dyslipidemia in men and 4.1% in women.
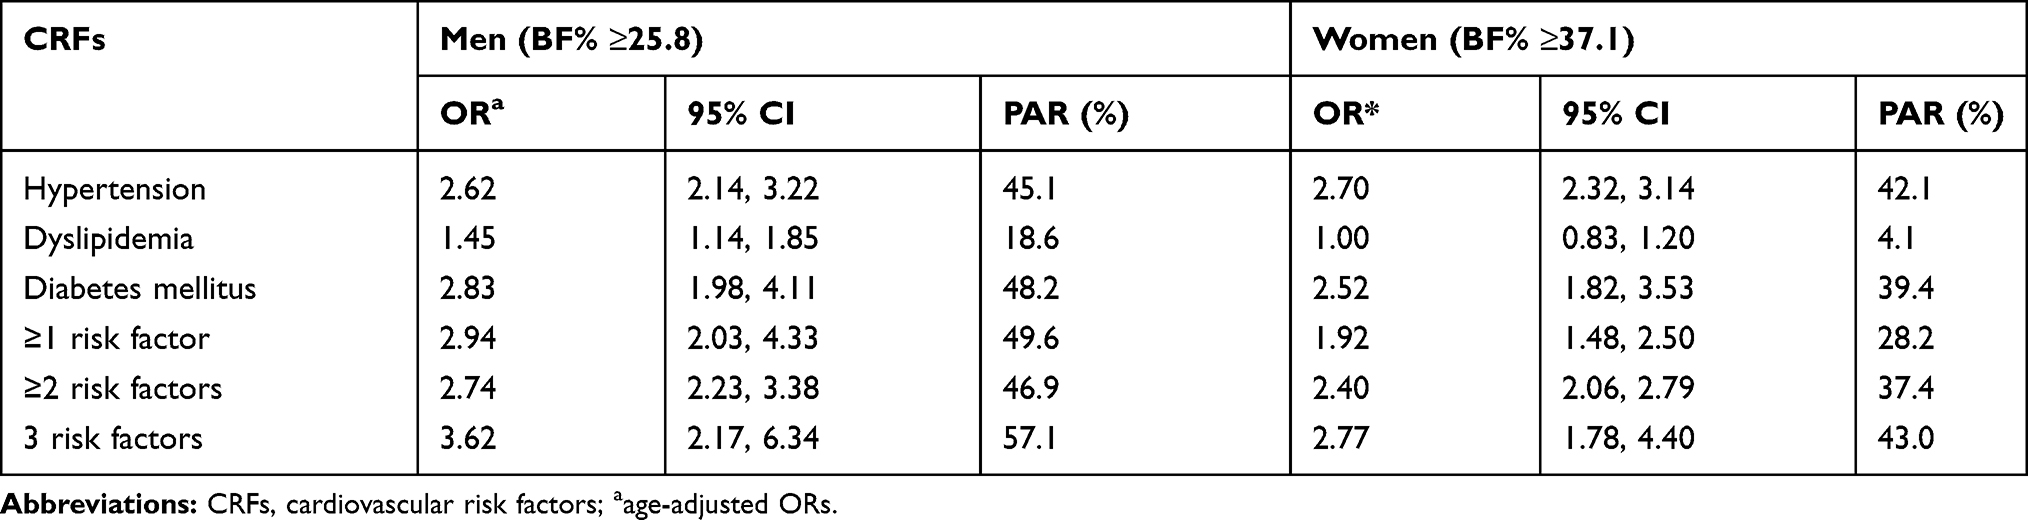 |
Table 3 Population-Attributable Risks [PAR (%)] of Single and Clustered CRFs, Stratified by Gender-Specific Cut-Offs for BF% |
Discussion
Based on the presence of at least ≥1 CRF, the cut-offs for BF% were established, ie, 25.8% and 37.1% for men and women, respectively. In line with respective BF thresholds, obesity was encountered in half of the men, and in over 40% women. Also, the prevalence of CRFs was higher in men than in women, being far more common in men with a lower BF%. BF% relationships with single and clustered CRFs proved strong and, except for dyslipidemia, regardless of gender, BF% above the established cut-offs increased the chance of cardio-metabolic disorders by 2–3.5 times. As evidenced by our study, controlling BF% below the established thresholds may effectively prevent approx. half of CRF cases in men, and approx. one-third in women.
The effect of excessive fat accumulation within the body on the incidence of CRFs had been a principal focus of several studies.35,36 Investigators were equally keen on determining the optimal cut-off points for BF%.37,38 Some confusion was caused by the authors referring to WHO report pertaining to the cut-offs for BF%, indicative of prevalence of obesity above 25% for men, and 35% for women.39 In point of fact, the cut-offs values published by WHO were not meant as the strict guidelines to be followed in diagnosing obesity, as is the case with BMI, nor were they intended to be construed as the CRFs risk predictors. A question might then arise as to why seek out any new methods when there is already a number of well established, verified and generally acknowledged ways for measuring the cut-off points for obesity? First of all, because the presently available obesity measures very often fail to take into account the biological variability resulting, from eg, age, gender, and ethnic origin. Also because with regard to some of the measuring methods, there are legitimate doubts as to whether they really measure what they are meant to be measuring. As per the WHO definition, obesity is to be construed an excessive and health-hazardous accumulation of adipose tissue within the body.7
This gives rise to yet another question. If it is the fat that defines obesity, while BMI defines body weight, is BMI really the most fitting measure for defining obesity? Apparently, the answer is not all that simple. BMI, taking into account body weight in its calculation formula, does not distinguish between its main components, ie, fat mass and lean mass.40,41 Therefore, individuals with an atypical body build (high muscle mass and low height or vice versa) may be classified in the wrong categories of this indicator.22,42 It should also be highlighted at this juncture that BMI is not applied in children under 14 years of age, as it is not indicative of the age-related physiological changes within body composition, physiological differences in fat cover between men and women, and genetic and environmental determinants of differences in body composition between different ethnic groups/races.18,19,43,44
Despite those widely acknowledged diagnostic doubts, BMI is a commonly accepted measure, extremely simple and convenient to use in clinical practice and research, indicates strong and stable relationships with BF%, and death from all causes.23,45,46 The use of BMI in combination with other anthropometric measures is recommended as a more effective way of assessing obesity.47 Frequently, indicators of WC and WHR adipose tissue distribution within the body are recommended with regard to detecting obesity and determining overall health hazard, in view of the strong links between abdominal obesity and CVDs.42,47-49
The results of our study were based on adipose tissue measurement using the BIA method. To date, no clear cut-offs for BF% have been established for both obesity diagnosis, and CRFs risk prediction.39 Most of the published results are derived from the cross-sectional studies. The most prudent approach would consist in determining the obesity thresholds for BF% in a population-based prospective study with a “hard” outcome, ie, mortality.23 As the cut-offs for BF% proposed by different investigators differ between themselves, there is plenty of resultant confusion.
Besides, it would appear that the proposed thresholds for BF% are applicable only with regard to the groups for which they have been estimated, or to very similar groups in terms of age, gender and ethnic origin. Despite the differences, at least two regularities are clearly discernible in the results under study. Firstly, the cut-off threshold for men is about 10% lower than the one for women. Secondly, the cut-offs for BF% indicate a variation of ±5% around the 25% threshold for men, and the 35% threshold for women.
Cardio-metabolic risk is not determined exclusively by a single CRF, ie, obesity. Regretfully enough, many of the remaining CRFs are causally linked to obesity.2 It follows that reliable fat assessment is essential, and, paradoxically, the simplest method in assessing the risk of CVDs. Lack of general consensus on which specific fat measure is the best predictor of health hazard may make clinicians reluctant to make any use of it, or regularly monitor adipose tissue body content in their routine clinical practice.50 Misclassification of obesity implies misclassification of attendant health risks. This in turn implies certain clinical consequences, especially in the case of false-negative results.38 Making no attempts at therapeutic intervention in the patients burdened with excessive adipose tissue, yet boasting normal BMI value, appreciably increases the absolute risk of fatal and non-fatal CVDs events.
It should also be highlighted at this juncture that the cut-offs for BF% proposed by ourselves should by no means be construed as the applicable thresholds in diagnosing obesity. The applied methods merely allowed us to make use of the referenced cut-offs to assess the risk of CRFs related to obesity in men and women aged 45–64 years. We would recommend, however, to assess obesity (also in the cohort under study) by way of using commonly recommended anthropometric measures with the verified cut-off points, out of which BMI appears the principal one.
Admittedly, the present study is also burdened by certain limitations. Firstly, its cross-sectional character precluded establishing the cause-effect relationships between BF% and the risk of CVDs. Secondly, the method used to assess BF% was an indirect measurement and therefore prone to underrating. Thirdly, the results of this study may be extrapolated onto the individuals of similar age only. Age also happens to be a confounding factor which effectively disrupts the BF% association with CVDs risk. Much younger, or much older individuals are characterised by physiological differences in body composition, and therefore predicting the obesity-related CRFs in such individuals on the basis of the proposed cut-offs for BF% would clearly be an imprudent approach to this complex issue.
Conclusion
The percentage of adipose tissue is essentially indicative of the associations with the risk factors for CVDs related to obesity. Controlling adipose tissue below the cut-off thresholds indicating an increased health risks may be instrumental in appreciably reducing overall cardio-metabolic risk. Non-availability of clearly defined cut-offs for BF in seniors and younger patients, as well as a widespread application of surrogate measures for its assessment, may well result in incorrect prediction of cardio-metabolic risk in some patients. As it is particularly undesirable in clinical practice, this assessment requires that alternative criteria for BF content be applied rather than merely BMI. In terms of general public health concerns, identification of the cut-offs for BF in seniors and other age groups is essential for developing specifically target-oriented, health-promoting programmes, aimed at overall prevention of cardiovascular diseases.
Ethical Approval
The PONS study was approved by a local Ethics Review Committee within the Cancer Center, and by the Institute of Oncology in Warsaw, Poland. All PONS study participants provided written informed consent. The present study was approved and duly endorsed by a local Ethics Review Committee, Faculty of Health Sciences (Approval Ref. No. 25/2015), The Jan Kochanowski University (JKU) in Kielce, Poland.
Acknowledgments
The authors are most grateful to all participants for their committed involvement in the study protocol, despite numerous inconveniences this may have caused them.
Author Contributions
All authors contributed to data analysis, drafting or revising the paper, gave final approval of the version to be published, and agreed to be held accountable for all aspects of the work.
Funding
The research Project PONS - Polish-Norwegian Study (Ref. No PNRF-228- AI-1/07), named “Establishment of the infrastructure to facilitate studies on the health status of Poland’s population”, was financed out of the Polish-Norwegian Foundation Research Fund. The Project is supported under the programme established by the Minister of Science and Higher Education - “Regional Initiative of Excellence” - spanning the period 2019–2022; Project No 024/RID/2018/19; amount of financing allocated: PLN 11999 000.00.
Disclosure
The authors report no conflicts of interest in the present study.
References
1. Boutayeb A, Boutayeb S. The burden of non communicable diseases in developing countries. Int J Equity Health. 2005;4(1). doi:10.1186/1475-9276-4-2
2. Ortega Francisco B, Lavie Carl J, Blair Steven N. Obesity and cardiovascular disease. Circ Res. 2016;118(11):1752–1770. doi:10.1161/CIRCRESAHA.115.306883
3. Rodgers JL, Jones J, Bolleddu SI, et al. Cardiovascular risks associated with gender and aging. J Cardiovasc Dev Dis. 2019;6(2):19. doi:10.3390/jcdd6020019
4. Missud DC, Parot-Schinkel E, Connan L, Vielle B, Huez J-F. Physical activity prescription for general practice patients with cardiovascular risk factors–the PEPPER randomised controlled trial protocol. BMC Public Health. 2019;19(1):688. doi:10.1186/s12889-019-7048-y
5. Fa-Binefa M, Clará A, Pérez-Fernández S, et al. Early smoking-onset age and risk of cardiovascular disease and mortality. Prev Med. 2019;124:17–22. doi:10.1016/j.ypmed.2019.04.022
6. Vornamen M, Konttinen H, Kaariainen H, et al.Family history and perceived risk of diabetes, cardiovascular disease, cancer, and depression. PubMed - NCBI. Available from: https://www.ncbi.nlm.nih.gov/pubmed/27353304.
7. WHO. Obesity. WHO. Available from: https://www.who.int/topics/obesity/en/.
8. Flegal KM, Kit BK, Orpana H, Graubard BI. Association of all-cause mortality with overweight and obesity using standard body mass index categories. JAMA. 2013;309(1):71–82. doi:10.1001/jama.2012.113905
9. NCD Risk Factor Collaboration (NCD-RisC). Trends in adult body-mass index in 200 countries from 1975 to 2014: a pooled analysis of 1698 population-based measurement studies with 19·2 million participants. Lancet Lond Engl. 2016;387(10026):1377–1396. doi:10.1016/S0140-6736(16)30054-X.
10. Akoumianakis I, Antoniades C. The interplay between adipose tissue and the cardiovascular system: is fat always bad? Cardiovasc Res. 2017;113(9):999–1008. doi:10.1093/cvr/cvx111
11. Nicklas TA, O’Neil CE. Prevalence of obesity: a public health problem poorly understood. AIMS Public Health. 2014;1(2):109–122. doi:10.3934/publichealth.2014.2.109
12. Williams EP, Mesidor M, Winters K, Dubbert PM, Wyatt SB. Overweight and obesity: prevalence, consequences, and causes of a growing public health problem. Curr Obes Rep. 2015;4(3):363–370. doi:10.1007/s13679-015-0169-4
13. Fletcher I. Defining an epidemic: the body mass index in British and US obesity research 1960–2000. Sociol Health Illn. 2014;36(3):338–353. doi:10.1111/1467-9566.12050
14. Organization WH. Obesity: Preventing and Managing the Global Epidemic. World Health Organization; 2000.
15. Jensen B, Braun W, Geisler C, et al. Limitations of fat-free mass for the assessment of muscle mass in obesity. Obes Facts. 2019;12(3):307–315. doi:10.1159/000499607
16. WHO Expert Consultation. Appropriate body-mass index for Asian populations and its implications for policy and intervention strategies. Lancet Lond Engl. 2004;363(9403):157–163. doi:10.1016/S0140-6736(03)15268-3.
17. Tomiyama AJ, Hunger JM, Nguyen-Cuu J, Wells C. Misclassification of cardiometabolic health when using body mass index categories in NHANES 2005–2012. Int J Obes 2005. 2016;40(5):883–886. doi:10.1038/ijo.2016.17
18. Bredella MA. Sex differences in body composition. In: Mauvais-Jarvis F, editor. Sex and Gender Factors Affecting Metabolic Homeostasis, Diabetes and Obesity. Vol. 1043. Cham: Springer International Publishing; 2017: 9–27. doi:10.1007/978-3-319-70178-3_2.
19. Schorr M, Dichtel LE, Gerweck AV, et al. Sex differences in body composition and association with cardiometabolic risk. Biol Sex Differ. 2018;9(1). doi:10.1186/s13293-018-0189-3
20. Yan W, Bingxian H, Hua Y, et al. Waist-to-height ratio is an accurate and easier index for evaluating obesity in children and adolescents. Obesity. 2007;15(3):748–752. doi:10.1038/oby.2007.601
21. Liao Q, Zheng Z, Xiu S, Chan P. Waist circumference is a better predictor of risk for frailty than BMI in the community-dwelling elderly in Beijing. Aging Clin Exp Res. 2018;30(11):1319–1325. doi:10.1007/s40520-018-0933-x
22. Qiao Q, Nyamdorj R. The optimal cutoff values and their performance of waist circumference and waist-to-hip ratio for diagnosing type II diabetes. Eur J Clin Nutr. 2010;64(1):23–29. doi:10.1038/ejcn.2009.92
23. Ho-Pham LT, Lai TQ, Nguyen MTT, Nguyen TV. Relationship between body mass index and percent body fat in Vietnamese: implications for the diagnosis of obesity. Blachier F ed. PLoS One. 2015;10(5):e0127198. doi:10.1371/journal.pone.0127198
24. Lizak D, Budzowski A, Seń M, Czarny W. Anthropometric measures of body composition used in obesity diagnosis – an overview. Hygeia Public Health. 2016;51(2):124–133.
25. Courville AB, Yang SB, Andrus S, et al. Body adiposity measured by bioelectrical impedance is an alternative to dual-energy x-ray absorptiometry in black Africans: the Africans in America Study. Nutrition. 2020;74:110733. doi:10.1016/j.nut.2020.110733
26. Flegal KM, Shepherd JA, Looker AC, et al. Comparisons of percentage body fat, body mass index, waist circumference, and waist-stature ratio in adults. Am J Clin Nutr. 2009;89(2):500–508. doi:10.3945/ajcn.2008.26847
27. Achamrah N, Colange G, Delay J, et al. Comparison of body composition assessment by DXA and BIA according to the body mass index: a retrospective study on 3655 measures. Handelsman DJ ed. PLoS One. 2018;13(7):e0200465. doi:10.1371/journal.pone.0200465
28. Suliga E, Koziel D, Cieśla E, Rębak D, Głuszek S. Sleep duration and the risk of obesity – a cross-sectional study. Med Stud. 2017;33(3):176–183. doi:10.5114/ms.2017.70343
29. Dickey RA, Bartuska D, Bray GA, et al. AACE/ACE position statement of the prevention, diagnosis, and treatment of obesity. Endocr Pract. 1998;4:297–350.
30. Ho-Pham LT, Campbell LV, Nguyen TV. More on body fat cutoff points. Mayo Clin Proc. 2011;86(6):584. doi:10.4065/mcp.2011.0097
31. Macek P, Terek-Derszniak M, Zak M, et al. WHO recommendations on physical activity versus compliance rate within a specific urban population as assessed through IPAQ survey: a cross-sectional cohort study. BMJ Open. 2019;9(6):e028334. doi:10.1136/bmjopen-2018-028334
32. Kim C-H, Park HS, Park M, Kim H, Kim C. Optimal cutoffs of percentage body fat for predicting obesity-related cardiovascular disease risk factors in Korean adults. Am J Clin Nutr. 2011;94(1):34–39. doi:10.3945/ajcn.110.001867
33. Bei-Fan Z. the cooperative meta-analysis group of working group on obesity in China. Predictive values of body mass index and waist circumference for risk factors of certain related diseases in Chinese adults: study on optimal cut-off points of body mass index and waist circumference in Chinese adults. Asia Pac J Clin Nutr. 2002;11(s8):S685–S693. doi:10.1046/j.1440-6047.11.s8.9.x
34. Li Y, Wang H, Wang K, et al. Optimal body fat percentage cut-off values for identifying cardiovascular risk factors in Mongolian and Han adults: a population-based cross-sectional study in inner Mongolia, China. BMJ Open. 2017;7(4):e014675. doi:10.1136/bmjopen-2016-014675
35. Britton KA, Massaro JM, Murabito JM, Kreger BE, Hoffmann U, Fox CS. Body fat distribution, incident cardiovascular disease, cancer, and all-cause mortality. J Am Coll Cardiol. 2013;62(10):921–925. doi:10.1016/j.jacc.2013.06.027
36. Seravalle G, Grassi G. Obesity and hypertension. Pharmacol Res. 2017;122:1–7. doi:10.1016/j.phrs.2017.05.013
37. Fang H, Berg E, Cheng X, Shen W. How to best assess abdominal obesity. Curr Opin Clin Nutr Metab Care. 2018;21(5):360–365. doi:10.1097/MCO.0000000000000485
38. De Lorenzo A, Deurenberg P, Pietrantuono M, Di Daniele N, Cervelli V, Andreoli A. How fat is obese? Acta Diabetol. 2003;40(S1):s254–s257. doi:10.1007/s00592-003-0079-x
39. WHO. TRS_854.pdf. Available from: https://apps.who.int/iris/bitstream/handle/10665/37003/WHO_TRS_854.pdf?sequence=1&isAllowed=y.
40. Tafeit E, Cvirn G, Lamprecht M, et al. Using body mass index ignores the intensive training of elite special force personnel. Exp Biol Med Maywood NJ. 2019:1535370219848986. doi:10.1177/1535370219848986.
41. Vinknes K, Nurk E, Tell G, Sulo G, Refsum H, Elshorbagy AK. The relation of CUN-BAE index and BMI with body fat, cardiovascular events and diabetes during a 6-year follow-up: the Hordaland Health Study. Clin Epidemiol. 2017;9:555–566. doi:10.2147/CLEP.S145130
42. Ahmad N, Adam SIM, Nawi AM, Hassan MR, Ghazi HF. Abdominal obesity indicators: waist circumference or waist-to-hip ratio in Malaysian adults population. Int J Prev Med. 2016;(7). doi:10.4103/2008-7802.183654
43. Tyson N, Frank M. Childhood and adolescent obesity definitions as related to BMI, evaluation and management options. Best Pract Res Clin Obstet Gynaecol. 2018;48:158–164. doi:10.1016/j.bpobgyn.2017.06.003
44. Wang J, Thornton JC, Russell M, Burastero S, Heymsfield S, Pierson RN. Asians have lower body mass index (BMI) but higher percent body fat than do whites: comparisons of anthropometric measurements. Am J Clin Nutr. 1994;60(1):23–28. doi:10.1093/ajcn/60.1.23
45. Winter JE, MacInnis RJ, Wattanapenpaiboon N, Nowson CA. BMI and all-cause mortality in older adults: a meta-analysis. Am J Clin Nutr. 2014;99(4):875–890. doi:10.3945/ajcn.113.068122
46. Vanavanan S, Srisawasdi P, Rochanawutanon M, Kumproa N, Kruthkul K, Kroll MH. Performance of body mass index and percentage of body fat in predicting cardiometabolic risk factors in Thai adults. Diabetes Metab Syndr Obes. 2018;11:241.doi:10.2147/DMSO.S167294
47. Zhu S, Heshka S, Wang Z, et al. Combination of BMI and waist circumference for identifying cardiovascular risk factors in Whites. Obes Res. 2004;12(4):633–645. doi:10.1038/oby.2004.73
48. Guasch-Ferré M, Bulló M, Martínez-González MÁ, et al. Waist-to-height ratio and cardiovascular risk factors in elderly individuals at high cardiovascular risk. PLoS One. 2012;7(8):e43275. doi:10.1371/journal.pone.0043275
49. Kerkadi A, Suleman D, Salah LA, et al. Adiposity indicators as cardio-metabolic risk predictors in adults from country with high burden of obesity. Diabetes Metab Syndr Obes. 2020;13:175. doi:10.2147/DMSO.S238748
50. Ramírez-Vélez R, Correa-Bautista J, Sanders-Tordecilla A, et al. Percentage of body fat and fat mass index as a screening tool for metabolic syndrome prediction in Colombian University students. Nutrients. 2017;9(9):1009. doi:10.3390/nu9091009
 © 2020 The Author(s). This work is published and licensed by Dove Medical Press Limited. The
full terms of this license are available at https://www.dovepress.com/terms
and incorporate the Creative Commons Attribution
- Non Commercial (unported, 3.0) License.
By accessing the work you hereby accept the Terms. Non-commercial uses of the work are permitted
without any further permission from Dove Medical Press Limited, provided the work is properly
attributed. For permission for commercial use of this work, please see paragraphs 4.2 and 5 of our Terms.
© 2020 The Author(s). This work is published and licensed by Dove Medical Press Limited. The
full terms of this license are available at https://www.dovepress.com/terms
and incorporate the Creative Commons Attribution
- Non Commercial (unported, 3.0) License.
By accessing the work you hereby accept the Terms. Non-commercial uses of the work are permitted
without any further permission from Dove Medical Press Limited, provided the work is properly
attributed. For permission for commercial use of this work, please see paragraphs 4.2 and 5 of our Terms.