Back to Journals » Diabetes, Metabolic Syndrome and Obesity » Volume 16
Optimal Anthropometric Indicators and Cut Points for Predicting Metabolic Syndrome in Chinese Patients with Type 2 Diabetes Mellitus by Gender
Authors Mao J ![]() , Gan S
, Gan S ![]() , Zhou Q
, Zhou Q ![]() , Zhou H, Deng Z
, Zhou H, Deng Z ![]()
Received 27 November 2022
Accepted for publication 11 February 2023
Published 21 February 2023 Volume 2023:16 Pages 505—514
DOI https://doi.org/10.2147/DMSO.S399275
Checked for plagiarism Yes
Review by Single anonymous peer review
Peer reviewer comments 2
Editor who approved publication: Prof. Dr. Antonio Brunetti
Jing Mao,1,* Shenglian Gan,2,* Quan Zhou,3 Haifeng Zhou,2 Zhiming Deng2
1Nanhua University, Hengyang, People’s Republic of China; 2Department of Endocrinology, The First People’s Hospital of Changde City, Changde, People’s Republic of China; 3Department of Science and Education, The First People’s Hospital of Changde City, Changde, People’s Republic of China
*These authors contributed equally to this work
Correspondence: Zhiming Deng, Department of Endocrinology, The First People’s Hospital of Changde City, Changde, 415003, People’s Republic of China, Tel +86-13974221766, Email [email protected]
Purpose: The best predictors and cut points for metabolic syndrome (MetS) in Chinese patients with type 2 diabetes (T2DM) were determined by comparing six anthropometric measures: body mass index (BMI), triglyceride-glucose (TyG), the product of TyG and waist-to-hip ratio (TyG-WHpR), the product of TyG and waist-to-height ratio (TyG-WHtR), the product of TyG and waist circumference (TyG-WC), and the product of TyG and body mass index (TyG-BMI).
Patients and Methods: Sixteen hundred and sixty-five adult patients with T2DM were collected, and the ability and cut points of each index to predict MetS were compared by plotting the receiver operating characteristic (ROC) curve and calculating the area under the curve (AUC) values. Then, logistic regression analysis was used to adjust for confounders, including adjustment for menopause in women, to obtain the odds ratio (OR) and 95% confidence interval (CI).
Results: MetS was present in 71.60% of T2DM patients, 75.00% of men, and 67.02% of women. BMI was the best predictor of MetS in men with T2DM (AUC = 0.8646, 95% CI: 0.8379– 0.8912), with a cut point of 24.5500 kg/m2 (specificity: 0.7714; sensitivity: 0.7533), and TyG-WC was the best predictor of MetS in women with T2DM (AUC = 0.8362, 95% CI: 0.8034– 0.8690), with a cut point of 154.1548 (specificity: 0.7455; sensitivity: 0.8076).
Conclusion: The best predictor of MetS in adults with T2DM is BMI with a cut point of 24.5500 kg/m2 for men and TyG-WC with a cut point of 154.1548 for women.
Keywords: metabolic syndrome, anthropometric indexes, type 2 diabetes, insulin resistance
Introduction
Metabolic syndrome (MetS) is a group of co-occurring disorders. These ailments include hypertension, diabetes, and abnormal cholesterol or triglyceride levels. Insulin resistance (IR), which refers to the body’s compensatory overproduction of insulin to cause hyperinsulinemia as a result of insulin’s decreased ability to promote glucose uptake and utilization for a variety of causes, is regarded as a key element in the pathophysiology of MetS.1
The hyperinsulinemic-euglycemic clamp (HEC) is the gold standard for measuring IR.2 Due to the high cost and complexity of this test, it is not routinely used for clinical screening. The alternative methods to HEC, such as the Homeostasis Model Assessment for Insulin Resistance (HOMA-IR), require the measurement of insulin that is not easily accessible and unstable and cannot be applied in areas with poor medical conditions or where large-scale epidemiological screening is required.3,4
From 2015 to 2017, the prevalence of MetS reached 31.1% in the Chinese adult population, and it was much more prevalent in women than in men, with 32.3% and 30.0%, respectively.5 People with T2DM are undoubtedly at an increased risk of developing MetS due to higher glucose levels and insulin resistance. A nationwide survey of more than 70,000 people in 31 Chinese provinces found that the prevalence of diabetes increased from 0.7% in 1980 to 12.8% in 2017, an 18-fold increase in the previous 40 years. Given the steadily rising number of adults in China who are 18 years of age or older who have diabetes, it is all the more crucial for such a large group to look into simpler indicators that can predict the risk of MetS.6
The diagnosis of MetS can be made based on many different aspects. Worldwide, the International Diabetes Federation (IDF) or the updated National Cholesterol Education Program Adult Treatment Panel III (NCEP-ATP III) are currently the primary diagnostic methods used to identify MetS, and the majority of earlier research in China likewise made use of these methods. According to one study using the NCEP-ATPIII, IDF, and JCDCG criteria, the prevalence of MetS in China was 32.3%, 26.4%, and 21.5%, respectively. According to the NCEP-ATPIII definition and the IDF definition, the prevalence of MetS was lower in Chinese men than in Chinese women (29.2% vs 35.4% and 22.2% vs 30.3%, respectively). However, when using the JCDCG diagnostic criteria, the prevalence was higher in men (24.4%) than in women (18.5%), with men having a higher prevalence of the disease.7 Anthropometric indicators have been shown to be highly correlated with IR and T2DM.8 These indices have been demonstrated to be effective substitutes for HEC in predicting the MetS, but no comparisons have been made across indicators in this high-risk population for T2DM, as well as between genders. The best anthropometric indicators for predicting various genders in Chinese patients with T2DM, as well as the cut thresholds for these indicators, were determined by comparing six anthropometric indicators (BMI, TyG, TyG-WHpR, TyG-WHtR, TyG-WC, and TyG-BMI).
Materials and Methods
Participants
This cross-sectional study analyzed the examination data of patients with diabetes mellitus from May 1, 2020, to January 31, 2022, at the Metabolic Management Center (MMC) of the First People’s Hospital in Changde, Hunan Province, China. Exclusion criteria included patients with type 1 diabetes, pregnancy, and major medical conditions such as chronic renal failure, liver failure, severe heart failure, and malignancy, as well as patients with missing data for WC, FPG, PPG, SBP, DBP, TG, and HDL-c. The study’s final population of 1567 adult patients aged 18 to 80 with a diagnosis of T2DM was reduced from the original 1665 patients.
Measurements of Variables
Sociodemographic data such as gender, age, smoking, alcohol consumption, work, glucose-lowering drugs, lipid-lowering drugs, antihypertensive drugs and whether women are menopausal were collected by means of a questionnaire. Alcohol consumption is broken down into current drinkers, previous drinkers, and non-drinkers, while smoking is broken down into current smokers, former smokers, and non-smokers.
For the purpose of measuring laboratory data including fasting plasma glucose (FPG), total cholesterol (TC), triglycerides (TG), high-density lipoprotein cholesterol (HDL-c), low-density lipoprotein cholesterol (LDL-c), C peptide, and glycosylated hemoglobin (HbA1C), blood samples were taken after 12 hours of not eating or drinking.
The anthropometric index includes height, weight, waist circumference (WC), and hip circumference (HC). To measure the height, the person is measured by taking off their shoes and standing on the base of the height meter with the heel, sacrum, and both shoulder blades against the column of the height meter. Thick clothing and shoes were taken off for the weight measurement. By positioning an inelastic tape measure at the halfway point of the line connecting the lower edge of the 12th rib and the higher edge of the iliac crest, one can determine their waist circumference. The hip circumference was measured with the legs together and upright, both arms naturally down, and a non-elastic dipstick placed horizontally on the pubic symphysis and the most convex part of the gluteus maximus behind.9,10 After the participant had sat still for at least five minutes, systolic blood pressure (SBP) and diastolic blood pressure (DBP) were measured twice, and the average was obtained at the conclusion.11
WHpR, WHtR, BMI, TyG, TyG-WHpR, TyG-WHtR, TyG-WC, and TyG-BMI were calculated by using the following formulas:


Definition of MetS
MetS is diagnosed when three or more of the following are present, in accordance with the 2020 version of the Guidelines for the Prevention and Treatment of Type 2 Diabetes Mellitus in China created by the Chinese Medical Association’s Division of Diabetes.12 The following criteria must be met: WC ≥ 90 cm for males and ≥ 85 cm for females; FPG ≥ 6.1 mmol/l or 2h post-sugar load blood glucose ≥ 7.8 mmol/l or diagnosed and treated diabetes mellitus; SBP ≥ 130 mmHg or DBP ≥ 85 mmHg or confirmed hypertension and medication; fasted TG ≥ 1.70 mmol/l; fasted HDL-c < 1.04 mmol/l.
Statistical Analysis
Baseline characteristics of the study participants are presented below. Categorical data were provided in numerical and percentage form, with normally distributed continuous variables expressed as mean standard deviation and non-normally distributed continuous variables expressed as median (quartiles 1–3). The chi-square test, or Fisher’s exact test, was used for categorical variables, the Kruskal–Wallis H-test for normally distributed data, and the ANOVA test for differences across gender factors.
By plotting the receiver operating characteristic (ROC) curve and calculating the area under the curve (AUC) values, this study evaluated the predictive ability of six anthropometric indicators (BMI, TyG, TyG-WHpR, TyG-WHtR, TyG-WC, and TyG-BMI) for MetS by gender. It then determined the best predictors for men and women, as well as their ideal threshold values.
Additionally, we utilized logistic regression models with results expressed as OR and CI to investigate the associations between BMI and MetS in men and all participants, as well as between TyG-WC and MetS in women. Adjusted confounders included age, sex, smoking status (never smoked, ever smoked, or currently smoking), drinking status (never drank or currently drinking), work (yes or no), lipid-lowering drugs (yes or no) and menopause (yes or no). TC less than 6.22 mmol/l was defined as normal; greater than or equal to 6.22 mmol/l was defined as abnormal; LDL-c less than 4.1 mmol/l was defined as normal; greater than or equal to 4.1 mmol/l was defined as abnormal.
The R statistical software packages (http://www.R-project.org, The R Foundation R.4.2.0) and EmpowerStats (http://www.empowerstats.com, X&Y Solutions, Inc., Boston, MA, USA) were used for all statistical analyses. Bilateral P values less than 0.05 were considered statistically significant.
Results
Participants’ Characteristics
This study involved 1567 participants, aged 18 to 80, including 900 males and 667 females (Table 1). 167 of the 667 women were menopausal, while 500 were not. MetS was found in 71.60% of the patients with T2DM, with women having a significantly lower prevalence than men (67.02% vs 75.00%, P < 0.05). Women’s age, SBP, TC, and HDL-c parameters were greater than men’s, whereas women’s BMI, DBP, HbA1c, TG, WHpR, TyG, TyG-BMI, WC, TyG-WHtR, and TyG-WHpR were lower. In addition, women have lower rates of smoking, drinking, and having a job than men. FPG, C peptide, LDL-c, and WHtR showed no statistically significant difference (all P < 0.05).
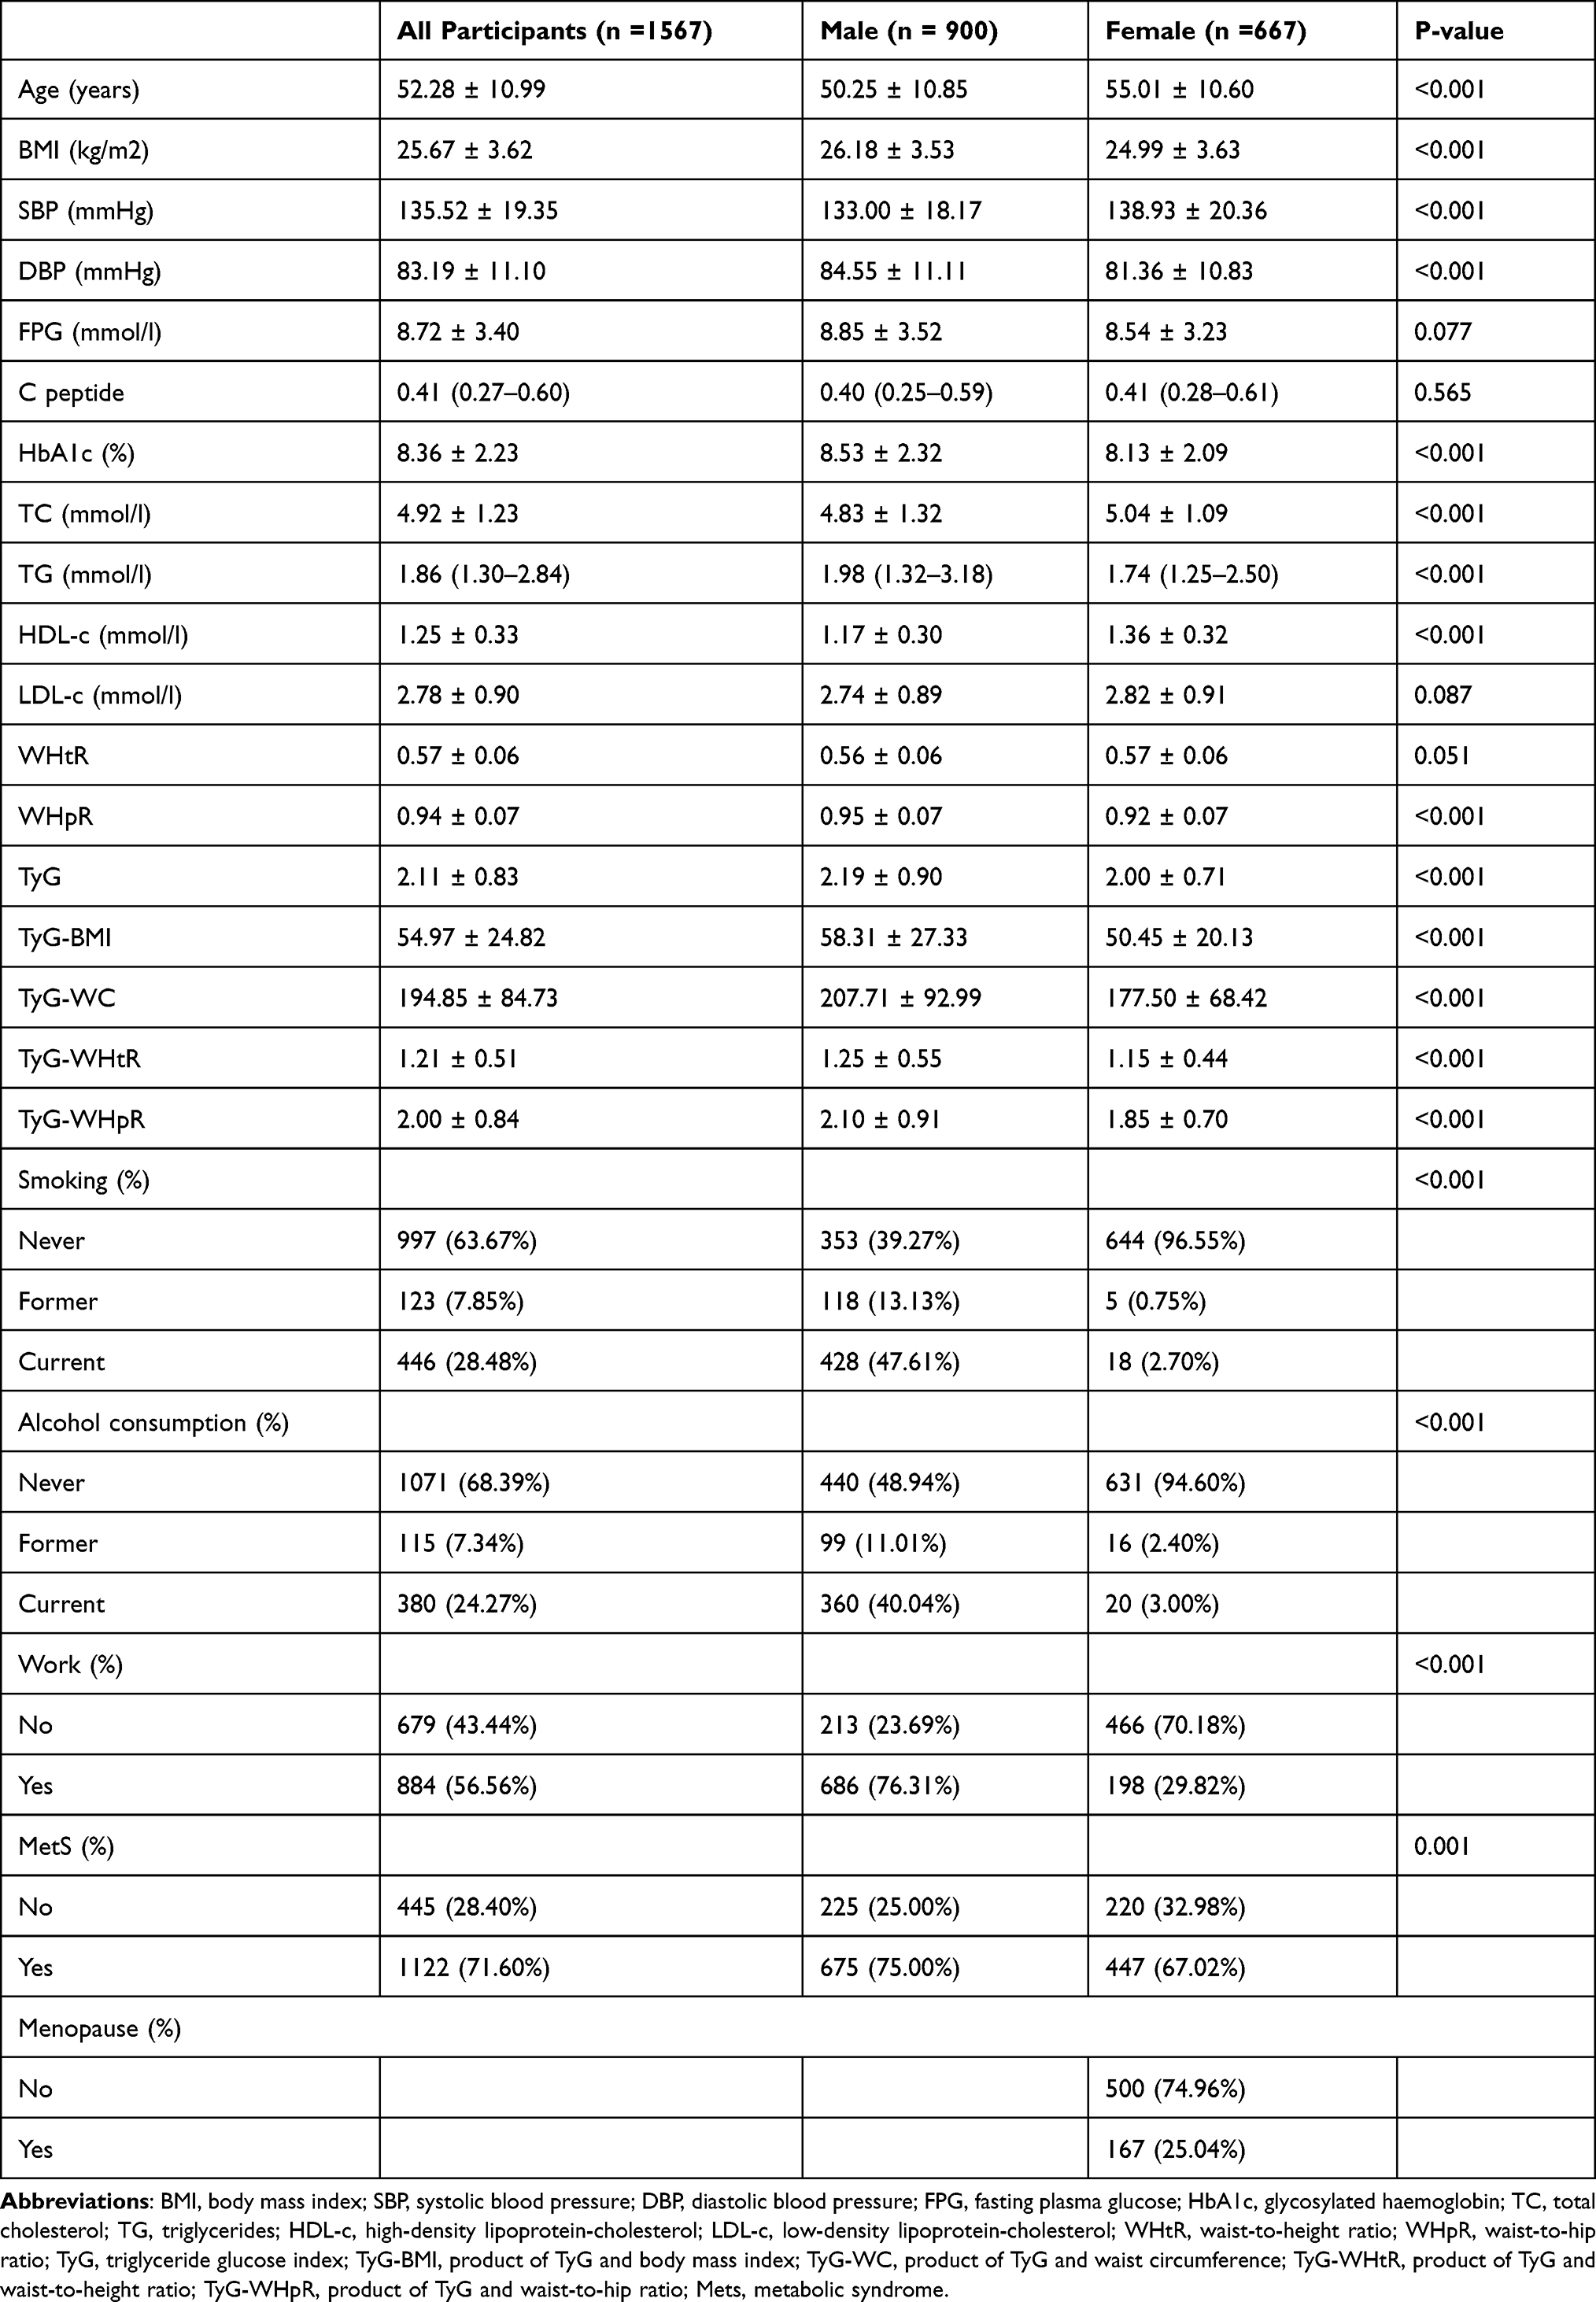 |
Table 1 Baseline Characteristics of the Participants |
Ability of Anthropometric Parameters to Predict MetS
As shown in Figure 1, the ROC curves for BMI, TyG, TyG-WHpR, TyG-WHtR, TyG-WC, and TyG-BMI predict MetS. Table 2 provides the corresponding AUC, 95% CI, appropriate threshold, sensitivity, and specificity values. BMI had the highest AUC (0.8337, 95% CI: 0.8121–0.8552) for predicting MetS across all individuals with a cut point of 24.3500 kg/m2 (specificity: 0.7733; sensitivity: 0.8015). Men likewise had the highest AUC (0.8646, 95% CI: 0.8379–0.8912) of BMI with a cut point of 24.5500 kg/m2 (specificity: 0.7714; sensitivity: 0.7533), whereas women had the highest AUC (0.8362, 95% CI: 0.8034–0.8690) of TyG-WC with a cut point of 154.1548 (specificity: 0.7455; sensitivity: 0.8076).
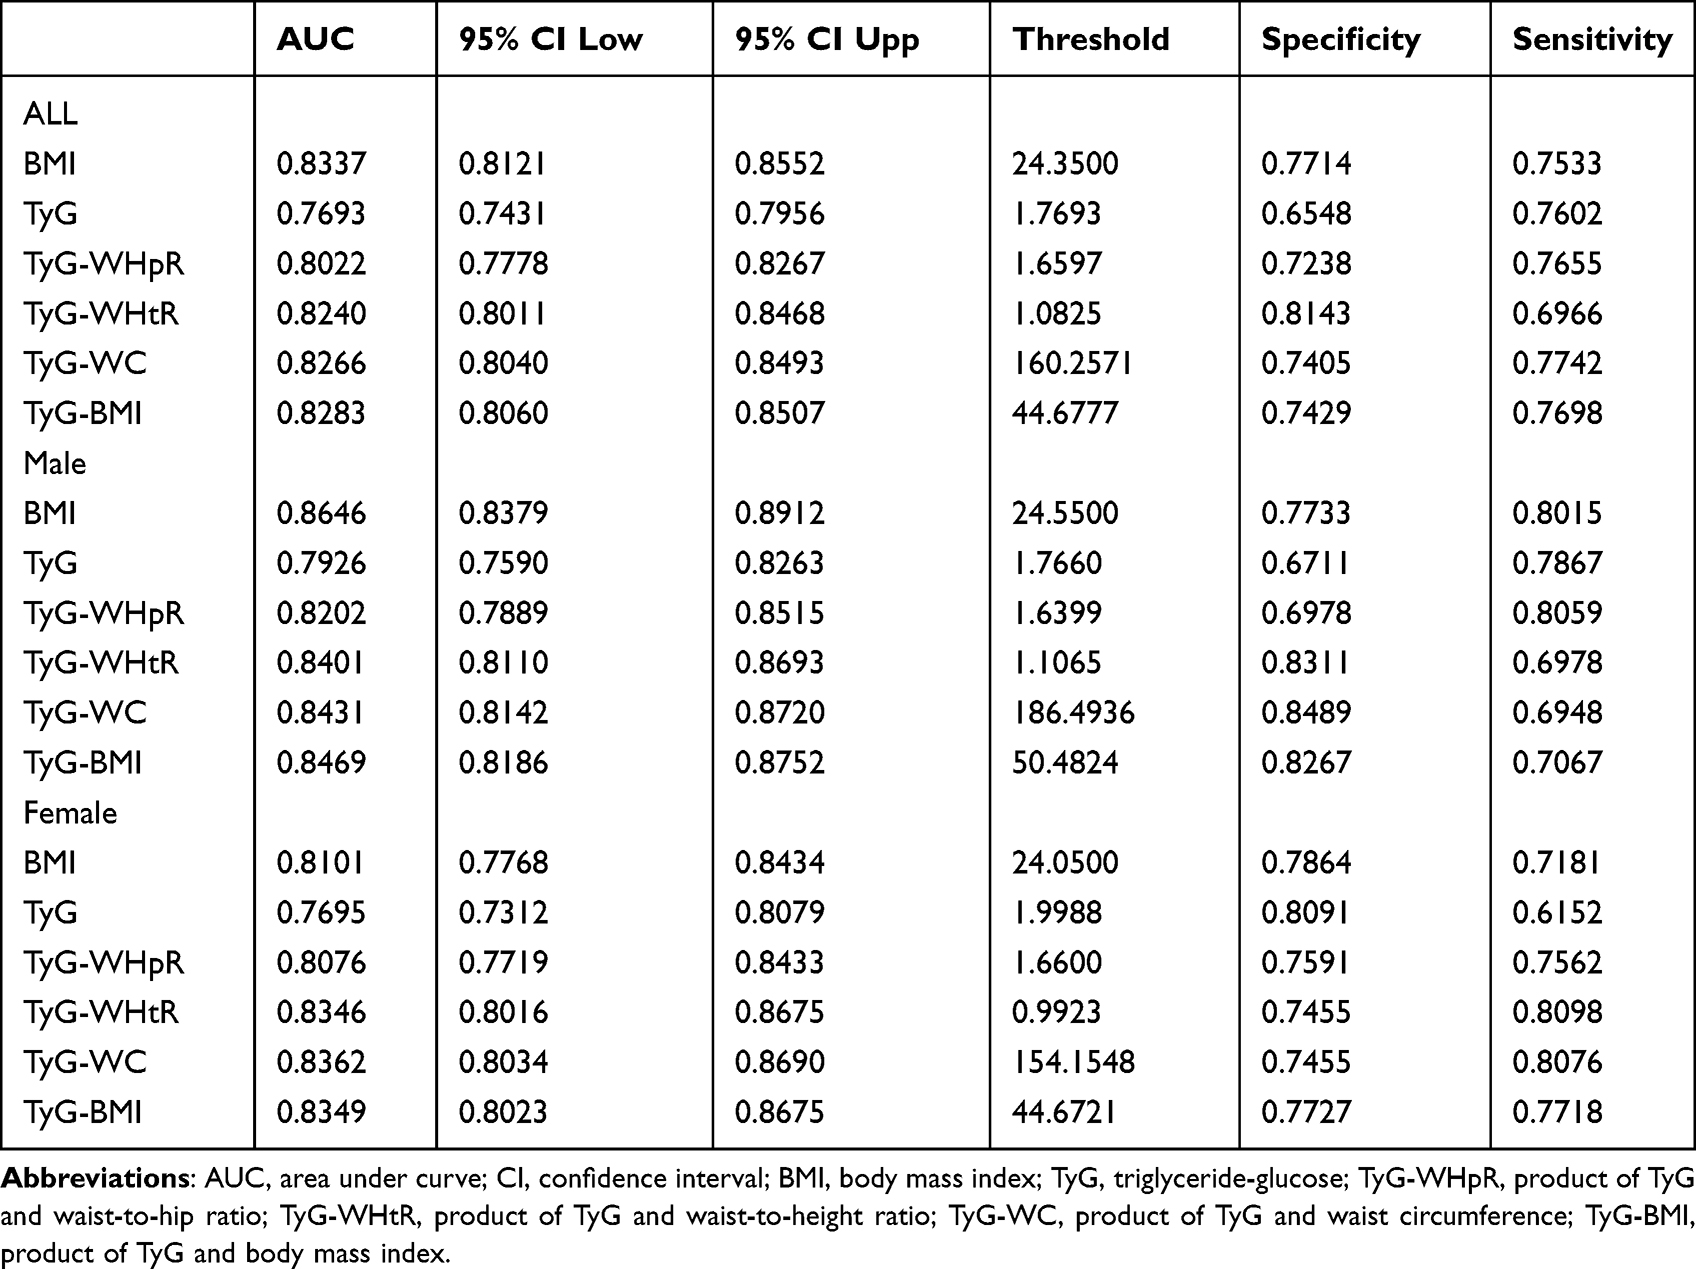 |
Table 2 The Anthropometric Indexes for Predicting Mets |
 |
Figure 1 ROC curves for the parameters for identifying MetS. (A) ROC curve for each parameter for determining MetS in all participants. (B) ROC curve for each parameter for determining MetS in men. (C) ROC curve for each parameter for determining MetS in women. Abbreviations: ROC, receiver operating characteristic; AUC, area under the curve; BMI, body mass index; TyG, triglyceride-glucose; TyG-BMI, product of TyG and body mass index; TyG-WC, product of TyG and waist circumference; TyG-WHtR, product of TyG and waist-to-height ratio; TyG-WHpR, product of TyG and waist-to-hip ratio; MetS, metabolic syndrome. |
Relationship Between MetS and the Ideal Anthropometric Markers for Various Genders
TyG-WC and MetS in women, as well as the association between BMI and MetS in all populations and males, were examined using multivariate regression models (Table 3). BMI in all populations (OR 1.70, 95% CI 1.60–1.81, p < 0.0001) and men (OR 1.87, 95% CI 1.70–2.06, p < 0.0001), TyG-WC (OR 1.03, 95% CI 1.02–1.03, p < 0.0001) in women, and the risk of MetS were positively correlated in the unadjusted model. In a model1 adjusted for age, sex, smoking, alcohol consumption, and work, BMI was positively associated with the risk of MetS in all populations (OR 1.74, 95% CI 1.63–1.85, p < 0.0001), in men (OR 1.88, 95% CI 1.71–2.08, p < 0.0001), and TyG-WC in women (OR 1.03, 95% CI 1.02–1.03, p < 0.0001). After adding adjustments for TC, LDL-c and lipid-lowering drugs to model 1 and taking into account whether or not women were postmenopausal, no significant changes in BMI for all populations (OR 1.74, 95% CI 1.63–1.85, p < 0.0001), for males (OR 1.87, 95% CI 1.70–2.07, p < 0.0001), and in TyG-WC for women (OR 1.03, 95% CI 1.02–1.03, p < 0.0001) at risk of developing MetS were found in model 2.
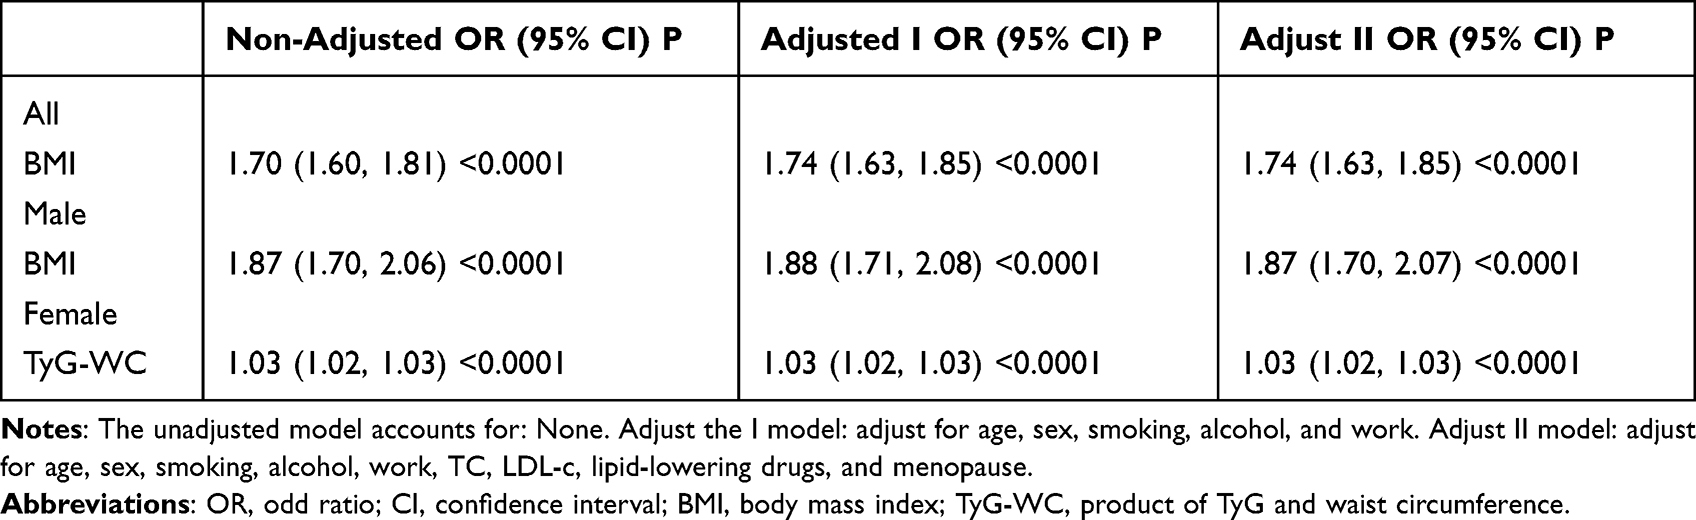 |
Table 3 The Odd Ratios for Metabolic Syndrome |
Predicting the Risk of MetS by BMI and TyG-WC
In all participants and men, a stratified study of the association between BMI and MetS was conducted. A stratified analysis of the association between TyG-WC and MetS in women was carried out (Table 4). In all participants and men, BMI was positively associated with the risk of MetS in all subgroups. Except for the women who had quit smoking, every group of women with the TyG-WC was linked to an increased risk of MetS.
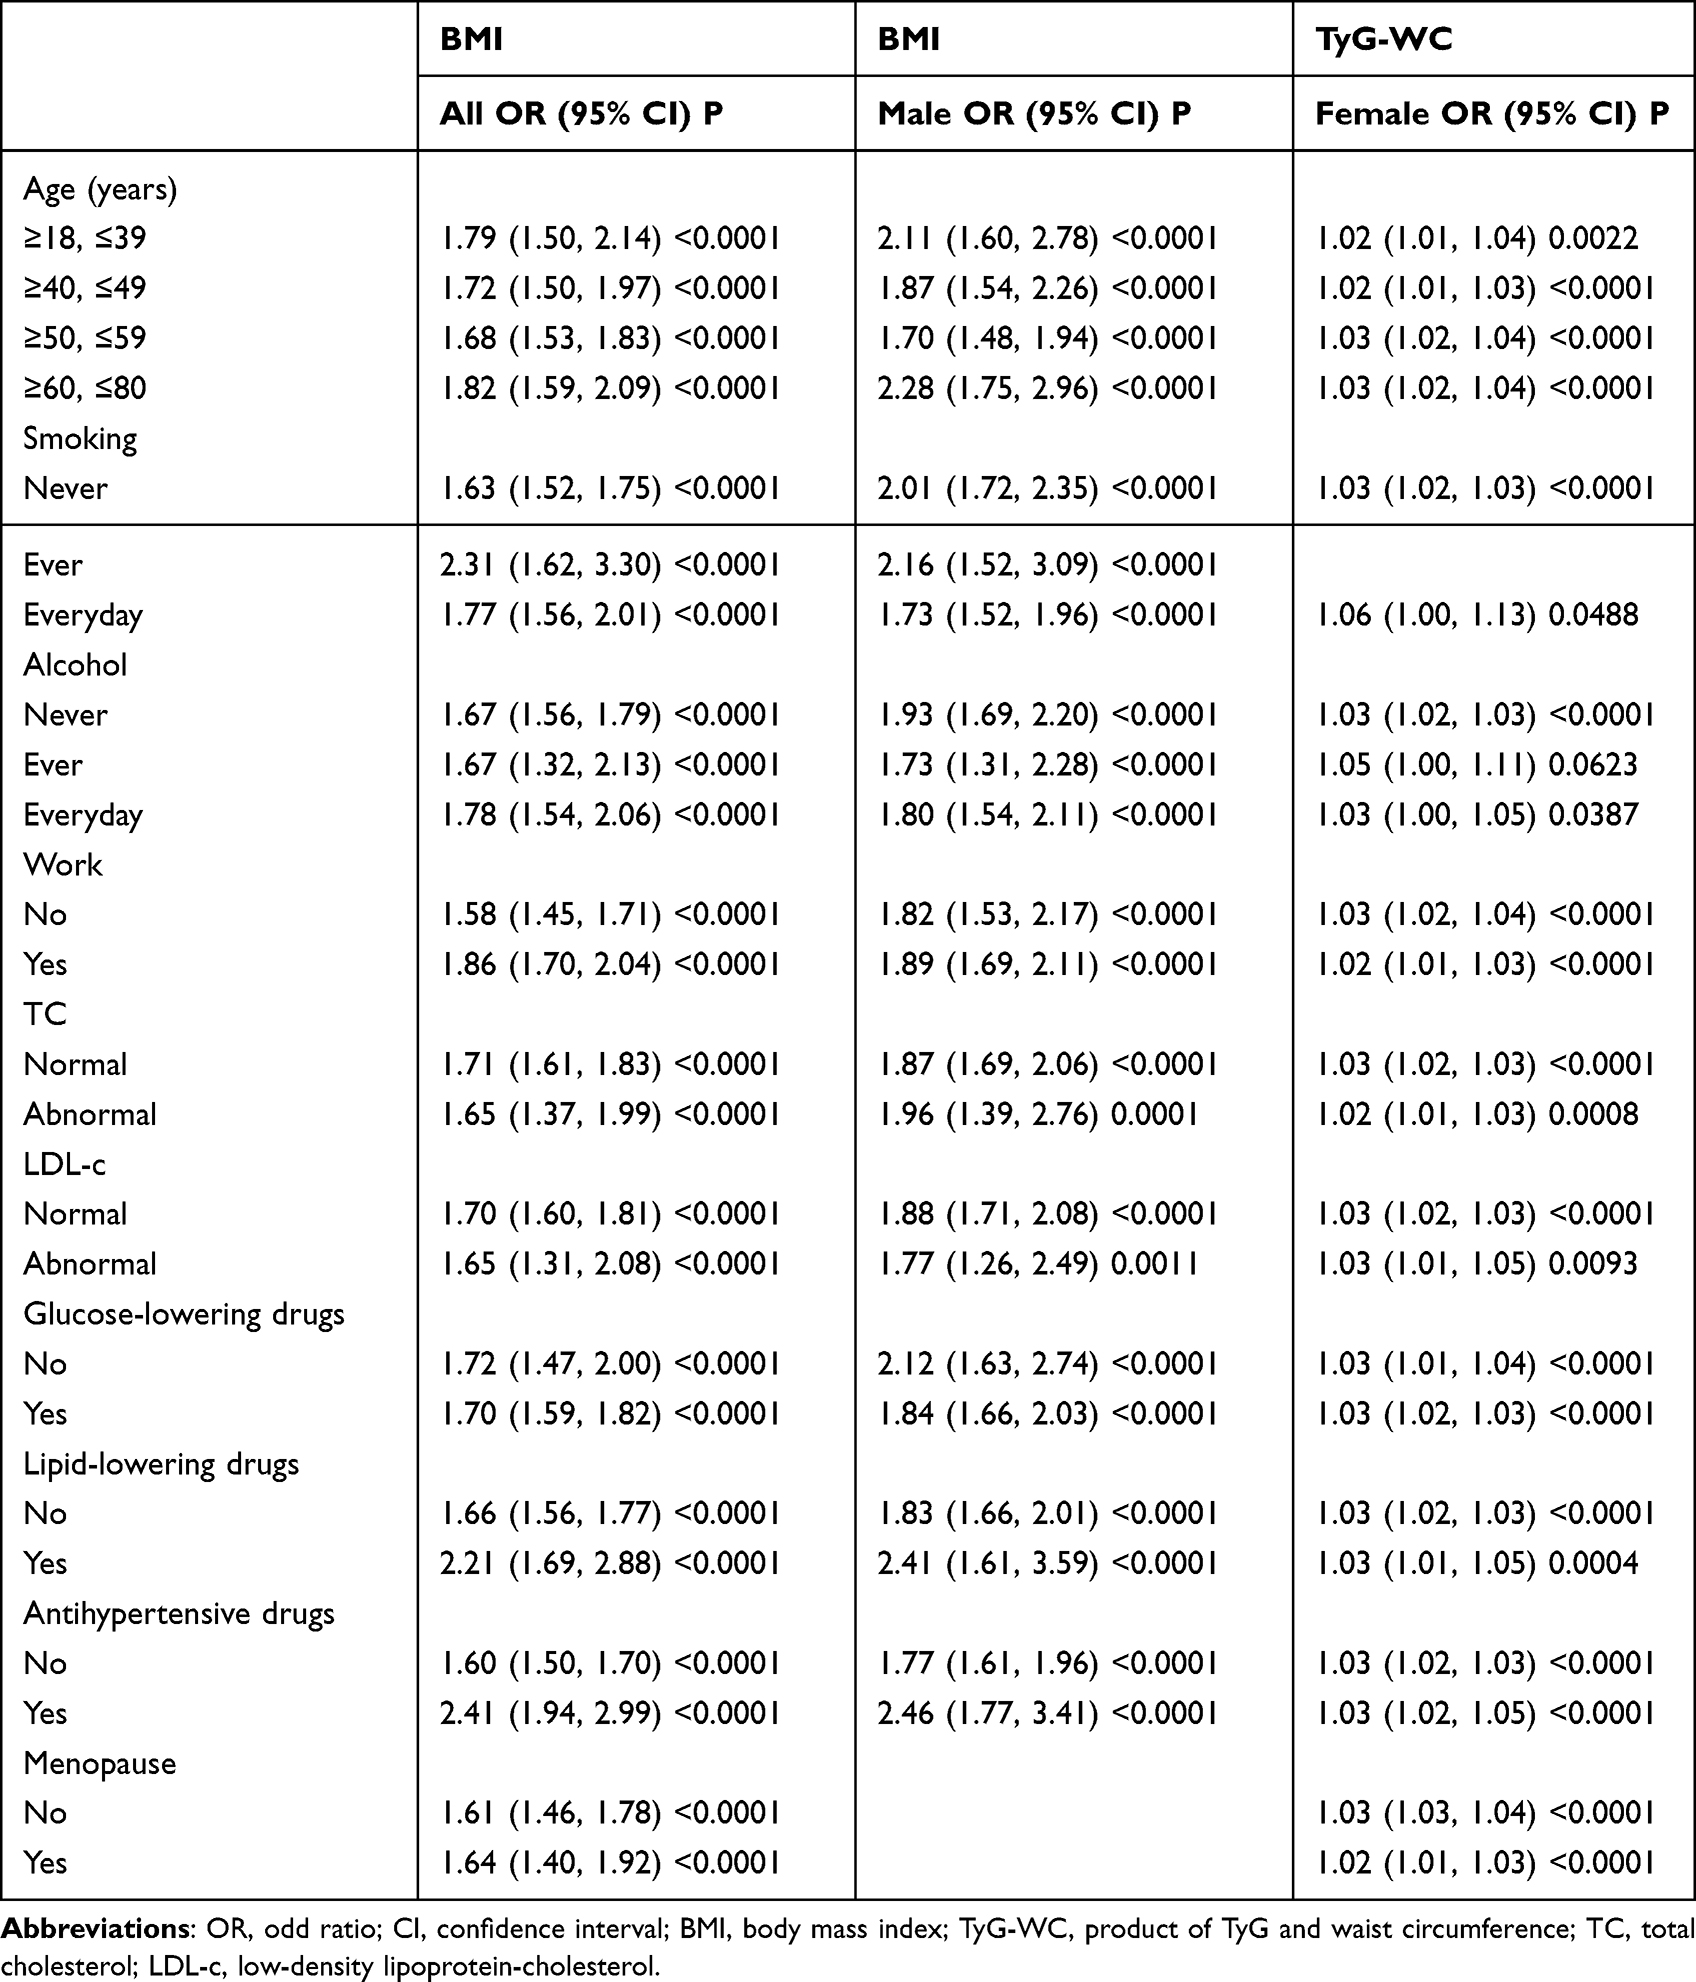 |
Table 4 The Associations Between Anthropometric Parameters and the Risk of MetS |
Discussion
The ROC and AUC of six anthropometric measurements were examined in this cross-sectional study of Chinese adults with T2DM, and the results showed that BMI was the best predictor of MetS in all populations and males, whereas TyG-WC was the best predictor of MetS in women. We conducted separate subgroup analyses of TyG-WC with MetS in women and BMI with MetS in men, and the results showed that the results were reliable because there was no significant difference between the subgroups, and we further assessed their ability to predict MetS, both of which are non-invasive, easily accessible, low-cost, and beneficial for application to routine surveillance, mass epidemiological screening, and areas with poor medical conditions.
Previous studies have been conducted mainly in healthy adult populations, and most studies in the Chinese population have used NCEP-ATPIII or IDF as criteria for the diagnosis of MetS. Because of this, it is easy to exaggerate the risk of MetS in this high-risk population of people with T2DM.6,13,14 Many studies have shown that diabetic patients with MetS are more likely to develop macrovascular complications than those without MetS, and anthropometric indicators can easily and quickly screen for MetS patients with T2DM and identify those at risk for cardiovascular disease (CVD). A study in non-diabetic patients showed that in both men and women, TyG accurately predicted MetS compared to TyG-WHtR, TyG-WC, and TyG-BMI.15 Another study demonstrated that TyG-WC was a better predictor of MetS in non-Hispanic white adults (NHW) and non-Hispanic black adults (NHB), but no gender-based analysis was conducted.16 However, the best indicators of MetS in both men and women were found to be TyG-WHtR and TyG, respectively, in a recent study of Nigerian adults; BMI was not taken into account in the comparison. This differs from the findings we found and may be explained by different population selection, ethnicity specificity, and MetS diagnostic criteria.17–19 Compared to Caucasians or Africans, central obesity with a normal BMI is a prominent trait of Chinese diabetics, and Chinese people are becoming more vulnerable to diabetes.20 In rural Chinese adults of both sexes, a Chinese anthropometric investigation of gender-specific MetS predictors revealed that WC was the preferred predictor; however, the study did not analyze TyG-WC.21
Because BMI is significantly associated with central obesity, BMI cut points are often used to predict the risk of cardiovascular disease and T2DM in the population. In our investigation, we discovered that BMI exhibited superior predictability for the total population, but a gender analysis showed that BMI had a stronger predictive ability in men and a significantly lower predictive ability in women than TyG-WC. This may be related to the different body fat distribution and muscle content between women and men and the fact that Chinese women are more likely than Chinese men to be obese.22,23 Because fat distribution changes in women after menopause, after adjusting the prediction model for menopause, we discovered that TyG-WC was independently related to an elevated chance of developing MetS for women.24 Additionally, it has been demonstrated that patients with T2DM can use TyG-WC to detect prediabetes and assess their risk of developing diabetes.25 Therefore, while predicting MetS in individuals with T2DM, we should select the optimal predictors and cut points based on gender differences.
However, there are certain limitations to our investigation: only Chinese patients with T2DM were included in this investigation, and the applicability to other ethnic groups needs to be further investigated. There could be no causal inferences or connections between the most pertinent human indicators and time in this cross-sectional study. Secondly, recall bias due to cross-sectional studies cannot be excluded.
Conclusion
This study demonstrates that TyG-WC for women and BMI for men are the best indicators of MetS, and by analyzing type 2 diabetic patients of different genders, MetS can be better prevented and recognized.
Institutional Review Board Statement
The study was approved by the Medical Ethics Committee of the First People’s Hospital in Changde, Hunan Province, China (Protocol Code 2022-259-01). Before collecting any data, each participant provided written, informed consent. Every step was carried out in conformity with the Helsinki Declaration.
Acknowledgments
We are grateful to all the participants in this study. We thank the MMC of the First People’s Hospital in Changde, Hunan Province, China. We acknowledge the help of the First People’s Hospital of Changde City for this study.
Funding
This study was supported by the following: The science and technology innovation Program of Hunan Province (2017SK51303); Scientific Research Project of Hunan Provincial Health Commission (D202303068892).
Disclosure
The authors report no conflicts of interest in this work.
References
1. Bovolini A, Garcia J, Andrade MA, Duarte JA. Metabolic syndrome pathophysiology and predisposing factors. Int J Sports Med. 2021;42(03):199–214. doi:10.1055/a-1263-0898
2. Henderson M, Rabasa-Lhoret R, Bastard JP, et al. Measuring insulin sensitivity in youth: how do the different indices compare with the gold-standard method? Diabetes Metab. 2011;37(1):72–78. doi:10.1016/j.diabet.2010.06.008
3. Płaczkowska S, Pawlik-Sobecka L, Kokot I, Piwowar A. Estimation of reference intervals of insulin resistance (HOMA), insulin sensitivity (Matsuda), and insulin secretion sensitivity indices (ISSI-2) in Polish young people. Ann Agric Environ Med. 2020;27(2):248–254. doi:10.26444/aaem/109225
4. Žarković M, Ćirić J, Beleslin B, et al. Variability of HOMA and QUICKI insulin sensitivity indices. Scand J Clin Lab Invest. 2017;77(4):295–297. doi:10.1080/00365513.2017.1306878
5. Yao F, Bo Y, Zhao L, et al. Prevalence and influencing factors of metabolic syndrome among adults in China from 2015 to 2017. Nutrients. 2021;13(12):4475. doi:10.3390/nu13124475
6. Li Y, Teng D, Shi X, et al. Prevalence of diabetes recorded in mainland China using 2018 diagnostic criteria from the American diabetes association: national cross sectional study. BMJ. 2020:m997. doi:10.1136/bmj.m997
7. Huang Y, Zhang L, Wang Z, et al. The prevalence and characteristics of metabolic syndrome according to different definitions in China: a nationwide cross-sectional study, 2012–2015. BMC Public Health. 2022;22(1):1869. doi:10.1186/s12889-022-14263-w
8. Xuan W, Liu D, Zhong J, Luo H, Zhang X. Impacts of triglyceride glucose-waist to height ratio on diabetes incidence: a secondary analysis of a population-based longitudinal data. Front Endocrinol. 2022;13:949831. doi:10.3389/fendo.2022.949831
9. Ma WY, Yang CY, Shih SR, et al. Measurement of waist circumference. Diabetes Care. 2013;36(6):1660–1666. doi:10.2337/dc12-1452
10. Wan H, Wang Y, Xiang Q, et al. Associations between abdominal obesity indices and diabetic complications: Chinese visceral adiposity index and neck circumference. Cardiovasc Diabetol. 2020;19(1):118. doi:10.1186/s12933-020-01095-4
11. Wang Z, Chen Z, Zhang L, et al. Status of hypertension in China: results from the China hypertension survey, 2012–2015. Circulation. 2018;137(22):2344–2356. doi:10.1161/CIRCULATIONAHA.117.032380
12. Zhu D. Chinese guidelines for the prevention and treatment of type 2 diabetes. Chin J Pract Int Med. 2021;41(9):757–784. doi:10.19538/j.nk2021090106
13. Tian T, Zhang J, Zhu Q, Xie W, Wang Y, Dai Y. Predicting value of five anthropometric measures in metabolic syndrome among Jiangsu Province, China. BMC Public Health. 2020;20(1):1317. doi:10.1186/s12889-020-09423-9
14. Wang H, Liu A, Zhao T, et al. Comparison of anthropometric indices for predicting the risk of metabolic syndrome and its components in Chinese adults: a prospective, longitudinal study. BMJ Open. 2017;7(9):e016062. doi:10.1136/bmjopen-2017-016062
15. Mirr M, Skrypnik D, Bogdański P, Owecki M. Newly proposed insulin resistance indexes called TyG-NC and TyG-NHtR show efficacy in diagnosing the metabolic syndrome. J Endocrinol Invest. 2021;44(12):2831–2843. doi:10.1007/s40618-021-01608-2
16. Okosun IS, Okosun B, Lyn R, Airhihenbuwa C. Surrogate indexes of insulin resistance and risk of metabolic syndrome in non-Hispanic white, non-Hispanic black and Mexican American. Diabetes Metab Syndr. 2020;14(1):3–9. doi:10.1016/j.dsx.2019.11.012
17. Raimi TH, Dele-Ojo BF, Dada SA, et al. Triglyceride-glucose index and related parameters predicted metabolic syndrome in Nigerians. Metab Syndr Relat Disord. 2021;19(2):76–82. doi:10.1089/met.2020.0092
18. Zhang J, Zhu W, Qiu L, Huang L, Fang L. Sex- and age-specific optimal anthropometric indices as screening tools for metabolic syndrome in Chinese adults. Int J Endocrinol. 2018;2018:1–16. doi:10.1155/2018/1067603
19. Gurka MJ, Lilly CL, Oliver MN, DeBoer MD. An examination of sex and racial/ethnic differences in the metabolic syndrome among adults: a confirmatory factor analysis and a resulting continuous severity score. Metabolism. 2014;63(2):218–225. doi:10.1016/j.metabol.2013.10.006
20. Wei W, Jiang W, Han T, et al. The future of prevention and treatment of diabetes with nutrition in China. Cell Metab. 2021;33(10):1908–1910. doi:10.1016/j.cmet.2021.09.012
21. Liu L, Liu Y, Sun X, et al. Identification of an obesity index for predicting metabolic syndrome by gender: the rural Chinese cohort study. BMC Endocr Disord. 2018;18(1):54. doi:10.1186/s12902-018-0281-z
22. Wang L, Zhou B, Zhao Z, et al. Body-mass index and obesity in urban and rural China: findings from consecutive nationally representative surveys during 2004–18. Lancet. 2021;398(10294):53–63. doi:10.1016/S0140-6736(21)00798-4
23. Bredella MA. Sex differences in body composition. In: Mauvais-Jarvis F, editor. Sex and Gender Factors Affecting Metabolic Homeostasis, Diabetes and Obesity. Vol. 1043. Springer International Publishing; 2017:9–27. doi:10.1007/978-3-319-70178-3_2
24. Ambikairajah A, Walsh E, Tabatabaei-Jafari H, Cherbuin N. Fat mass changes during menopause: a metaanalysis. Am J Obstet Gynecol. 2019;221(5):393–409.e50. doi:10.1016/j.ajog.2019.04.023
25. Zheng S, Shi S, Ren X, et al. Triglyceride glucose-waist circumference, a novel and effective predictor of diabetes in first-degree relatives of type 2 diabetes patients: cross-sectional and prospective cohort study. J Transl Med. 2016;14(1):260. doi:10.1186/s12967-016-1020-8
 © 2023 The Author(s). This work is published and licensed by Dove Medical Press Limited. The
full terms of this license are available at https://www.dovepress.com/terms
and incorporate the Creative Commons Attribution
- Non Commercial (unported, 3.0) License.
By accessing the work you hereby accept the Terms. Non-commercial uses of the work are permitted
without any further permission from Dove Medical Press Limited, provided the work is properly
attributed. For permission for commercial use of this work, please see paragraphs 4.2 and 5 of our Terms.
© 2023 The Author(s). This work is published and licensed by Dove Medical Press Limited. The
full terms of this license are available at https://www.dovepress.com/terms
and incorporate the Creative Commons Attribution
- Non Commercial (unported, 3.0) License.
By accessing the work you hereby accept the Terms. Non-commercial uses of the work are permitted
without any further permission from Dove Medical Press Limited, provided the work is properly
attributed. For permission for commercial use of this work, please see paragraphs 4.2 and 5 of our Terms.