Back to Journals » Clinical Ophthalmology » Volume 17
Optical Coherence Tomography Angiography (OCTA) Differences in Vessel Perfusion Density and Flux Index of the Optic Nerve and Peri-Papillary Area in Healthy, Glaucoma Suspect and Glaucomatous Eyes
Authors Yospon T, Rojananuangnit K ![]()
Received 10 July 2023
Accepted for publication 5 October 2023
Published 12 October 2023 Volume 2023:17 Pages 3011—3021
DOI https://doi.org/10.2147/OPTH.S429718
Checked for plagiarism Yes
Review by Single anonymous peer review
Peer reviewer comments 4
Editor who approved publication: Dr Scott Fraser
Trailuk Yospon,* Kulawan Rojananuangnit*
Department of Ophthalmology, Mettapracharak (Wat Rai Khing) Hospital, Nakhon Pathom, Thailand
*These authors contributed equally to this work
Correspondence: Kulawan Rojananuangnit, Department of Ophthalmology, Mettapracharak (Wat Rai Khing) Hospital, 52 Moo 2 Rai Khing District Sampran, Nakhon Pathom, 73210, Thailand, Email [email protected]
Purpose: To assess the ability of vascular perfusion parameters determined by optical coherence tomography angiography (OCTA) to detect and monitor glaucoma.
Methods: This prospective study included healthy, glaucoma suspect and glaucomatous eyes. All eyes underwent comprehensive glaucoma examination, including visual field tests and ocular imaging scans by OCTA. Parameters measured included retinal nerve fiber layer (RNFL) thickness, ganglion cell analysis (GCA), vascular perfusion density (VPD) and flux index (FI) of the optic nerve and peri-papillary area. Ocular parameters in healthy, glaucoma suspect, and glaucomatous eyes were compared by generalized estimating equations (GEE) with adjustments for age, with their relationships analyzed by Pearson’s correlation coefficient. Rates of change per year were compared in glaucomatous eyes with and without glaucoma progression.
Results: This study enrolled 238 eyes, including 56 healthy, 79 glaucoma suspect, and 103 glaucomatous eyes. After adjustments for age, the average VPD (45.40 ± 0.19% vs 45.05 ± 0.22% vs 42.89 ± 0.32%, p < 0.001) and FI (0.4210 ± 0.0055 vs 0.4105 ± 0.0039 vs 0.3801 ± 0.0048, p < 0.001) in these three groups differed significantly. Average VPD in the glaucoma group was inversely associated with the severity of glaucoma, being 43.99 ± 0.32%, 42.63 ± 0.43% and 39.27 ± 0.48% in eyes with early, moderate and severe glaucoma, respectively (p < 0.001). Average VPD, as well as VPD in the superior and inferior quadrants correlated well with both OCT determined RNFL and visual field parameters. The decreases per year in both superior (− 0.012 vs − 0.001, p = 0.002) and inferior (− 0.008 vs − 0.003, p = 0.007) FI were significantly greater in glaucomatous eyes with than without glaucoma progression.
Conclusion: Both VPD and FI as measured by OCTA are promising ocular parameters that can distinguish between normal and glaucomatous eyes. VPD is sensitive in comparing eyes at different glaucoma stages, whereas FI can detect rates of glaucoma progression.
Trial Registration: Thai Clinical Trial Registry, TCTR20181031002.
Keywords: optical coherence tomography angiography, vessel perfusion density, flux index, glaucoma, glaucoma suspect, peri-papillary vasculature
Introduction
Glaucoma is a progressive optic neuropathy with an as yet poorly determined overall pathophysiology. The degeneration of retinal ganglion cells and their axons is thought to result in optic nerve damage and visual field loss.1 Glaucoma may also develop due to a vascular insufficiency of the optic nerve. Fluctuation of ocular blood flow and poor ocular perfusion in glaucoma patients were found to correlate with visual field perimetric deterioration and ocular hemodynamic instability, in agreement with ocular perfusion pressure theory.2,3 Hypoxemia and ischemia, which have negative effects on retinal ganglion cells, and axoplasmic obstruction can result in retinal ganglion cell apoptosis, axon loss, and extracellular matrix remodeling, leading to glaucomatous optic neuropathy pathophysiology.4,5 Assessing parameters of vascular non-perfused and perfused areas may support this pathophysiology.
Currently, glaucoma is diagnosed and its progression analyzed by a combination of correlated glaucomatous optic neuropathy and visual field defects. Although visual field testing is crucial in glaucoma evaluation, these tests cannot detect early stages of glaucoma in the absence of functional impairment. Moreover, the subjective repeatability of these tests is limited in the detection of earlier progression. Structural optic neuropathy, such as measurements of peri-papillary retinal nerve fiber layer (RNFL) thickness and ganglion cell complex analysis by optical coherence tomography (OCT), can detect earlier stages of glaucoma than visual field testing. However, these tests have limited ability to detect the earliest stages of glaucoma such as pre-perimetric and glaucoma suspect eyes.6–8
Optical coherence tomography angiography (OCTA) has the ability to measure perfusion at the optic nerve and peri-papillary area.9 OCTA can non-invasively provide reproducible images of the retinal vasculature, allowing the quantitative assessment of the vasculature at the optic nerve head, peri-papillary area, and macular area.10,11 Peri-papillary OCTA perfusion deficiency was found to be associated with both structural and functional glaucomatous damage, whereas the results of macular OCTA are inconclusive.12 Peri-papillary OCTA may be a useful tool in the earliest diagnosis, staging, and monitoring of patients with the earliest stage of glaucoma.13–16 The present study compared OCTA determined vascular perfusion parameters of the optic nerve and peri-papillary area in healthy, glaucoma suspected and glaucomatous eyes and compared the rate of change per year in these parameters in glaucomatous eyes with and without glaucoma progression.
Materials and Methods
This study was part of a prospective study of the natural history of patients treated for glaucoma at Mettapracharak (Wat Rai Khing) Hospital from January 2014 to June 2019. Included in this study were healthy participants, glaucoma suspects and glaucoma patients. The study protocol was approved by the ethical review committee for research in human subjects of Mettapracharak (Wat Rai Khing) Hospital and complied with the Declaration of Helsinki, with all study participants providing written informed consent. The study was registered at the Thai Clinical Trial Registry (No. TCTR20181031002).
All participants underwent comprehensive ocular examinations, including measurements of best-corrected visual acuity by Snellen visual acuity chart, slit-lamp bio-microscopy, measurements of intraocular pressure (IOP) by Goldmann applanation tonometry, anterior chamber angle assessment by gonioscopy, dilated fundus examinations, stereoscopic optic disc photography, pachymetry measurements of corneal thickness, measurements of axial length and perimetry by Humphrey 24–2, SITA standard visual field tests. Glaucoma in each eye was staged as early, moderate or severe using the Hodapp, Parish and Anderson (H-P-A) glaucoma classification system.17 All participants underwent optical coherence tomography (OCT) scanning of the optic nerve head to measure RNFL, macular ganglion cell analysis (GCA) and Angioplex angiography of the peri-papillary area with Cirrus 5000 HC OCT.
Healthy eyes were defined as having an IOP ≤ 21 mmHg with no history of elevated IOP, normal-appearing optic discs, intact neuroretinal rim and nerve fiber layers, and normal visual field test results. Glaucoma suspected eyes were defined as having ocular hypertension (IOP ≥ 22 mmHg) and optic discs appearing suspicious of glaucoma, but with no evidence of repeatable glaucomatous visual field defects. Glaucomatous eyes were defined as having glaucomatous optic neuropathy that correlated with glaucomatous visual field defects, with the severity of glaucoma classified by Hodapp-Parrish-Anderson stage.17,18 Eyes with both primary open angle and closed angle glaucoma were included. Eyes with best-corrected Snellen visual acuity lower than 20/70, a history of trauma, a history of intraocular surgery (except for glaucoma surgery or uncomplicated cataract surgery), a secondary cause of glaucoma, or other types of optic neuropathy, retinopathy, or other ocular or systemic diseases known to impair the visual field were excluded. Blood pressure (BP) was measured with the subject in a resting, seated position. Mean arterial pressure (MAP) was calculated as diastolic BP (DBP) + 1/3 pulse BP, and pulse BP was calculated as systolic BP (SBP) − DBP.
Optical Coherence Tomography Angiography (OCTA)
OCTA is a noninvasive method of visualizing the optic nerve head and peri-papillary retinal vasculature by determining the dynamic motion of red blood cells in a flowing blood vessel.19 For quantitative analysis, each participant underwent ocular imaging scan using the Angioplex OCT Angiography CIRRUSTM HD-OCT (Model 5000, Carl Zeiss Meditec, Inc., Dublin, USA) with a 4.5 × 4.5 mm scanning pattern centered on the optic disc. Images were captured with 350 A-scan/B-Scan and 350 B-Scans,20 with each ring-shaped pattern image divided into four quadrants (superior, nasal, inferior, and temporal). Peri-papillary capillary slab images were generated from three-dimensional OCTA scans to determine the vascular perfusion density (VPD) and flux index (FI). VPD was defined as the total area of perfused vasculature per unit area, and FI was defined as the intensity of capillary perfusion (Figure 1).
 |
Figure 1 The optic nerve and peri-papillary area; (A) OCTA and segmentation into superior inferior nasal and temporal quadrants, (B) disc photography, (C) peri-papillary OCT retinal nerve fiber layer thickness. |
Analysis of Glaucoma Progression
Glaucoma progression was determined by perimetry, evaluation of the optic disc, ocular imaging and clinical evaluation. Perimetric criteria were assessed clinically by a combination of subjective determination by a glaucoma specialist and objective determination using Guided Progression Analysis (GPA) software. Ocular imaging progression criteria included RNFL thinning, as determined by OCT imaging of the optic nerve, and thinning of the ganglion cell complex by OCT ganglion cell analysis (GCA). Optic disc progression was based on rim thinning, focal notching, excavation, RNFL defect and disc hemorrhage as determined by a glaucoma specialist. Patients were followed-up at 4–6-month intervals.
Statistical Analysis
Continuous variables were reported as the mean and standard deviation (SD) and compared in the three groups (healthy, glaucoma suspected, and glaucomatous eyes) by one-way analysis of variance (ANOVA), followed by post-hoc Bonferroni tests. Categorical variables were reported as frequency and percentage and compared by chi-square tests. Correlations between fellow eyes in individuals of the same persons were assessed by the generalized estimating equation (GEE) method. VPD and FI in the three groups were compared using the GEE after adjustments for age. The pairwise relationships of VPD, FI, RNFL, and HVF 24–2 were determined using Pearson’s correlation coefficient analyses. GEEs were used to estimate the rates of change in each parameter and to account for repeated measurements over time with eyes nested within the same person. All statistical analyses were performed using PASW Statistics (SPSS) 28.0 software (SPSS Inc., Chicago, IL, USA), with p-values <0.05 considered statistically significant.
Results
The study population consisted of 238 eyes, 56 healthy eyes of 33 subjects (mean age, 55.58 ± 15.9 years), 79 glaucoma suspected eyes of 52 subjects (mean age, 61.2 ± 9.24 years), and 103 glaucomatous eyes of 64 subjects (mean age, 64.78 ± 7.22 years), including 56 eyes with early stage, 27 eyes with moderate stage and 20 eyes with severe stage, with the healthy participants being significantly younger in age than the other two groups (p-value < 0.05). Because age-related changes in VPD and FI could confound comparisons, the data were adjusted for age. SBP, DBP, MAP, and underlying diseases were similar in the three groups, whereas central corneal thickness was lowest in the glaucoma group (Table 1).
 |
Table 1 Demographic and Clinical Characteristics of Subjects in the Healthy, Glaucoma Suspected and Glaucomatous Groups |
Average VPD and VPDs in all quadrants were lowest in glaucomatous eyes. Although VPDs were generally similar in glaucoma suspected and healthy eyes, VPD in the temporal quadrant was significantly higher in normal than in glaucoma suspected eyes. Evaluation of VPDs by glaucoma stage in glaucomatous eyes showed that average VPD and VPDs in both the inferior and superior quadrants were significantly lower in eyes with severe glaucoma than in those with early and moderate glaucoma. Similarly, FI was significantly lower in glaucomatous eyes than in glaucoma suspected and healthy eyes and was significantly lower in eyes with severe glaucoma than in those with early and moderate glaucoma (Figures 2 and 3). RNFL thickness, GCA and visual field parameters were significantly lower in the glaucomatous group than in the other two groups, but these parameters did not differ significantly in glaucoma suspected and healthy eyes (Table 2).
 |
Table 2 Ocular Parameters in Healthy, Glaucoma Suspected and Glaucomatous Groups and in Glaucomatous Eyes Differing by Severity (Adjusted for Age) |
 |
Figure 2 OCTA results in healthy (A), glaucoma suspected (B), and glaucomatous eyes (C). |
 |
Figure 3 OCTA results in early (A), moderate (B), and severe glaucomatous eyes (C). |
The correlations among structural, functional and vascular perfusion parameters are shown in Table 3. Average VPD and RNFL were strongly correlated, as were VPD and RNFL in the superior and inferior quadrants. In contrast, average FI and RNFL, as well as FI and RNFL in the superior and inferior quadrants, showed moderate correlations. VPD was unrelated to GCA, whereas FI and OCT GCA showed fair correlation. Visual field parameters showed moderate to good correlations with both VPD and FI (Table 3).
 |
Table 3 Correlations Among Vessel Perfusion Density, Flux Index, Optical Coherence Tomography Retinal Nerve Fiber Layer Thickness (OCT RNFL), Optical Coherence Tomography Ganglion Cell Complex (OCT GCC) and Humphrey Visual Field Test 24–2 (HVF 24–2) |
The rates of change per year in VPD and FI were compared in glaucomatous eyes with and without glaucoma progression. The yearly decrease in mean VPD was significantly greater in eyes with (−0.555%; 95% CI −1.406% to −0.298%; p = 0.027) than without (0.305%; 95% CI −0.485 to 0.126, p = 0.051) glaucoma progression. The yearly rate of change in VPD in the superior quadrant was significantly greater in eyes with glaucoma progression (−1.198%; 95% CI −1.436 to −0.959, p < 0.001), whereas the rate of change in the inferior quadrant was significantly greater in eyes without glaucoma progression (−1.199%; 95% CI −1.817 to −0.581, p < 0.001).
The rates of change per year in FI in both the superior (−0.012, 95% CI −0.020 to −0.005 vs −0.001, 95% CI −0.007 to 0.007, p = 0.002) and inferior quadrants were significantly greater in eyes with than without glaucoma progression. These findings indicate that decreases in RNFL and GCA on OCT, as well as visual field parameters, correlated significantly with glaucoma progression (Table 4).
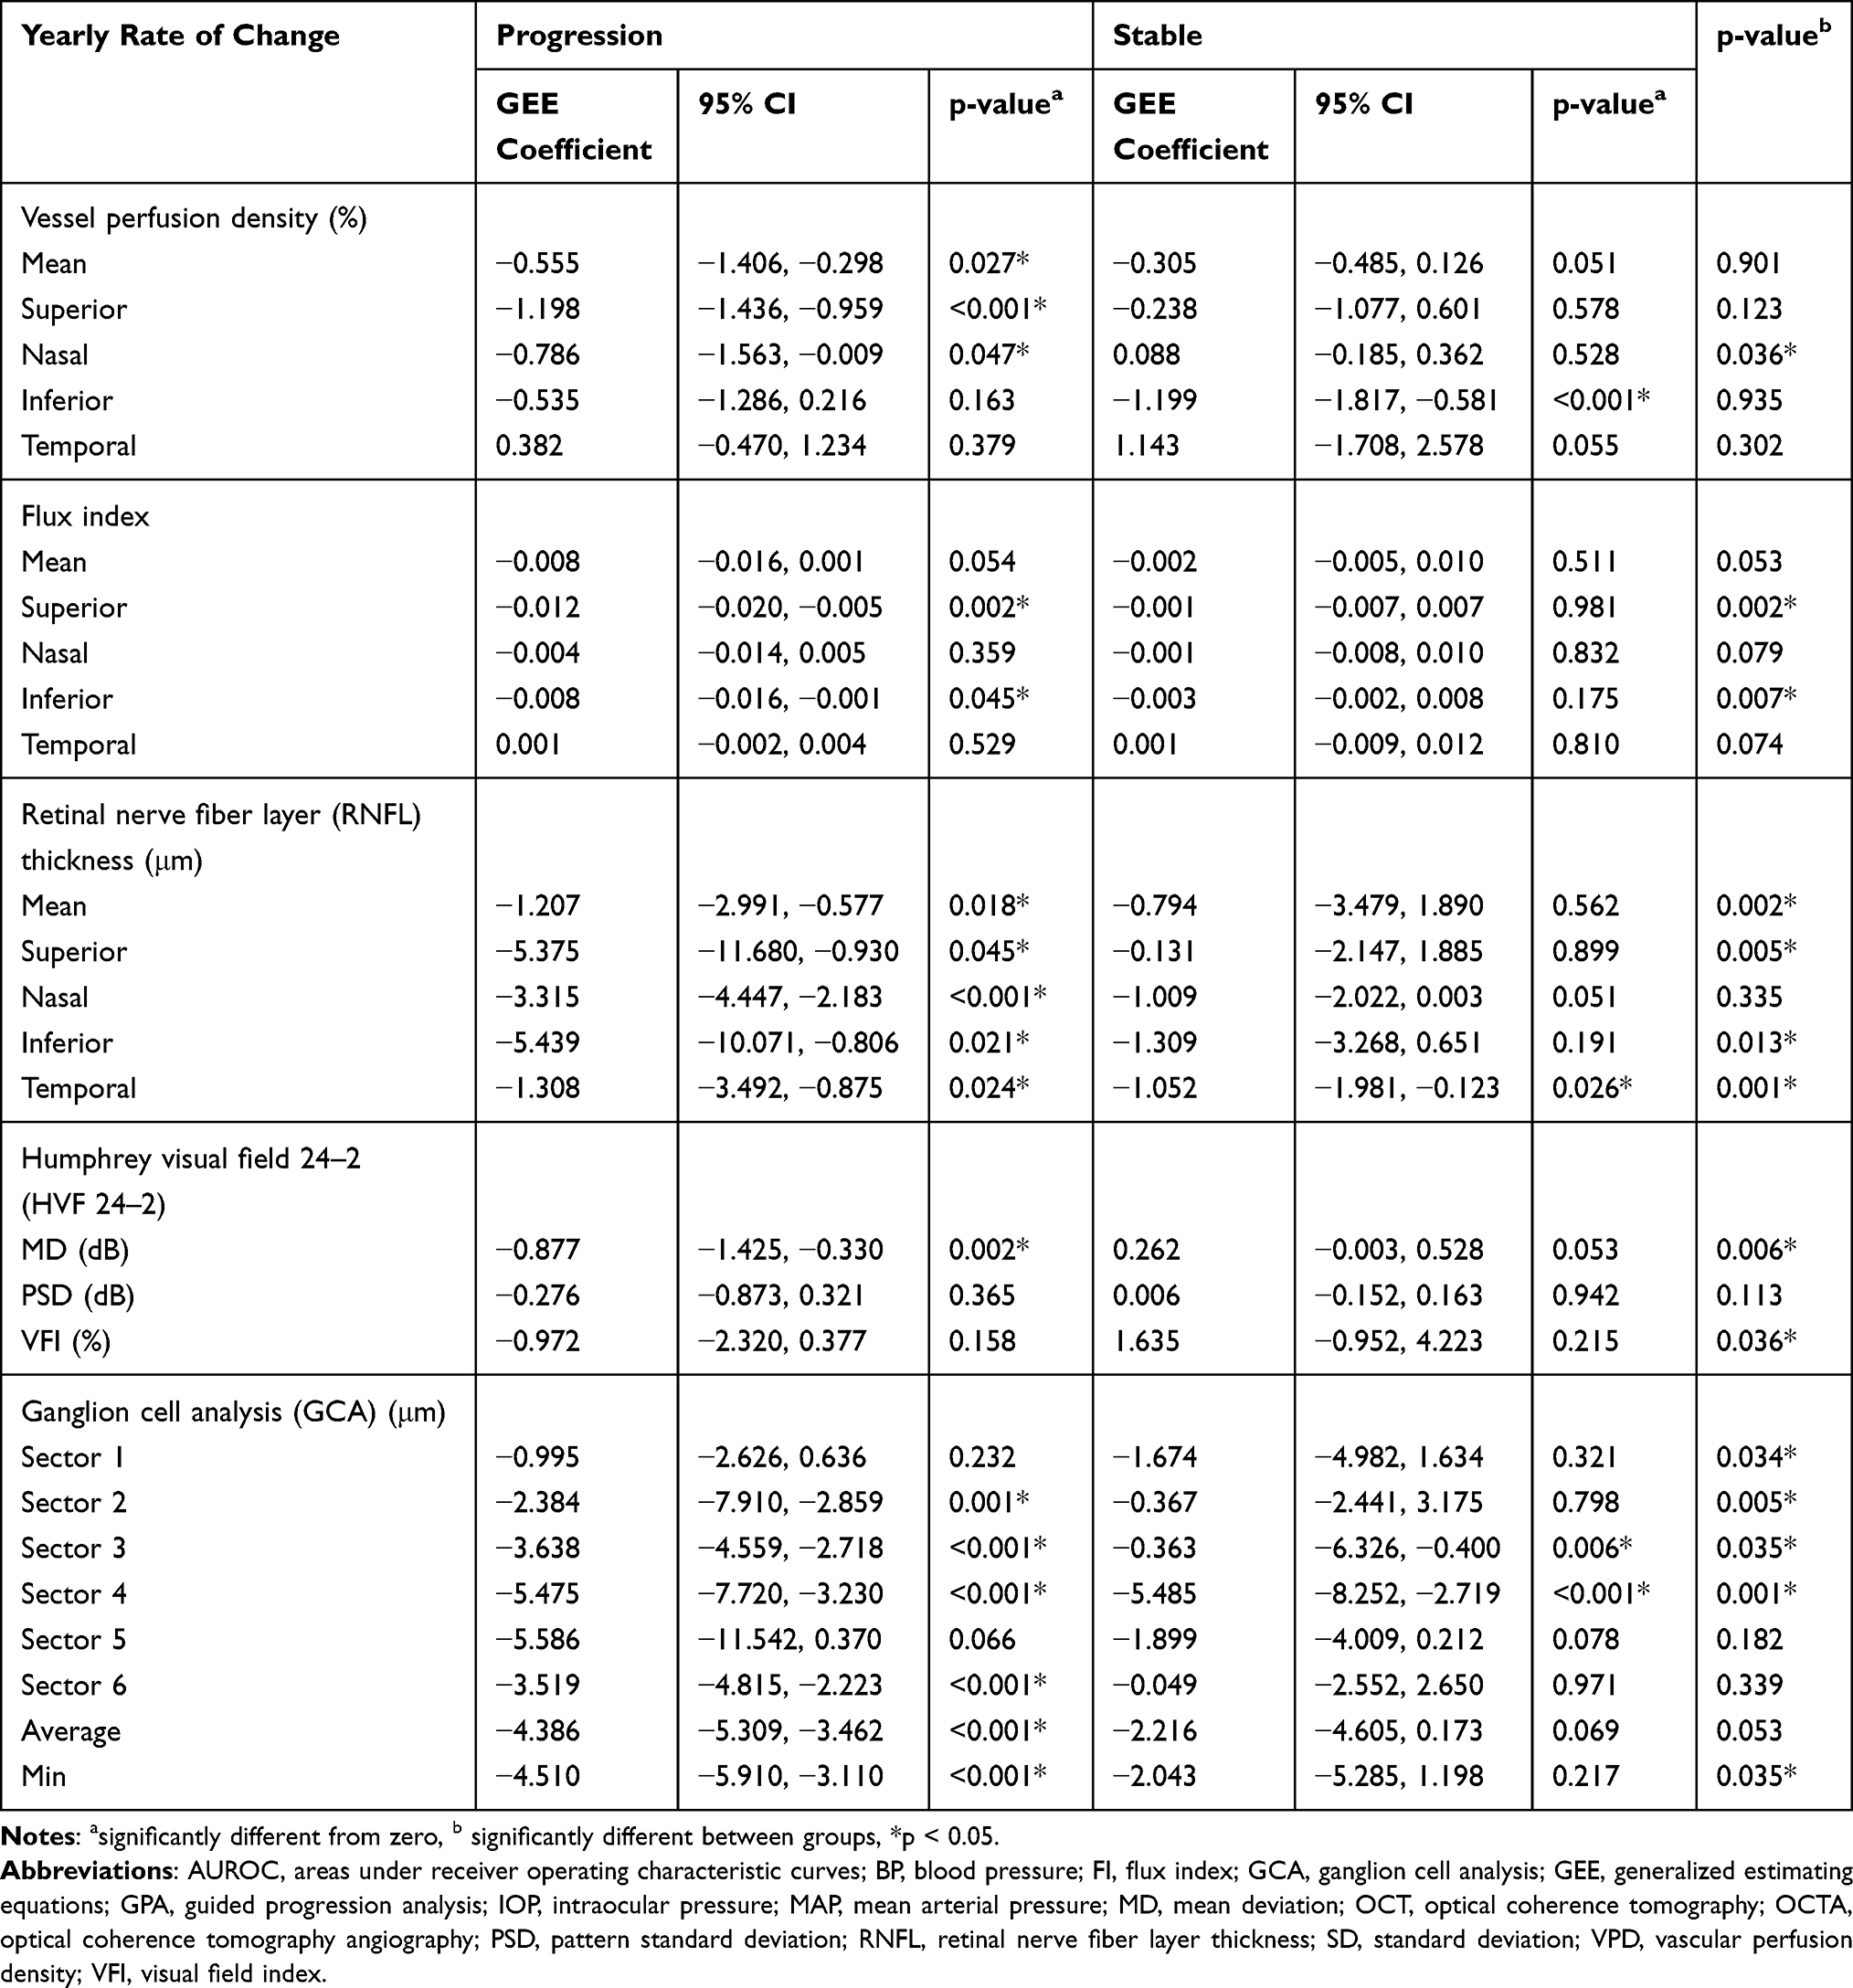 |
Table 4 Rates of Change per Year in Vessel Perfusion Density, Flux Index, Retinal Nerve Fiber Layer Thickness, Ganglion Cell Complex and Humphrey Visual Field 24–2 in Glaucomatous Eyes with and without Progression |
Discussion
Vascular insufficiency affecting the optic nerve has been associated with the pathophysiology of glaucomatous optic neuropathy.21 Deficiencies in ocular blood flow have been shown to correlate with both structural damage and visual field defects.4,22 OCTA visualization and quantification of ocular blood flow in certain areas may clarify the vascular pathogenesis of glaucoma more clearly.4,6 The present study showed that both VPD and FI on OCTA scans were significantly lower in glaucomatous eyes than in glaucoma suspected and healthy eyes, findings similar to those of previous studies.23,24 Neither VPD nor FI, however, differed significantly in healthy and glaucoma suspected eyes. These findings suggest that vascular compromise may not be the earliest sign of glaucomatous optic neuropathy, similar to results showing that microvascular insufficiency was secondary to RNFL loss in pre-perimetric glaucomatous eyes.25,26 In contrast, OCT measurements of circumpapillary vessel density and RNFL thickness were found to moderately distinguish healthy and glaucoma suspected eyes, with areas under receiver operating characteristic curves (AUROC) of 0.7 and 0.65, respectively.27 Differences in vessel perfusion have also been reported between eyes of individuals with suspected glaucoma, suggesting that vascular impairment was either the cause or the result of glaucoma.28 Comparison of the sensitivities of vascular perfusion parameters and visual field testing in detecting glaucoma progression showed that perfusion deficiencies were detected earlier than visual field defects during the pre-perimetric and early stages of glaucoma.11,29,30 The results of the present study, showing that lower perfusion was associated with greater glaucoma severity, were similar to previous findings.31–33
Evaluation of correlations among vascular perfusion, structural and visual field testing parameters showed that VPD and FI correlated well with OCT-determined mean peri-papillary RNFL thickness, as well as RNFL thickness and in the superior and inferior quadrants, in agreement with previous results.34 These results were not unexpected because peri-papillary RNFL thickness and vascular parameters were measured in similar areas. In contrast, the relationship between vascular parameters and OCT-determined macular GCA was only fair, as these parameters were measured in different anatomical areas. Visual field parameters (MD and VFI) and vascular parameters (VPD and FI) showed fair to good correlations, similar to results reporting that lower superficial vessel density was significantly associated with visual field deterioration in eyes with primary angle closure and normal tension glaucoma.35,36
Measurements of the rates of change per year in structural and functional parameters, such as OCT measured GCA and RNFL thickness and visual field testing results, showed that reductions were significantly greater in eyes with progress than non-progressed glaucoma. In contrast, measurements of vascular parameters showed that FI was significantly lower in only the superior and inferior quadrants of patients with progressed than non-progressed glaucoma. This finding suggested that VPD is less rapidly detected in VPD patients with progressive glaucoma.11,37,38
The present study had several limitations. First, the group of healthy subjects was significantly younger than the groups of glaucoma suspects and glaucomatous patients. For this reason, all analyses were adjusted for age. Second, the group of glaucomatous patients consisted of individuals with all types of glaucoma, including normal tension, high tension and closed-angle glaucoma, with glaucoma classified by severity, not by type. Glaucoma types were combined due to the small sample size, suggesting the need to separately analyze individual groups of patients. In addition, systemic underlying diseases, such as essential hypertension, may have confounded or interfered with the interpretation of vascular perfusion results. Lower vascular perfusion has been reported in the superficial capillary plexus, as shown by macular OCTA,39 and lower superficial peri-papillary VD and perfusion density have been reported in patients with essential hypertension for more than 10 years.40 Further studies are needed to address the effects of ocular hypotensive treatment and systemic medications on the results of OCTA.
Conclusion
OCTA determination of vascular perfusion parameters, such as VPD and FI, may be a tool for differentiating among healthy, glaucoma suspected and glaucomatous eyes, with lower VPD and lower FI being associated with more severe disease. The ability of FI in the superior and inferior quadrants to detect glaucoma progression was comparable to the ability of structural parameters, such as OCT determined RNFL thickness and GCA, and lower superficial peri-papillary vessel density (VD) and perfusion density have been reported in patients with essential hypertension for more than 10 years.40 Further studies are needed to address the effects of ocular hypotensive treatment and systemic medications on the results of OCTA.
Conclusion
OCTA determination of vascular perfusion parameters, such as VPD and FI, may be a tool for differentiating among healthy, glaucoma suspected and glaucomatous eyes, with lower VPD and lower FI being associated with more severe disease. The ability of FI in the superior and inferior quadrants to detect glaucoma progression was comparable to the ability of structural parameters, such as OCT determined RNFL thickness and GCA.
Abbreviations
ANOVA, Analysis of variance; AUROC, Areas under receiver operating characteristic curves; BP, blood pressure; FI, Flux index; GCA, Ganglion cell analysis; GEE, Generalized estimating equation; GPA, Guided Progression Analysis; MAP, Mean arterial pressure; MD, Mean deviate; OCT, Optical coherence tomography; OCTA, Optical coherence tomography angiography; RNFL, Retinal nerve fiber layer; SD, Standard deviation; VFI, Visual field index; VPD, Vascular perfusion density.
Data Sharing Statement
The datasets used and/or analyzed during the current study are available from the corresponding author on reasonable request.
Ethics Approval and Consent to Participate
Ethical review committee for research in human subjects, Mettapracharak (Wat Rai Khing) Hospital. Written informed consent was obtained from all participants.
Acknowledgments
The authors thank the patients included in this study, as well as the residents, glaucoma fellows, research assistants and ophthalmic technicians in the department of Ophthalmology, Mettapracharak (Wat Rai Khing) Hospital. The authors also thank Miss Wanwisa Sathim, Miss Raphephan Nakuamka and Mr. Wasin Sukphopetch.
Author Contributions
All authors made a significant contribution to the work reported, including whether that is in the conception, study design, execution, acquisition of data, and/or data analysis and interpretation, or in all these areas. The authors also took part in drafting, revising and/or critically reviewing the article; provided final approval of the version to be published; have agreed on the journal to which the article has been submitted; and agreed to be accountable for all aspects of the work.
Funding
This work was supported by the Mettapracharak (Wat Rai Khing) Hospital.
Disclosure
The authors declare that they have no competing interests.
References
1. Weinreb RN, Aung T, Medeiros FA. The pathophysiology and treatment of glaucoma: a review. JAMA.JAMA. 2014;311(18):1901-–1911. doi:10.1001/jama.2014.3192
2. Flammer J, Orgül S, Costa VP, et al. The impact of ocular blood flow in glaucoma. Prog Retin Eye Res. 2002;21(4):359-–393. doi:10.1016/s1350-9462(02)00008-3
3. Deokule S, Vizzeri G, Boehm A, Bowd C, Weinreb RN. Association of visual field severity and parapapillary retinal blood flow in open-angle glaucoma. J Glaucoma. 2010;19(5):293-–298. doi:10.1097/IJG.0b013e3181b6e5b9
4. Flammer J. The vascular concept of glaucoma. Surv Ophthalmol. 1994;38:S3-–S6. doi:10.1016/0039-6257(94)90041-8
5. Kornzweig AL, Eliasoph I, Feldstein M. Selective atrophy of the radial peripapillary capillaries in chronic glaucoma. Arch Ophthalmol. 1968;80(6):696-–702. doi:10.1001/archopht.1968.00980050698002
6. El Beltagi TA, Bowd C, Boden C, et al. Retinal nerve fiber layer thickness measured with optical coherence tomography is related to visual function in glaucomatous eyes. Ophthalmology. 2003;110(11):2185-–2191. doi:10.1016/s0161-6420(03)00860-1
7. Kuang TM, Zhang C, Zangwill LM, Weinreb RN, Medeiros FA. Estimating lead time gained by optical coherence tomography optical coherence tomography in detecting glaucoma before development of visual field defects. Ophthalmology. 2015;122(10):2002-9.–2009. doi:10.1016/j.ophtha.2015.06.015
8. Chang RT, Singh K. Glaucoma suspect: diagnosis suspect: diagnosis and management. J Ophthalmol. 2016;5(1):32–37. doi:10.1097/APO.0000000000000173
9. Rao HL, Pradhan ZS, Suh MH, Moghimi S, Mansouri K, Weinreb RN. Optical coherence tomography angiography in glaucoma. J Glaucoma. 2020;29(4):312. doi:10.1097/IJG.0000000000001463
10. Venugopal JP, Rao HL, Weinreb RN, et al. Repeatability of vessel density measurements of optical coherence tomography angiography in normal and glaucoma eyes. Br J Ophthalmol. 2018;102(3):352-–357. doi:10.1136/bjophthalmol-2017-310637
11. Van Melkebeke L, Barbosa-Breda J, Huygens M, Stalmans I. Optical coherence tomography angiography in glaucoma: a review. Ophthalmic Res. 2018;60(3):139-–151. doi:10.1159/000488495
12. Aghsaei Fard MAM, Ritch R. Optical coherence tomography angiography in glaucoma. (2305—5839). J Glaucom. 2020;29:312
13. Jia Y, Wei E, Wang X, et al. Optical coherence tomography angiography of optic disc perfusion in glaucoma. Ophthalmology. 2014;121(7):1322-–1332. doi:10.1016/j.ophtha.2014.01.021
14. Liu L, Jia Y, Takusagawa HL, et al. Optical coherence tomography angiography of the peripapillary retina in glaucoma. JAMA Ophthalmol. 2015;133(9):1045-–1052. doi:10.1001/jamaophthalmol.2015.2225
15. Yarmohammadi A, Zangwill LM, Diniz-Filho A, et al. Optical coherence tomography angiography vessel density in healthy, glaucoma suspect, and glaucoma eyes. Ophthalmol Vis Sci. 2016;57(9):OCT451–OCT459. doi:10.1167/iovs.15-18944
16. Wang X, Jiang C, Ko T, et al. Correlation between optic disc perfusion and glaucomatous severity in patients with open-angle glaucoma: an optical coherence tomography angiography study. Arch Clin Exp Ophthalmol. 2015;253(9):1557-–1564. doi:10.1007/s00417-015-3095-y
17. Hodapp E, Parrish RK, Anderson DR. Clinical Decisions in Glaucoma. Mosby Incorporated; 1993.
18. Keltner JL, Johnson CA, Cello KE, et al. Classification of visual field abnormalities in the ocular hypertension treatment study. Arch Ophthalmol. 2003;121(5):643-–650. doi:10.1001/archopht.121.5.643
19. Spaide RF, Fujimoto JG, Waheed NK, Sadda SR, Staurenghi G. Optical coherence tomography angiography. Prog Retin Eye Res. 2018;64:1-–55. doi:10.1016/j.preteyeres.2017.11.003
20. Chang R, Chu Z, Burkemper B, et al. Effect of scan size on glaucoma diagnostic performance using OCT angiography en face images of the radial peripapillary capillaries. J Glaucoma. 2019;28(5):465. doi:10.1097/IJG.0000000000001216
21. Ahmad SS. Controversies in the vascular theory of glaucomatous optic nerve degeneration. Taiwan J Ophthalmol. 2016;6(4):182-–186. doi:10.1016/j.tjo.2016.05.009
22. Hwang JC, Konduru R, Zhang X, et al. Relationship among visual field, blood flow visual field, blood flow, and neural structure measurements neural structure measurements in glaucoma. Invest Ophthalmol Vis Sci. 2012;53(6):3020-–3026. doi:10.1167/iovs.11-8552
23. Chen CL, Zhang A, Bojikian KD, et al. Peripapillary retinal nerve fiber layer vascular microcirculation nerve fiber layer vascular microcirculation in glaucoma using optical coherence tomography-based microangiography. Invest Ophthalmol Vis Sci. 2016;57(9):Oct475-85.–Oct485. doi:10.1167/iovs.15-18909
24. Alnawaiseh M, Lahme L, Müller V, Rosentreter A, Eter N. Correlation of flow density, as measured using optical coherence tomography angiography, with structural and functional parameters in glaucoma patients. Graefes Arch Clin Exp Ophthalmol. 2018;256(3):589-–597. doi:10.1007/s00417-017-3865-9
25. Kim SB, Lee EJ, Han JC, Kee C. Comparison of peripapillary vessel density between preperimetric and perimetric glaucoma evaluated by OCT-angiography. PLoS One. 2017;12(8):e0184297. doi:10.1371/journal.pone.0184297
26. Mangouritsas G, Koutropoulou N, Ragkousis A, Boutouri E, Diagourtas A. Peripapillary Vessel Density In Unilateral Preperimetric Glaucoma. Clin Ophthalmol. 2019;13:2511.
27. Yarmohammadi A, Zangwill LM, Diniz-Filho A, et al. Optical coherence tomography angiography vessel density coherence tomography angiography vessel density in healthy, glaucoma suspect, and glaucoma eyes. Invest Ophthalmol Vis Sci. 2016;57(9):Oct451-9.–Oct459. doi:10.1167/iovs.15-18944
28. Hou H, Moghimi S, Zangwill LM, et al. Inter-eye Asymmetry of optical coherence tomography angiography vessel density optical coherence tomography angiography vessel density in bilateral glaucoma, glaucoma suspect bilateral glaucoma, glaucoma suspect, and healthy eyes Am J Ophthalmol. 2018;190:69-–77. doi:10.1016/j.ajo.2018.03.026
29. Simsek M, Kocer AM, Cevik S, Sen E, Elgin U. Evaluation of the optic nerve head vessel density in the patients with asymmetric pseudoexfoliative glaucoma: an OCT angiography study. Arch Clin Exp Ophthalmol. 2020;258(7):1493-–1501. doi:10.1007/s00417-020-04668-x
30. Triolo G, Rabiolo A, Shemonski ND, et al. Optical coherence tomography angiography macular and peripapillary vessel perfusion density in healthy subjects, glaucoma suspects, and glaucoma patients. Ophthalmol Vis Sci. 2017;58(13):5713-–5722. doi:10.1167/iovs.17-22865
31. Yarmohammadi A, Zangwill LM, Diniz-Filho A, et al. Relationship between optical coherence tomography angiography vessel density and severity of visual field loss in glaucoma. Ophthalmology. 2016;123(12):2498-–2508. doi:10.1016/j.ophtha.2016.08.041
32. Kumar RS, Anegondi N, Chandapura RS, et al. Discriminant function of optical coherence tomography angiography to determine disease severity in glaucoma. Ophthalmol Vis Sci. 2016;57(14):6079-–6088. doi:10.1167/iovs.16-19984
33. Shin JW, Lee J, Kwon J, Choi J, Kook MS. Regional vascular density-visual field sensitivity relationship in glaucoma according to disease severity. Br J Ophthalmol. 2017;101(12):1666-–1672. doi:10.1136/bjophthalmol-2017-310180
34. Kong AW, Turner ML, Saifee M, Jethi M, Mora M, Ou Y. A global and sector-based comparison sector-based comparison of OCT angiography and visual field defects in glaucoma. J Ophthalmol. 2022;2022:6182592. doi:10.1155/2022/6182592
35. Rao HL, Srinivasan T, Pradhan ZS, et al. Optical Coherence Tomography Angiography coherence tomography angiography and Visual Field Progression visual field progression in Primary Angle Closure primary angle closure glaucoma. J Glaucoma. 2021;30(3):e61-–e67. doi:10.1097/IJG.0000000000001745
36. Lin Y-HY-H, Huang S-MS-M, Yeung L, et al. Correlation of Visual Field With Peripapillary Vessel Density Through Optical Coherence Tomography Angiography visual field with peripapillary vessel density through optical coherence tomography angiography in Normal-Tension Glaucoma.normal-tension glaucoma. Technol Sci Technol. 2020;9(13):26. doi:10.1167/tvst.9.13.26
37. Chansangpetch S, Lin SC. Optical coherence tomography angiography in glaucoma care. Curr Eye Res. 2018;43(9):1067-–1082. doi:10.1080/02713683.2018.1475013
38. Hagag AM, Gao SS, Jia Y, Huang D. Optical coherence tomography angiography: technical principles and clinical applications in ophthalmology. Taiwan J Ophthalmol. 2017;7(3):115-–129. doi:10.4103/tjo.tjo_31_17
39. Tan W, Yao X, Le TT, et al. The Application of optical coherence tomography angiography optical coherence tomography angiography in systemic hypertension: a meta-analysis. Front Med. 2021;8:778330. doi:10.3389/fmed.2021.778330
40. Shin YI, Nam KY, Lee WH, et al. Peripapillary microvascular changes in patients with systemic hypertension: anan optical coherence tomography angiography study. Sci Rep. 2020;10(1):6541. doi:10.1038/s41598-020-63603-6
 © 2023 The Author(s). This work is published and licensed by Dove Medical Press Limited. The
full terms of this license are available at https://www.dovepress.com/terms
and incorporate the Creative Commons Attribution
- Non Commercial (unported, 3.0) License.
By accessing the work you hereby accept the Terms. Non-commercial uses of the work are permitted
without any further permission from Dove Medical Press Limited, provided the work is properly
attributed. For permission for commercial use of this work, please see paragraphs 4.2 and 5 of our Terms.
© 2023 The Author(s). This work is published and licensed by Dove Medical Press Limited. The
full terms of this license are available at https://www.dovepress.com/terms
and incorporate the Creative Commons Attribution
- Non Commercial (unported, 3.0) License.
By accessing the work you hereby accept the Terms. Non-commercial uses of the work are permitted
without any further permission from Dove Medical Press Limited, provided the work is properly
attributed. For permission for commercial use of this work, please see paragraphs 4.2 and 5 of our Terms.