Back to Journals » Clinical Ophthalmology » Volume 14
Optical Coherence Tomographic Patterns as Predictors of Structural Outcome After Intravitreal Ranibizumab in Diabetic Macula Edema
Authors Chen NN ![]() , Chen WD, Lai CH, Kuo CN, Chen CL, Huang JC, Wu PC, Wu PL, Chen CY
, Chen WD, Lai CH, Kuo CN, Chen CL, Huang JC, Wu PC, Wu PL, Chen CY ![]()
Received 7 September 2020
Accepted for publication 2 November 2020
Published 23 November 2020 Volume 2020:14 Pages 4023—4030
DOI https://doi.org/10.2147/OPTH.S264669
Checked for plagiarism Yes
Review by Single anonymous peer review
Peer reviewer comments 2
Editor who approved publication: Dr Scott Fraser
Nan-Ni Chen,1 Wei-Dar Chen,1 Chien-Hsiung Lai,1– 4 Chien-Neng Kuo,5 Ching-Lung Chen,1,6 Jou-Chen Huang,7 Pei-Chen Wu,8 Pei-Lun Wu,1 Chau-Yin Chen1,2
1Department of Ophthalmology, Chang Gung Memorial Hospital, Chiayi, Taiwan; 2College of Medicine, Chang Gung University, Taoyuan, Taiwan; 3Department of Nursing, Chang Gung University of Science and Technology, Chiayi, Taiwan; 4School of Traditional Chinese Medicine, College of Medicine, Chang Gung University, Taoyuan, Taiwan; 5Department of Ophthalmology, Changhua Christian Hospital, Changhua, Taiwan; 6Department of Optometry, Chung Hwa University of Medical Technology, Tainan City, Taiwan; 7Department of Ophthalmology, Taipei Medical University Hospital, Taipei, Taiwan; 8Department of Ophthalmology, Landseed International Hospital, Taoyuan, Taiwan
Correspondence: Chien-Hsiung Lai
Department of Ophthalmology, Chang Gung Memorial Hospital, No. 6, West Section, Chia-Pu Road, Pu-Zih City, Chia-Yi County 61363, Taiwan
Tel +886-5362-1000 ext 3716
Email [email protected]
Background/Objectives: The purpose of this study was to present an association between the treatment response of diabetic macular edema (DME) to intravitreal ranibizumab (IVR) injections and different morphology patterns using spectral domain optical coherence tomography (SD-OCT).
Subjects/Methods: This retrospective study included 216 eyes of 142 subjects who received IVR for DME and were observed for at least 2 years. Medical charts and SD-OCT images of consecutive patients were reviewed at baseline, 1, 3, 6, 12, and 24 months after first IVR treatment. The OCT patterns were characterized as diffuse retinal thickening (DRT), cystoid macular edema (CME), serous retinal detachment (SRD), and vitreomacular interface abnormalities (VMIAs). All patients were classified into four groups based on the OCT findings.
Results: For a total of 216 eyes, 36 eyes were classified into the DRT group, 76 in the CME group, 42 in the SRD group, and 62 in the VMIA group. There were significant central macula thickness (CMT) improvements in all groups at the 1st month and the 2nd year, except for the DRT group at the 2nd year. Patients with OCT findings of hyperreflective dots (HRDs), metabolic parameters of hyperlipidemia, and coronary artery disease (CAD) had significantly less improvements in CMT at 2-year follow-up (P=0.029, 0.007, < 0.001, respectively).
Conclusion: A trend toward decreased effectiveness after long-term IVR treatment was observed in the DRT group. Consistent IVR treatment could still achieve favorable improvement in the reduction of CMT in 2-year follow-up in the VMIA group. Different OCT patterns in DME may affect the therapeutic role of anti-VEGF agents and predict the structure outcome.
Keywords: optical coherence tomography, diabetic macular edema, antivascular endothelial growth factors
Introduction
Diabetic macular edema (DME) is one of the major complications of diabetic retinopathy and a leading cause of visual impairment, with prevalence rates up to 12.8% among those with diabetes from population-based studies.1 Even though the focal (direct/grid) laser photocoagulation has been the gold standard treatment for decades, intravitreal anti-vascular endothelial growth factors (anti-VEGF) injection has been developed as the first-line therapy for DME due to superior visual outcomes and tolerable risks.2,3
Spectral domain optical coherence tomography (SD-OCT) contributes in understanding the morphological changes and the intraretinal damage of DME and has been used in diagnosing, optimizing early treatment, and monitoring the effect of therapies for macular edema.4,5 Various patterns of DME have been recognized on SD-OCT, including diffuse retinal thickening (DRT), cystoid macular edema (CME), serous retinal detachment (SRD), and vitreomacular interface abnormalities (VMIAs).6–13
Previous studies have reported that the effect of intravitreal Bevacizumab (IVB) treatment was predictable among different patterns of DME.7,9,11,12,14 The anatomic outcome and central macula thickness (CMT) evolution also predicted better vision outcomes.15 It is likely that each morphologic subtype of DME may have distinctive aspects that could be responsible for different anatomic responses to treatment with the currently favored anti-VEGF therapy.
Therefore, in our present study, we aimed to investigate the association between different patterns on SD-OCT and the response to intravitreal ranibizumab (IVR) injections.
Materials/Subjects and Methods
Data Source and Ethical Declaration
We retrospectively reviewed the medical records of 652 eyes (433 patients) with diabetic macular edema that were treated with intravitreal ranibizumab injection between February 2013 and June 2019 in Chiayi Chang Gung Memorial Hospital. Our study was approved by the Chang Gung Memorial Hospital Institutional Review Board (IRB: 201901410B0). Patient consent to review their medical records was not required by the Chang Gung Memorial Hospital Institutional Review Board owing to the retrospective nature of the review. The data of participants were anonymized and maintained with confidentiality. We conducted our studies in compliance with recognized international standards and the principles of the Declaration of Helsinki.
Subjects Selection
The inclusion criteria were patients diagnosed with diabetic retinopathy with clinically significant macular edema (CSME) as defined by ETDRS, and CMT of >300 μm as documented on OCT. The exclusion criteria includes: 1) Patients with ocular disease excepting cataract and diabetic retinopathy; 2) Received any previous macular focal laser therapy, prior anti-VEGF/intravitreal triamcinolone injections or any other types of anti-VEGF except Ranibizumab during 2-year follow-up period; and 3) Received any panretinal photocoagulation or intraocular surgery within 3 months of beginning the study period.
Every patient received at least one intravitreal injection of 0.5 mg of ranibizumab (0.05 mL). Ranibizumab (Lucentis; manufactured in the United States by Genentech/Roche) is a recombinant humanized IgG1 monoclonal antibody fragment that binds to and inhibits vascular endothelial growth factor A (VEGF-A). The need of re-injection was determined by the treating physician’s best judgment, mainly based on persistent SRF/CME or CMT >300 μm. Patients were examined postoperatively monthly for 3-months, and then 24-month follow-up period was completed, using SD-OCT (Optovue Inc, USA) with software version 6.2.2.73. Designated time points included baseline, 1 month, 3 months, 6 months, 12 months and 24 months follow-up. The eyes were categorized into four groups based on the OCT morphologies.
Data Collection
At first visit, all patients underwent complete ophthalmic examination, including slit-lamp examination, intraocular pressure measurement, best-corrected Snellen visual acuity (BCVA), fundus photography, retina thickness measurement by OCT, and fluorescence angiography. The Snellen visual acuity measurements were converted to LogMAR scale (the logarithm of the minimum angle of resolution) for statistical analysis. Metabolic parameters were also assessed through review of the comprehensive medical records, including hypertension (HTN), coronary artery disease (CAD), stroke, chronic kidney disease (CKD), hyperlipidemia, thyroid disease, and cancer. The decision of whether to perform reinjection or not was based on increased or persistent fluid on OCT at the monthly control visits.
Outcome Measurement
The anatomic outcome was defined as CMT reduction between the baseline and the control visit. The CMT was automatically calculated as the average retinal thickness within the central circle of a 500-μm radius.
The OCT patterns were defined into four types; the DRT, CME, SRD, and VMIA pattern, as described previously.12 All cases were evaluated by at least two graders. When disagreement occurred, a third senior retina specialist would determine the final grading. Kappa statistics were used to evaluate the level of agreement between the two graders (the observed kappa coefficient was 94.2%). On the basis of the VMIA pattern, the OCT finding was characterized as epiretinal membrane (ERM) or vitreomacular traction (VMT). The presence of hyperreflective dots (HRDs) on SD-OCT was also documented, which were defined as small, discrete, and well-circumscribed punctiform white lesions <50 μm in diameter, and of similar or higher reflectivity than the RPE band with the absence or minimal back-shadowing. The HRDs were subdivided into the following categories, according to the location: inner retina (from internal limiting membrane to outer nuclear layer) and outer retina (from ELM to the RPE).
All patients were categorized into four groups based on the OCT findings, as described in our previous work.12 Briefly, patients with only pure DRT were classified as Group 1. When CME were measured as the dominant pattern, the patients were classified as Group 2. Patients with SRD but without VMIA were sorted into group 3. Eyes with ERM or VMT were classified into group 4 regardless of pattern combinations.
Statistical Analysis
All analyses were computed by using PASW Statistics 18 software (Version 18.0. Chicago: SPSS Inc.). The baseline characteristic of patients and changes in CMT were analyzed by using Chi-square and one-way ANOVA. Differences of CMT between baseline and every visit were evaluated by paired t-test. The correlation of CMT and each parameter between the four groups were using generalized estimating equation (GEE). A P-value less than 0.05 is considered statistically significant.
Results
In total, OCT scans taken from 216 eyes of 142 patients comprised the study population for evaluation of OCT morphologic characteristics. Four hundred and thirty-six eyes were excluded from the study due to previous IVB injection (n=81), ocular disease apart from diabetic retinopathy and cataract (n=23), uncontrolled glaucoma (n=12), intraocular surgery or panretinal photocoagulation within 3 months before the first IVR injection (n=13), and any missing data or poor OCT image quality at designated time points (n=307).
Patient characteristics are summarized in Table 1. The mean age of the patients was 65.73±9.24 years. No differences were noted among the four groups with regard to the baseline characteristics of gender, baseline VA, HbA1c, diabetes retinopathy stage, panretinal photocoagulation, and average 1 year and 2 years dosage. The overall average dosages of injections for all patients in the first year are 4.29±1.26 and 5.33±1.90 in 2 years. The baseline CMT and age were significantly different between the four OCT patterns (P<0.001, P=0.001), with the SRD group having a higher mean baseline CMT (513.98±165.65) and the VMIA group the older mean age (69.27±7.64).
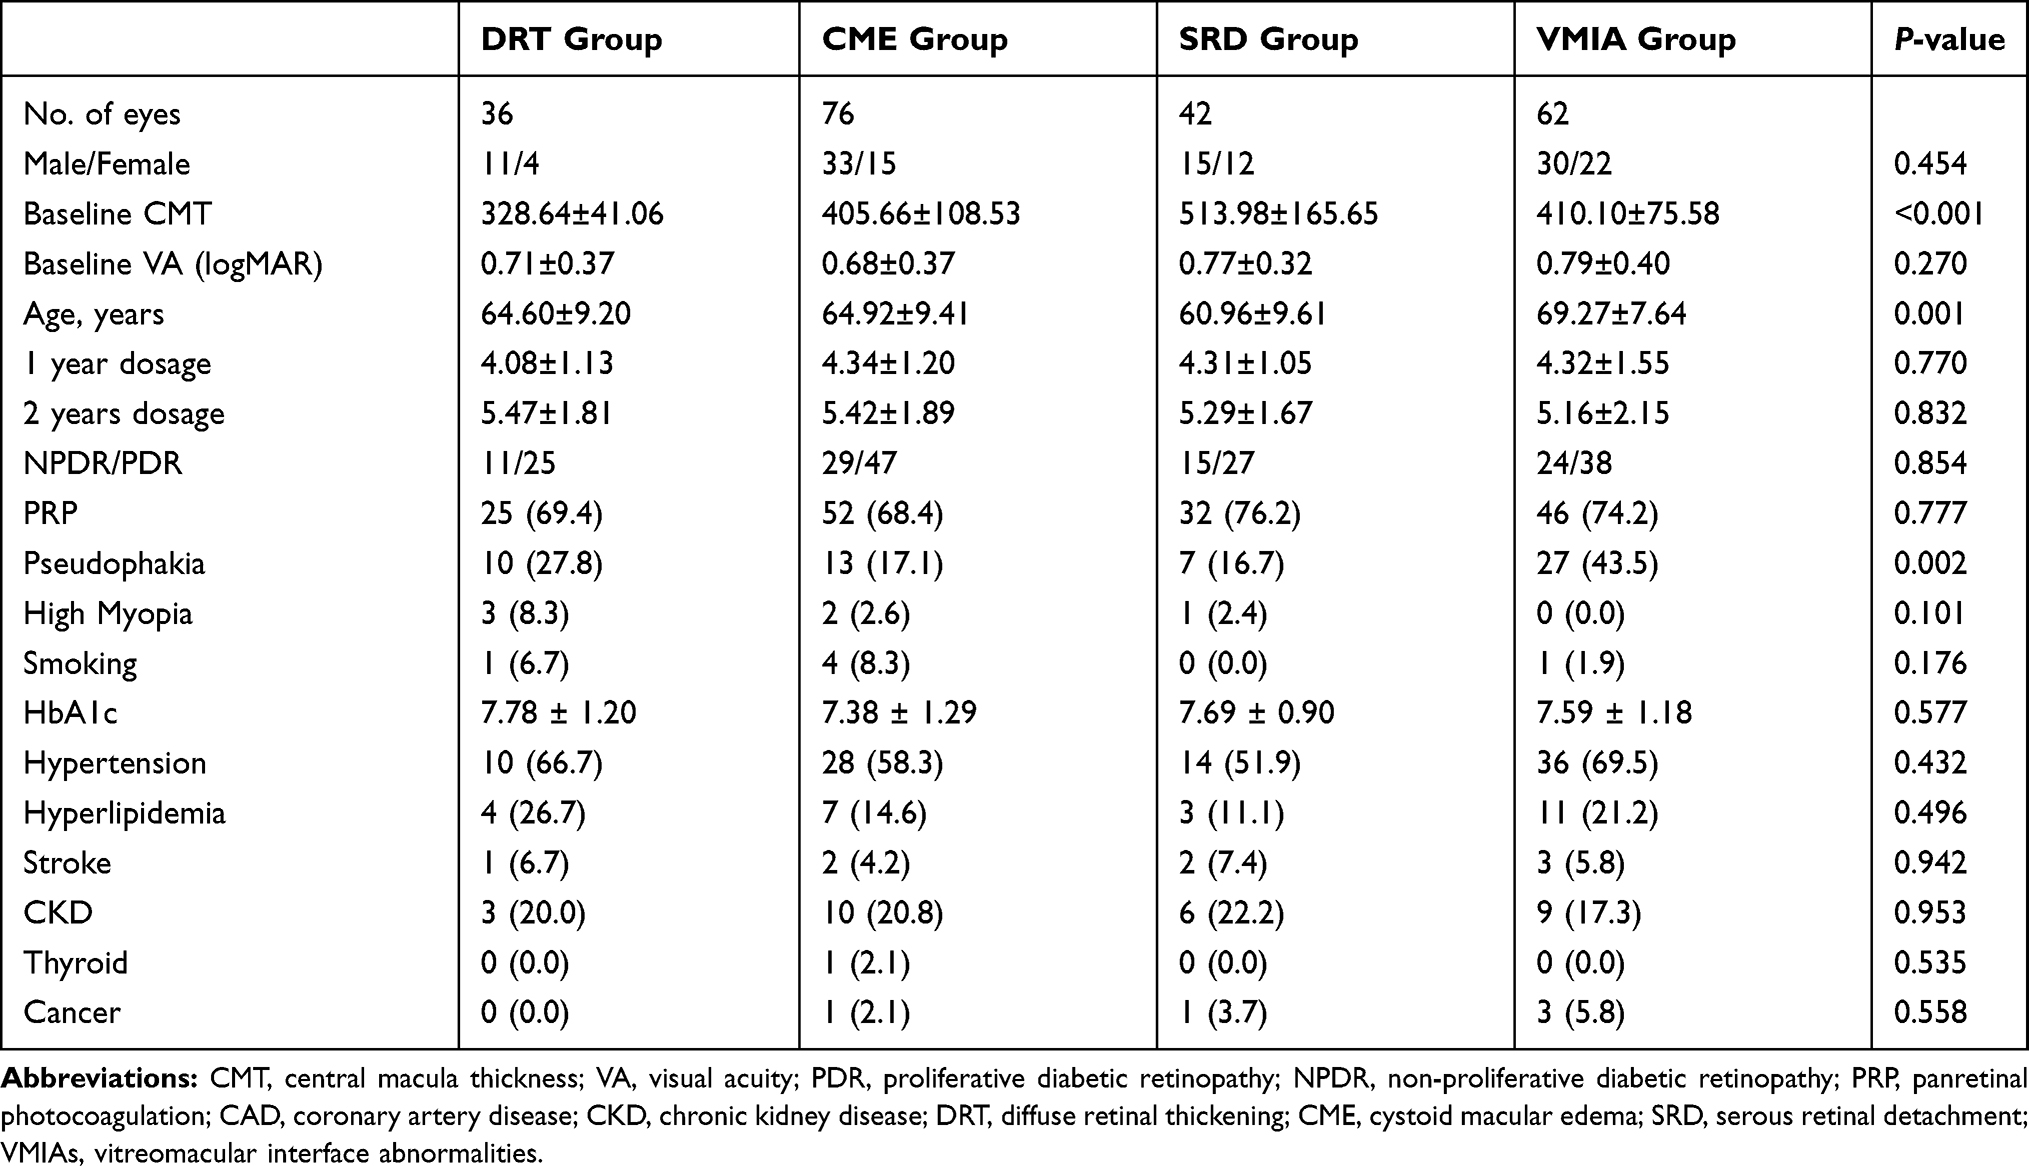 |
Table 1 Characteristics of Groups of Patients in the Study |
For a total of 216 eyes, 36 eyes were classified into the DRT group, 76 in the CME group, 42 in the SRD group, and 62 in the VMIA group. The common combinations of morphological subtypes of DME noted in our study are summarized in Table 2, with the most common combination being the DRT/CME, DRT alone, and DRT/CME/SRD in numerical order. The effects of IVR injection therapy on DME, based on OCT patterns, are summarized in Table 3 and Figure 1. The changes from baseline CMT for all four groups were evaluated at 1-month, 3-months, 6-months, 1-year, and 2-years after injection. The mean CMT were significantly decreased at the 1st month after treatment for all patients. At the 2nd year after all injections, the reductions in CMT were still significant in all groups except the DRT group (P=0.405). Moreover, in the DRT group, the subgroup of baseline CMT <350 mm achieved better resolution of CMT (P<0.001). The final CMT were not significantly different between all groups at 2-year follow-up (P=0.386).
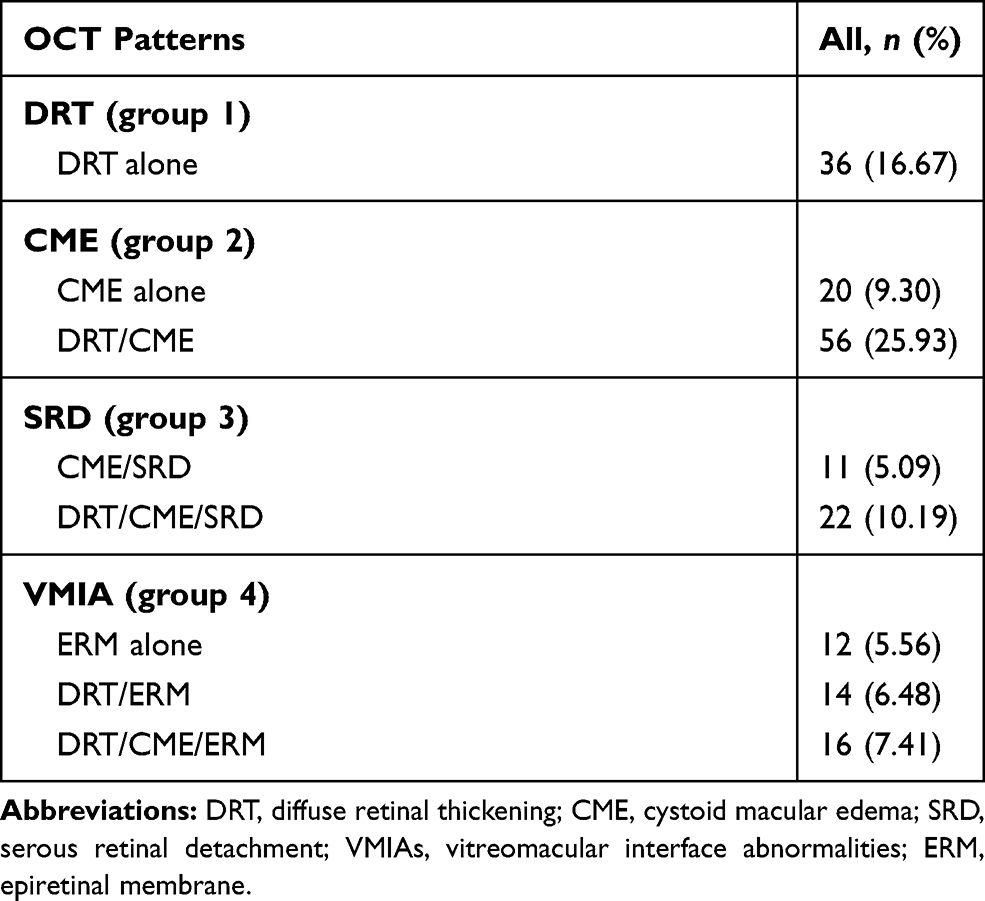 |
Table 2 Common Combinations of Morphological Subtypes |
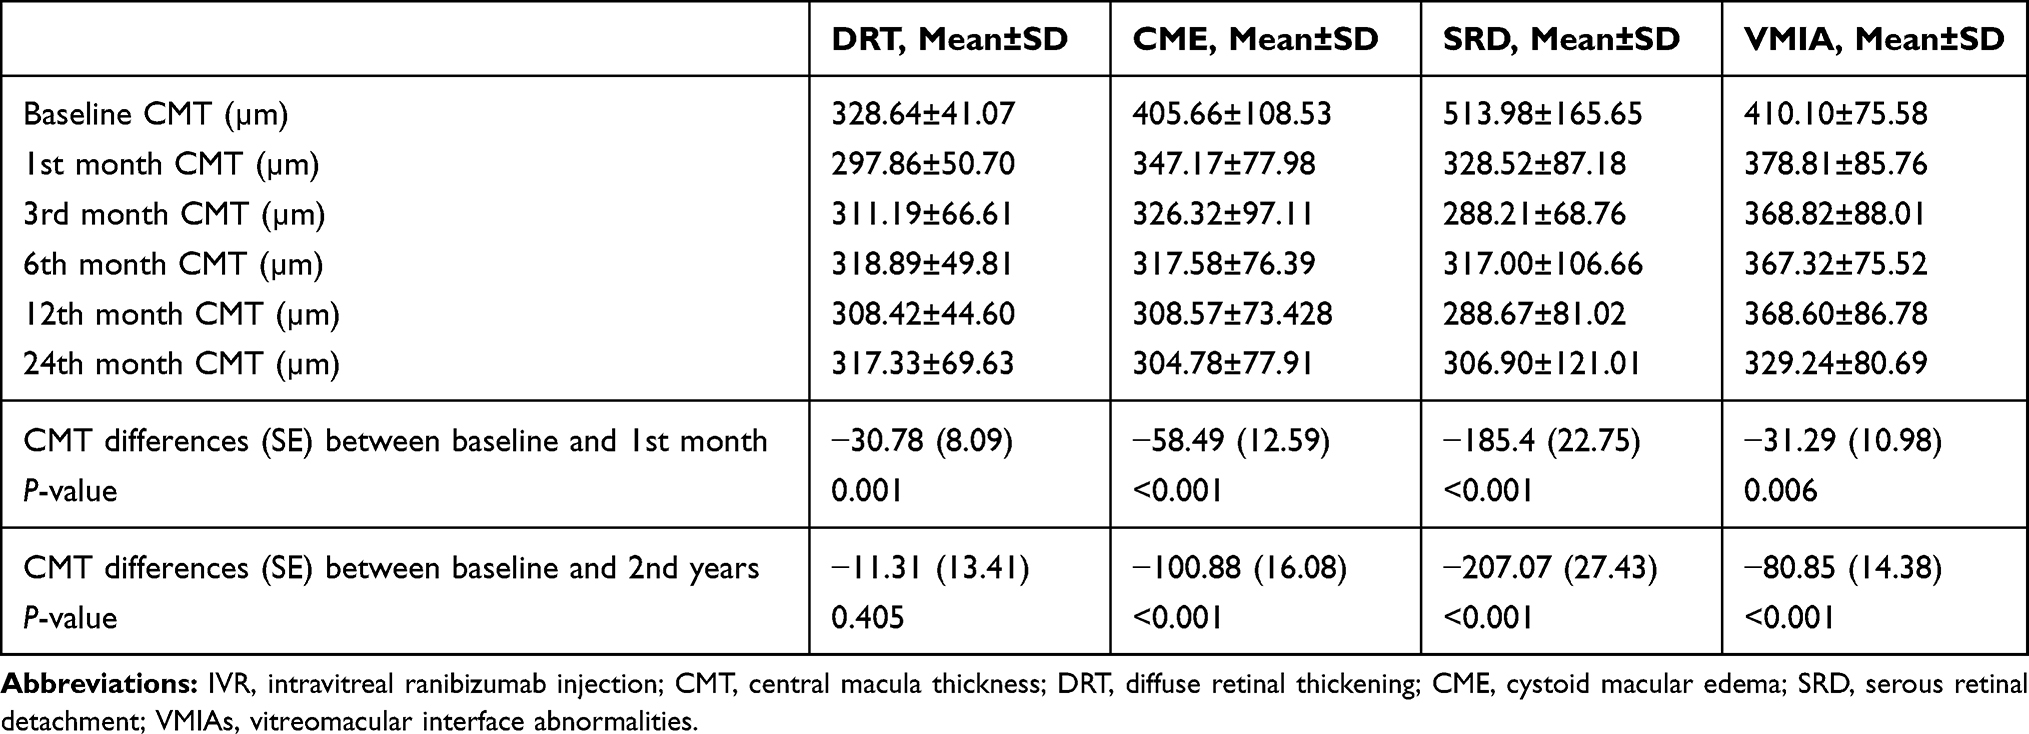 |
Table 3 The Effects of IVR Therapy Between Different Groups |
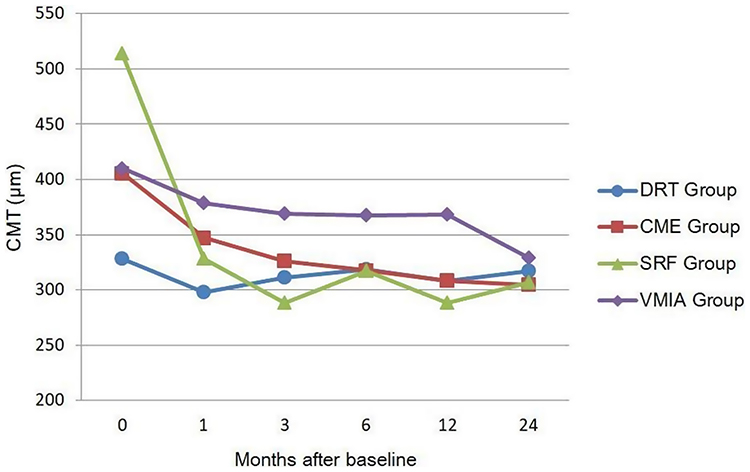 |
Figure 1 The effects of IVR therapy among different OCT patterns in 2-year follow-up. |
The comparisons of the 2-year follow-up data of the four groups using generalized estimating equation are shown in Table 4. Upon DRT as the reference group, the reductions in retinal thickness were more evident in the CME and SRF groups for each time point (P<0.001 for each) except the CME group at the 1st month (P=0.062). For the VMIA group, though the differences were not statistically significant initially, it showed significant differences in the changes of CMT at the 2nd year of follow-up (P<0.001). Besides different OCT morphology, we found patients with pseudophakia had better CMT resolution (P=0.016). Patients with OCT finding of HRDs, metabolic parameters of hyperlipidemia, and coronary artery disease (CAD) had significantly less improvements in CMT at the 2-year follow-up (P=0.029, 0.007, <0.001, respectively).
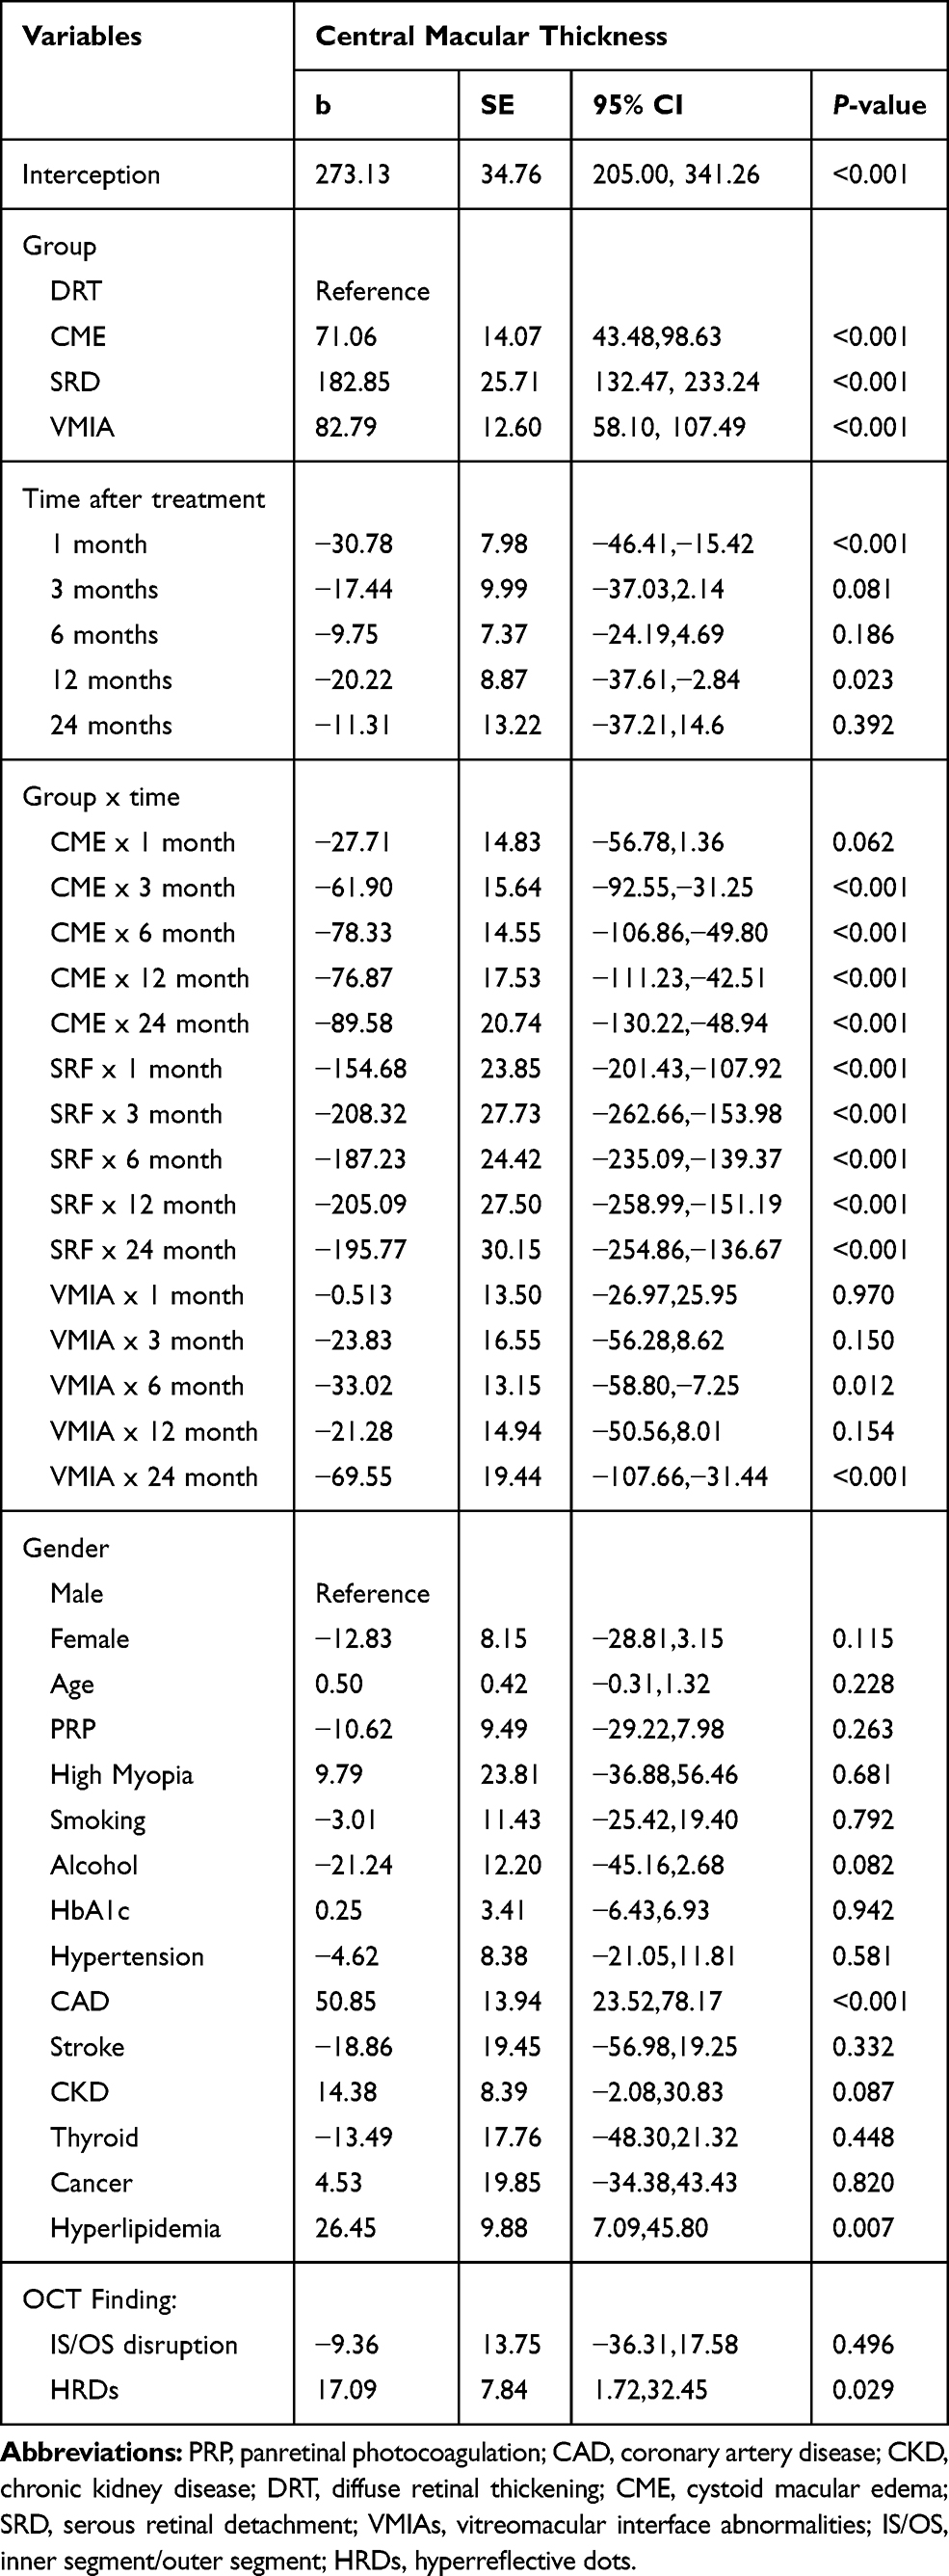 |
Table 4 Comparison of the 2-Year Follow-Up Data of the Four Groups Using Generalized Estimating Equation |
Discussion
In our current study, there are significant CMT improvements in all groups at the 1st month. The injection seems effective as primary treatment for all groups and could maintain the response with the final CMT showed no significant difference between all groups at the 2-year follow-up. The DRT group did not achieve significant CMT reduction at the 2nd year as the first month after IVR treatment. Besides the possible reason of smaller CMT at baseline in the DRT group, this result may indicate a trend toward decreased effectiveness after long-term IVR treatment. Patients with OCT finding of HRDs, metabolic parameters of hyperlipidemia and CAD had significantly less improvements in CMT at 2-year follow-up.
In DME, liquid accumulation can occur in intracellular or extracellular spaces due to cytotoxic or vasogenic processes.16 Several patterns of macula edema depending on the location of intracellular or extracellular fluid were first described by Otani et al.17 Though the vasogenic or inflammatory etiology of DME is very difficult to distinguish from OCT, several studies attempted to identify the DME pattern in predicting the evolution of the disease and its response to treatment.8,9,11,12,18–23 Investigators have found variable results for visual and anatomic improvement in different groups after IVB treatment. Several studies suggested that eyes with CME may benefit more from IVB treatment than eyes with more diffuse patterns of DME,9,12,21,22 while others proposed better effectiveness in the DRT type or even not predictive of OCT response.20,24
A similar association in patients with DME undergoing ranibizumab treatment has been demonstrated by Sophie et al,25 in which the presence of subretinal fluid implied a better response to treatment. On the other hand, Hoon Seo et al19 found DRT maintained a good response to ranibizumab in a fewer number of injections compared with other OCT subtypes. The reason for those disparities is unclear, though there are substantial differences in study designs. In our current study, the reductions of CMT were more evident in both CME and SRF groups during 2 years of follow-up, similar to previous studies demonstrated by Sophie et al.25
In many cases of persistent DME, vitreomacular traction plays a substantial role.8,26 Surprisingly, it showed significant differences in the changes of CMT at the 2nd year of follow-up (P<0.001) in the VMIA group, with an average reduction of −80.85 (14.38) µm. This implies us though in case of VMIA, which the treatment strategy used to be surgically relief of traction rather than laser photocoagulation or intravitreal medications, a consistent intravitreal injection of ranibizumab could still achieve favorable improvement in reduction of CMT in our 2-year observation. The IVR treatment for DME inhibits the VEGF-A, a critical effector for several pro-inflammatory mediators in the posterior vitreous cortex, including cytokines, chemokines, and vascular cell adhesion molecules, which are highly correlated with ERM formation. Besides, long-term intravitreal injection attributes to repetition of volume expansion, which may accelerate posterior vitreous detachment and be beneficial in the natural history of DME.27
More recent work has found that SD-OCT may be useful not only for observation of macular thickness and morphologic changes in DME, but also in tracking of HRDs in the outer nuclear layer that may represent precursors of hard exudates, migrating RPE cells or degenerated photoreceptor cells.10,–14,–28–30 Hwang et al10 suggested more HRDs might reflect increased inflammation in the retina and be more effective when treated with dexamethasone in their observation. Contrarily, Schreur et al28 yielded disparate results of higher numbers of HRDs at baseline were associated with adequate treatment response to anti-VEGF. In our study, OCT findings of HRDs demonstrates less improvement in CMT at 2-year follow-up (P=0.029), which may also imply the possible feature for shifting to dexamethasone therapy. HRDs could play a different role in predicting visual prognosis in different patterns of DME. Kang et al further subdivided HRDs into inner retinal, outer retinal and SRF HRDs. They suggested a high number of outer retinal HRDs was a poor visual prognostic factor in all patterns of DME, and hypothesized that these migrated HRDs might be responsible for the damage of photoreceptor status.14 In our study, we did not find the corrections between inner or outer retinal HRDs and CMT reduction (P=0.388, 0.522, respectively).
There may be different key mechanisms involved in the development of specific types of DME based on OCT classification.16,31,32 Some researchers emphasized the sequential order from the intracellular swelling, cyst formation to the more severe form of liquid accumulation under the neurosensory retina initiated by progressive Müller cells damage.16 On the aspect of sub-retinal micro-environment, RPE dysfunction is an early event associated with hyperglycemia that contributes to fluid accumulation in DME,32,33 which is considered to have different pathophysiology and be associated with earlier change and less ellipsoid zone (EZ) damage.34 This could partially explain the better results of CMT reduction in the SRD group of our study, as well as the different outcomes between the groups.
Although studies have shown clear improvement in macular edema on OCT after anti-VEGF treatment, a disconnection still remains in some patients who demonstrate anatomic improvement in macular edema but no concordant functional response. Metabolic parameters may contribute to the different patient response to similar regimens of anti-VEGF therapy.35 In our study, we found hyperlipidemia and CAD (P=0.007, <0.001, respectively) to be risk factors of poor CMT resolution. These findings may provide additional insight that serum lipids were associated with the pathogenesis of DME36 and the severity of microvascular disease could impact on the final resolution.
Finally, this study has several limitations that require consideration. It is a non-randomized and uncontrolled study. Data were collected retrospectively from a relatively small number of patients without a standardized treatment regimen. We overcame any limitations that may have derived from poor-quality images, previous treatments, or short follow-up period, resulting in our relatively large number of excluded cases. Eyes with different duration of DME, control of DM, and timing for injections were also not evaluated, reflecting real-life conditions in daily practice.
In summary, different OCT patterns in DME may affect the therapeutic role of anti-VEGF agents and predict the structure outcome. The IVR seems effective as a primary treatment for all patients. A trend toward decreased effectiveness after long-term IVR treatment was observed in the DRT group. A consistent intravitreal injection of ranibizumab could still achieve favorable improvement in reduction of CMT in 2-year follow-up in the VMIA group, which should not be precluded from further anti-VEGF treatment when surgical intervention is not feasible. Further larger prospective, randomized, controlled clinical trials are required to evaluate the correlation between the response of different anti-VEGF treatments and OCT morphology.
Funding
There is no funding to report.
Disclosure
The authors did not have any conflicts of interest to declare.
References
1. Lee R, Wong TY, Sabanayagam C. Epidemiology of diabetic retinopathy, diabetic macular edema and related vision loss. Eye Vis (Lond). 2015;2:17.
2. Bressler SB, Glassman AR, Almukhtar T, et al. Five-year outcomes of ranibizumab with prompt or deferred laser versus laser or triamcinolone plus deferred ranibizumab for diabetic macular edema. Am J Ophthalmol. 2016;164:57–68. doi:10.1016/j.ajo.2015.12.025
3. Heier JS, Korobelnik JF, Brown DM, et al. Intravitreal aflibercept for diabetic macular edema: 148-week results from the VISTA and VIVID studies. Ophthalmology. 2016;123(11):2376–2385. doi:10.1016/j.ophtha.2016.07.032
4. Yamamoto S, Yamamoto T, Hayashi M, Takeuchi S. Morphological and functional analyses of diabetic macular edema by optical coherence tomography and multifocal electroretinograms. Graefes Arch Clin Exp Ophthalmol. 2001;239(2):96–101. doi:10.1007/s004170000238
5. Ozdek S, Alper Erdinç M, Gurelik G, Aydin B, Bahçeci U, Hasanreisoglu B. Optical coherence tomographic assessment of diabetic macular edema: comparison with fluorescein angiographic and clinical findings. Ophthalmologica. 2005;219(2):86–92. doi:10.1159/000083266
6. Kim BY, Smith SD, Kaiser PK. Optical coherence tomographic patterns of diabetic macular edema. Am J Ophthalmol. 2006;142(3):405–412. doi:10.1016/j.ajo.2006.04.023
7. Cho YJ, Lee DH, Kim M. Optical coherence tomography findings predictive of response to treatment in diabetic macular edema. J Int Med Res. 2018;46(11):4455–4464.
8. Buabbud JC, Al-latayfeh MM, Sun JK. Optical coherence tomography imaging for diabetic retinopathy and macular edema. Curr Diab Rep. 2010;10(4):264–269. doi:10.1007/s11892-010-0129-z
9. Itoh Y, Petkovsek D, Kaiser PK, Singh RP, Ehlers JP. Optical coherence tomography features in diabetic macular edema and the impact on anti-VEGF response. Ophthalmic Surg Lasers Imaging Retina. 2016;47(10):908–913. doi:10.3928/23258160-20161004-03
10. Hwang HS, Chae JB, Kim JY, Kim DY. Association between hyperreflective dots on spectraldomain optical coherence tomography in macular edema and response to treatment. Invest Ophthalmol Vis Sci. 2017;58(13):5958–5967. doi:10.1167/iovs.17-22725
11. Cheema HR, Al Habash A, Al-Askar E. Improvement of visual acuity based on optical coherence tomography patterns following intravitreal bevacizumab treatment in patients with diabetic macular edema. Int J Ophthalmol. 2014;7(2):251–255.
12. Wu PC, Lai CH, Chen CL, Kuo CN. Optical coherence tomographic patterns in diabetic macula edema can predict the effects of intravitreal bevacizumab injection as primary treatment. J Ocul Pharmacol Ther. 2012;28(1):59–64. doi:10.1089/jop.2011.0070
13. Alkuraya H, Kangave D, Abu El-Asrar AM. The correlation between optical coherence tomographic features and severity of retinopathy, macular thickness and visual acuity in diabetic macular edema. Int Ophthalmol. 2006;26(3):93–99. doi:10.1007/s10792-006-9007-8
14. Joon-won Kang M, Chung Hyewon, Kim Hyungchan. Correlation of optical coherence tomographic hyperreflective foci with visual outcomes in different patterns of diabetic macular edema. Retina. 2016;36(9):1630–1639.
15. Bressler SB, Qin H, Beck RW, et al. Factors associated with changes in visual acuity and central subfield thickness at 1 year after treatment for diabetic macular edema with ranibizumab. Arch Ophthalmol. 2012;130(9):1153–1161. doi:10.1001/archophthalmol.2012.1107
16. Romero-Aroca P, Baget-Bernaldiz M, Pareja-Rios A, Lopez-Galvez M, Navarro-Gil R, Verges R. Diabetic Macular Edema Pathophysiology: vasogenic versus Inflammatory. J Diabetes Res. 2016;2016:2156273. doi:10.1155/2016/2156273
17. Tomohiro Otani M, Kishi Shoji, Maruyama Yasuhiro. Patterns of diabetic macular edema with optical coherence tomography. Am J Ophthalmol. 1999;127(6):688–693.
18. Radovanova KT. Optical coherence tomography patterns in diabetic macular edema can predict the effectiveness of intravitreal bevacizumab combined with macular photocoagulation. J Clin Exp Ophthalmol. 2014;05(05). doi:10.4172/2155-9570.1000355
19. Hoon Seo K, Yu S-Y, Kim M, Woo Kwak H. Visual and morphologic outcomes of intravitreal ranibizumab for diabetic macular edema based on optical coherence tomography patterns. Retina. 2016;36(3):588–595. doi:10.1097/IAE.0000000000000770
20. Kim M, Lee P, Kim Y, Yu SY, Kwak HW. Effect of intravitreal bevacizumab based on optical coherence tomography patterns of diabetic macular edema. Ophthalmologica. 2011;226(3):138–144. doi:10.1159/000330045
21. Koytak A, Altinisik M, Sogutlu Sari E, Artunay O, Umurhan Akkan JC, Tuncer K. Effect of a single intravitreal bevacizumab injection on different optical coherence tomographic patterns of diabetic macular oedema. Eye (Lond). 2013;27(6):716–721. doi:10.1038/eye.2013.17
22. Roh MI, Kim JH, Kwon OW. Features of optical coherence tomography are predictive of visual outcomes after intravitreal bevacizumab injection for diabetic macular edema. Ophthalmologica. 2010;224(6):374–380. doi:10.1159/000313820
23. Horii T, Murakami T, Nishijima K, Sakamoto A, Ota M, Yoshimura N. Optical coherence tomographic characteristics of microaneurysms in diabetic retinopathy. Am J Ophthalmol. 2010;150(6):840–848. doi:10.1016/j.ajo.2010.06.015
24. Joshi L, Bar A, Tomkins-Netzer O, et al. Intravitreal bevacizumab injections for diabetic macular edema - predictors of response: a retrospective study. Clin Ophthalmol. 2016;10:2093–2098. doi:10.2147/OPTH.S109809
25. Sophie R, Lu N, Campochiaro PA. Predictors of functional and anatomic outcomes in patients with diabetic macular edema treated with ranibizumab. Ophthalmology. 2015;122(7):1395–1401. doi:10.1016/j.ophtha.2015.02.036
26. Ophir A, Martinez MR, Mosqueda P, Trevino A. Vitreous traction and epiretinal membranes in diabetic macular oedema using spectral-domain optical coherence tomography. Eye (Lond). 2010;24(10):1545–1553. doi:10.1038/eye.2010.80
27. Zhang X, Zeng H, Bao S, Wang N, Gillies MC. Diabetic macular edema: new concepts in patho-physiology and treatment. Cell Biosci. 2014;4(1):27. doi:10.1186/2045-3701-4-27
28. Schreur V, Altay L, van Asten F, et al. Hyperreflective foci on optical coherence tomography associate with treatment outcome for anti-VEGF in patients with diabetic macular edema. PLoS One. 2018;13(10):e0206482. doi:10.1371/journal.pone.0206482
29. Murakami T, Uji A, Ogino K, et al. Macular morphologic findings on optical coherence tomography after microincision vitrectomy for proliferative diabetic retinopathy. Jpn J Ophthalmol. 2015;59(4):236–243. doi:10.1007/s10384-015-0382-4
30. Framme C, Wolf S, Wolf-Schnurrbusch U. Small dense particles in the retina observable by spectral-domain optical coherence tomography in age-related macular degeneration. Invest Ophthalmol Vis Sci. 2010;51(11):5965–5969. doi:10.1167/iovs.10-5779
31. Richard F, Spaide M. Retinal vascular cystoid macular edema review and new theory. Retina. 2016;36(10):1823–1842.
32. Daruich A, Matet A, Moulin A, et al. Mechanisms of macular edema: beyond the surface. Prog Retin Eye Res. 2018;63:20–68. doi:10.1016/j.preteyeres.2017.10.006
33. Desjardins DM, Yates PW, Dahrouj M, Liu Y, Crosson CE, Ablonczy Z. Progressive early breakdown of retinal pigment epithelium function in hyperglycemic rats. Invest Ophthalmol Vis Sci. 2016;57(6):2706–2713. doi:10.1167/iovs.15-18397
34. Sheu SJ, Lee YY, Horng YH, Lin HS, Lai WY, Tsen CL. Characteristics of diabetic macular edema on optical coherence tomography may change over time or after treatment. Clin Ophthalmol. 2018;12:1887–1893. doi:10.2147/OPTH.S173956
35. Matsuda S, Tam T, Singh RP, et al. The impact of metabolic parameters on clinical response to VEGF inhibitors for diabetic macular edema. J Diabetes Complications. 2014;28(2):166–170. doi:10.1016/j.jdiacomp.2013.11.009
36. Benarous R, Sasongko MB, Qureshi S, et al. Differential association of serum lipids with diabetic retinopathy and diabetic macular edema. Invest Ophthalmol Vis Sci. 2011;52(10):7464–7469. doi:10.1167/iovs.11-7598
 © 2020 The Author(s). This work is published and licensed by Dove Medical Press Limited. The
full terms of this license are available at https://www.dovepress.com/terms
and incorporate the Creative Commons Attribution
- Non Commercial (unported, 3.0) License.
By accessing the work you hereby accept the Terms. Non-commercial uses of the work are permitted
without any further permission from Dove Medical Press Limited, provided the work is properly
attributed. For permission for commercial use of this work, please see paragraphs 4.2 and 5 of our Terms.
© 2020 The Author(s). This work is published and licensed by Dove Medical Press Limited. The
full terms of this license are available at https://www.dovepress.com/terms
and incorporate the Creative Commons Attribution
- Non Commercial (unported, 3.0) License.
By accessing the work you hereby accept the Terms. Non-commercial uses of the work are permitted
without any further permission from Dove Medical Press Limited, provided the work is properly
attributed. For permission for commercial use of this work, please see paragraphs 4.2 and 5 of our Terms.