Back to Journals » Clinical Ophthalmology » Volume 18
Online Circular Contrast Perimetry via a Web-Application: Establishing a Normative Database for Central 10-Degree Perimetry
Authors Chen YX ![]() , Meyerov J, Skalicky SE
, Meyerov J, Skalicky SE ![]()
Received 16 October 2023
Accepted for publication 23 December 2023
Published 20 January 2024 Volume 2024:18 Pages 201—213
DOI https://doi.org/10.2147/OPTH.S440964
Checked for plagiarism Yes
Review by Single anonymous peer review
Peer reviewer comments 2
Editor who approved publication: Dr Scott Fraser
Yang X Chen,1 Joshua Meyerov,2 Simon E Skalicky2,3
1St Vincent’s Hospital Clinical School, University of Melbourne, Melbourne, VIC, Australia; 2Department of Surgery Ophthalmology, University of Melbourne, Melbourne, VIC, Australia; 3Glaucoma Investigation and Research Unit, the Royal Victorian Eye and Ear Hospital, Melbourne, VIC, Australia
Correspondence: Simon E Skalicky, Royal Victorian Eye and Ear Hospital, 32 Gisborne St, East Melbourne, Melbourne, VIC, 3002, Australia, Tel +9509 4233, Email [email protected]
Purpose: To establish a normative database using a central 10-degree grid pattern for the online circular contrast perimetry (OCCP) application.
Participants: Fifty participants with mean age 65 ± 13 years were selected for this study. One eye from each participant that met inclusion criteria was randomly included in the cohort.
Methods: The web-application delivered online 52-loci perimetry in a central 10-degree pattern using circular flickering targets. These targets consist of concentric sinusoidal alternating contrast rings. Users were guided by the application to the correct viewing distance and head position using in-built blind spot localization and webcam monitoring. A spinning golden star was used as the fixation target and patients performed the test in a darkened room following standard automated perimetry (SAP).
Results: The reliability rates and global indices for OCCP were similar to SAP. OCCP mean sensitivity reduced with age at a similar rate to SAP. Mean sensitivity per loci of 10-degree OCCP was greater than SAP by 1.24 log units (95% CI 1.23 to 1.26) and obeyed a physiological hill of vision. Small differences existed in mean sensitivities between OCCP and SAP which increased with increasing spot eccentricity. Mean deviation (MD) displayed good agreement between the two tests.
Conclusion: Central 10-degree online circular contrast perimetry via a computer-based application has comparable perimetric results to standard automated perimetry in a normal cohort.
Keywords: online perimetry, glaucoma, visual field testing
Introduction
Glaucoma is the leading cause of irreversible preventable blindness worldwide.1,2 Because glaucoma is asymptomatic until advanced stages, many people with glaucoma remain undetected; a proportion which ranges from 50% in the developed world to 90% in the developing world.3,4 However, early detection and rigid surveillance are imperative to prevent glaucoma blindness and reduce the rate of disease progression.4,5 Visual field (VF) testing with a standard automated perimeter (SAP) is the clinical standard for the diagnosis and monitoring of glaucoma. VF testing in glaucoma typically involves the evaluation of the central 24 degrees of monocular vision with 6-degree spaced targets (24–2 perimetry). Recently, there has been increasing emphasis on evaluating the central 10 degrees of the visual field (10–2 perimetry) for early glaucoma detection.6 10–2 perimetry is also useful in advanced glaucoma involving fixation, to provide more granular functional detail than conventional 24–2 perimetry.7
SAP carries certain disadvantages including the requirement of dedicated machines that must be specifically calibrated, and trained staff to operate the machines.8–10 In poorer or more remote regions of the globe, there may be difficulty in affording and accessing SAP, which may influence the rates of glaucoma detection. In better resourced healthcare settings, there is increasing pressure from higher demand costs associated with chronic disease management, and hence remote monitoring and telehealth via online applications are attractive. In addition, SAP is well recognized to be an uncomfortable and anxiety-provoking experience,11 which can be improved with an optimized and user-friendly online perimetry application.12–15 Newer, virtual reality-based visual field testing involves perimetry on a dedicated portable device, but the device comes with a cost that is a barrier for access for many.16
For this reason, our group has developed an online perimetry application, online circular contrast perimetry (OCCP), that aims to offer patients the option to undergo routine perimetry from the comfort of their own homes via a personal computer or tablet. Online perimetry via personal devices has many potential advantages, including improved access to perimetry, the option of home perimetry, significant cost saving benefits in perimetric hardware for clinicians, cheaper healthcare delivery for healthcare funders, a more enjoyable user experience for patients, ease of sharing data between clinics for collaborative care, and data integration within electronic medical records.17,18 Studies comparing OCCP to SAP have shown favorable results, in terms of similar perimetric outcomes, similar diagnostic accuracy, and an improved user experience.19,20 A normative database for the central 24 degrees of vision has been established using OCCP; we now wish to demonstrate the feasibility of and establish a normative database for central 10-degree OCCP perimetry.21
Methods
Ethics
The study complies with the Declaration of Helsinki. All subjects provided informed written consent before participating. Ethics approval was obtained from the Royal Australian and New Zealand College of Ophthalmology Human Research and Ethics committee, with local site governance.
Study Population
A sample size of 50 was chosen based on similar papers,22–24 with analysis indicating that this sample size was sufficient to provide a power of 0.9, given the measured sensitivities per eye of OCCP and SAP and a two-tailed α of 0.05.
Subjects were recruited consecutively from a multisite subspecialty glaucoma practice in Melbourne, 2022. Participants were included who were referred for a suspicion of glaucoma but on assessment found to have no suspicious features of glaucoma, namely normal IOPs, visual fields, OCT of the RNFL and disc assessment.
Glaucoma was defined based on the American Academy of Ophthalmology criteria.25 Participants had normal IOP, retinal nerve fiber layer (RNFL) thickness, optic nerve head (ONH) appearance and SAP results, with no other ocular pathologies.
Inclusion criteria were as follows: best-corrected visual acuity ≥0.7 logMAR; reliable SAP and OCCP test results with false positives, false negatives and fixation losses <33%; normal SAP results as defined by Hoddapp and associates’ criteria;26 satisfactory optical coherence tomography (OCT) image quality with no segmentation errors and signal strength ≥ 8/10; ONH and retinal nerve fiber layer (RNFL) appearance; ability to read and comprehend English fluently.
Exclusion criteria were as follows: ocular pathology such as glaucomatous optic neuropathy (GON) or ocular hypertension, visually significant cataracts (Lens Opacities Classification System III greater than Grade 2),27 retinal or macular pathology, non-glaucomatous optic neuropathy; angle or papillary abnormalities; large peripapillary atrophy; previous intraocular surgery (excluding cataract surgery performed at least 6 months prior); neurological disorders or significant cognitive impairment; ametropia > ±5 diopters; medication that could alter visual field results (ie, chloroquine, vigabatrin, pilocarpine, etc.); media opacities interfering with good image scans.
Normal ONH and RNFL appearance was defined as follows: the absence of optic disc hemorrhage, localized pallor, diffuse or focal rim thinning, RNFL defects or cupping and a cup-to-disc ratio ≤0.7. GON was defined if ONH and RNFL displayed at least one of the following: generalized or focal atrophy of the RNFL, diffuse or focal atrophy of neural rim area involving ≥2 clock hours, ONH excavation, notching involving ≥2 clock hours, disc hemorrhage or inter-eye vertical cup-disc asymmetry ≥0.3.
One eye from each participant that met inclusion criteria was randomly included in the cohort.
Assessment of Clinical Parameters
Following recruitment, subjects were clinically assessed by an ophthalmologist (author SS). Best corrected distance visual acuity was collected. Intraocular pressure was measured using a Goldmann applanation tonometer (GAT; Haag-Streit International, Bern, Switzerland) and central corneal thickness (CCT) via a Pachmate hand-held pachymeter (Exton PA, USA). Cirrus OCT of the ONH and macula (Carl Zeiss Meditec Inc, Dublin, California, USA) was performed.
Due to the current clinical practice patterns, SAP was performed using 24–2 Humphrey Field Analyzer (HFA) Swedish Interactive Threshold Algorithm (SITA) standard 24–2 test (Zeiss). This was followed by the OCCP central 10-degree protocol. Given normal visual fields for the 24–2 SAP, data for 10-degree OCCP was collected for formation of a normative database.
Online Circular Contrast Perimetry
Set Up
Six computers in different rooms, all with screen size 24-inches diagonally (white temperature at 6500K, gamma set at 2.2 and resolution of 1920 × 1080 pixels), were used to operate the OCCP test. The OCCP application automatically resizes for varying screen sizes. It also guides the user through an interactive screen calibration process to provide consistency in display. However, for the purposes of this study, the computers were calibrated with a SpyderX screen photometer (Datacolor, Lucerne, Switzerland), with background screen luminance set at 224 cd/m2 output.
Environment standardizations included a dark room with lighting solely from the computer monitor, minimal background noise and computers turned on 15 minutes prior to OCCP testing to ensure consistency of screen brightness and adaptation. All monitors were cleaned before use.12
Testing Procedure
Explanations were given to all participants regarding the process of perimetric assessment including test requirements, instructions and that a trained orthoptist would be supervising them throughout. Participants were then seated at the desk facing the computer monitor and given 10 minutes to adapt to the darkened room before commencing the test. Users were guided to the correct position which included head height and distance by the OCCP program by a trained Orthoptist. Participants completed OCCP without physical constraints or specialized equipment to support head position. Refractive correction was worn for both forms of perimetry at a strength used for the appropriate viewing distance (for OCCP this was similar to their correction for reading distance).
Application Description
The OCCP test is built on a python-based web application and hosted on Azure (Microsoft, Redmond US), with tailored database integrity and high-security architecture. Interactive JavaScript code was used to create the 10-degree testing strategy.
A full description of the OCCP methodology for assessing perimetry has been outlined previously.19–21 In brief, OCCP utilizes flickering circular targets to assess visual sensitivity. These targets are similar to those in Pulsar perimetry (Haag-Streit International, Bern, Switzerland) with the same level of contrast in all radial directions, to avoid stimulation of those cells that selectively respond to a given orientation, but differ from Pulsar spots by being smaller in size and of consistent contrast throughout the spatial extent of the target despite a thin rim of contrast reduction at the peripheral target edge.28,29
Target size, spatial frequency, type, background luminance and flicker rate have all been carefully chosen to maximize consistency despite differences in computer screen output displays and testing environments.30 These parameters have been chosen based on critical review of the literature, our initial pilot work and subsequent refinement based on use in our previous publications.21,31–33
Targets consist of concentric sinusoidal contrast rings (Figure 1A). The bright peaks have the same luminance as the background monitor, while the dark troughs determine the difficulty level of the target. On flicker, these targets alternate with their inverse image (with dark troughs replacing bright peaks, and vice versa). For central 10-degree perimetry the targets are 2.8 degrees in extent and positioned around fixation to map out 52 loci over 10 degrees of visual angle at 2-degree intervals, consistent with standard perimetry machines (Figure 1B).34,35 To correct for the flat computer screen trigonometry is used to place the test loci relative to the fixation target. Targets are present for 360 milliseconds with three counterphase flicker cycles each lasting 60 milliseconds and utilize sinusoidal contrast with spatial frequency 0.5 cycles/degree and temporal counter phase flickering at 9 hertz.
 |
Figure 1 OCCP (Online Circular Contrast Perimetry) test settings. (A) Flickering test target (B). Map of central 10-degree perimetry loci with proposed magnification to peripheral loci. The dark grey homogenous circles are diagrammatic representation of where test targets may appear – they are not present during the live test. (C) Sequence of target presentation: targets appear for 3 counterphase flicker cycles lasting 360 ms, contrast is graded at the start/end of target presentation. ms: millisecond. Figure adapted from British Journal of Ophthalmology, Alawa et al, Volume 105. Pages 440-444, copyright 2021 with permission from BMJ Publihsing Group Ltd,36 (D) Fixation target: spinning golden star. (E) Blind spot localization optimizes viewing distance. |
Similar to Frequency Doubling Perimetry (FDP; Welch Allyn, Skaneateles, NY and Carl Zeiss Meditec)37 contrast is ramped up and down at beginning and end of target presentations respectively (Figure 1C).38,39 Unlike FDP, in which light and dark bands vary around a mean of background luminance, target light-band color was fixed to the light grey background while dark-band varied to achieve the desired contrast. This is similar to a luminance pedestal flicker for stimulus decrements.40 A luminance pedestal flicker is chosen to minimize the number of greyscale colors in stimulus and background design for consistency of display parameters with gamma correction.
Consistency despite differences in computer screen size display is based on calculating the appropriate viewing distance trigonometrically for each screen size to ensure consistent visual angle in assessment. The background luminance of 224 cd/m2 is high enough that effects of pupil size and lens yellowing on retinal illumination can be expected to be similar to those for FDT.30
Target presentations are time-adapted to the patient’s response time to account for variability in user reflex rates.41 There is also an inbuilt random delay to prevent rhythmic responses. A continuously spinning golden star (3.5 degrees of visual angle, Figure 1D) is used as a fixation target, located at the screen center throughout the test.
Viewing distance is maintained without a brace by three mechanisms. Firstly, correct viewing distance is based on the monitor size which is assessed by the web application; the user is advised to sit at this distance by the application. On a 24-inch screen, this resulted in a viewing distance of 40 cm. Secondly, at the beginning of the test, the user’s blind spot is mapped out using a 4x10-degree grid and testing small targets. If the blind spot is detected too far from the fixation target, instructions are provided for the user to move forward; on the contrary, if the user is detected too close to fixation, the user is informed to move backwards (Figure 1E). Thirdly, the computer’s webcam also provides continuous monitoring of head position throughout the test with a 1 second refresh rate by using machine learning (ML) for facial detection, but not recognition. This allows for deviations of facial position monitoring of up to 15% before pausing the test and asking the user to reposition to the starting position. While blind spot localization may vary between individuals, when these three mechanisms are used in combination with ML-face detection they maintain accurate viewing distance and head positioning.
OCCP utilizes a-priori probability density functions with a 4/2 dB staircase for its testing algorithm.42 Relative luminance can be calculated for each 256-greyscale level, based on the Web Content Accessibility Guidelines standards for relative luminance calculation.43 By comparing peaks and troughs of targets, contrast could be calculated using the Michaelson formula:44

where RL1 is the light band maximum relative luminance and RL2 is the dark band minimum. Similar to FDP, the following formula was used to convert contrast to relative decibels:45

The dynamic range of sample spot intensity ranged from 0 to 38 rdB in line with HFA and other portable perimetry devices, which is considered adequate for evaluating human threshold estimates across the visual field.13,46
Patients are instructed to click their mouse when a target appears in their peripheral vision. False positives are recorded when subjects click outside of the accepted response window. False negatives are determined by a similar method utilized in SAP.47 Fixation losses are assessed by small targets shown within the detected physiological blind spot.48
Guidance is provided through the test by the web application’s pre-programmed verbal instructions. All voice prompts are provided in English; however, OCCP is currently being developed for delivery in several languages.
Study Outcomes
Main outcomes include mean sensitivity per point and per eye and mean deviation (MD) for OCCP and SAP; OCT measurements of average, superior and interior RNFL thickness; mean, superior and inferior macular ganglion cell complex and inner plexiform layer (GCC + IPL) thickness.
Data Analysis
Statistical analysis was conducted using Statistical Package for Social Sciences (SPSS, Inc., 205 Chicago, IL, USA) and Real Statistics in Excel 2016 (Microsoft 365). Statistical significance was set at p < 0.05, with adjustment by the Bonferroni method. Normality of the data was assessed using the Shapiro–Wilks statistic. Continuous variables were presented as mean (±SD).
Clinical data for the cohort was collected, as were perimetric data for 24–2 SAP and 10-degree OCCP including pointwise sensitivities, reliability and global indices. Any unreliable eyes were excluded from graphical analysis.
To compare the central 10 degrees of SAP to OCCP, 24–2 SAP data was mapped onto a central 10–2 map as follows. Values from loci 21, 22, 29, 30 of the 24–2 SAP were directly correlated to loci 13, 16, 37, 40 of the 10-degree OCCP respectively (Figure 2). In conjunction with these values that fall within the central 10 degrees, loci that were outside of this range were used to calculate the remaining loci to reach 52 points. As adjacent loci within the 10-degree OCCP perimetry are separated by 2 degrees and known 24–2 loci are 6 degrees apart, ratios of thirds were used to determine the loci in between known values. The average of the vertical and horizontal calculations was used in cases for loci that were diagonal to known 24–2 values.
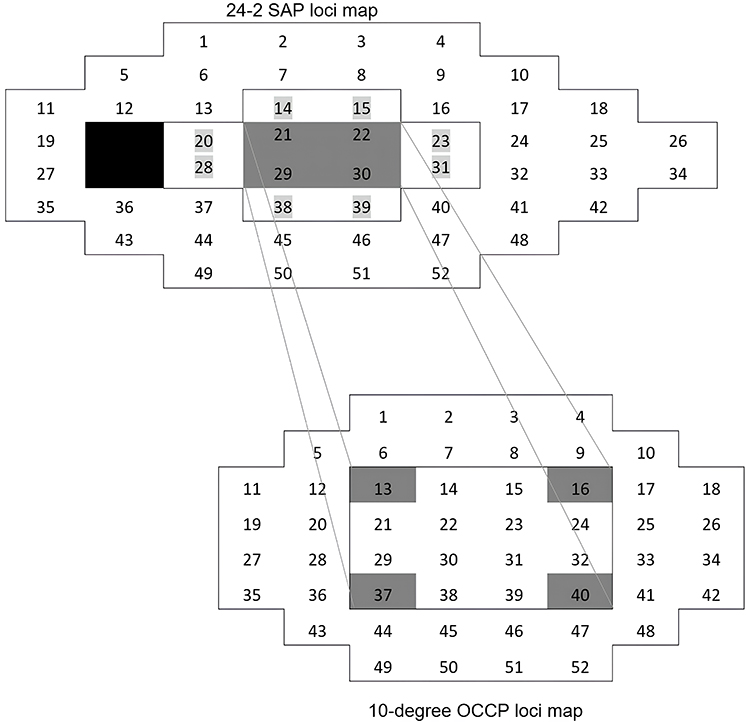 |
Figure 2 Mapping the center of 24–2 SAP (Standard Automated Perimetry) loci map onto a 10-degree OCCP (Online Circular Contrast Perimetry) loci map. |
To determine if there is a relationship between age and CS threshold, linear regression analysis was performed.
To compare sensitivity thresholds between SAP and OCCP, SAP decibels were converted to logCS to allow comparison between perimetric methods, where CS (contrast sensitivity) is the inverse of contrast threshold.45 SAP contrast is defined as (peak-background luminance)/background luminance. Decibels are given as 25+10logCS for white-on-white perimetry utilizing Goldmann size III stimuli.45 OCCP sensitivities were provided in logCS using the Michaelson formula.
MD for each OCCP result per eye was calculated using a standardized formula.49 The mean sensitivity per eye and per point, MD and 95% limits of agreement (LoA) between the two tests were calculated using Bland-Altman analyses. Linear regression analysis was used to display the change in agreement with the mean for CS thresholds for OCCP and SAP in log units.45
Results
Table 1 presents the patient characteristics, OCCP and SAP test parameters. In total, 50 eyes from 50 patients were included. The mean participant age was 65 ± 13 years. Two eyes (4%) were excluded due to unreliable SAP results and three eyes (6%) were excluded due to unreliable OCCP results without any crossover. With a chi-square statistic of 0.21 and corresponding p-value >0.05, there was no significant difference in global reliability criteria or reliability indices between OCCP and SAP tests. There was a significant difference in duration of tests.
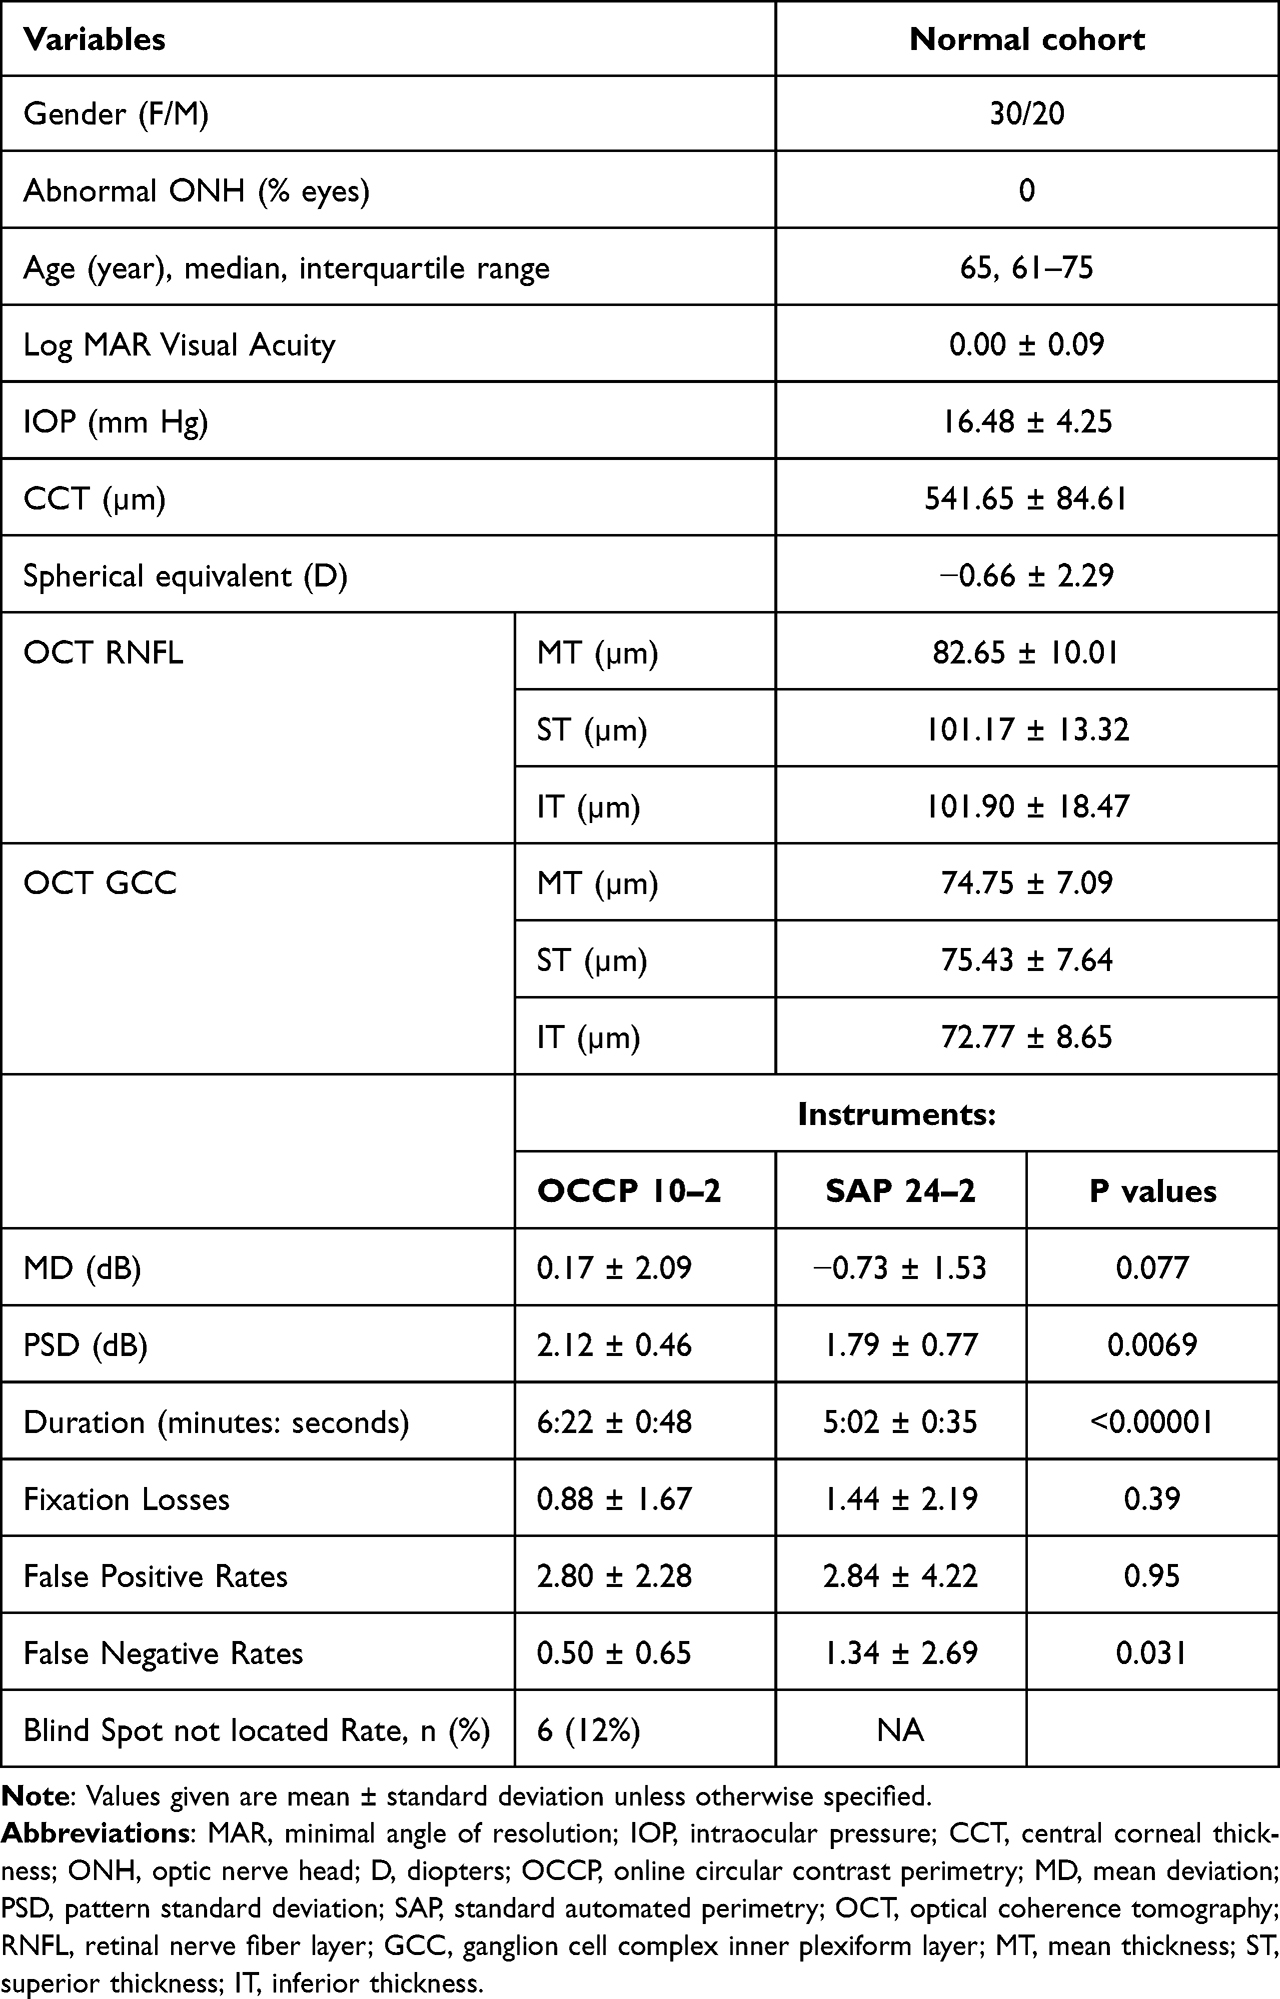 |
Table 1 Patient Characteristics and Perimetric Test Results |
The mean retinal sensitivity thresholds (LogCS) across eccentricities comparing OCCP with SAP are presented graphically in Figure 3. OCCP had slightly greater increase in sensitivity threshold with eccentricity than SAP.
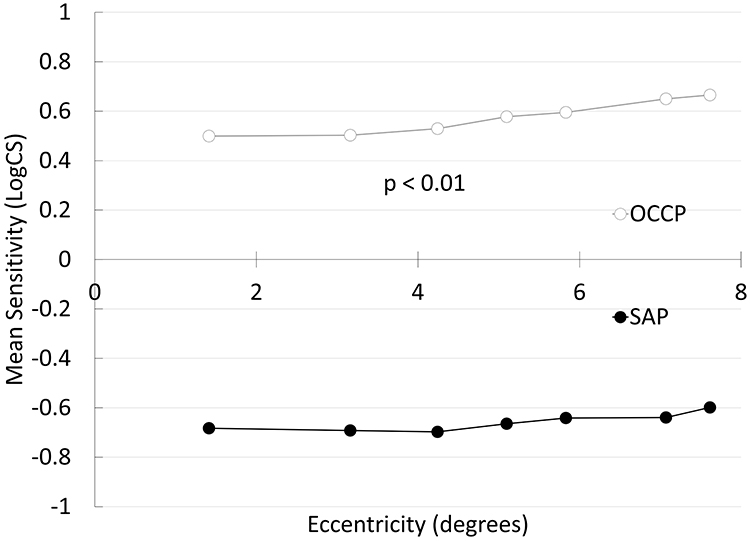 |
Figure 3 OCCP (Online Circular Contrast Perimetry) vs SAP (Standard Automated Perimetry) log contrast sensitivity thresholds across eccentricity. |
Figure 4 displays change in mean sensitivity results of OCCP and SAP with age. A similar decline with age is observed for both testing modalities. R2 values were comparable, with a value of 0.18 for the SAP trendline and 0.21 for the OCCP trendline.
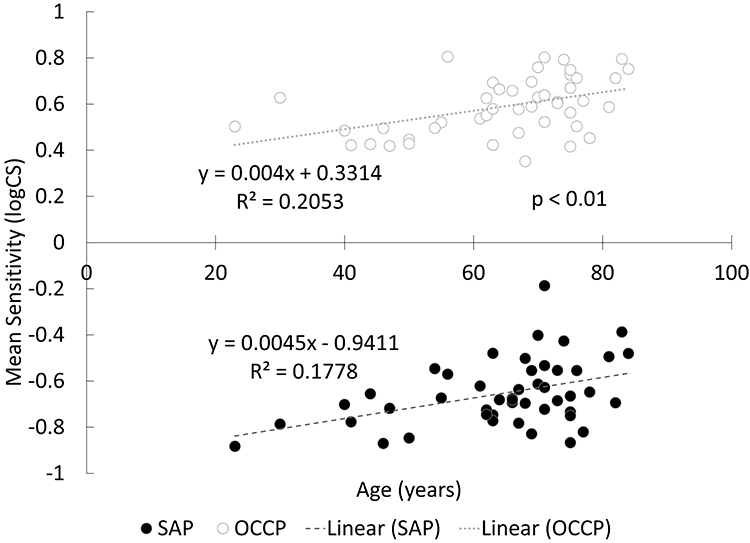 |
Figure 4 Mean Sensitivity of OCCP (Online Circular Contrast Perimetry) and SAP (Standard Automated Perimetry) reduces with age. |
Figure 5 displays Bland-Altman plots comparing OCCP to SAP. OCCP had a greater pointwise sensitivity compared to SAP by 1.24 log units (95% CI 1.23 to 1.26); the 95% limits of agreement (LoA) ranged from 1.14 to 1.34 (Figure 5A). Per-eye sensitivity for OCCP was also greater by 1.25 log units (95% CI 1.22 to 1.29) with 95% LoA from 1.00 to 1.51 (Figure 5B). OCCP had a greater MD compared to SAP by 0.63 (95% confidence interval (CI) −0.05 to 1.31); the 95% LoA ranged from −3.90 to 5.16 (Figure 5C).
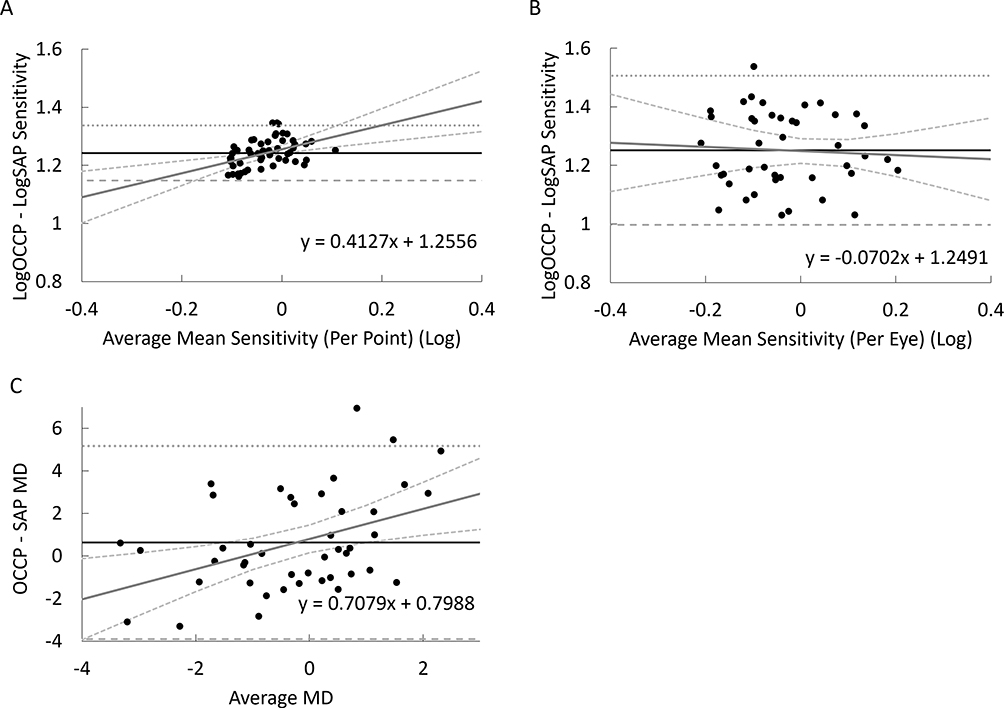 |
Figure 5 Bland-Altman plots with mean differences (Bias) represented with the continuous horizontal line and 95% limits of agreement with the dashed and dotted lines (Bias ± 1.96SD). Log contrast sensitivity thresholds are displayed with linear regression curve. (A) Mean sensitivity (per point). (B) Mean sensitivity (per eye). (C) Mean deviation. |
Discussion
This study established a normative database for central 10-degree OCCP from a cohort of normal patients. Future study and application of 10-degree online perimetry will build upon this, as parameters including MD and PSD scores as well as total and pattern deviation plots can be used for diagnosis and monitoring of eye diseases such as glaucoma.
The mean sensitivity per loci of central 10-degree OCCP demonstrated similarities to traditional perimetry when mapped against SAP including adherence to a physiological hill of vision as demonstrated by Figure 3. OCCP sensitivity reduces with eccentricity more than SAP, which implies that a magnification correction factor will be useful to provide consistent normal sensitivities at each locus – as outlined in Figure 1B.50 These findings are consistent with our previous normative study for 24–2 OCCP.21 24–2 OCCP is comparable to SAP in distinguishing diseased states from normal eyes, particularly in diagnosing glaucoma.19
Test sensitivity decreases with age in OCCP similar to traditional SAP and FDP.51 In this cohort, an increase of 0.040 logCS per decade is observed for OCCP which is similar to the 0.045 logCS per decade for SAP. The R2 values of these regression curves are similar suggesting consistency in the perimetry methods.
Bland Altman analysis revealed consistent biases in mean sensitivities between OCCP and SAP. The difference between pointwise sensitivity for OCCP and SAP increased with increasing eccentricity, consistent with findings from Figure 3. Good agreement for MD results between OCCP and SAP was found which is consistent with previous studies evaluating computer-based OCCP and in tablet-based perimetry.13,19
On average, the OCCP test duration was 1:20 (minutes: seconds) longer than SAP, in contrast to our recent studies which found similar test durations between OCCP and SAP.19,20 This discrepancy is likely a consequence of the formal double staircase algorithm that was used to determine the normal thresholds at each test locus.21 Now that this has been determined, probability density functions (PDFs) that are an essential component of modern perimetry such as SITA algorithms42,52,53 can be used to more rapidly determine thresholds. Utilizing PDFs in future 10-degree algorithms is expected to substantially reduce the test time.20
Web-based perimetry on personal devices has many benefits, including the flexibility of home-based testing, significant cost saving on equipment and hardware, more economical healthcare delivery, improved user experience, access in low-resource settings, telemedicine clinics in situations where access is limited or restricted (eg, coping with post-pandemic clinic blowouts), opportunities for more frequent testing, collaborative data sharing between clinics and electronic medical record integration.17,18 Also, because it can be used conveniently at home, glaucoma screening via online perimetry may become more widespread. As one of the leading causes of irreversible blindness, glaucoma remains alarmingly underdiagnosed; even in developed nations, the rate of undiagnosed glaucoma exceeds 50%.4 The reasons contributing to this are multifactorial. Diagnosing and managing glaucoma requires healthcare infrastructure. Patients are then required to attend an optometrist or ophthalmology practice to access care. Clinics also need to have perimetry machines available and trained staff that can operate them.10 Collectively, the limitations of conventional perimetric testing present major barriers to care and have contributed to the suboptimal screening and surveillance rates of glaucoma worldwide, both in low-income areas that lack access to care and in developed areas where healthcare systems are already over-burdened and resource limited.
Regular at-home testing decreases the mean absolute error of serial field tests18 thereby enabling earlier and more accurate detection of disease progression. Home-based perimetry would expedite clinic appointments, limit unnecessary travel time, as well as reduce waiting room numbers and the costs associated with clinic visits. According to current recommendations, patients should undergo perimetry six times in the first two years following diagnosis to establish a baseline, followed by six-monthly or yearly reviews.54,55 Achieving these targets is challenged by several factors including the increased burden on healthcare service providers as well as limited access to perimetry, which has been especially apparent during and following the COVID-19 pandemic.18,56 Modern clinical care has been forced to evolve in the post-pandemic era to a hybrid model of clinic and home-based case; it is therefore anticipated that intelligent use of home health-monitoring technology will extend to perimetry.
It has been demonstrated that anxiety caused by the current perimetry machines has a negative impact on test performance, patient engagement and adherence.57 In comparison, OCCP was shown to provide an improved user experience over SAP with lower test-related anxiety.20 By improving user experience, this may promote both increased patient engagement and overall satisfaction. Potential outcomes may include earlier disease detection, particularly in younger age groups, and delayed disease progression from more frequent monitoring in those with established disease and at higher risk.18,58
There are other studies which evaluate perimetry performed on different devices.9,12–15,18,36,58–60 Tablet-based perimetry has been shown to have good test-repeatability and reliability yet there are limitations in gaze tracking accuracy and spatiotemporal precision.13,18 The hardware requirements for tablet perimetry may also be a limitation as many patients do not own a tablet; this would also apply to perimetry delivered via virtual reality headsets.14,15 Virtual reality headsets have significant costs which is a barrier to widespread adoption of home perimetry. Also, reported tolerability varies as for example, a recent cohort of 126 patients showed that 46% preferred free-standing to head-mounted perimetry devices.61 Critically, OCCP will work on any computer (laptop or desktop) or tablet with internet access.
When considering the widespread implementation of web-based perimetry there are various logistical challenges to overcome. In particular, patients at home will have differences in screen size and luminance which may influence test reliability.60
With varying screen sizes, viewing distance must be determined by the application based on the screen size, and altered in accordance to ensure a consistent viewing angle and head position. The application optimizes user positioning via continuous webcam monitoring as well as blind spot localization but also detects monitor size in order to calculate viewing distance. Luminance varies among different monitors and the web application will standardize this by performing greyscale calibration and adjusting brightness, contrast and white temperature before perimetry begins.62 More studies are required to assess the feasibility of performing OCCP tests on monitors of varying sizes and alternate devices.
This study has several limitations. Recruitment of participants was from a single, subspecialist ophthalmology practice and although there were multiple sites, selection bias may occur. In the recruitment of this study, subjects had a mean age of 65 with few participants less than 40 years of age. This makes it difficult to establish normal for the younger age ranges compared to the older ages; linear regression calculations may need to be modified based on future perimetric results of normal younger individuals. In the process of constructing a normative database, it is acknowledged that a larger sample size is generally advantageous. However, drawing upon insights gained from previous early validation studies of visual field tests and performing a power calculation using effect sizes determined by our previous 24-degree OCCP studies resulted in a sample size of 50 for this study.
More studies are required to assess test–retest consistency of OCCP, and it would be interesting to know how OCCP detects perimetric changes for individuals with lower visual acuity given that in this study, participants with very poor visual acuity (logMAR > 0.7) were excluded.
Ideally in this study 10–2 SAP would have been useful in addition to 24–2 SAP. Unfortunately, this was not possible due to restrictions of conventional clinical practice patterns in our cohort. This would have been a larger problem for a non-normative cohort than a normative cohort, who are confirmed normal by a range of clinical evaluations and investigations including 24–2 SAP. The system of mapping central 10 degrees from the 24–2 grid, outlined in Figure 2, has provided sufficient sampling for this normative evaluation. In interpreting the results however, it is important to exercise caution in statistical comparison due to the two different strategies. Future studies evaluating the sensitivity of central 10-degree OCCP to detect and monitor glaucomatous scotomata will benefit from direct comparison to 10–2 SAP.
In order to assure ideal positioning and utilization of the online application, this study was carried out in a clinical setting under careful supervision by qualified staff, just like conventional perimetry. Thorough pre-test education of participants is crucial for the effectiveness of home monitoring, and initial testing should be carried out in a monitored clinical setting. Also, the web application’s messaging needs to be clear and directive. Future research will assess OCCP reliability when conducted at home in unsupervised conditions as well as the clinical significance of reliability indices.
Overall, the inclusion of central 10-degree testing within the OCCP web application is a step towards wholistic perimetry services via personal computers. The establishment of a normative database will allow further studies to assess the utility of 10-degree OCCP and serve as a guide for others. It is hoped that over time, online perimetry will become a useful, convenient, and cost-effective option for providing glaucoma surveillance.
Disclosure
Y. Chen; None, J. Meyerov; None, S. Skalicky, Director of Eyeonic Pty Ltd, which owns International Patent WO2021051162 (O, P).
References
1. Kingman S. Glaucoma is second leading cause of blindness globally. Bull World Health Organ. 2004;82(11):887–888.
2. Kapetanakis VV, Chan MPY, Foster PJ, Cook DG, Owen CG, Rudnicka AR. Global variations and time trends in the prevalence of primary open angle glaucoma (POAG): a systematic review and meta-analysis. Br J Ophthalmol. 2016;100(1):86–93. doi:10.1136/bjophthalmol-2015-307223
3. George R, Ve RS, Vijaya L. Glaucoma in India: estimated burden of disease. J Glaucoma. 2010;19(6):391–397. doi:10.1097/IJG.0b013e3181c4ac5b
4. Keel S, Xie J, Foreman J, et al. Prevalence of glaucoma in the Australian National eye health survey. Br J Ophthalmol. 2019;103(2):191–195. doi:10.1136/bjophthalmol-2017-311786
5. Sharma P, Sample PA, Zangwill LM, Schuman JS. Diagnostic tools for glaucoma detection and management. Surv Ophthalmol. 2008;53:S17–32. doi:10.1016/j.survophthal.2008.08.003
6. Hood DC, Raza AS, de Moraes CG, Liebmann JM, Ritch R. Glaucomatous damage of the macula. Prog Retin Eye Res. 2013;32:1–21. doi:10.1016/j.preteyeres.2012.08.003
7. Hangai M, Ikeda HO, Akagi T, Yoshimura N. Paracentral scotoma in glaucoma detected by 10-2 but not by 24-2 perimetry. Jpn J Ophthalmol. 2014;58(2):188–196. doi:10.1007/s10384-013-0298-9
8. Aboobakar IF, Friedman DS. Home monitoring for glaucoma: current applications and future directions. Semin Ophthalmol. 2021;36(4):310–314. doi:10.1080/08820538.2021.1896759
9. Jones PR, Smith ND, Bi W, Crabb DP. Portable perimetry using eye-tracking on a tablet computer-a feasibility assessment. Transl Vis Sci Technol. 2019;8(1):17. doi:10.1167/tvst.8.1.17
10. Chauhan BC, Garway-Heath DF, Goñi FJ, et al. Practical recommendations for measuring rates of visual field change in glaucoma. Br J Ophthalmol Apr. 2008;92(4):569–573. doi:10.1136/bjo.2007.135012
11. Chew SS, Kerr NM, Wong AB, Craig JP, Chou CY, Danesh-Meyer HV. Anxiety in visual field testing. Br J Ophthalmol. 2016;100(8):1128–1133. doi:10.1136/bjophthalmol-2015-307110
12. Schulz AM, Graham EC, You Y, Klistorner A, Graham SL. Performance of iPad-based threshold perimetry in glaucoma and controls. Clin Exp Ophthalmol. 2018;46(4):346–355. doi:10.1111/ceo.13082
13. Kong YX, He M, Crowston JG, Vingrys AJ. A comparison of perimetric results from a tablet perimeter and Humphrey field analyzer in glaucoma patients. Transl Vis Sci Technol. 2016;5(6):2. doi:10.1167/tvst.5.6.2
14. Tsapakis S, Papaconstantinou D, Diagourtas A, et al. Visual field examination method using virtual reality glasses compared with the Humphrey perimeter. Clin Ophthalmol. 2017;11:1431–1443. doi:10.2147/opth.S131160
15. Deiner MS, Damato BE, Ou Y. Implementing and monitoring at-home virtual reality oculo-kinetic perimetry during COVID-19. Ophthalmology. 2020;127(9):1258. doi:10.1016/j.ophtha.2020.06.017
16. Mees L, Upadhyaya S, Kumar P, et al. Validation of a head-mounted virtual reality visual field screening device. J Glaucoma. 2020;29(2):86–91. doi:10.1097/ijg.0000000000001415
17. Ford BK, Angell B, Liew G, White AJR, Keay LJ. Improving patient access and reducing costs for glaucoma with integrated hospital and community care: a case study from Australia. Int J Integr Care. 2019;19(4):5. doi:10.5334/ijic.4642
18. Jones PR, Campbell P, Callaghan T, et al. Glaucoma home monitoring using a tablet-based visual field test (Eyecatcher): an assessment of accuracy and adherence over 6 months. Am J Ophthalmol. 2021;223:42–52. doi:10.1016/j.ajo.2020.08.039
19. Meyerov J, Deng Y, Busija L, Bigirimana D, Skalicky SE. Online circular contrast perimetry: a comparison to standard automated perimetry. Asia Pac J Ophthalmol. 2023;12(1):4–15. doi:10.1097/apo.0000000000000589
20. Meyerov J, Deng Y, Busija L, Skalicky SE. Circular contrast perimetry via web application: a patient appraisal and comparison to standard automated perimetry. Ophthalmol Sci. 2022;2(3):100172. doi:10.1016/j.xops.2022.100172
21. Skalicky SE, Bigirimana D, Busija L. Online circular contrast perimetry via a web-application: optimising parameters and establishing a normative database. Eye. 2022;1–7. doi:10.1038/s41433-022-02085-4
22. Jones PR. An open-source static threshold perimetry test using remote eye-tracking (Eyecatcher): description, validation, and preliminary normative data. Transl Vis Sci Technol. 2020;9(8):18. doi:10.1167/tvst.9.8.18
23. Murray IC, Fleck BW, Brash HM, Macrae ME, Tan LL, Minns RA. Feasibility of saccadic vector optokinetic perimetry: a method of automated static perimetry for children using eye tracking. Ophthalmology. 2009;116(10):2017–2026. doi:10.1016/j.ophtha.2009.03.015
24. Razeghinejad R, Gonzalez-Garcia A, Myers JS, Katz LJ. Preliminary report on a novel virtual reality perimeter compared with standard automated perimetry. J Glaucoma. 2021;30(1):17–23. doi:10.1097/ijg.0000000000001670
25. Gedde SJ, Vinod K, Wright MM, et al. Primary open-angle glaucoma preferred practice pattern®. Ophthalmology. 2021;128(1):P71–p150. doi:10.1016/j.ophtha.2020.10.022
26. Hoddapp RKP E, Anderson DR. Clinical Decision in Glaucoma. C.V. Mosby; 1993.
27. Chylack LT Jr, Wolfe JK, Singer DM, et al. The lens opacities classification system III. The longitudinal study of cataract study group. Arch Ophthalmol. 1993;111(6):831–836. doi:10.1001/archopht.1993.01090060119035
28. Zeppieri M, Brusini P, Parisi L, Johnson CA, Sampaolesi R, Salvetat ML. Pulsar perimetry in the diagnosis of early glaucoma. Am J Ophthalmol. 2010;149(1):102–112. doi:10.1016/j.ajo.2009.07.020
29. Gonzalez-Hernandez M, Garcia-Feijo J, Sanchez Mendez M, Gonzalez de la Rosa M. Combined spatial, contrast, and temporal functions perimetry in mild glaucoma and ocular hypertension. Eur J Ophthalmol. 2004;14(6):514–522. doi:10.5301/ejo.2008.2727
30. Swanson WH, Dul MW, Horner DG, Liu T, Tran I. Assessing spatial and temporal properties of perimetric stimuli for resistance to clinical variations in retinal illumination. Invest Ophthalmol Vis Sci. 2014;55(1):353–359. doi:10.1167/iovs.13-11640
31. Swanson WH, Dul MW, Fischer SE. Quantifying effects of retinal illuminance on frequency doubling perimetry. Invest Ophthalmol Visual Sci. 2005;46(1):235–240. doi:10.1167/iovs.04-0264
32. Anderson RS, Redmond T, McDowell DR, Breslin KM, Zlatkova MB. The robustness of various forms of perimetry to different levels of induced intraocular stray light. Invest Ophthalmol Vis Sci. 2009;50(8):4022–4028. doi:10.1167/iovs.08-2934
33. Horner DG, Dul MW, Swanson WH, Liu T, Tran I. Blur-resistant perimetric stimuli. Optom Vis Sci. 2013;90(5):466–474. doi:10.1097/OPX.0b013e31828fc91d
34. Adam Pen Heijl VMP, Ben B. The Field Analyzer Primer: Effective Perimetry. Carl Zeiss Meditec; 2012.
35. Aggarwal A, Chhabra K, Kaur P, Singh K, Khosa I, Bansal P. Automated achromatic perimetry. Oman J Ophthalmol. 2018;11(1):3–10. doi:10.4103/ojo.OJO_28_2017
36. Alawa KA, Nolan RP, Han E, et al. Low-cost, smartphone-based frequency doubling technology visual field testing using a head-mounted display. Br J Ophthalmol. 2021;105(3):440–444. doi:10.1136/bjophthalmol-2019-314031
37. Liu S, Yu M, Weinreb RN, Lai G, Lam DS, Leung CK. Frequency-doubling technology perimetry for detection of the development of visual field defects in glaucoma suspect eyes: a prospective study. JAMA Ophthalmol. 2014;132(1):77–83. doi:10.1001/jamaophthalmol.2013.5511
38. Johnson CA, Cioffi GA, Van Buskirk EM. Frequency doubling technology perimetry using a 24--2 stimulus presentation pattern. Optom Vis Sci. 1999;76(8):571–581. doi:10.1097/00006324-199908000-00026
39. Warren DE, Thurtell MJ, Carroll JN, Wall M. Perimetric evaluation of saccadic latency, saccadic accuracy, and visual threshold for peripheral visual stimuli in young compared with older adults. Invest Ophthalmol Vis Sci. 2013;54(8):5778–5787. doi:10.1167/iovs.13-12032
40. Anderson AJ, Vingrys AJ. Interactions between flicker thresholds and luminance pedestals. Vision Res. 2000;40(19):2579–2588. doi:10.1016/s0042-6989(00)00121-8
41. Mulholland PJ, Redmond T, Garway-Heath DF, Zlatkova MB, Anderson RS. Spatiotemporal summation of perimetric stimuli in early glaucoma. Invest Ophthalmol Vis Sci. 2015;56(11):6473–6482. doi:10.1167/iovs.15-16921
42. Bengtsson B, Olsson J, Heijl A, Rootzén H. A new generation of algorithms for computerized threshold perimetry. SITA. Acta Ophthalmol Scand. 1997;75(4):368–375. doi:10.1111/j.1600-0420.1997.tb00392.x
43. WCAG. WCAG definition of relative luminance. Available from: https://www.w3.org/WAI/GL/wiki/Relative_luminance.
44. Campbell FW, Green DG. Optical and retinal factors affecting visual resolution. J Physiol. 1965;181(3):576–593. doi:10.1113/jphysiol.1965.sp007784
45. Swanson WH, Horner DG, Dul MW, Malinovsky VE. Choice of stimulus range and size can reduce test-retest variability in glaucomatous visual field defects. Transl Vis Sci Technol. 2014;3(5):6. doi:10.1167/tvst.3.5.6
46. Wu Z, Guymer RH, Jung CJ, et al. Measurement of retinal sensitivity on tablet devices in age-related macular degeneration. Transl Vis Sci Technol. 2015;4(3):13. doi:10.1167/tvst.4.3.13
47. Bengtsson B, Heijl A. False-negative responses in glaucoma perimetry: indicators of patient performance or test reliability? Invest Ophthalmol Vis Sci. 2000;41(8):2201–2204.
48. Asman P, Fingeret M, Robin A, et al. Kinetic and static fixation methods in automated threshold perimetry. J Glaucoma. 1999;8(5):290–296. doi:10.1097/00061198-199910000-00003
49. Nordmann J-P, Mesbah M, Berdeaux G. Scoring of visual field measured through Humphrey perimetry: principal component varimax rotation followed by validated cluster analysis. Invest Ophthalmol Visual Sci. 2005;46(9):3169–3176. doi:10.1167/iovs.04-1214
50. Bedggood P, Prea SM, Kong YXG, Vingrys AJ. Scaling the size of perimetric stimuli reduces variability and returns constant thresholds across the visual field. J Vis. 2021;21(11):2. doi:10.1167/jov.21.11.2
51. Hermann A, Paetzold J, Vonthein R, Krapp E, Rauscher S, Schiefer U. Age-dependent normative values for differential luminance sensitivity in automated static perimetry using the Octopus 101. Acta Ophthalmol. 2008;86(4):446–455. doi:10.1111/j.1600-0420.2007.01055.x
52. Turpin A, McKendrick AM, Johnson CA, Vingrys AJ. Properties of perimetric threshold estimates from full threshold, ZEST, and SITA-like strategies, as determined by computer simulation. Invest Ophthalmol Vis Sci. 2003;44(11):4787–4795. doi:10.1167/iovs.03-0023
53. Vingrys AJ, Pianta MJ. A new look at threshold estimation algorithms for automated static perimetry. Optom Vis Sci. 1999;76(8):588–595. doi:10.1097/00006324-199908000-00028
54. National Health and Medical Research Council. NHMRC guidelines for the screening, prognosis, diagnosis, management and prevention of glaucoma Australian government. Available from: https://www.nhmrc.gov.au/guidelines-publications/cp113-cp113b.
55. Boodhna T, Crabb DP. More frequent, more costly? Health economic modelling aspects of monitoring glaucoma patients in England. BMC Health Serv Res. 2016;16(1):611. doi:10.1186/s12913-016-1849-9
56. Jayaram H, Strouthidis NG, Gazzard G. The COVID-19 pandemic will redefine the future delivery of glaucoma care. Eye. 2020;34(7):1203–1205. doi:10.1038/s41433-020-0958-1
57. Kaliaperumal S, Janani VS, Menon V, Sarkar S, Behera G, Kattamani S. Study of anxiety in patients with glaucoma undergoing standard automated perimetry and optical coherence tomography - A prospective comparative study. Indian J Ophthalmol. 2022;70(8):2883–2887. doi:10.4103/ijo.IJO_508_22
58. Prea SM, Kong GYX, Guymer RH, Vingrys AJ. Uptake, persistence, and performance of weekly home monitoring of visual field in a large cohort of patients with glaucoma. Am J Ophthalmol. 2021;223:286–295. doi:10.1016/j.ajo.2020.10.023
59. Lowry EA, Hou J, Hennein L, et al. Comparison of peristat online perimetry with the Humphrey perimetry in a clinic-based setting. Transl Vis Sci Technol. 2016;5(4):4. doi:10.1167/tvst.5.4.4
60. Tahir HJ, Murray IJ, Parry NR, Aslam TM. Optimisation and assessment of three modern touch screen tablet computers for clinical vision testing. PLoS One. 2014;9(4):e95074. doi:10.1371/journal.pone.0095074
61. Kimura T, Matsumoto C, Nomoto H. Comparison of head-mounted perimeter (imo(®)) and Humphrey field analyzer. Clin Ophthalmol. 2019;13:501–513. doi:10.2147/opth.S190995
62. Aslam TM, Murray IJ, Lai MY, Linton E, Tahir HJ, Parry NR. An assessment of a modern touch-screen tablet computer with reference to core physical characteristics necessary for clinical vision testing. J R Soc Interface. 2013;10(84):20130239. doi:10.1098/rsif.2013.0239
 © 2024 The Author(s). This work is published and licensed by Dove Medical Press Limited. The
full terms of this license are available at https://www.dovepress.com/terms
and incorporate the Creative Commons Attribution
- Non Commercial (unported, 3.0) License.
By accessing the work you hereby accept the Terms. Non-commercial uses of the work are permitted
without any further permission from Dove Medical Press Limited, provided the work is properly
attributed. For permission for commercial use of this work, please see paragraphs 4.2 and 5 of our Terms.
© 2024 The Author(s). This work is published and licensed by Dove Medical Press Limited. The
full terms of this license are available at https://www.dovepress.com/terms
and incorporate the Creative Commons Attribution
- Non Commercial (unported, 3.0) License.
By accessing the work you hereby accept the Terms. Non-commercial uses of the work are permitted
without any further permission from Dove Medical Press Limited, provided the work is properly
attributed. For permission for commercial use of this work, please see paragraphs 4.2 and 5 of our Terms.