Back to Journals » Diabetes, Metabolic Syndrome and Obesity » Volume 15
One-Hour Post-Load Plasma Glucose Levels are Associated with Early Arterial Stiffness in Subjects with Different Glucose Tolerance
Authors Wang R, Liu XL, Jia XJ, Liu Y, Lu Q
Received 29 March 2022
Accepted for publication 12 May 2022
Published 17 May 2022 Volume 2022:15 Pages 1537—1542
DOI https://doi.org/10.2147/DMSO.S368504
Checked for plagiarism Yes
Review by Single anonymous peer review
Peer reviewer comments 2
Editor who approved publication: Professor Ming-Hui Zou
Rui Wang,1 Xiao-li Liu,1 Xiao-jiao Jia,1 Yan Liu,2 Qiang Lu1
1Department of Endocrinology, The First Hospital of Qinhuangdao, Qinhuangdao, Hebei Province, People’s Republic of China; 2Medical department, The First Hospital of Qinhuangdao, Qinhuangdao, Hebei Province, People’s Republic of China
Correspondence: Qiang Lu, Email [email protected]
Objective: The purpose of this study was to explore the relationship between one-hour post-load plasma glucose levels and early arterial stiffness in subjects with different glucose tolerance.
Methods: This case-control study included 57 subjects with normal glucose tolerance, 38 subjects with pre-diabetes, and 30 subjects with type 2 diabetes. All subjects underwent an oral glucose tolerance test (OGTT) with 75 g of oral anhydrous glucose at 8:00 AM. The brachial-ankle pulse wave velocity (baPWV) was used as a surrogate marker of early arterial stiffness.
Results: baPWV was significantly higher in the diabetes group than in the normal glucose tolerance group (diabetes group: 1501.8 ± 270.4 cm/s, pre-diabetes group: 1428.6 ± 173.1 cm/s vs normal glucose tolerance group: 1368.0 ± 242.8 cm/s) (p < 0.05). baPWV was positively correlated with age (r = 0.512, p < 0.001), systolic blood pressure (SBP) (r = 0.526, p < 0.001), diastolic blood pressure (DBP) (r = 0.298, p = 0.001), fasting plasma glucose (FPG) (r = 0.213, p = 0.017), 1-h plasma glucose levels from the OGTT (r = 0.407, p < 0.001) and 2-h plasma glucose levels from the OGTT (r = 0.202, p = 0.024). When baPWV was considered as the dependent variable in a multiple regression analysis, the 1-h plasma glucose level from the OGTT maintained an independent association with baPWV (β = 23.129, 95% CI: 8.142– 38.115, p = 0.003, R2 = 0.036).
Conclusion: The present study demonstrated the presence of early arterial stiffness in diabetes. Elevated 1-hour post-load plasma glucose level is closely related to the change of arterial elasticity in diabetes.
Keywords: early arterial stiffness, brachial-ankle pulse wave velocity, post-load glucose
Introduction
Type 2 diabetes is correlated with an increased risk for atherosclerosis. Compared with non-diabetes patients, those with type 2 diabetes mellitus have higher frequency of lower extremity vascular diseases and carotid stenosis.1 Acute hyperglycemia, in particular, postprandial hyperglycemia plays a more important role in the development of atherosclerotic disease than fasting state.2 Hyperglycemia at 1-hour during oral glucose tolerance test (OGTT) is a useful tool to identify individuals at higher risk of developing type 2 diabetes and cardiovascular diseases.3 Several studies found that elevated one-hour post-load plasma glucose level correlates with early carotid atherosclerosis.4–6 Large-scale studies have proven that one-hour post-load plasma glucose was an important predictor of long-term cardiovascular events.7
Arterial elasticity value is an early parameter for evaluating atherosclerosis. Brachial-ankle pulse wave velocity (baPWV) is a unique measure of systemic arterial elasticity that is measured by brachial and tibial arterial wave analyses. Measurement of baPWV is easy and reproducible.8 baPWV is known to be a significant predictor of cardiovascular events.9 Incremental glucose peak and insulin resistance were associated with greater arterial stiffness.10–12 Studies have confirmed that one-hour post-load plasma glucose levels were associated with baPWV in subjects with normal glucose tolerance, essential hypertension or apparently healthy men.13–15 Choi et al reported that 30-minute post-load glucose level was a weak but significant determinant for baPWV.16 However, very little information is available on the relationship between one-hour post-load plasma glucose levels and baPWV in subjects with different glucose tolerance.
In this study, the baPWV was used to evaluate arterial elasticity in subjects with different glucose tolerance to explore the relationship between one-hour post-load plasma glucose levels and baPWV, since baPWV is considered to be a well-recognized marker of early arterial stiffness.
Methods
Study Design
We performed a case-control study of adults aged ≥18 years with different glucose tolerance. All subjects were of the Han ethnicity, and underwent an oral glucose tolerance test (OGTT) with 75 g of oral anhydrous glucose at 8:00 AM. Peripheral venous blood samples were taken at 0, 60, and 120 minutes after glucose loading. The exclusion criteria were as follows: 1) subjects with previous medical history of coronary artery diseases, peripheral arterial disease or cerebral stroke; 2) subjects with clinical evidence of endocrinopathy, such as Cushing’s syndrome, primary hyperaldosteronism, hyperthyroidism, hypothyroidism, etc; and 3) subjects with acute or chronic inflammation, such as flu, pneumonia, urinary infection, etc. This study was approved by the ethics committee of the First Hospital of Qinhuangdao. All subjects provided written informed consent before study initiation. The study complied with the principles of the Declaration of Helsinki.
Cases and Controls
Between January 2019 and July 2019, 57 subjects with normal glucose tolerance, 38 subjects with pre-diabetes, and 30 subjects with type 2 diabetes were enrolled in this study. The definition of glucose tolerance status was according to the criteria of the Diabetes Society of Chinese Medical Association.17 All subjects with type 2 diabetes were new-onset patients, with no prior diabetes treatment.
Anthropometric Measurements
Anthropometric measurements, including height, weight, waist circumference (WC) and blood pressure, were obtained while the subjects were wearing light clothing and no shoes. Body mass index (BMI) was calculated by dividing weight (kg) by height squared (m2). Blood pressure was measured twice with a mercury sphygmomanometer after 10 min of rest while the subjects were seated, and the average of the two measurements was used for analysis.
Laboratory Examinations
Plasma glucose levels were measured using the glucose oxidase method. Serum lipid levels were measured using enzymatic assays with an autoanalyzer (Hitachi, Tokyo, Japan). Plasma concentrations of insulin were measured by chemiluminescent immunoassay (Roche 2010 Elecsys). The following equation was used to calculate the homeostasis model assessment (HOMA)-IR index: (fasting insulin level x fasting glucose level)/22.5.
Brachial-Ankle Pulse Wave Velocity (baPWV)
The baPWV measurement was performed using an oscillometry-based device (HBP-8000, Omron, Japan) by a trained technician according to a standard protocol. Each subject rested for at least 5 minutes and then lay in the supine position with four monitoring cuffs wrapped around both ankles and upper arms. The lower edge of the cuff was 2–3 cm above the cross grain of the cubital fossa, and 1–2 cm above the malleolus medialis. The instrument was set to repeat the measurement twice, and the data of the second measurement was taken as the result. The mean values of baPWV on the left and right sides were calculated.
Statistical Analyses
All analyses were performed using the SPSS 11.5 statistical software (SPSS 11.5 for Windows; SPSS, Inc., Chicago, IL). Numerical variables were reported as mean ± standard deviation. The data with skewed distribution were ln-transformed for analysis, and expressed as median with interquartile range. Comparisons were conducted between groups using the one-way analysis of variance (ANOVA). Categorical data were reported as abnormal subjects (%), and chi-square test was used. A Pearson’s correlation coefficient was used to measure the strength of association between variables. Multiple linear regression analyses were performed to examine the relationships between glycemic variability and baPWV. A p-value <0.05 was considered as statistically significant.
Results
Age, anthropometric, biochemical and baPWV data, are presented in Table 1. There were no significant differences in gender between the three groups (p>0.05). The patients in the pre-diabetes group were significantly older compared to the diabetes group and the normal group (p<0.05). The levels of systolic blood pressure (SBP) were significantly higher in the diabetes group than in the normal group (p<0.05). The levels of fasting plasma glucose (FPG), and 1-h and 2-h plasma glucose levels from the OGTT were significantly higher in the pre-diabetes group and the diabetes group than in the normal group (p<0.05). The levels of FPG, and 1-h and 2-h plasma glucose levels from the OGTT were significantly higher in the diabetes group than in the pre-diabetes group (p<0.05). Two-h insulin levels from the OGTT were significantly higher in the pre-diabetes group than in the normal group (p<0.05). The levels of baPWV were significantly higher in the diabetes group than in the normal group (p<0.05). No significant differences were observed in any of the other variables between the three groups (p>0.05).
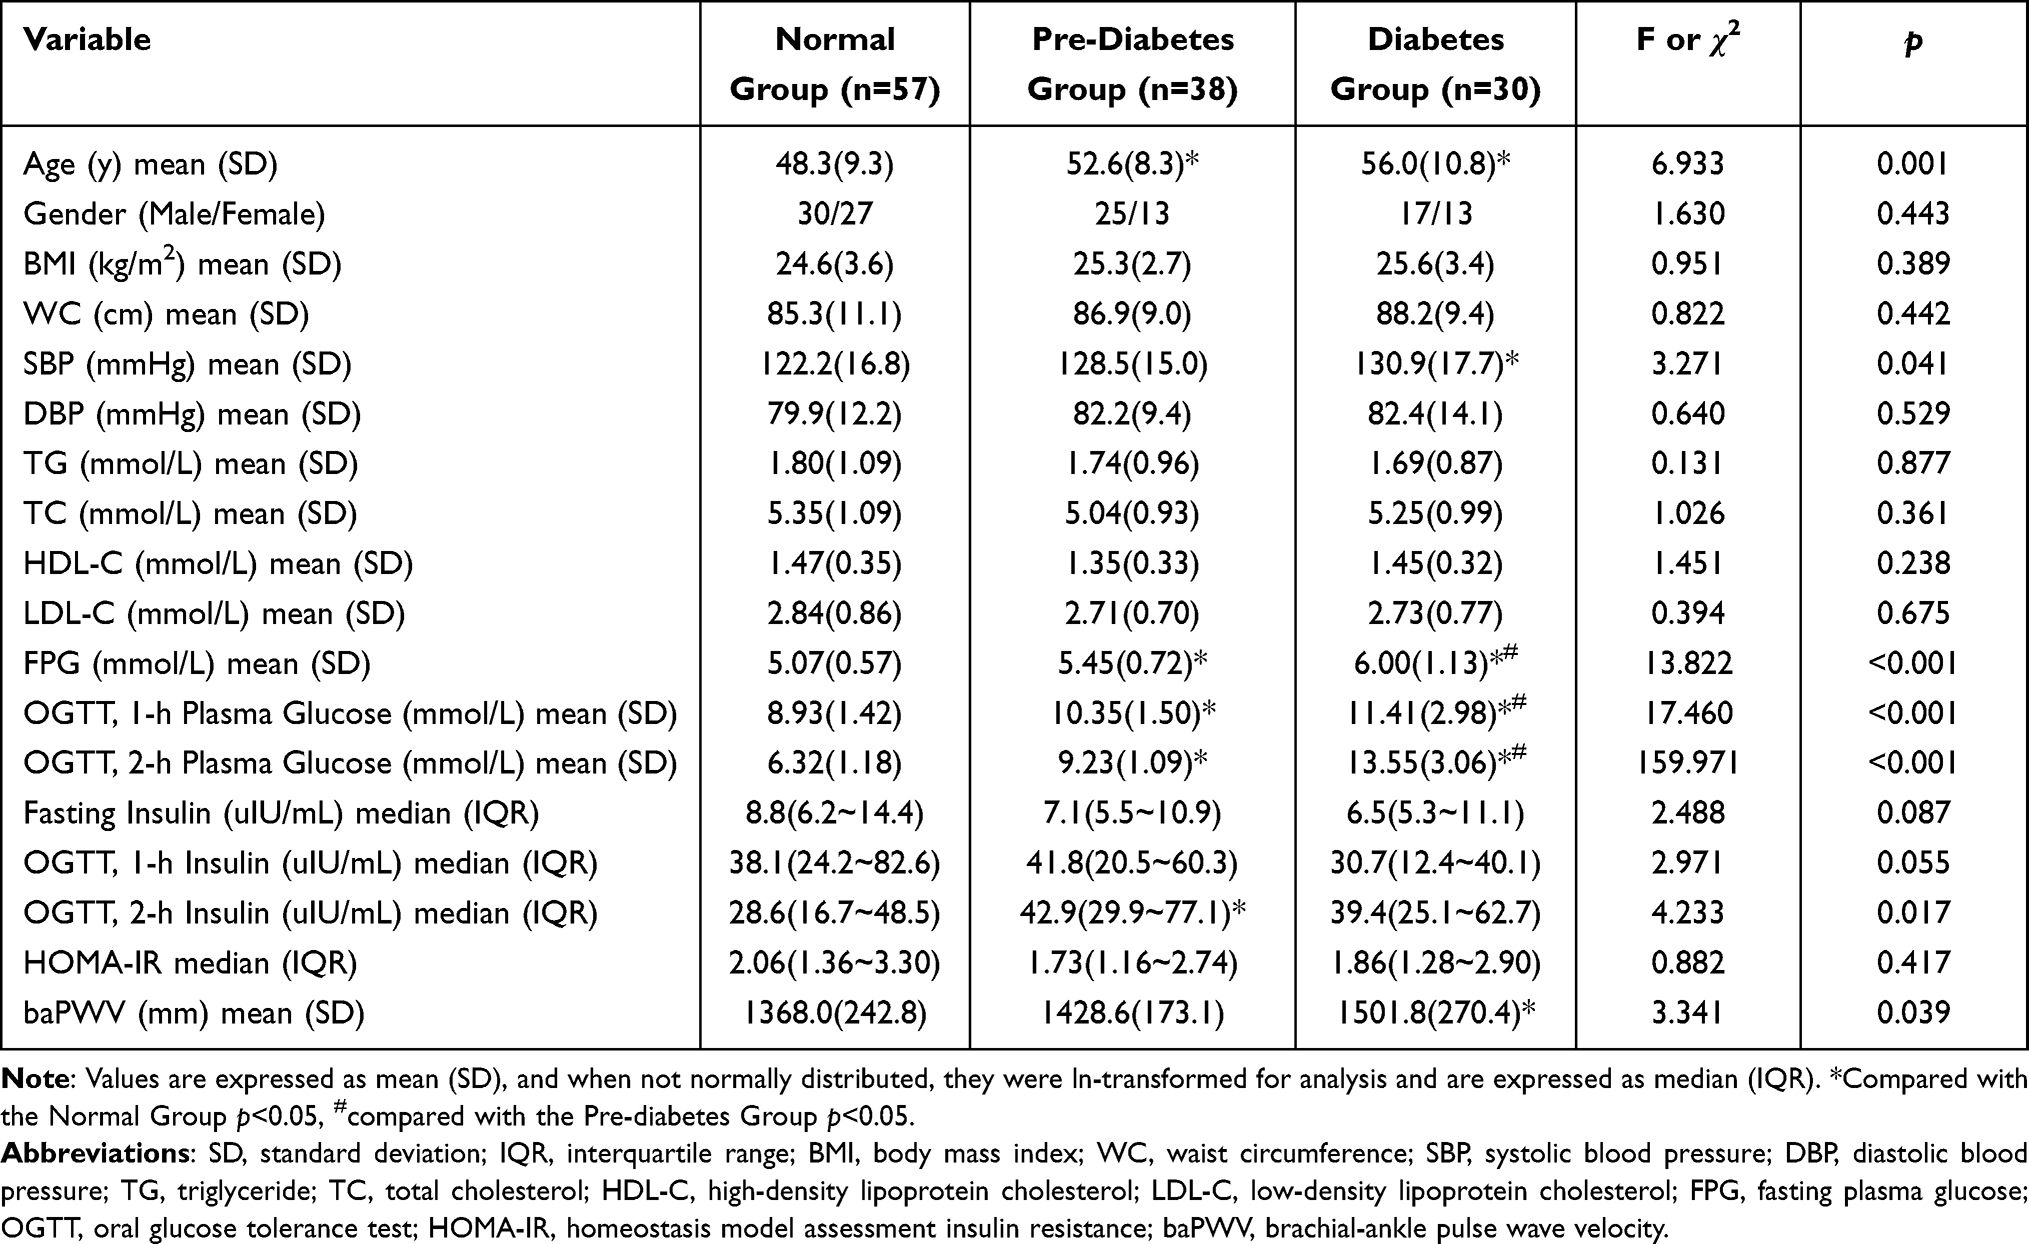 |
Table 1 Clinical and Laboratory Characteristics of the Subjects in Each Group |
The correlation coefficients between baPWV and the other variables for all the subjects are shown in Table 2. The baPWV was positively correlated with age (r=0.512, p<0.001), SBP (r=0.526, p<0.001), diastolic blood pressure (DBP) (r=0.298, p=0.001), FPG (r=0.213, p=0.017), 1-h plasma glucose levels from the OGTT (r=0.407, p<0.001) and 2-h plasma glucose levels from the OGTT (r=0.202, p=0.024). When baPWV was considered as the dependent variable in a multiple regression analysis with age, gender (males=0, females=1), BMI, WC, SBP, DBP, TG, TC, HDL-C, LDL-C, FPG, 1-h and 2-h plasma glucose levels from the OGTT and HOMA-IR as independent variables, the 1-h plasma glucose level from the OGTT maintained an independent association with baPWV (β=23.129, 95% CI: 8.142–38.115, p=0.003, R2=0.036) (Table 3).
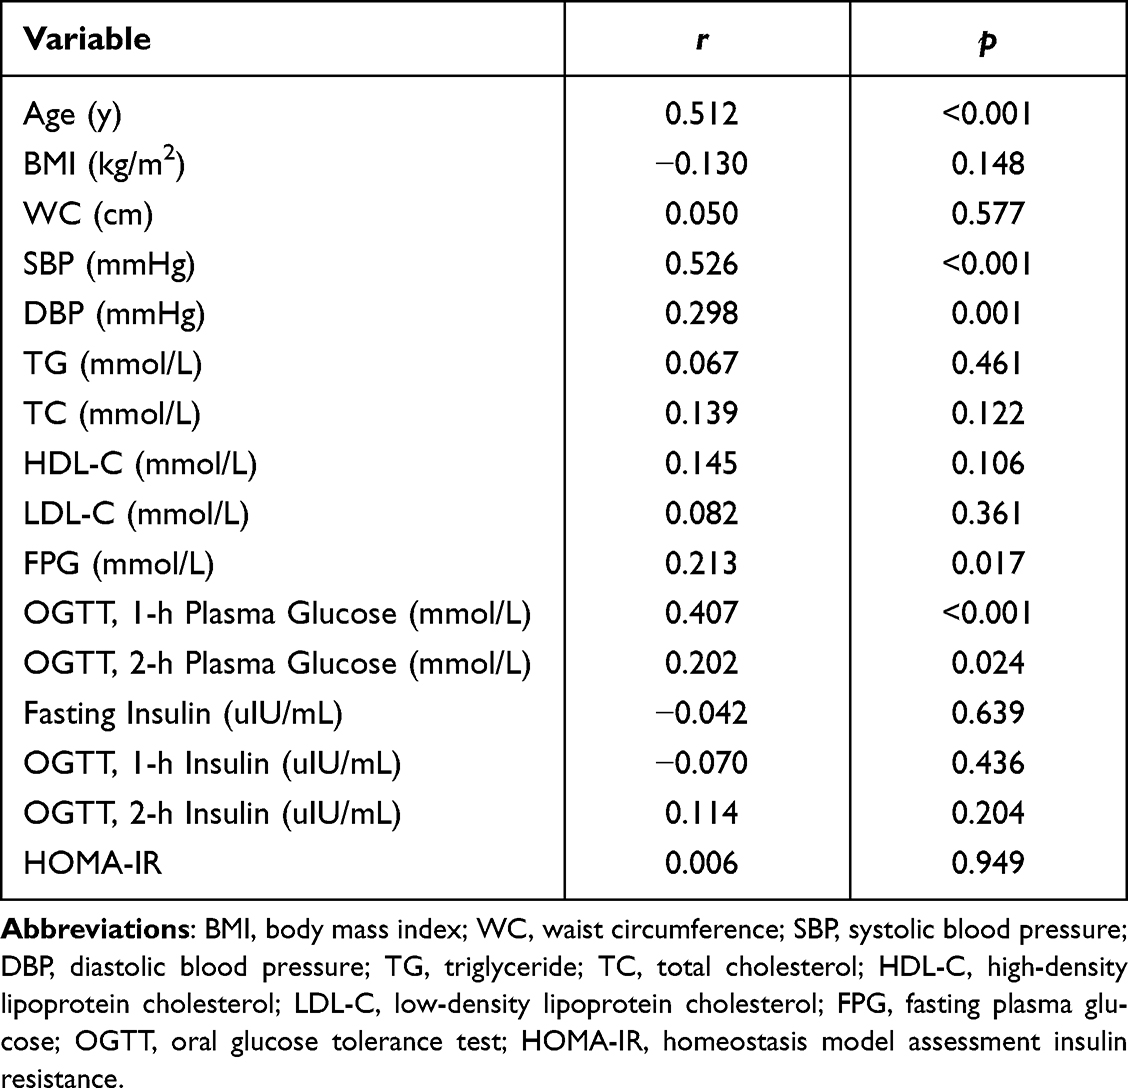 |
Table 2 Simple Correlations Between the Brachial-Ankle Pulse Wave Velocity and Other Variables |
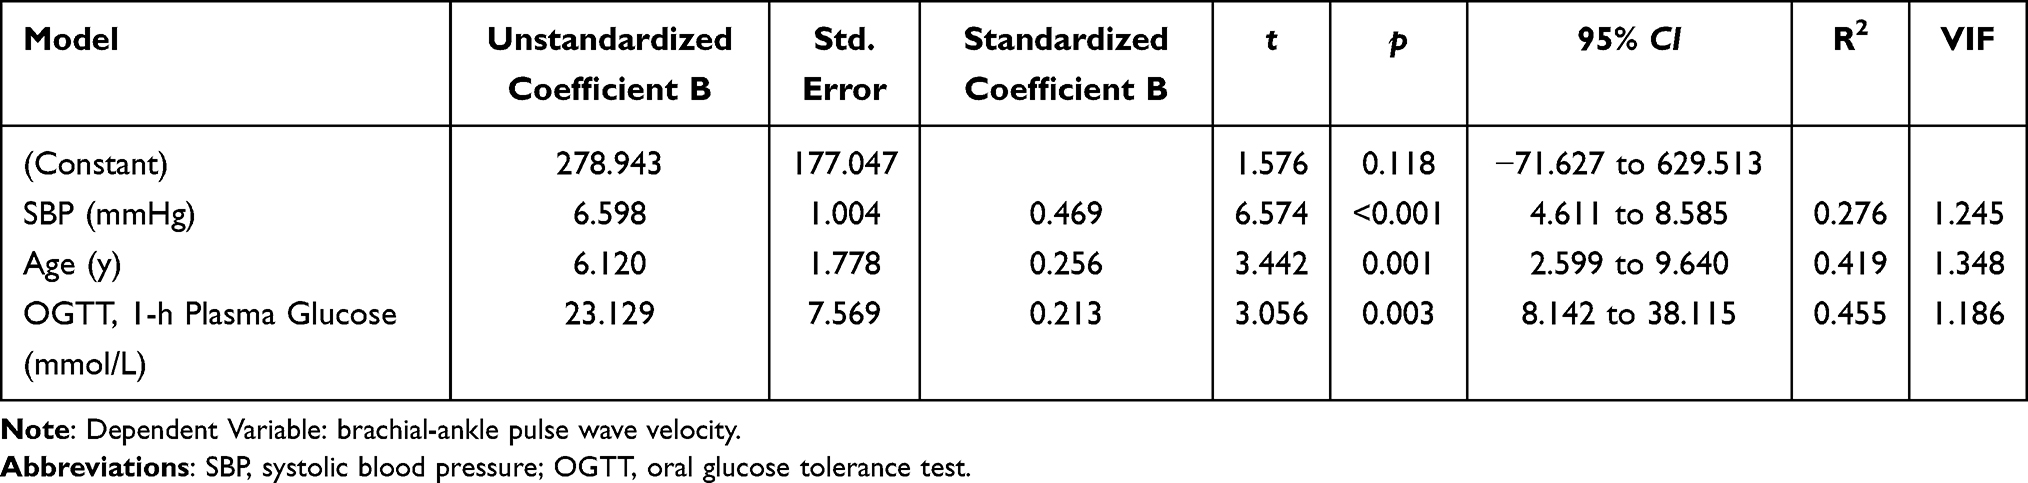 |
Table 3 Multiple Linear Regression Analyses for Brachial-Ankle Pulse Wave Velocity (Stepwise Method) |
Discussion
The results of the present study showed that baPWV was increased in subjects with type 2 diabetes. The baPWV is the pressure wave conduction velocity generated by each pulse ejection of the heart and propagated along the wall of the aorta. The faster the baPWV, the worse the dilation and elasticity of the artery. The baPWV can quickly and accurately evaluate the stiffness of the arterial system, and can be used for the early detection of arterial vascular lesions. It is a traditional and noninvasive comprehensive index for assessing the degree of atherosclerosis.18 The results of this study suggested that type 2 diabetes subjects without macroangiopathy already have early arteriosclerosis. The level of baPWV was also higher in the pre-diabetes group, but there was no statistical difference. This may be due to the small sample size of this study.
As expected, fasting and post-load plasma glucose levels were also higher in subjects with type 2 diabetes. Fasting and post-load plasma glucose levels were correlated with baPWV, but the association between 1-hour post-load plasma glucose level and baPWV was the strongest. These results are consistent with previous studies. Two studies had reported that fasting and 2-hour post-load plasma glucose levels were correlated with baPWV in univariate regression analyses, but was not in multivariate regression analyses.12,16
Both blood pressure and age are important determinants of baPWV.19,20 SBP and age were positively correlated with baPWV. Subjects with type 2 diabetes had higher age and SBP. Multivariate regression models showed that 1-hour post-load plasma glucose level was independently associated with baPWV after adjusting for these confounding factors, and 3.6% of the total variance of baPWV was due to 1-hour post-load plasma glucose.
Intermittent hyperglycemia can induce oxidative stress21 and increased expression of adhesion molecules,22 which can promote the adhesion of monocytes to arterial endothelial cells and thicken the intima media of the artery, leading to atherosclerosis. Several studies have reported that elevated 1-hour post-load plasma glucose levels obtained during an OGTT in people with normal glucose tolerance are associated with baPWV.13,14 Similar to previous studies, this study also found that 1-hour post-load plasma glucose level is a predictor of arterial stiffness in subjects with different glucose tolerance.
This study had several limitations. First, the sample size was small, especially in the type 2 diabetes group. So we could not analyze the association between 1-hour post-load plasma glucose and baPWV stratified by different glucose tolerance status. Second, smoking status of participants was not determined in this study. Hence, we could not evaluate the impact of smoking on the arterial elasticity.
In summary, the present study demonstrated that early arterial stiffness is present in patients with type 2 diabetes. Moreover, elevated 1-hour post-load plasma glucose level is closely associated with the change of arterial elasticity in type 2 diabetes.
This study was self-financed.
Disclosure
The authors report no relevant conflicts of interest in this work.
References
1. Yang Z, Han B, Zhang H, et al. Association of lower extremity vascular disease, coronary artery, and carotid artery atherosclerosis in patients with type 2 diabetes mellitus. Comput Math Methods Med. 2021;2021:6268856. doi:10.1155/2021/6268856
2. Ceriello A, Hanefeld M, Leiter L, et al. Postprandial glucose regulation and diabetic complications. Arch Intern Med. 2004;164(19):2090–2095. doi:10.1001/archinte.164.19.2090
3. Fiorentino TV, Sesti F, Andreozzi F, et al. One-hour postload hyperglycemia combined with HbA1c identifies pre-diabetic individuals with a higher cardio-metabolic risk burden. Atherosclerosis. 2016;253:61–69. doi:10.1016/j.atherosclerosis.2016.08.020
4. Esposito K, Ciotola M, Carleo D, et al. Post-meal glucose peaks at home associate with carotid intima-media thickness in type 2 diabetes. J Clin Endocrinol Metab. 2008;93:1345–1350. doi:10.1210/jc.2007-2000
5. Tanaka K, Kanazawa I, Yamaguchi T, et al. One-hour post-load hyperglycemia by 75g oral glucose tolerance test as a novel risk factor of atherosclerosis. Endocr J. 2014;61(4):329–334. doi:10.1507/endocrj.EJ13-0370
6. Succurro E, Marini MA, Arturi F, et al. Elevated one-hour post-load plasma glucose levels identifies subjects with normal glucose tolerance but early carotid atherosclerosis. Atherosclerosis. 2009;207(1):245–249. doi:10.1016/j.atherosclerosis.2009.04.006
7. Mann BK, Bhandohal JS, Hong J. An overall glance of evidence supportive of one-hour and two-hour postload plasma glucose levels as predictors of long-term cardiovascular events. Int J Endocrinol. 2019;2019:6048954. doi:10.1155/2019/6048954
8. Munakata M. baPWV in the measurement of arterial stiffness: recent evidence and clinical applications. Curr Hypertens Rev. 2014;10(1):49–57. doi:10.2174/157340211001141111160957
9. Ueki Y, Miura T, Minamisawa M, et al. The usefulness of brachial-ankle pulse wave velocity in predicting long-term cardiovascular events in younger patients. Heart Vessels. 2017;32(6):660–667. doi:10.1007/s00380-016-0919-6
10. Foreman YD, Brouwers MCGJ, Berendschot TTJM, et al. The oral glucose tolerance test-derived incremental glucose peak is associated with greater arterial stiffness and maladaptive arterial remodeling: the Maastricht study. Cardiovasc Diabetol. 2019;18(1):152. doi:10.1186/s12933-019-0950-x
11. Puzantian H, Mosenkis A, Townsend RR. Vascular compliance during insulin infusion and oral glucose challenge. Artery Res. 2013;7(1):36–41. doi:10.1016/j.artres.2013.01.001
12. Kasayama S, Saito H, Mukai M, et al. Insulin sensitivity independently influences brachial-ankle pulse-wave velocity in non-diabetic subjects. Diabet Med. 2005;22(12):1701–1706. doi:10.1111/j.1464-5491.2005.01718.x
13. Niijima K, Muranaka Y, Ando T, et al. Elevated 1-h plasma glucose following 75-g oral glucose load is a predictor of arterial stiffness in subjects with normal glucose tolerance. Diabet Med. 2012;29(12):e457–e60. doi:10.1111/dme.12026
14. Sciacqua A, Maio R, Miceli S, et al. Association between one-hour post-load plasma glucose levels and vascular stiffness in essential hypertension. PLoS One. 2012;7(9):e44470. doi:10.1371/journal.pone.0044470
15. Nakagomi A, Sunami Y, Okada S, et al. Synergistic effects of 1 h post-load plasma glucose and smoking on arterial stiffness in apparently healthy men: a cross-sectional study. J Atheroscler Thromb. 2019;26(6):505–512. doi:10.5551/jat.46193
16. Choi ES, Rhee EJ, Choi JH, et al. The association of brachial-ankle pulse wave velocity with 30-minute post-challenge plasma glucose levels in Korean adults with no history of type 2 diabetes. Korean Diabetes J. 2010;34(5):287–293. doi:10.4093/kdj.2010.34.5.287
17. Diabetes Society of Chinese Medical Association. Guidelines for prevention and treatment of type 2 diabetes in China. Chin J Diabetes Mellit. 2018;10:4–67.
18. Yamashina A, Tomiyama H, Takeda K, et al. Validity, reproducibility, and clinical significance of noninvasive brachial-ankle pulse wave velocity measurement. Hypertens Res. 2002;25(3):359–364. doi:10.1291/hypres.25.359
19. Wang Y, Tao J, Dong Y, et al. Effect of different levels of systolic blood pressure on brachial-ankle pulse wave velocity. Zhonghua Liu Xing Bing Xue Za Zhi. 2014;35(6):655–659.
20. Inomoto A, Deguchi J, Fukuda R, et al. Age-specific determinants of brachial-ankle pulse wave velocity among male Japanese workers. Tohoku J Exp Med. 2021;253(2):135–141. doi:10.1620/tjem.253.135
21. Monnier L, Mas E, Ginet C, et al. Activation of oxidative stress by acute glucose fluctuations compared with sustained chronic hyperglycemia in patients with type 2 diabetes. JAMA. 2006;295:1681–1687. doi:10.1001/jama.295.14.1681
22. Quagliaro L, Piconi L, Assaloni R, et al. Intermittent high glucose enhances ICAM-1, VCAM-1 and E-selectin expression in human umbilical vein endothelial cells in culture: the distinct role of protein kinase C and mitochondrial superoxide production. Atherosclerosis. 2005;183:259–267. doi:10.1016/j.atherosclerosis.2005.03.015
 © 2022 The Author(s). This work is published and licensed by Dove Medical Press Limited. The
full terms of this license are available at https://www.dovepress.com/terms
and incorporate the Creative Commons Attribution
- Non Commercial (unported, 3.0) License.
By accessing the work you hereby accept the Terms. Non-commercial uses of the work are permitted
without any further permission from Dove Medical Press Limited, provided the work is properly
attributed. For permission for commercial use of this work, please see paragraphs 4.2 and 5 of our Terms.
© 2022 The Author(s). This work is published and licensed by Dove Medical Press Limited. The
full terms of this license are available at https://www.dovepress.com/terms
and incorporate the Creative Commons Attribution
- Non Commercial (unported, 3.0) License.
By accessing the work you hereby accept the Terms. Non-commercial uses of the work are permitted
without any further permission from Dove Medical Press Limited, provided the work is properly
attributed. For permission for commercial use of this work, please see paragraphs 4.2 and 5 of our Terms.