Back to Journals » Medical Devices: Evidence and Research » Volume 19
Ocular VEMP Using Bone Conduction Stimuli at the Forehead - A Pilot Study Comparing B250, Minishaker and Tendon Hammer with Vibrometry Validation
Authors Håkansson BEV ![]() , Fredén Jansson KJ
, Fredén Jansson KJ ![]() , Verrecchia L, Tawfique Z, Froehlich L, Dlugaiczyk J, Rahne T, Eeg-Olofsson M, Håkansson E, Reinfeldt S
, Verrecchia L, Tawfique Z, Froehlich L, Dlugaiczyk J, Rahne T, Eeg-Olofsson M, Håkansson E, Reinfeldt S ![]()
Received 12 September 2025
Accepted for publication 23 January 2026
Published 12 February 2026 Volume 2026:19 560014
DOI https://doi.org/10.2147/MDER.S560014
Checked for plagiarism Yes
Review by Single anonymous peer review
Peer reviewer comments 3
Editor who approved publication: Professor Mohamad Bashir
Bo EV Håkansson,1 Karl-Johan Fredén Jansson,1 Luca Verrecchia,2 Zheer Tawfique,2 Laura Froehlich,3 Julia Dlugaiczyk,4,5 Torsten Rahne,6 Måns Eeg-Olofsson,7 Emil Håkansson,1 Sabine Reinfeldt1
1Department of Electrical Engineering, Chalmers University of Technology, Gothenburg, Sweden; 2Department of Audiology and Neurotology, Karolinska University Hospital, Stockholm, Sweden; 3Department of Otorhinolaryngology, University Hospital Bonn, Bonn, Germany; 4Department of Otorhinolaryngology, Head and Neck Surgery & Interdisciplinary Center for Vertigo, Balance and Ocular Motor Disorders, University Hospital Zurich (USZ), Zurich, Switzerland; 5Faculty of Medicine, University of Zurich (UZH), Zurich, Switzerland; 6Department of Otorhinolaryngology, University Medicine Halle, Halle (Saale), Germany; 7Department of Otolaryngology, Head and Neck Surgery, Sahlgrenska Academy University of Gothenburg, Gothenburg, Sweden
Correspondence: Bo EV Håkansson, Department of Electrical Engineering, Chalmers University of Technology, Gothenburg, Sweden, Tel +46707853294, Email [email protected]
Background: Bone-conduction stimuli in oVEMP testing offer lower stimulus levels and independence of conductive hearing loss but lack a clinically suitable transducer for excitation. A new bone-conduction transducer (B250) has been developed which is easy to attach and can be directly connected to test stations.
Objective: To compare, in a pilot investigation B250, Minishaker and Tendon hammer excitation, used for oVEMP and mastoid vibration measurements.
Methods: oVEMPs in three subjects were measured using transducers driven by a 250 Hz condensation single sinus cycle and with a Tendon hammer, all applied at forehead Fz/AFz. Corresponding mastoid velocity was measured using a laser Doppler vibrometer (LDV).
Results: B250 and Minishaker often produced dual oVEMP peaks with an early n1 (mean latency: 8.8 ms) and a late n2 response (B250: 12.4/Minishaker: 13.3 ms), and with the Tendon hammer response in between. This finding was supported by a reinvestigation of a previous study (n=15). LDV velocity shows several positive peaks for B250 and one positive peak for the Minishaker. The acceleration response has two peaks 4 ms apart for both transducers, which seem to relate to the early and late oVEMP latencies.
Conclusion: B250 may serve as a potential alternative, pending validation in larger samples, to the Minishaker at the forehead, but with care to polarity choice and latency interpretation.
Keywords: oVEMP, bone conduction transducer, forehead stimulus, laser Doppler vibrometry
Introduction
Balance disorders are quite common with a prevalence estimated between 20 and 56% in the adult population (Teggi et al, 20161). These disorders can have many different origins and approximately 30 to 60% are caused by a dysfunction of the balance (vestibular) organs in the inner ear (Muelleman et al, 20172 and Ferreira et al, 20253). However, the diagnosis of dizziness and vertigo remains challenging, and up to 15% of dizzy patients attending tertiary neurotology centers do not receive a clear diagnosis for their symptoms (Verrecchia et al, 20194).
For this reason, clinical vestibular tests are in continuous development. The function of all six semicircular canals is commonly assessed by the video head impulse test (Curthoys et al, 20235), while vestibular evoked myogenic potentials (VEMPs) are employed to assess the integrity of the otolith organs, ie utricle and saccule (Rosengren et al, 2019;6 Curthoys and Dlugaiczyk 20207). One unique feature of VEMP testing is the application of impulsive stimuli, ie air conducted sound (ACS) or bone conducted vibration (BCV), to evoke a vestibular reflex. The responses are easily recorded with surface electromyography at different muscle groups. Clinical standards are cervical VEMPs (cVEMPs) recorded from the ipsilateral sternocleidomastoid muscle and ocular VEMPs (oVEMPs) recorded from the contralateral inferior oblique muscle. Both c- and oVEMPs are considered to be tests of dynamic otolithic function, with cVEMPs testing predominantly the ipsilateral inferior vestibular division (saccule, inferior vestibular nerve) and oVEMPs predominantly the contralateral superior vestibular division (utricle, superior vestibular nerve) (Curthoys 20108).
ACS is the most widely used VEMP stimulus, as it is easily set up with conventional evoked potential test systems available at clinics. However, ACS stimuli have some major drawbacks: VEMP amplitudes may be reduced or even absent in patients with conductive hearing loss (Fröhlich et al, 20229), and the high stimulus levels necessary to evoke a VEMP response are unpleasant for the patient with a risk of hearing hazard due to noise exposure or overstimulation of the cochlea (Rosengren et al, 20196). As VEMP responses generally decline with age (Allen et al, 201610 and Tseng et al, 201011) while the prevalence of balance disorders increases, a repeated high-intensity transient stimulus is needed to obtain robust and reproducible responses with ACS VEMPs. Commonly, ACS VEMPs are obtained by averaging up to 200 sweeps, stimulating monoaurally and separately for the two ocular recordings and the two cervical recordings (Rosengren et al, 20196). A tone burst of 500 Hz and 6 ms stimulus duration at 125 decibel peak equivalent sound pressure level relative to 20 µPascal (dB peSPL) is the currently preferred stimulus in the clinic (Singh et al, 201912). With these settings, the cumulative sound dose during an ACS VEMP session corresponds to 129 SPL dBA × 1 sec, which is close to the 131.6 SPL dBA × 1 sec recommended as the maximum sound exposure level to avoid transient or permanent cochlear damage (Asakura & Kamogashira 2021;13 Colebatch and Rosengren, 2016;14 Singh et al, 2019;12 Strömberg et al, 201615). It has also been shown that BCV stimuli applied by the B250 and the Minishaker can return the same valid responses as ACS stimulation, but with up to 40 dB lower stimulus levels (Håkansson et al, 201816 and Fredén Jansson et al, 202117). For both ACS and BCV stimuli, 200 stimulus repetitions are recommended in the literature to obtain stable results (Rosengren et al, 20196). In general, the number of required sweeps is variable and depends on the signal-to-noise ratio of the VEMP response. Fewer than 200 repetitions may be sufficient for large VEMP responses. As a rule of thumb, a recording can be terminated if the VEMP responses no longer change for an increasing number of stimuli (Dlugaiczyk 202018).
Given the clinical inconveniences with ACS and the advances in BCV VEMPs, clinical interest in BCV stimulation has been renewed in recent years. There are different possibilities of generating BCV stimuli for VEMP recordings. A tendon hammer (Figure 1a) was originally used to produce a single mechanical impulse stimulus aimed at the forehead (Halmagyi et al, 199519). Despite being a very effective BCV method to evoke VEMPs (Iwasaki et al, 200720), it is not commonly used in the clinic for several reasons: First, it requires repetitive manually induced excitations (in general 30 to 60 impulses) where synchronization (triggering) for averaging of VEMP signals is challenging. Second, it is hard to define VEMP thresholds, and there is no possibility to test at different stimulus frequencies (Hecker et al, 201421). Other BCV stimulus alternatives, such as conventional exciters/transducers for audiometric applications, for example the B81 (Håkansson 2003,22 Fredén Jansson et al, 201523) also have some limitations when used for VEMP testing. In particular, the output force levels of audiometric transducers are too low for eliciting the VEMP reflex consistently at frequencies ≤ 500 Hz (Clinard et al, 2020,24 Schütz et al, 202525). In addition, low response rates when stimuli are applied at the frontozygomatic suture (Fz) and insufficient power output are further reasons for the limited application of the B81 and similar audiometric transducers for oVEMP testing in a clinical setting (Fröhlich et al, 20229). A more powerful alternative for frequencies of 500 Hz and below is the Minishaker B&K 4810 (Brüel & Kjaer, Denmark), see Figure 1b, which was developed and certified/approved for non-medical industrial applications. However, the B&K 4810 needs to be driven by a separate intermediate power amplifier to provide sufficient power output. A further drawback of the B&K 4810 is its heavy weight (1.1 kg) which means that it usually needs to be handheld by an operator.
 |
Figure 1 Bone conduction stimuli for oVEMPs provided by (a) Tendon hammer and (b) the Minishaker and the B250 in scale. This tendon hammer has been provided with a trigger switch at the contact surface (see close-up) and an accelerometer (glued on shaft next to head) for excitation force measurement (Force=head mass * acceleration). Bone conduction stimuli can be applied at several, places along the midline of the head, preferably at Fz and AFz as shown in (c) with arrows pointing inwards for condensation stimuli at AFz/Fz, and the positions determined by the proportion (20% for AFz and 30% for Fz) of the total distance between Nasion (Nz) and Inion (Iz), figure modified from Govender & Colebatch, 2018.26 The LDV laser beam points to a self-adhesive reflector film attached to the skin over the mastoid behind the ear where a positive velocity is directed outwards. |
A new transducer has now been developed called the B250 (Figure 1b, photo in scale) with a design that is based on the balanced electromagnetic motor of the B81, yielding high reliability and high output with low distortion (Håkansson 2003,22 Håkansson et al, 2018,16 Fredén Jansson et al, 2015,23 2021,17 202427). In Håkansson 200322 the B250/B81 transducer principle is described in more technical detail, whereas in Håkansson et al 201816 a first pilot study of VEMP using the B250 on normal subjects is presented.
This transducer has some advantages as compared to the stimulators described above and the B250 has also been used, not only on normal subjects, but also in clinical studies on patients (Plontke et al, 202128 and Rahne et al, 202429). First, the B250 can be directly connected to conventional VEMP testing equipment. Second, its weight is only 80 grams, which is less than one tenth compared to the Minishaker, allowing it to be attached with a headband or steel spring over the head. Third, the resonance of the B250 is chosen to be 250 Hz (giving its name B250) as a compromise between transducer size/weight for convenient attachment and desired stimulation frequency for eliciting the VEMP reflex (ie, > 200 Hz to obtain specific stimulation of the otolith organs and not the semicircular canals, Dlugaiczyk et al, 202030).
Reducing the stimulus rise time to a minimum, results in increased amplitudes and decreased latencies for the oVEMP n10 response (Burgess et al, 201331). It has also been shown that changing the stimulus polarity affects n10 latency (Fredén Jansson et al, 202117 and Rahne et al 202532). In this context, it is important to consider that a force stimulus acting initially inward towards the skull is defined as “condensation” and a stimulus force initially acting outward from the skull is defined as “rarefaction”. The latter requires a static inward attachment force of at least 10 Newton due to counteract a desired stimulation level of 140 decibel peak equivalent force level relative to 1 µNewton (dB peFL) with any BCV transducer used (Rosengren et al, 2010,33 Fredén Jansson et al, 202117).
The mechanical stimulus itself can have a different time signature, for example burst (one or more sinusoidal cycles) or impulse (monophasic transient), which will affect the VEMP response as well. Furthermore, the same electric excitation signal to the transducers may result in different force output when comparing transducers of different generic principles. For example, a given electric input to a Minishaker, which is of the moving coil type, will provide a different force output than the same electric signal to a B250/B81, which are of spring-mass resonant variable reluctance type. These force signatures are also very different from a tendon hammer which provides a monophasic single impulse. The first and main aim of this pilot study is, therefore, to investigate how these differences in force stimuli between the different transducers and tendon hammer influence oVEMP results.
Moreover, in previous studies with stimuli applied at the mastoid and forehead Fz (Fredén Jansson et al, 2021,17 Rahne et al, 202532) it has been pointed out that the polarity of the transducers connected to different test systems needs to be verified in each study to avoid biased results. For example, just switching the polarity of the detachable cable of the B81 will reverse the polarity of the mechanical stimuli, ie, change a condensation to a rarefaction stimulus. In this context, it should be particularly noted that the transducers are not always produced with specified polarity. Moreover, there may be random polarity between samples depending on how coil wires were oriented when soldered and how the biasing magnet(s) were mounted with respect to north and south poles. Thus, a polarity test of the whole test system as proposed and used in this study is crucial to make VEMP results comparable among studies.
Bone conduction stimuli can be provided at different locations of the skull, most commonly employed at the mastoid of the tested side or at the midline of the skull. Many studies have been done at the mastoid, but there are some advantages with providing a midline forehead stimulus (Fz/AFz) as it enables simultaneous and equally directed stimuli to the left and right vestibules. Simultaneous stimulation of both sides is clinically valuable in identifying unilateral utricular loss as pointed out by Iwasaki et al, 2008.34 Stimulation at the midline can be applied at different locations on the line between inion and nasion with Fz and AFz being most frequently used in previous studies (see Figure 1c for definitions). A secondary aim of this study is therefore to clarify if AFz instead of Fz can be used with the B250 due to its better retention with a neoprene band.
In Håkansson et al 201816 the focus was limited to compare the hearing level, needed to elicit the VEMP reflex, when using a burst signal (full cycle preceded by a ramp up cycle and proceeded by a ramp down cycle) at two different frequencies (250 vs 500 Hz) as compared to using an air conduction (AC) stimulus. It was found that 250 Hz was more efficient than 500 Hz in terms of hearing level and similar findings have also been presented by Welgampola et al 200335 and Chihara et al 2009.36 The current study is a natural next step comparing VEMP responses with B250, using the preferred single cycle 250 Hz proposed by Håkansson et al 201816 and Fredén Jansson et al 2021,17 with oVEMP responses using previous clinically used bone conduction stimuli methods (tendon hammer and Minishaker) at two well defined forehead positions Fz/AFz.
In Fredén Jansson et al 2021,17 it was also found that the first n peak using B250 was appearing at approximately 12 ms which is roughly 2 ms later than expected. To further study if the polarity of a mechanical response at the level of the mastoid played any role in this latency shift, a laser Doppler vibrometer (LDV) was used to measure the velocity of the outer skin surface over the mastoid without touching or mechanically loading the skin. The rationale behind also introducing this measurement is that, as the temporal bone moves like a rigid body for frequencies up to 700–800 Hz (Håkansson et al, 2020,37 Stenfelt 201138), it may be assumed to reflect the vibration sensed by the utricle otoconia. Thus by aiming the LDV pointed in the medial direction towards the skin over the mastoid/temporal bone it measures the vibration of the temporal bone, encapsulated the vestibular organ, in that direction (Grant et al, 201739). However, the temporal bone can also move in other directions important for the VEMP reflex but as the temporal bone is assumed to move as a rigid body for low frequencies, movements in all directions can be assumed to be approximately linearly related. A 1D LDV measurement in latero-medial direction perpendicular to the mastoid at these low frequencies should be sufficient for a comparison between different stimuli at the forehead. A third aim of the current study is, therefore, also to measure mastoid movement with an LDV where the beam is pointing at a reflector film attached to the skin surface over the mastoid, when using the same mechanical stimuli as used in the oVEMP measurements. The hypothesis is that such information may be useful for evaluating VEMPs related to the polarity, amplitudes and timing (latencies) with reference to the mechanical excitation at the forehead.
Aims of Study
The overall aim of this study is to compare oVEMP responses, when applying condensation stimuli from the B250, the Minishaker and a Tendon hammer applied at forehead midline positions Fz and AFz, in relation to the LDV velocity response at the skin over the mastoid.
Materials and Methods
Test Subjects
Three male members of our research group at Chalmers University (all three also co-authors in this study) with no known vestibular impairment and no history of dizziness or vertigo episodes were test subjects of this study. The ages were 71 (S1), 36 (S2), and 38 (S3) years. More subjects would have been required for performing a statistical analysis. We were, however, limited to testing ourselves due to new Medical Device Regulation (MDR) in Sweden and the fact that the B250 is not yet CE marked (one further member of our research group had to be excluded due to a suspected vestibular issue).
In addition, a re-analysis of results from a previous study by Fredén Jansson et al, 2021,17 performed under Medical Device Directive (MDD) - and before MDR became effective in the European Union - comprising 15 healthy subjects is presented in the discussion. For the re-analysis, the influence of the transducer on n1, n2, p1 and p2 latencies was analyzed by paired t-tests (normality assumed). The level of significance was adjusted according to the Bonferroni correction for multiple comparisons (p/4=0.0125).
All procedures were performed in accordance with the Declaration of Helsinki. Informed consent also includes a right to publish all images. The clinical study was approved by the Regional ethical review board in Västra Götalandsregionen (the clinical side of Sahlgrenska University Hospital) Gothenburg (537-18).
Measurement Set-Up
For VEMP measurements, an Eclipse EP25 (Interacoustics, Denmark) was used and the whole test set-up is shown in Figure 2. For the B250 and the Minishaker (B&K 4810, Bruel and Kjaer, Denmark) driven from the Eclipse, the electrical stimulus was a single full period sine wave at 250 Hz with zero ramp up and down and a 4 ms long plateau (0-1-0 cycles) and the first positive output force cycle providing a condensation stimulus (pointing inward the head). The output levels in oVEMP measurements were 135, 140 and145 dB peFL (calibrated on an artificial mastoid B&K 4930), and the oVEMP response was determined as an average of 200 stimulus sequences as recommended by Rosengren et al, 2019.6
 |
Figure 2 Test set-up for oVEMP and LDV measurements when the mechanical stimuli were applied at forehead positions Fz and AFz, respectively. The artificial mastoid (B&K 4930) was used for calibration and to verify that a condensation stimulus from the VEMP test system really gives a first inward (toward the skull) positive-force half cycle at Fz/AFz. The impact force output of the tendon hammer was measured in situ with a built-in accelerometer. The LDV was used to objectively investigate latencies and amplitudes of skin velocity and for providing the acceleration or jerk of the temporal bone encapsulating the vestibular organ by post processing of skin velocity. |
A slightly concave skin contact surface with a diameter of 30 mm was used for both the Minishaker and the B250.
The electrode montage in the oVEMP measurements as well as the application of the three stimulation modalities B250, Minishaker and Tendon hammer are shown in Figure 3a–c. A neoprene band was used for retention of the B250 (Figure 3a) with a static attachment force of 10 Newton verified by a force gauge. For the Minishaker (Figure 3b), the static force was exerted by its own weight of approximately 1 kg which corresponds to 10 N. Manual tendon hammer hitting was operated from behind to avoid conscious involvement of the test person blinks (Figure 3c); a tip-mounted switch was used as a trigger in the averaging procedure (Figure 1a).
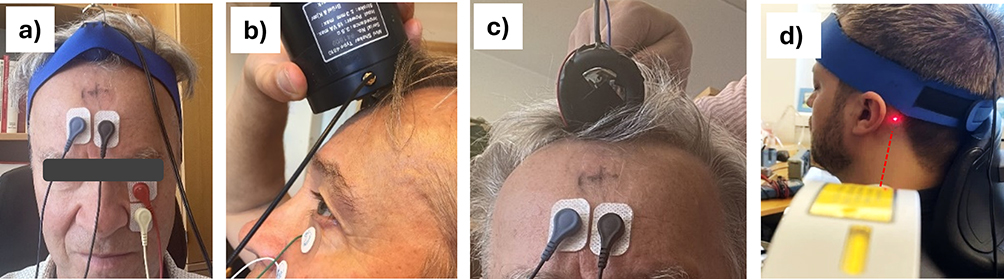 |
Figure 3 Excitation at Fz in oVEMP measurements shown with: (a) B250 (covered by a blue neoprene band), where the static force (10 N) is controlled by use of a dynamometer; (b) Minishaker; and (c) Tendon hammer. In (d) the laser beam from the LDV is aimed at a reflector film attached to the skin over the mastoid bone measuring the skin velocity perpendicular to the skin surface. Subsequent and identical measurements as for Fz were made with the excitation at position AFz (marked with “+” on the subject’s forehead in c). oVEMP recording (red) and reference (white) electrodes are placed below the eye and the ground (GND, black) is placed just above the nasion at the forehead, but sufficiently below AFz. The fourth and non-active electrode (blue) is placed just beside the GND electrode. |
Maximum impulse force from the Tendon hammer was found to be approximately 153 dB peFL with a pulse width of approximately 4 ms, roughly corresponding to a single half cycle of a ~125 Hz sine signal (0-0.5-0 cycles). For the averaging using the Tendon hammer, 60 consecutive impacts were used (Hecker et al, 201421). The variation of the force peak levels induced by manual hitting with the Tendon hammer was estimated to be within ±5 dB.
The artificial mastoid B&K 4930 was used to verify polarity of the output force in all three stimulation modalities. As the measuring system itself can also introduce a polarity inversion, it is important to check that system separately. In this study, a digital oscilloscope (Picoscope 2000, from Pico Technology, UK) was used to measure the artificial mastoid output to confirm that a condensation (inward) excitation produces a positive response in the measured response signal.
The skin velocity over the mastoid was measured by an LDV from Polytec, Germany (HLV-1000), which was pointed at a sticky reflector film placed on the mastoid as shown in Figure 3d. The frequency range setting of the Polytech HLV-1000 was set for a low-pass cut at “5 kHz”. The high-pass filter was disabled (“Off”), as the fixed high-pass cut-off frequency at “100 Hz” for AC coupling was found to give additional ringing when a stimulus at 250 Hz was used. Instead of AC coupling, the DC offset was removed by subtraction in the post-processing. The highest LDV sensitivity of 2 mV per m/s was used, and the interferometer accuracy scale was kept at >0.8 (scale 0–1) during each measurement.
Mechanical Stimulus
Besides polarity checking, the artificial mastoid was also applied to measure the mechanical output from the B250, as shown in Figure 4a. The Minishaker, which is of the moving coil type, mainly produces one single force cycle with a first positive peak at approximately 1.1 ms (there is a slight delay after the onset of the electrical signal of approx. 0.1 ms in the transducer itself) and with a rather small ringing after the electrical signal is turned off at 4 ms after stimulus onset (after a full 250 Hz cycle). The B250, on the other hand, is of the variable reluctance type with a spring-mass resonant armature suspension tuned to approximately 250 Hz (to enhance the response in steady state at that frequency), and generates an inductance and mass inertia depressed initial cycle followed by a maximum amplitude of the second cycle and then a decaying oscillating sinusoidal force. In other words, a positive (compression) electrical stimulus produces first an initial smaller compression peak followed by a larger compression peak with a rarefaction peak in between. Moreover, a single-cycle electrical signal driving the B250 produces several mechanical compression “peaks” within the clinically most important time window for the oVEMP measurement (20 ms after stimulus onset).
 |
Figure 4 (a) Force output in Volts (not calibrated to physical force) measured by the artificial mastoid from the B250 (black) and the Minishaker (red) when electrically driven by a one-cycle 250 Hz sinus (blue dashed line), and (b) the impulse force output measured by an accelerometer at the tendon hammer (TH) head in Volt when exciting at Fz (black) and AFz (red). Please note the different scales in the Y axes are not comparable. In VEMP measurements, the B250 and Minishaker were triggered by the electric drive signal (Vin=0, t=0 internally controlled in the Eclipse), whereas the TH excitation impulse was triggered by the electric-mechanic switch mounted on the contact surface (dashed blue line in (b)), corresponding to an accelerometer (mounted on TH head) signal at 0.3 Volt, see vertical arrows pointing at t=0 sec in the oVEMP measurements. In LDV measurements a trigger level of 0.1 V of the input voltage to the B250 and Minishaker and 0.1 V of the accelerometer signal for the TH were used, see angulated arrows pointing at t=0 sec in the LDV measurements. |
The Tendon hammer used in this study has an accelerometer incorporated, which is used to measure the excitation force in situ (Figure 4b), while this is not possible for the B250 and Minishaker. Figure 4b illustrates that the force stimuli from the Tendon hammer at Fz and AFz are approximately the same – independent of position, and considerably stronger than for the B250/Minishaker.
Results
oVEMP Responses
oVEMP responses from the three subjects (S1, S2 and S3) are presented in Figure 5 for B250, Minishaker and Tendon hammer at positions Fz and AFz. Responses were measured at 135, 140 and 145 dB peFL for B250/Minishaker and an estimated 153 dB peFL for the Tendon hammer.
 |
Figure 5 oVEMP responses for subjects S1-S3 when excited by a single-sinus condensation stimulus of 250 Hz (0 ms rise and fall time) using B250 and Minishaker (first two columns) and by Tendon hammer taps (third column) at Fz and AFz, respectively. The amplitude scales (μV) are shown with the vertical scale bar valid from left to right until changed (S2 and S3). Time scales (x axis) cover the range from 5–20 ms after stimulus onset leaving the stimulus artifacts at 0–4 ms outside which were much higher for the Minishaker than the B250. The first peaks of the oVEMP response were labeled “n1” and “n2”, while troughs were labeled “p1” and “p2”. “?” indicates doubtful peaks. Please see Table 1 for latency and amplitude numbers. |
 |
Table 1 All oVEMP Latencies and Amplitudes @145 dB peFL Stimulus Level |
For all oVEMP recordings, the characteristic biphasic responses could be identified. It was noted, that both early (n1-p1) and late (n2-p2) responses were sometimes recorded for the B250 and the Minishaker, while the Tendon hammer always generated one single n-p response with latencies in between n1 and n2. Despite the presence of some ambiguous peaks (n) and troughs (p) (regarded as absent or marked “?”), it was clear that both the B250 and the Minishaker produced early and late responses. Generally, early n1 potentials appear before and late n2 potentials after 10 ms for the B250 and the Minishaker.
Table 1 shows all measured early and late amplitudes and latencies recorded from for the three subjects (S1-S3), the two stimulus locations (Fz/AFz) and the three simulation modalities. Table 2 contains the mean values averaged over the three subjects and stimulus locations. The average latency of the early n1 response is 8.8 ms for both the B250 (range of 8.3–9.3 ms) and the Minishaker (range of 8.3–9 ms), which is a bit earlier than the average n1 latency of the Tendon hammer with 9.6 ms (8.7–10.7 ms). On the other hand, the average late latencies n2 are 12.4 ms (range of 12 to 13.7 ms) for the B250 and 13.3 ms (range of 12 to 15.3 ms) for the Minishaker, whereas there is no n2 for the Tendon hammer. Interestingly, the average of the n1 and n2 latencies including measurements with both the Minishaker and the B250 are 8.8 ms (n1) and 12.7 ms (n2), respectively. The difference between the mean n2 and n1 latencies is thus 3.9 ms, corresponding to a full cycle of a 250 Hz sinus (4 ms). It is also noted that the average n1 latency of the Tendon hammer (9.6 ms) occurs 0.8 ms later than the corresponding latencies of the B250 and the Minishaker (8.8 ms). This is close to the time difference of approximately 1.2 ms between maximum LDV velocity peaks in Figure 4b (peak at approx. 2.3 ms) versus 4a (peak at approx. 1.1 ms) with reference t=0 in the VEMP measurements.
 |
Table 2 Average oVEMP Latencies and Amplitudes for Three Subjects and Fz/AFz (N=6) |
Responses from the three test subjects showed considerable inter-individual variability (Figure 5). In particular, peak-to-peak n1-p1 amplitudes were generally a bit lower for S1 than S2 and S3, which is most likely age-related (71 vs 36/38 years). It should be noted that latencies and amplitudes in Table 1 are taken from the 145 dB peFL stimuli for the B250 and the Minishaker, whereas the manually applied Tendon hammer impulses were estimated to be 8 dB higher (comparing LDV responses in Figure 6). The VEMP n1-p1 amplitudes in Figure 5 are similar between Fz and AFz, but with a tendency for AFz amplitudes to be a bit smaller.
 |
Figure 6 LDV velocity responses at the skin over the mastoid bone, where a positive value is the skin moving outwards towards the laser beam when condensation stimulation is applied at Fz and AFz for B250, Minishaker, and Tendon hammer. When comparing the three panels, please note that y-scales are different, and that the TH response is reduced by a factor of 4. Individual responses (S1–S3) at Fz and AFz are illustrated by different colors, the black line depicts the average of all measurements (see inset in the first panel). The dashed lines represent the maximum positive slope of the velocity whose slope coefficients equal the corresponding peak accelerations. |
From the average results in Table 2, the B250 has a stronger late n2/p2 response (29.8 µV) than n1/p1 response (4.5 µV), and from Table 1 it can be seen that the late response is more frequent. For the Minishaker, it is the opposite where the early n1/p1 potential occurs more frequently and with a higher amplitude (23.2 µV) than the late n2/p2 response (16.7 µV).
LDV Velocity Mastoid Response
The skin velocity responses over the mastoid, measured using the LDV when stimulating at Fz and AFz with B250, Minishaker and Tendon hammer for subjects S1, S2 and S3, are shown in Figure 6. All individual responses are shown color-coded with the average in black bold line. As expected, the B250 has a ringing behavior where the second positive peak is the highest, whereas the Minishaker produces only one cycle of velocity response at the mastoid. LDV velocity patterns for the B250 and the Minishaker at the human mastoid are similar to the force output pattern measured at the artificial mastoid (Figure 4a). Likewise, the single impulse behavior in the velocity response at the mastoid for the Tendon hammer (Figure 6) is also seen from the excitation force at Fz/AFz (Figure 4b). The response velocity levels are approximately equal for positions Fz and AFz in all subjects. It should be noted that all LDV responses are recorded as a single event. Some changes in force may occur when manually hitting the Tendon hammer, and minor body motions may also affect the signal when the LDV signal is fading out after the initial stronger response.
Notably, the first peak for the B250 and Minishaker response on the human mastoid occurs approximately 0.7–1 ms later than on the artificial mastoid which is assumed to be caused by a delay in transmission through skull-brain tissue from Fz/AFz to the mastoid (compared with Figure 4a). The Tendon hammer velocity peak is arriving 2.5 ms later than the first velocity peak using the B250/Minishaker, which corresponds to approximately the difference between LDV trigger points (see “LDV” arrows) and first peaks in Figure 4.
Discussion
General Discussion
In previous studies by Håkansson et al, 201816 and Fredén Jansson et al, 2021,17 the equivalent sound load for evoking oVEMPs could be considerably reduced by approximately 40 dB compared to ACS by using a bone conduction stimulus, which is a huge improvement and reduction of the risk for hearing hazard. However, the BCV transducers used clinically today are not optimal for obtaining reproducible oVEMP responses, mainly because these BCV transducers are designed for audiometry, like the B81, and are not always powerful enough at low frequencies. The more powerful Minishaker on the other hand, which was developed for general vibration purposes, is too bulky, requires a separate power amplifier and is more expensive (9200 USD in total according to a recent offer) than the B250 (assumed costs 5 to 10 times lower). In terms of patient safety, the B81 as well as the Minishaker are uncritical and have been used over the last 20 years in vestibular and hearing testing without any adverse events reported that the authors know of. Therefore, it is encouraging to see that the B250 generates similar oVEMP responses as the Minishaker. Dual responses may occur in both cases, with an early n1-p1 more frequent and with higher amplitude for the Minishaker and a late n2–p2 more frequent and with higher amplitude for the B250, which will be further discussed below.
Using a tendon hammer, a much larger impact force level (peak level approximately 4 times higher, Figure 4) than with the B250 and Minishaker can easily be achieved, simply because it was hard to hit with a lower amplitude consistently with a mass of approximately 100 grams at the end on a long shaft. The Tendon hammer pulse also has a lower frequency content than the 250 Hz single sinus (0/1/0) of the B250/Minishaker, as the impulse can roughly be compared to a half sine with a duration of approximately 4 ms corresponding to a 125 Hz sinus signal with a “0-0.5-0 cycles” pattern (ramp up - full signal - ramp down, see Figure 4b). However, as the skull behaves rather linearly at these low frequencies and vibration levels (Håkansson et al, 202037), these differences in stimulus levels and frequency content are not assumed to qualitatively affect a comparison of LDV results between B250/Minishaker and Tendon hammer.
Regarding the AFz and Fz comparison in three subjects, despite here lacking statistic support, it seems that oVEMP (Figure 5 and Table 1) as well as LDV (Figure 6) results are rather robust and differences do not indicate being of clinical importance. This conclusion is further supported by Govender and Colebatch 2018,26 who came to the same conclusion when comparing oVEMP with a 500 Hz stimuli at Fz and AFz in 10 normal young subjects.
Dual oVEMP Responses and Reinvestigation of Fredén Jansson et al
Given the stimulus signal in Figure 4, it was a bit surprising for us that VEMPs have a dual response with an early n1 (average 8.8 ms) and a late n2 (average 12.7 ms) when pooling all data for Fz/AFz from B250 and Minishaker, see Table 2. These findings seem not to be related to the number of positive peaks in the stimulus signal, as the B250 has several resonant oscillations/peaks (like being a longer sine burst), whereas the Minishaker has only one positive peak. Notably, the difference between early and late n1/n2 latencies is around 4 ms, which corresponds to the time period of a single sinus at 250 Hz.
We decided, therefore, to further investigate this finding by re-evaluating oVEMPs measured in 15 healthy subjects (ages 20–37 yrs) with the B250 in a previous study from our lab (Fredén Jansson et al, 202117). In that study, the main purpose was to compare threshold levels of oVEMPs with both B250 and Minishaker, and thus the results had not been analyzed so far regarding the potential existence of dual n-p responses. In the reinvestigation, a 5 dB higher level (150 dB peFL or 75 dB nHL) was chosen, as such results were available and assumed to give more consistent results. The values from the reanalysis are presented in Table 3 and reveal that early and late n1/n2 responses are also present in the majority of the 15 subjects for both the B250 and the Minishaker. Here, the average of the early n1 responses were 8 and 8.5 ms and the late n2 responses were 11.6 and 13.2 ms for the B250 and Minishaker, respectively, with an overall average time difference between n1 and n2 of 4.1 ms. This difference is apparently very close to the difference of 3.9 ms found in the present pilot study, further strengthening the notion that it may be related to the 4 ms period of the 250 Hz stimulus. Furthermore, the re-analysis showed that within the distribution of early versus late responses, the highest peak-to-peak amplitudes were late for all but one for the B250, whereas they were more evenly distributed for the Minishaker, see bold values in Table 3. For n-latencies, significant differences were found between the B250 and Minishaker for n2 (t(10)=−5.087, p<0.001) but not for n1. For p-latencies, the significant differences were observed for p1 (t(12)=−6.003, p<0.001) as well as p2 (t(10)=−3.497, p=0.006).
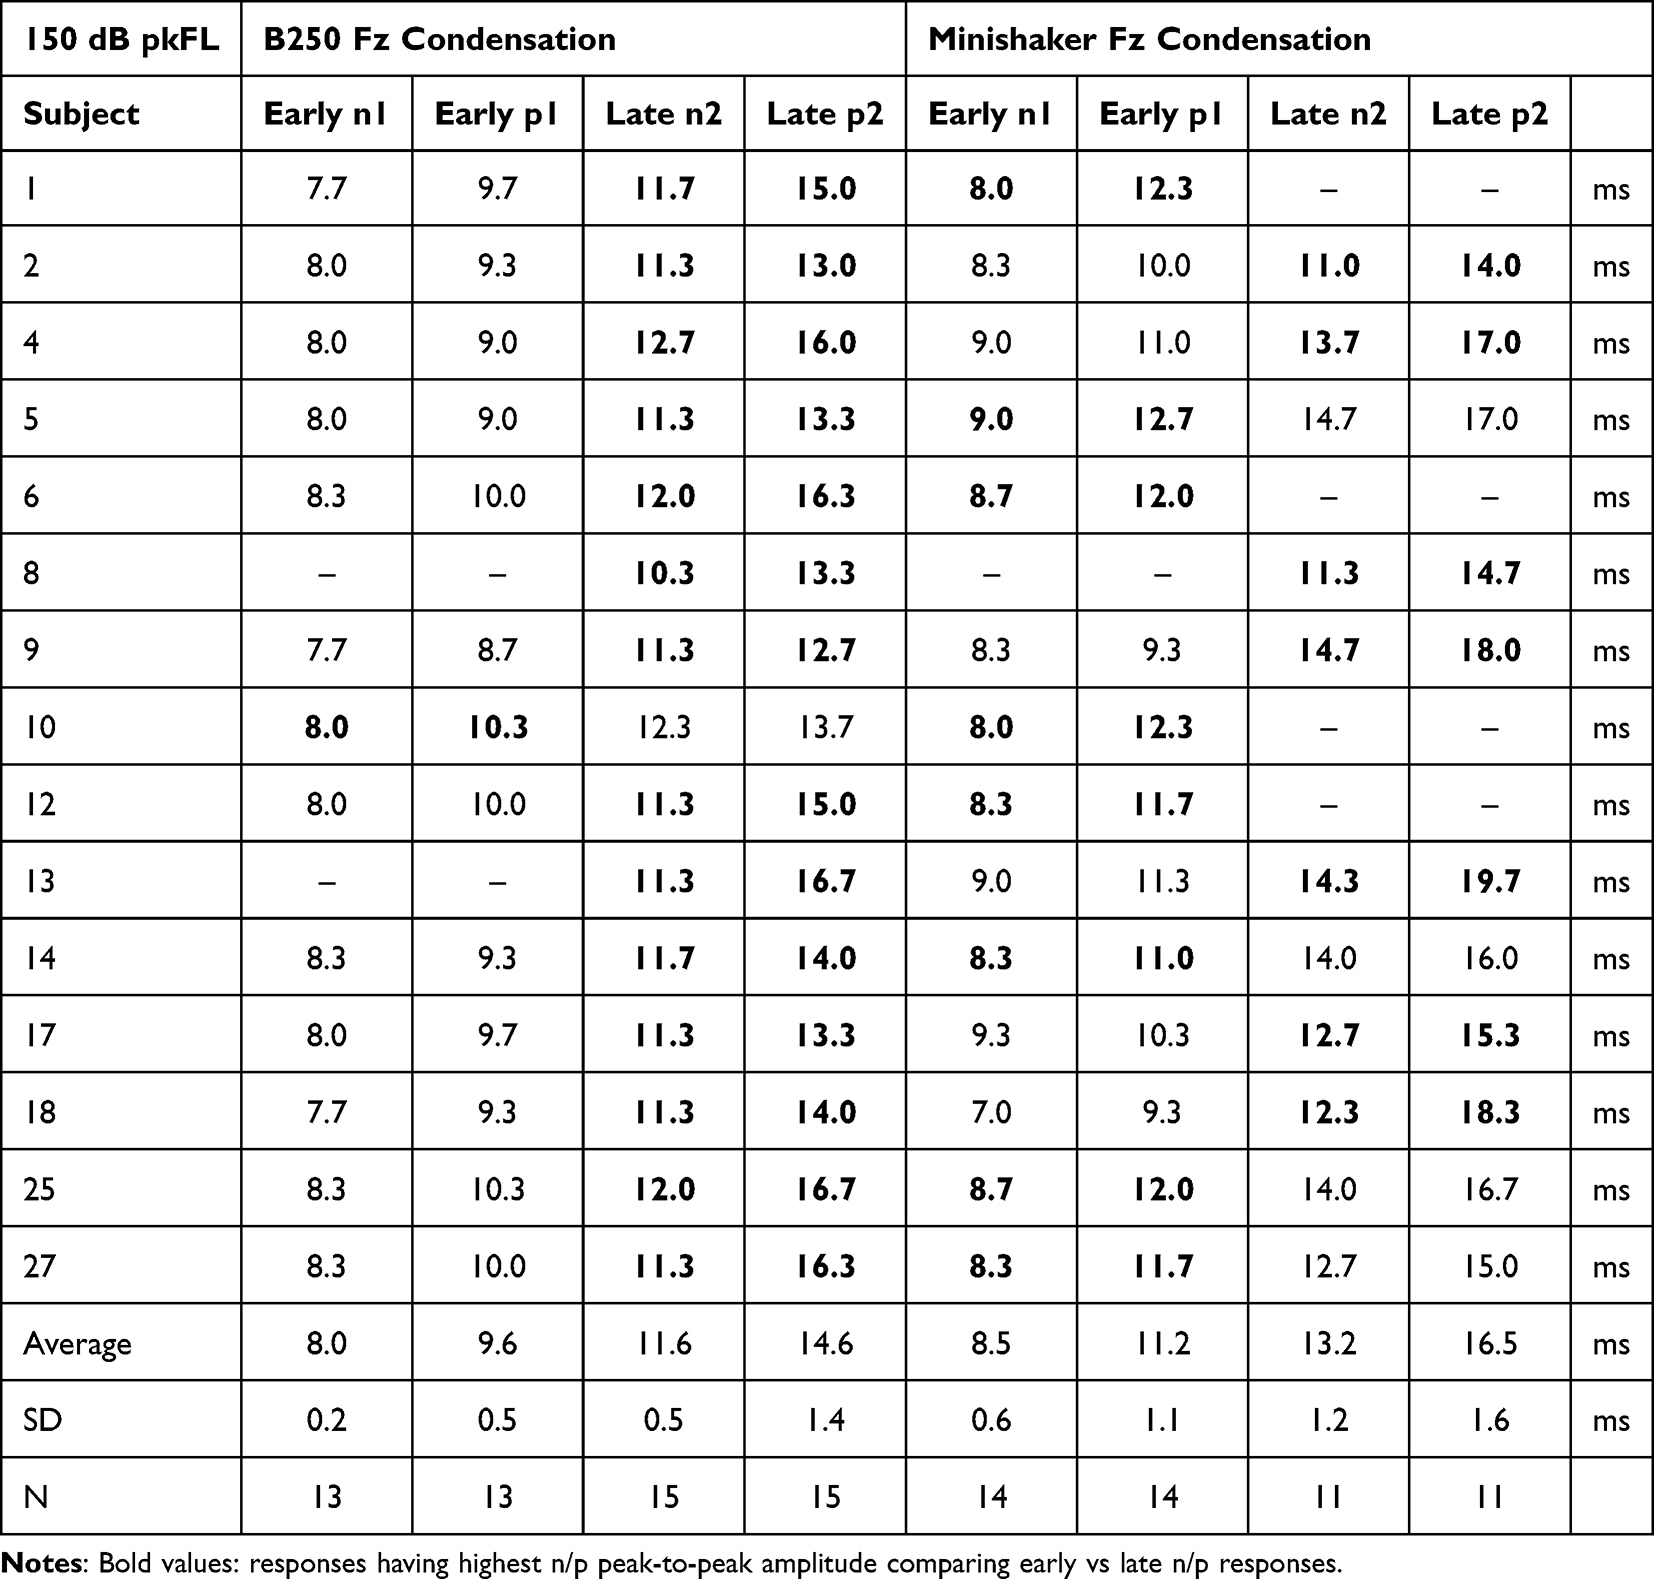 |
Table 3 Reinvestigation of Condensation Latencies from Fredén Jansson et al 202117 |
With regard to oVEMP latencies and amplitudes, the results of the re-investigation with 15 subjects and of the present study clearly indicate the importance of identifying early and late n1/n2 responses for clinical assessment of VEMPs and to avoid incorrect values when averaging over subjects.
A recent study by Dyball et al, 202440 investigated the occurrence of multiple later n peaks and p valleys (“troughs”) in oVEMP recordings named n1, n2, n3 … and p1, p2, p3, etc. The additional peaks (after n1) of their study should not be confused with the dual responses appearing before 15 ms found in the present study, as they appear after 15 ms. The time interval of the dual n1 and n2 found in our study is in the range of their first n1 peak and is, as mentioned above, most likely caused by a different time pattern of the stimuli produced by different transducer types. In Dyball et al, 2024,40 square wave condensation pulses (1 ms duration) were applied as stimuli, similar to our Tendon hammer stimuli, and thus only one positive slope is expected in the acceleration response - and no signal-related double n peaks. However, also our Tendon hammer response has similar additional peaks at around 20 ms or later (their n2 etc), see Figure 5 for S1 and S3. According to Dyball et al, 2024,40 the origin of these later oVEMP responses seems to be of vestibular origin, but the underlying mechanisms are still unclear.
Comparing LDV Response and oVEMP Latencies
In order to understand differences found in oVEMP latencies (Tables 1–3) for the same subjects, but with different stimulation methods, the LDV velocity responses of the skin over the mastoid presented in Figure 6 might give some clues. In order to compare VEMP latencies and LDV skin velocities, we need to make some assumptions:
First, it is assumed that compressing the cranial vault at Fz/AFz creates an almost immediate related lateral movement of the mastoid/temporal bone enclosing the vestibular and cochlear spaces. This assumption is supported by the almost immediate positive LDV response in the lateral (outward) direction in Figure 6. This initial outward movement was also shown by Iwasaki et al, 200834 who used 3D accelerometers firmly attached over the mastoids when stimulated with a tendon hammer at Fz. The rationale for this behavior is outside the scope of this paper, but a possible explanation could be as follows. A compression excitation of the cranial vault of the skull requires lateral expansion like a ball to maintain volume. This cranial vault compression also creates an almost immediate increase of pressure in fluids and soft tissues (both mainly incompressible) in the brain cavity which further promotes pressing the lateral parts of the skull bone outwards. Application of BCV to Fz/AFz might also per se involve a direct mechanism causing the intra-vestibular/cochlear fluid to move, thus deflecting the stereocilia of the otolith organs (Curthoys et al, 201841). Any direct fluid mechanism, if existing, may act simultaneously with bone movement, so it may not matter in this comparative analysis of LDV and oVEMP latencies.
Second, it is assumed that the whole mastoid/temporal bone portion encapsulating the inner ear moves like a rigid body at these low frequencies (Håkansson et al, 2020,37 Stenfelt 201138). This assumption is also supported by the very fast initial response of the mastoid velocity in Figure 6a, which is almost the same as the stimulus force measured in the artificial mastoid (Figure 4a). Further support for this notion comes from Iwasaki et al, 2008,34 who used 3D accelerometers and found that “relative amplitudes of the X, Y and Z components were basically similar across subjects” ie X, Y, Z components were linearly related for low frequencies. This means that it may be sufficient to measure the vibration response of the mastoid in one direction as other directions will move accordingly. Thus, a relative difference in amplitude in one direction will probably be the same in other directions when comparing different stimuli and transducers applied at the same distant point (Fz or AFz).
According to Curthoys et al, 2006,42 2018,41 the oVEMP response is elicited as a result of acceleration (or actually the change of acceleration referred to as “jerk”), and not primarily the velocity pattern of the vestibular stimuli. The acceleration pattern has thus been derived from the measured LDV response, by differentiating adjacent velocity values in Figure 6 and a division by the time increment of 0.1 ms, as shown in Figure 7a. The acceleration pattern is presented for the first 10ms after stimulus onset, as an average from all subjects and both Fz and AFz positions. First, note that both the B250 and the Minishaker have an early acceleration peak that occurs approximately at the same time and 2 ms earlier than the peak acceleration using the tendon hammer. Second, note that the second acceleration peak for the B250 and the Minishaker occurs later than the peak of the tendon hammer. It is assumed that it is the positive slope of the acceleration response (Figure 7a), representing the “jerk”, which might deflect the stereocilia in some way and thus elicit the VEMP reflex (Curthoys et al, 2006,42 201841). Most importantly in Figure 7a, both B250 and Minishaker have two positive slopes in terms of acceleration, ie, both are prone to elicit dual (early and late) n-p responses when a single sinus is used as a stimulus, reflected by dual n1-p1 and n2-p2 responses in the present study.
 |
Figure 7 (a) Average acceleration responses of all subjects, from the LDV at the mastoid with Fz stimuli from B250 (red), Minishaker (green) and Tendon hammer (black). The two transducers are excited by a 250 Hz condensation full cycle sinus and the Tendon hammer response is excited by a single impulse. Also, the results from the corresponding oVEMP latencies are illustrated by filled square dots (early n1) and filled round dots (late n2). Open square dots are placed symbolically where a rarefaction stimulus is expected to generate an early n1 for B250/Minishaker. (b) oVEMP results from B250 at Fz on subject S3 with both a condensation (“Cond”, red) and a rarefaction (“Rare”, blue) stimulus, the latter giving a dominant early n1 “Rare” peak at around 10 ms. Corresponding p valleys are marked and used for Vpp amplitude calculation (9 and 73 μV for “Cond pk/pk” and 78 μV for “Rare pk/pk”). For details, see text. |
The level at which the jerk is eliciting the reflex is unknown, but the point in time should be somewhere in the slope between zero and the max peak of the acceleration response. In order to visualize the results from the oVEMP latencies with the LDV acceleration response, the latency for n1 is marked in Figure 7a by a filled square dot halfway up on the first positive peak of the B250 and Minishaker acceleration responses. Then, a filled round dot was placed 3.6 ms (B250) and 4.5 ms (Minishaker) later taken from the difference of n1 and n2 in Table 2. This analysis is only based on three subjects but gives a conceptual idea that dual early n1 and late n2 peaks for both the B250 and Minishaker, driven by a full sinus 250 Hz stimulus may occur with approximately 4 ms in time difference. It should be noted that the acceleration response is obtained in one single registration, where the head with reflector should be as still as possible (minor movements from breathing, heartbeat and unconscious movement are always present), whereas oVEMPs are more stable and registered after averaging of EMG signals.
Outlook: Possible Implications of Condensation versus Rarefaction Stimuli at Fz
The analysis of the acceleration response in Figure 7a further suggests that a rarefaction stimulus might be a better alternative than condensation for the B250 at Fz/AFz. This is because inverting the acceleration responses in Figure 7a implies that a first positive peak will show up a bit later (see open square dots) and with a much higher slope (stronger jerk), as this is elicited during the second half-cycle of the B250 response where the output force has built up a bit more (see the response in Figure 4a).
In order to further investigate this assumption, a repeated oVEMP measurement was made on subject S3 with the B250 at Fz, but now with a rarefaction stimulus. As seen in Figure 7b, with both the condensation and the rarefaction results presented, a stronger first n1 rarefaction response with a higher Vpp value now appears at 10 ms. This result suggests that a rarefaction stimulus might be preferred if a 250 Hz full sinus is used at Fz (also AFz yielded a similar result). In this situation, the normal oVEMP will be closer to the n10 obtained with the Tendon hammer and the issue with dual early/late responses may disappear. The observation that a rarefaction stimulus gives a later n1 was further confirmed in the re-investigation of the Fredén Jansson et al, 202117 study, where a rarefaction stimulus was also used for both the B250 and the Minishaker (Table 4): the average n1 latency among the 15 subjects with rarefaction stimuli was 9.6 (SD 0.4) ms and 10.8 (SD 0.4) ms for the B250 and the Minishaker, respectively.
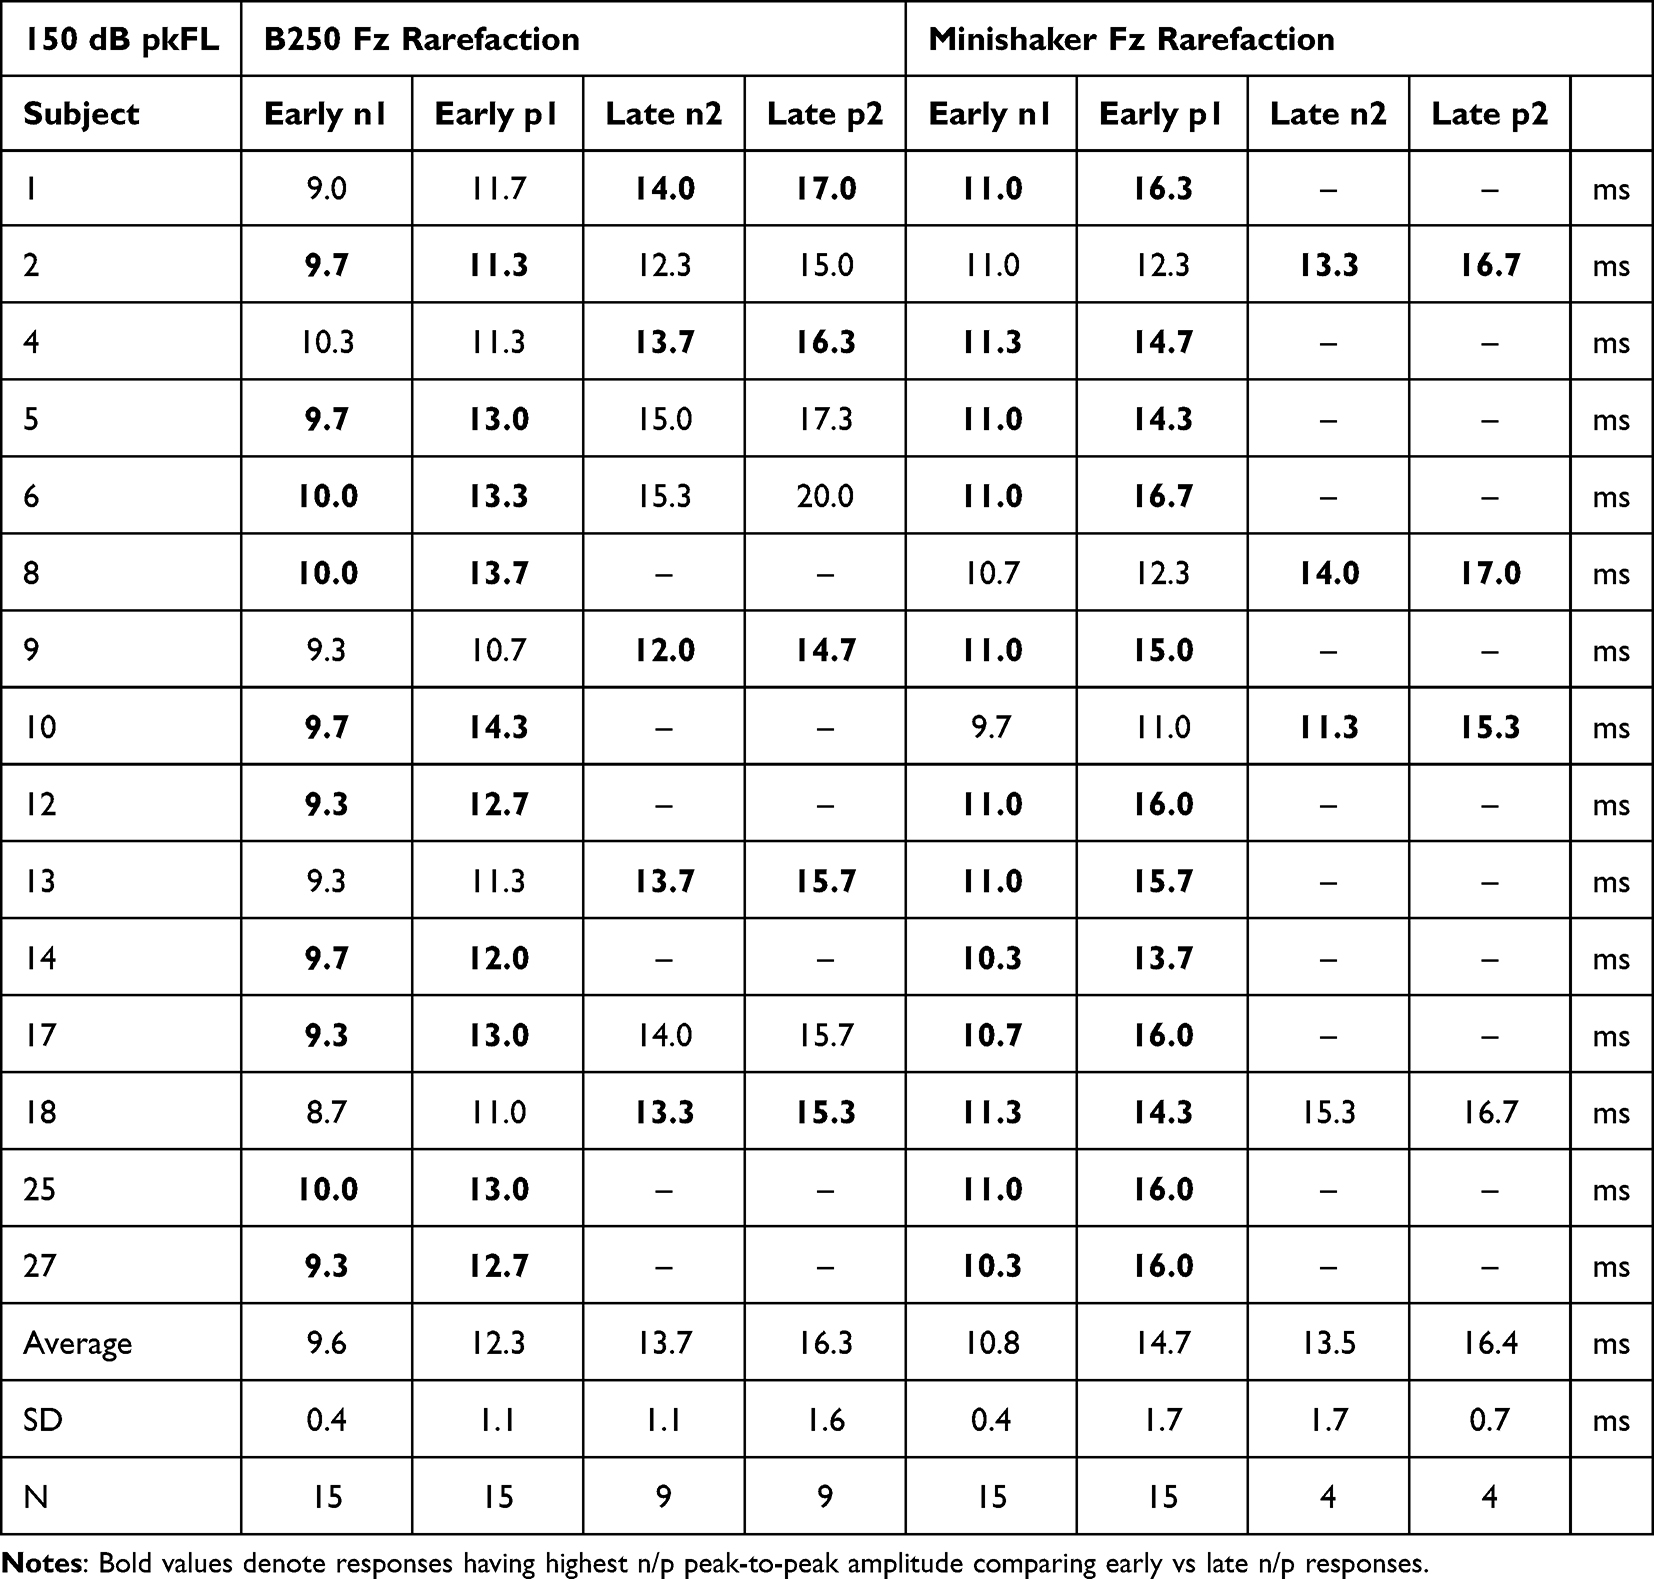 |
Table 4 Reinvestigation of Rarefaction Latencies from Fredén Jansson et al 202117 |
Most results in this pilot study are indicative and further studies are planned to validate the use of the B250 in VEMPs by clinical randomized controlled trials as well as vibrometric and pressure probe studies of vestibular vibration dynamics from mechanic stimuli on cadaver heads.
Conclusion
The results of the present study suggest that the B250 may serve as a potential alternative to the Minishaker and tendon hammer to evoke oVEMP responses in clinical practice, with forehead stimuli at AFz preferred over Fz for attachment reasons.
This study further shows that dual oVEMP responses may occur with both the B250 and the Minishaker using a condensation stimulus, one “early” (n1=8.8 ms for both transducers) and one “late” (n2=12.4/13.3 ms). This time difference is close to the 4 ms time period of a 250 Hz stimulus. While the late oVEMP amplitude (n2p2) is higher than the early response (n1p1) for the B250 in most cases, the situation is vice versa for the Minishaker. Furthermore, the results show that polarity of the stimuli (condensation or rarefaction) affects the results. Thus, a polarity check of the stimulus force is of utmost importance. It was also found that a rarefaction stimulus might be preferable over a condensation stimulus for 250 Hz stimulus frequency of the B250 at Fz and possibly also for other nearby frequencies and with the Minishaker as well.
More subjects are needed in future studies to validate the present results.
Acknowledgments
Ian Curthoys and Leigh McGarvie have contributed to this study by valuable comments, suggestions and discussions that are highly acknowledged. This study was partly supported by a grant from Promobilia (20006, F20605) and Swedish Hearing Research foundation (2017-552).
Disclosure
Professor Håkansson reports grants from Hearing Research Foundation HRF, Promobilia Foundation, outside the submitted work; and he has invented the BEST principle that is used in the B250 design, but patents have now lapsed. Non-CE marked B250 prototypes used in this study (not for commercial use) have been manufactured and bought from Ortofon A/S, Denmark. The authors report no other conflicts of interest in this work.
References
1. Teggi R, Manfrin M, Balzanelli C, et al. Point prevalence of vertigo and dizziness in a sample of 2672 subjects and correlation with headaches. Acta Otorhinolaryngol Ital. 2016;36(3):215–16. PMID: 27214833; PMCID: PMC4977009. doi:10.14639/0392-100X-847
2. Muelleman T, Shew M, Subbarayan R, et al. Epidemiology of dizzy patient population in a neurotology clinic and predictors of peripheral etiology. Otol Neurotol. 2017;38(6):870–875. PMID: 28498271. doi:10.1097/MAO.0000000000001429
3. Ferreira AL, Windsor AM, Hwa TP, et al. Dizziness and imbalance across the lifespan: findings of a pediatric and adult vestibular clinic. Otolaryngol Head Neck Surg. 2025;172(1):254–261. PMID: 39210724. doi:10.1002/ohn.962
4. Verrecchia L, Brantberg K, Tawfique Z, et al. Diagnostic accuracy of ocular vestibular evoked myogenic potentials for superior canal dehiscence syndrome in a large cohort of dizzy patients. Ear Hear. 2019;40(2):287–294. PMID 29889159. doi:10.1097/AUD.0000000000000613
5. Curthoys IS, McGarvie LA, MacDougall HG, et al. A review of the geometrical basis and the principles underlying the use and interpretation of the video head impulse test (vHIT) in clinical vestibular testing. Front Neurol. 2023;14:1147253. PMID: 37114229; PMCID: PMC10126377. doi:10.3389/fneur.2023.1147253
6. Rosengren SM, Colebatch JG, Young AS, Govender S, Welgampola MS. Vestibular evoked myogenic potentials in practice: methods, pitfalls and clinical applications. Clin Neurophysiol Pract. 2019;4:47–68. PMID: 30949613; PMCID: PMC6430081. doi:10.1016/j.cnp.2019.01.005
7. Curthoys IS, Dlugaiczyk J. Physiology, clinical evidence and diagnostic relevance of sound-induced and vibration-induced vestibular stimulation. Curr Opin Neurol. 2020;33(1):126–135. PMID: 31789675. doi:10.1097/WCO.0000000000000770
8. Curthoys IS. A critical review of the neurophysiological evidence underlying clinical vestibular testing using sound, vibration and galvanic stimuli. Clin Neurophysiol. 2010;121(2):132–144. PMID: 19897412. doi:10.1016/j.clinph.2009.09.027
9. Fröhlich L, Wilke M, Plontke SK, Rahne T. Influence of bone conduction transducer type and placement on ocular and cervical vestibular evoked myogenic potentials. Sci Rep. 2021;11(1):8500. PMID: 33875696; PMCID: PMC8055867. doi:10.1038/s41598-021-87682-1
10. Allen D, Ribiero L, Arshad Q, Seemungal BM. Age-related vestibular loss: current understanding and future research directions. Front Neurol. 2016;7:231. Erratum in: Front Neurol. 2017;8:391. doi: 10.3389/fneur.2017.00391. PMID: 28066316; PMCID: PMC5165261. doi:10.3389/fneur.2016.00231
11. Tseng C-L, Chou C-H, Young Y-H. Aging effect on the ocular vestibular-evoked myogenic potentials. Otol Neurotol. 2010;31(6):959–963. doi:10.1097/MAO.0b013e3181e8fb1a
12. Singh NK, Keloth NK, Sinha S. Is there a safe level for recording vestibular evoked myogenic potential? Evidence from cochlear and hearing function tests. Ear Hear. 2019;40(3):493–500. doi:10.1097/AUD.0000000000000646
13. Asakura S, Kamogashira T. Sudden bilateral hearing loss after vestibular-evoked myogenic potentials. Clin Case Rep. 2021;9(11). PMID: 34849224; PMCID: PMC8607976. doi:10.1002/ccr3.5025
14. Colebatch JG, Rosengren SM. Safe levels of acoustic stimulation for vemps: comment on “Sudden bilateral hearing loss after cervical and ocular vestibular evoked myogenic potentials”. Otol Neurotol. 2016;37(1):117–118. PMID: 26649612. doi:10.1097/MAO.0000000000000912
15. Strömberg AK, Olofsson Å, Westin M, Duan M, Stenfelt S. Changes in cochlear function related to acoustic stimulation of cervical vestibular evoked myogenic potential stimulation. Hear Res. 2016;340:43–49. PMID: 26724755. doi:10.1016/j.heares.2015.12.022
16. Håkansson B, Jansson K-JF, Tengstrand T, et al. VEMP using a new low-frequency bone conduction transducer. Med Devices. 2018;11:301–312. doi:10.2147/MDER.S171369
17. Fredén Jansson K-J, Håkansson B, Reinfeldt S, Persson A-C, Eeg-Olofsson M. Bone conduction stimulated VEMP using the B250 transducer. Med Devices. 2021;14:225–237. doi:10.2147/MDER.S317072
18. Dlugaiczyk J. Functional aspects of vestibular evoked myogenic potentials. In: Fritzsch B, Straka H, editors. The Senses: A Comprehensive Reference. Vol. 6. Elsevier, Academic Press; 2020:672–698.
19. Halmagyi GM, Yavor RA, Colebatch JG. Tapping the head activates the vestibular system: a new use for the clinical reflex hammer. Neurology. 1995;45(10):1927–1929. doi:10.1212/WNL.45.10.1927
20. Iwasaki S, McGarvie LA, Halmagyi GM, et al. Head taps evoke a crossed vestibulo-ocular reflex. Neurology. 2007;68(15):1227–1229. PMID: 17420408. doi:10.1212/01.wnl.0000259064.80564.21
21. Hecker DJ, Lohscheller J, Schorn B, Koch KP, Schick B, Dlugaiczyk J. Electromotive triggering and single sweep analysis of Vestibular Evoked Myogenic Potentials (VEMPs). IEEE Trans Neural Syst Rehabil Eng. 2014;22(1):158–167. PMID: 23529108. doi:10.1109/TNSRE.2013.2252627
22. Håkansson B. The balanced electromagnetic separation transducer- A new bone conduction transducer. J Acoust Soc Am. 2003;113(2):818–825. doi:10.1121/1.1536633
23. Fredén Jansson K-J, Håkansson B, Johannsen L, Tengstrand T. Electro-acoustic performance of the new bone vibrator Radioear B81: a comparison with the conventional Radioear B71. Int J Audiol. 2015;54:334–340. doi:10.3109/14992027.2014.980521
24. Clinard CG, Piker EG, Thorne AP, et al. Maximum output and low-frequency limitations of B71 and B81 clinical bone vibrators: implications for vestibular evoked potentials. Ear Hear. 2020;41(4):847–854. PMID: 31613822. doi:10.1097/AUD.0000000000000808
25. Schütz H-K, Dlugaiczyk J, Fröhlich L, et al. Influence of reference electrode position on the recording of ocular vestibular evoked myogenic potentials. Otol Neurotol. 2026; 47(2): e391–e399. doi:10.1097/MAO.0000000000004722
26. Govender S, Colebatch JG. Location and phase effects for ocular and cervical vestibular-evoked myogenic potentials evoked by bone-conducted stimuli at midline skull sites. J Neurophysiol. 2018;119(3):1045–1056. PMID: 29357475. doi:10.1152/jn.00695.2017
27. Fredén Jansson K-J, Håkansson B, Persson A-C, Verrecchia L, Reinfeldt S. Electroacoustic evaluation of the bone conduction transducer B250 for vestibular and hearing diagnostics in comparison with Radioear B71 and B81. Int J Audiol. 2024;1–7. doi:10.1080/14992027.2024.2352054
28. Plontke SK, Rahne T, Curthoys IS, Håkansson B, Fröhlich L. A case series shows independent vestibular labyrinthine function after major surgical trauma to the human cochlea. Commun Med. 2021;1:37. doi:10.1038/s43856-021-00036-w
29. Rahne T, Plontke SK, Strauss C, et al. Bone conduction stimulated VEMPs by using the B250 transducer to assess the nerve of origin of sporadic vestibular schwannomas. Sci Rep. 2024;14:26483. doi:10.1038/s41598-024-78060-8
30. Dlugaiczyk J, Burgess AM, Curthoys IS. Activation of Guinea Pig irregular semicircular canal afferents by 100 Hz vibration: clinical implications for vibration-induced nystagmus and vestibular-evoked myogenic potentials. Otol Neurotol. 2020;41(7):e961–e970. PMID: 32658114. doi:10.1097/MAO.0000000000002791
31. Burgess AM, Mezey LE, Manzari L, MacDougall HG, McGarvie LA, Curthoys IS. Effect of stimulus rise-time on the ocular vestibular-evoked myogenic potential to bone-conducted vibration. Ear Hear. 2013;34(6):799–805. PMID: 23732683. doi:10.1097/AUD.0b013e318294e3d2
32. Rahne T, Schütz H, Dlugaiczyk J, Fröhlich L, Fredén Jansson K-J, Håkansson B. On the definition and implications of stimulus polarity for the recording of ocular vestibular evoked myogenic potentials. Hear Res. 2025;465:109344. doi:10.1016/j.heares.2025.109344
33. Rosengren SM, Welgampola MS, Colebatch JG. Vestibular evoked myogenic potentials: past, present and future. Clin Neurophysiol. 2010;121(5):636–651. PMID: 20080441. doi:10.1016/j.clinph.2009.10.016
34. Iwasaki S, Smulders YE, Burgess AM, et al. Ocular vestibular evoked myogenic potentials to bone conducted vibration of the midline forehead at Fz in healthy subjects. Clin Neurophysiol. 2008;119(9):2135–2147. doi:10.1016/j.clinph.2008.05.028
35. Welgampola MS, Rosengren SM, Halmagyi GM, Colebatch JG. Vestibular activation by bone conducted sound. J Neurol Neurosurg Psychiatry. 2003;74:771–778. doi:10.1136/jnnp.74.6.771
36. Chihara Y, Iwasaki S, Fujimoto C, Ushio M, Yamasoba T, Murofushi T. Frequency tuning properties of ocular vestibular evoked myogenic potentials. NeuroReport. 2009;20:1491–1495. doi:10.1097/WNR.0b013e3283329b4a
37. Håkansson B, Woelflin F, Tjellström A, Hodgetts W. The mechanical impedance of the human skull via direct bone conduction implants. Med Devices. 2020;13:293–313. doi:10.2147/MDER.S260732
38. Stenfelt S. Acoustic and physiologic aspects of bone conduction hearing. Adv Otorhinolaryngol. 2011;71:10–21. PMID: 21389700. doi:10.1159/000323574
39. Grant W, Curthoys I. Otoliths - Accelerometer and seismometer; Implications in Vestibular Evoked Myogenic Potential (VEMP). Hear Res. 2017;353:26–35. PMID: 28777976. doi:10.1016/j.heares.2017.07.012
40. Dyball AC, Wu XP, Kwok BYC, et al. After the n10: late oVEMP peaks in patients with unilateral vestibular loss and healthy volunteers. Exp Brain Res. 2024;243(1):10. PMID: 39617808. doi:10.1007/s00221-024-06947-z
41. Curthoys IS, Grant JW, Burgess AM, Pastras CJ, Brown DJ, Manzari L. Otolithic receptor mechanisms for vestibular-evoked myogenic potentials: a review. Front Neurol. 2018;9. doi:10.3389/fneur.2018.00366
42. Curthoys IS, Kim J, McPhedran SK, Camp AJ. Bone conducted vibration selectively activates irregular primary otolithic vestibular neurons in the Guinea pig. Exp Brain Res. 2006;175(2):256–267. PMID: 16761136. doi:10.1007/s00221-006-0544-1
 © 2026 The Author(s). This work is published and licensed by Dove Medical Press Limited. The
full terms of this license are available at https://www.dovepress.com/terms
and incorporate the Creative Commons Attribution
- Non Commercial (unported, 4.0) License.
By accessing the work you hereby accept the Terms. Non-commercial uses of the work are permitted
without any further permission from Dove Medical Press Limited, provided the work is properly
attributed. For permission for commercial use of this work, please see paragraphs 4.2 and 5 of our Terms.
© 2026 The Author(s). This work is published and licensed by Dove Medical Press Limited. The
full terms of this license are available at https://www.dovepress.com/terms
and incorporate the Creative Commons Attribution
- Non Commercial (unported, 4.0) License.
By accessing the work you hereby accept the Terms. Non-commercial uses of the work are permitted
without any further permission from Dove Medical Press Limited, provided the work is properly
attributed. For permission for commercial use of this work, please see paragraphs 4.2 and 5 of our Terms.