Back to Journals » Diabetes, Metabolic Syndrome and Obesity » Volume 13
Obstructive Sleep Apnea Exacerbates Glucose Dysmetabolism and Pancreatic β-Cell Dysfunction in Overweight and Obese Nondiabetic Young Adults
Authors Li N, Fan Y, Zhou JP, Maimba OD, Zhang L, Li QY ![]()
Received 19 February 2020
Accepted for publication 5 June 2020
Published 10 July 2020 Volume 2020:13 Pages 2465—2476
DOI https://doi.org/10.2147/DMSO.S250463
Checked for plagiarism Yes
Review by Single anonymous peer review
Peer reviewer comments 2
Editor who approved publication: Prof. Dr. Juei-Tang Cheng
Ning Li,1,2,* Yun Fan,1,2,* Jian Ping Zhou,1,2,* Ocholi Don Maimba,3 Liu Zhang,1,2 Qing Yun Li1,2
1Department of Respiratory and Critical Care Medicine, Ruijin Hospital, Shanghai Jiao Tong University School of Medicine, Shanghai 200025, People’s Republic of China; 2Institute of Respiratory Disease, Shanghai Jiao Tong University School of Medicine, Shanghai 200025, People’s Republic of China; 3Department of Clinical Medicine, Shanghai Jiao Tong University School of Medicine, Shanghai 200025, People’s Republic of China
*These authors contributed equally to this work
Correspondence: Qing Yun Li
Department of Respiratory and Critical Care Medicine, Ruijin Hospital,Shanghai Jiao Tong University School of Medicine, No. 197 Ruijin 2nd Road, Shanghai 200025, People’s Republic of China
, Email [email protected]
Purpose: This study aimed to investigate the effects of obstructive sleep apnea (OSA) on the pancreatic β-cells dysfunction and their implications in the glucose dysmetabolism of overweight and obese nondiabetic young adults.
Materials and Methods: The cross-sectional analysis included 422 subjects (261 males/161 females) with the mean age of 27.77 ± 7.51 years and average body mass index (BMI) of 34.84 ± 5.69 kg/m2. All subjects underwent polysomnography (PSG), oral glucose tolerance-insulin releasing test (OGTT-IRT) and serum glycosylated hemoglobin A1 (HbA1c) measurement. The glucose metabolism and pancreatic β-cell function in relation to measures of OSA were determined adjustment for important confounders such as age and sex.
Results: OSA subjects accounted for 54.91% in the normal glucose tolerance (NGT) group and 72.11% in the prediabetes (preDM) group (P =0.001). HbA1c was the highest in the preDM subjects with severe OSA. In the NGT subjects, the 1-h glucose level significantly elevated with the OSA severity, and the homeostasis model assessment-β (HOMA-β) was negatively related to nocturnal mean SpO2 (P < 0.05). In the preDM subjects, HOMA-β, early phase insulinogenic index (∆I30/∆G30), total area under the curve of insulin in 180 min (AUC-I180), and the oral disposition index (DIO) were the lowest in the severe OSA group. DIO was associated with higher oxygen desaturation index (ODI) and lower nocturnal mean SpO2, and AUC-I180 was negatively related to TS90 (P < 0.05).
Conclusion: Our study indicated higher prevalence of OSA in overweight and obese nondiabetic young adults, especially preDM subjects. The impaired glucose tolerance was observed early after glucose intake in the NGT subjects. OSA induces compensatory increase in the pancreatic β-cell function in the NGT subjects, while pancreatic β-cell dysfunction is present in the preDM subjects with severe OSA.
Keywords: obstructive sleep apnea, obesity, nondiabetes, glucose tolerance, pancreatic β-cell function
Introduction
Type 2 diabetes (T2DM) has been a major health problem worldwide and its prevalence increases in the developing Asian countries,1 particularly China.2 Currently, the incidence of T2DM in young adults is dramatically increasing worldwide and is strongly associated with the rise of obesity.3,4 Subjects are classified as young-onset T2DM if they were diagnosed with T2DM <45 years.3,5 The risk for the development of micro- and macrovascular complications is much higher in T2DM diagnosed <45 years compared to T2DM diagnosed >45 years.4,5 Obstructive sleep apnea (OSA) is a common sleep disorder, affecting 17% of the total population and 40–70% of the obese population.6 The prevalence of OSA has increased over the past two decades, and is even higher than 50% in some countries,7 due to the increases in the age and body mass index (BMI).8 Obesity is the most important risk factor for OSA, and both obesity and OSA are high-risk factors for glucose dysmetabolism.9 Despite a large variety of epidemiologic and clinical evidence suggests that OSA is an independent risk factor for T2DM,8 whether the association is due to OSA mediated changes in glucose metabolism or simply reflects an association with obesity is not well understood among overweight and obese adults aged <45 years.6,10
Hyperglycemia, a state of prediabetes (preDM), is a high-risk state for diabetes and can be further subdivided into isolated impaired fasting glucose (i–IFG), isolated impaired glucose tolerance (i–IGT), and a combination of both (IFG/IGT).1,11 American Diabetes Association (ADA) expert panel estimates that 70% of preDM subjects will ultimately develop T2DM.12 Insulin resistance (IR) and pancreatic β-cell dysfunction are two major risk factors in the pathogenesis of preDM and T2DM.13 The β-cell dysfunction with progressive loss of pancreatic β-cell insulin secretion are key defects associated with the transition from a healthy glycemic state to hyperglycemia,14 which has been observed in high-risk individuals long before the presence of hyperglycemia.15 The development of diabetic hyperglycemia in young adults seems to be more strongly dependent on β-cell failure than in older patients.4 While previous studies have proposed that sleep apnea can increase IR and deteriorate insulin sensitivity, little is known about the OSA-related alterations of pancreatic β-cell secretion function, especially in nondiabetic young adults.8,13
The ADA and American Association of Clinical Endocrinologists (AACE) recommend preDM testing in adults younger than 45 years with BMI greater than or equal to 25 kg/m.4,16 Lifestyle modification and pharmacotherapy are important for the prevention and treatment of both preDM and T2DM,12,17 but the effect of continuous positive airway pressure (CPAP) therapy on overall glycemic control remains contradictory.18 Hence, this study was to investigate the glucose dysmetabolism and pancreatic β-cell dysfunction in the normal glucose tolerance (NGT) and preDM subjects in overweight and obese states from 18 to 45 years. Moreover, the effects of OSA on the pancreatic β-cell dysfunction and their implications in the glucose dysmetabolism were further explored, which may provide evidence about the role of OSA in the management of diabetes among overweight and obese young adults.
Materials and Methods
Study Sample
This study was a cross-sectional analysis performed between September 2009 and December 2017 at the Sleep Disorders Center of Ruijin Hospital, Shanghai Jiao Tong University. Our study sample included overweight and obese subjects aged 18 to 45 years. We excluded subjects without standard oral glucose tolerance test – insulin releasing test (OGTT-IRT) and clinical examinations. The demographic characteristics, smoking status, and medical history were recorded for each subject. The BMI was calculated by dividing weight by the squared height (kg/m2), and we combined the definition of overweight or obesity as BMI ≥ 25 kg/m2 according to the World Health Organization criteria.19 The smokers referred to those regularly consuming 10–20 cigarettes/day for at least 3 years.20 The subjects had no history of sleep disorders other than OSA (e.g. central sleep apnea syndrome, restless leg syndrome, narcolepsy, etc.), previous treatments for OSA (e.g. CPAP, surgery and oral device, etc.), neural-muscular diseases, type 1 diabetes or other endocrine disorders, T2DM treated with glucose-lowering drugs or insulin, liver or pancreatic diseases, alcohol abuse, malignancies, pregnancy, hypoxemic lung diseases, acute and/or chronic infections, autoimmune diseases, and current treatment with anti–inflammatory drugs (such as corticosteroids, non-steroid anti–inflammatory drugs, and immunosuppressive agents, etc.). The postmenopausal women and those with definite or suspected polycystic ovary syndrome (PCOS) based on hyperandrogenemia were also excluded. The study was approved by the Ethics Committee of Ruijin Hospital ([2018] No.107) and performed in accordance with the Declaration of Helsinki. Written informed consent was obtained from all subjects.
Polysomnographic Evaluation
The PSG (Alice 5, Philips Respironics, Pennsylvania, USA) channels included four electroencephalogram (EEG), submental electromyogram (EMG), two electrooculogram (EOG; right and left), and two electrocardiography (ECG) channels, pulse oxygen saturation, oral and nasal airflow, nasal air pressure, thoracic-abdominal respiratory movement, snoring microphone, and body position channels. Only edited records with more than 4 h of good-quality signals were included for further analysis. Apnea was defined as a respiratory event with a drop in the nasal airflow by ≥ 90%, and hypopnea as a drop in peak signal excursions by ≥ 30% of pre-event baseline using nasal pressure for at least 10 s with a ≥ 4% oxygen desaturation from pre-event baseline.21 Based on the apnea-hypopnea index (AHI), participants were divided into three groups: control group (AHI: < 5), mild-to-moderate OSA group (AHI: 5–29.9) and severe OSA group (AHI: ≥ 30) groups.22 The oxygen desaturation index (ODI) is a measure of the number of times per hour that oxygen saturation decreases per hour, which was defined as the total number of at least 4% oxygen desaturations per total sleep time in hours.23,24 The mean oxygenation saturation (mean SpO2) was defined as the mean pulse oxygen saturation during the sleep period at night. The percentage of sleep duration with SpO2 < 90% (TS90) and lowest nocturnal oxygen saturation (LSpO2) were also determined as previously reported.22
OGTT-IRT
All the subjects underwent a standard 75-g OGTT-IRT test on the second day after overnight fast. Baseline blood samples were obtained at 0 min. Subsequent blood samples were collected at 30 min, 1 hr, 2 hrs and 3 hrs after taking 75 g of glucose within 5 mins immediately. The OGTT-IRT was designed to assess insulin secretory patterns under physiological conditions while capturing the complex interrelationship between glucose levels and insulin action.14,25 Routine glucose-oxidase assay (CX-7 Biochemical Autoanalyzer; Beckman, Brea, California, USA) and electrochemiluminescence immunoassay (Cobas e601 immunoassay analyzer, Roche Diagnostics, Indianapolis, Indiana, USA) were used to measure plasma glucose and serum insulin levels, respectively. Glycosylated hemoglobin A1c (HbA1c) was determined from high-performance liquid chromatography (VARIANT II Hemoglobin Testing System, Bio-Rad Laboratories, Hercules, California, USA). Based on the OGTT, the serum glucose was categorized as follows:1,11 (1) normal glucose tolerance (NGT): fasting glucose <6.1 mmol/L and 2-h glucose <7.8 mmol/L. (2) impaired fasting glucose (i–IFG): fasting glucose ≥6.1 mmol/L and <7.0 mmol/L, and 2-h glucose <7.8 mmol/L. (3) impaired glucose tolerance (i–IGT): fasting glucose <6.1 mmol/L, and 2-h glucose ≥7.8 mmol/L and <11.1mmol/L. (4) IFG combined with IGT (IFG/IGT): fasting glucose ≥6.1mmol/L and <7.0mmol/L, and 2-h glucose ≥7.8 mmol/L and <11.1 mmol/L. Pre-DM was defined as either i–IFG, i–IGT or IFG/IGT.
For the evaluation of baseline insulin sensitivity, homeostasis model assessment-IR (HOMA-IR) was calculated as fasting insulin × fasting glucose/22.5. The hyperinsulinemia was defined as fasting insulin ≥12.2 μU/mL, and insulin resistance as HOMA-IR ≥2.5.26 To assess the baseline insulin secretion of pancreatic β cells, homeostasis model assessment-β (HOMA-β) was calculated as fasting insulin × 20/(fasting glucose −3.5).27 To assess the first-phase (early) insulin secretion after the oral glucose load, 0–30 min insulinogenic index was measured during the OGTT as the difference in the insulin concentration between 30 min and 0 min divided by the difference in the glucose concentration between 30 min and 0 min (ΔI30/ΔG30).25 The total area under the curve of insulin in 180 min (AUC-I180) was calculated the insulin curve by the trapezoidal rule during the OGTT from 0 min to 180 min, expressing the second-phase insulin secretion after the oral glucose load.14,28 Lastly, oral disposition index (DIO) can indicate a compromised ability of β-cells to compensate for peripheral insulin sensitivity,25 which can predict the development of diabetes.27 It was calculated as the product of 10,000/[(fasting insulin × fasting glucose) × (G × I)]1/2 and AUC-I120/AUC-G120. G and I represent the mean glucose level and mean insulin level at the 4 former time points during the OGTT, respectively. AUC-I120 and AUC-G120 were calculated with the trapezoidal rule and used in the insulin and glucose curve during the OGTT from 0 min to 120 min.25,28 Therefore, pancreatic β-cell function was assessed by HOMA-β, ΔI30/ΔG30, AUC-I180, and DIO during the OGTT in our study.
Statistical Analysis
Statistical analysis was performed using SPSS version 25.0 (Statistical Product and Service Solutions Inc., USA). Demographic and clinical characteristics of subjects were summarized, and compared between NGT group and pre-DM group. Continuous variables are expressed as mean ± standard deviation (SD) for data with normal distribution or median with 25–75% interquartile range (IQR) for those with abnormal distribution; categorical variables are expressed as percentages (%). Comparisons between NGT and pre-DM groups were done with t-test and Wilcoxon/Mann–Whitney test for normally and abnormally distributed continuous variables, respectively. Chi-square test was used to examine the differences among categorical variables. To evaluate the impact of OSA on HbA1c, blood glucose tolerance, IR (HOMA-IR) and β-cell function (HOMA-B, ΔI30/ΔG30, AUC-I180, and DIO), comparisons were further done in three sub-groups divided based on AHI in NGT group or preDM group. One-way analysis of variance (ANOVA) was used to compare the means of normally distributed homoscedastic data among groups, followed by least significant difference (LSD) test between two groups. While for the quantitative data with heteroscedastic or abnormally distribution, Kruskal-Wallis H-test was performed. The partial correlation coefficients were applied to determine the association of PSG parameters with glucose metabolism and β-cell function after adjusting for age and gender. A value of P<0.05 was considered statistically significant.
Results
Clinical Characteristics and Glucose Metabolic Statuses
A total of 422 subjects (261 males/161 females) were fulfilled the enrollment criteria, and the average age was 27.77±7.51 years. All the subjects were Chinese Han adults with the mean BMI of 34.84±5.69 kg/m2. Demographic and clinical characteristics are summarized in Table 1, and were compared between NGT group and pre-DM group. In these subjects, 275 (65.17%) subjects had NGT and 147 (34.83%) had preDM (7 with i–IFG, 114 with i–IGT and 26 with IFG/IGT). The preDM subjects were, on average, 3 years older (26.75±7.05 vs. 29.68±7.98 years, P< 0.001) than the NGT subjects. There were no marked differences between NGT group and preDM group in the sex, BMI and smoking status. The subjects with preDM had significantly higher AHI, ODI and TS90, while the mean SpO2 and LSpO2 were markedly lower than those with NGT (P <0.05, Table 1). The overall prevalence of OSA was 60.9%. Compared with the NGT group, the odds ratio (OR) of OSA was 2.123 (95% CI, 1.379–3.269; P =0.001) in the preDM group. There was also a significantly higher rate of severe OSA in the preDM group than in the NGT group (P = 0.035, Table 1). With the increase in the OSA severity, the proportion of NGT subjects declined while the prevalence of preDM increased significantly (χ2 =12.194, P =0.002; Figure 1). Then, the glucose metabolic state of preDM subjects was classified into i–IFG, i–IGT and IFG/IGT. The proportions of subjects with i–IFG and IFG/IGT were the highest in the severe OSA group, while the proportion of i–IGT subjects was the highest in the mild-to-moderate OSA group (Figure 2).
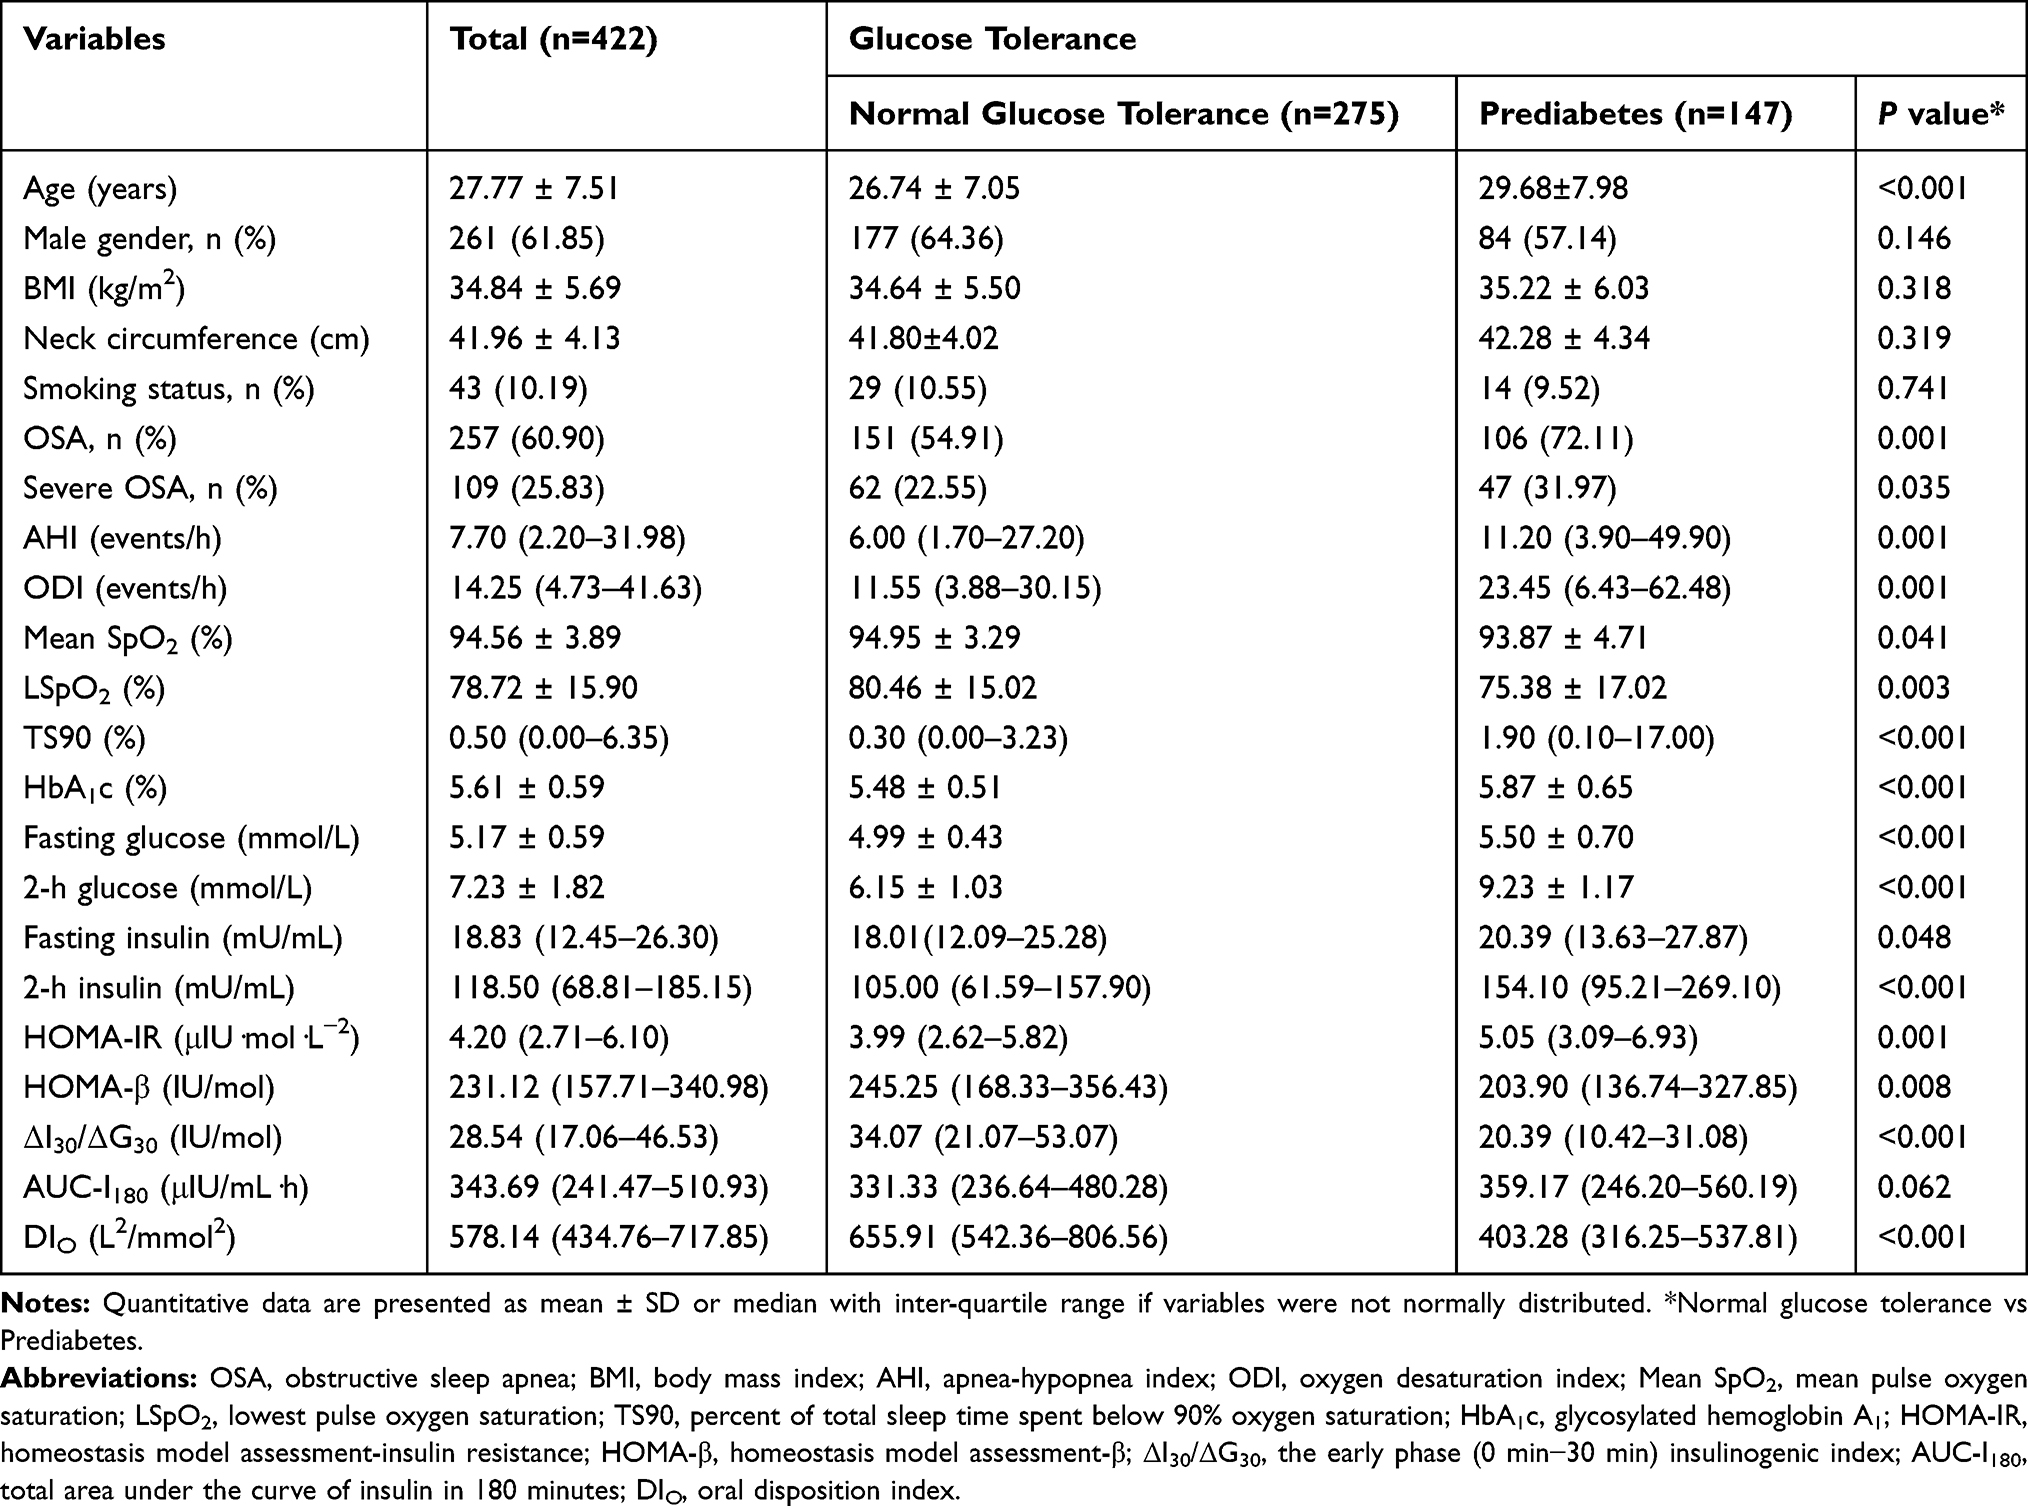 |
Table 1 Basic Characteristics of Normal Glucose Tolerance and Prediabetes Groups |
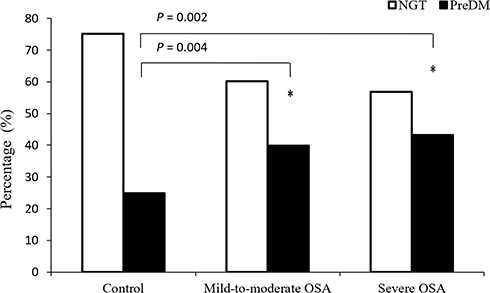 |
Figure 1 Percentage of subjects with different glucose metabolic statuses in different OSA severity groups. The glucose metabolic status was categorized into normal glucose tolerance (NGT) and prediabetes (pre-DM) according to the results from oral glucose tolerance test. *P<0.05 vs. control group. |
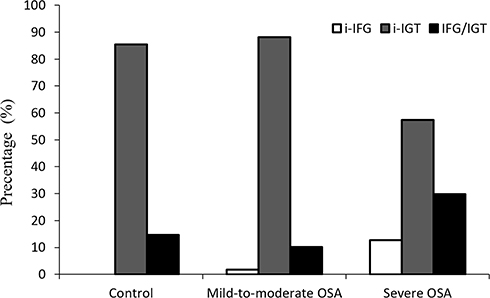 |
Figure 2 Percentage of subjects with different glucose metabolic statuses in different OSA severity groups among prediabetes subjects. The glucose metabolic status was categorized into isolated impaired fasting glucose (i–IFG), isolated impaired glucose tolerance (i–IGT), and combination of both (IFG/IGT) according to the results from oral glucose tolerance test. |
Glucose Tolerance
Subjects were subdivided into three subgroups based on AHI in order to further investigate the effects of OSA severity on the NGT and preDM, respectively. Baseline characteristics of included subjects are shown in Table 2. Results showed the advanced age, male gender and larger NC were closely related to the increased severity of OSA. BMI was similar among the three subgroups in both NGT group and preDM group. The serum HbA1c level was the highest in the severe OSA subjects, especially in the preDM group. The oral glucose tolerance curve showed the 30-min glucose and 1-h glucose levels were the highest in the severe OSA subjects with NGT, despite no significant differences in the HbA1c and fasting glucose levels (Table 2). In the subjects with preDM, HbA1c and fasting glucose levels were significantly higher in the severe OSA group than those in the control and mild-to-moderate OSA groups (P <0.001, Table 2). The preDM subjects with different severities of OSA had higher ODI and TS90 and lower LSpO2 than the NGT subjects, while the levels of HbA1c, fasting glucose and post-load glucose in preDM subjects were significantly higher (P <0.05, Table 2). Furthermore, the relationship between glucose dysmetabolism and OSA severity was determined using partial correlation analysis after adjusting for age and gender. As shown in Table 3, higher HbA1c level was associated with OSA parameters (AHI, ODI, mean SpO2, LSpO2 and TS90 during PSG) in both NGT (P < 0.05) and preDM subjects (P < 0.01). The partial correlation coefficients were higher in preDM subjects. In the NGT subjects, only 30-min and 1-h glucose levels were positively related to AHI and ODI, while negatively to LSpO2 (P < 0.01, Table 3). In the prdDM subjects, fasting glucose level was significantly related to all OSA parameters (P < 0.05, Table 3).
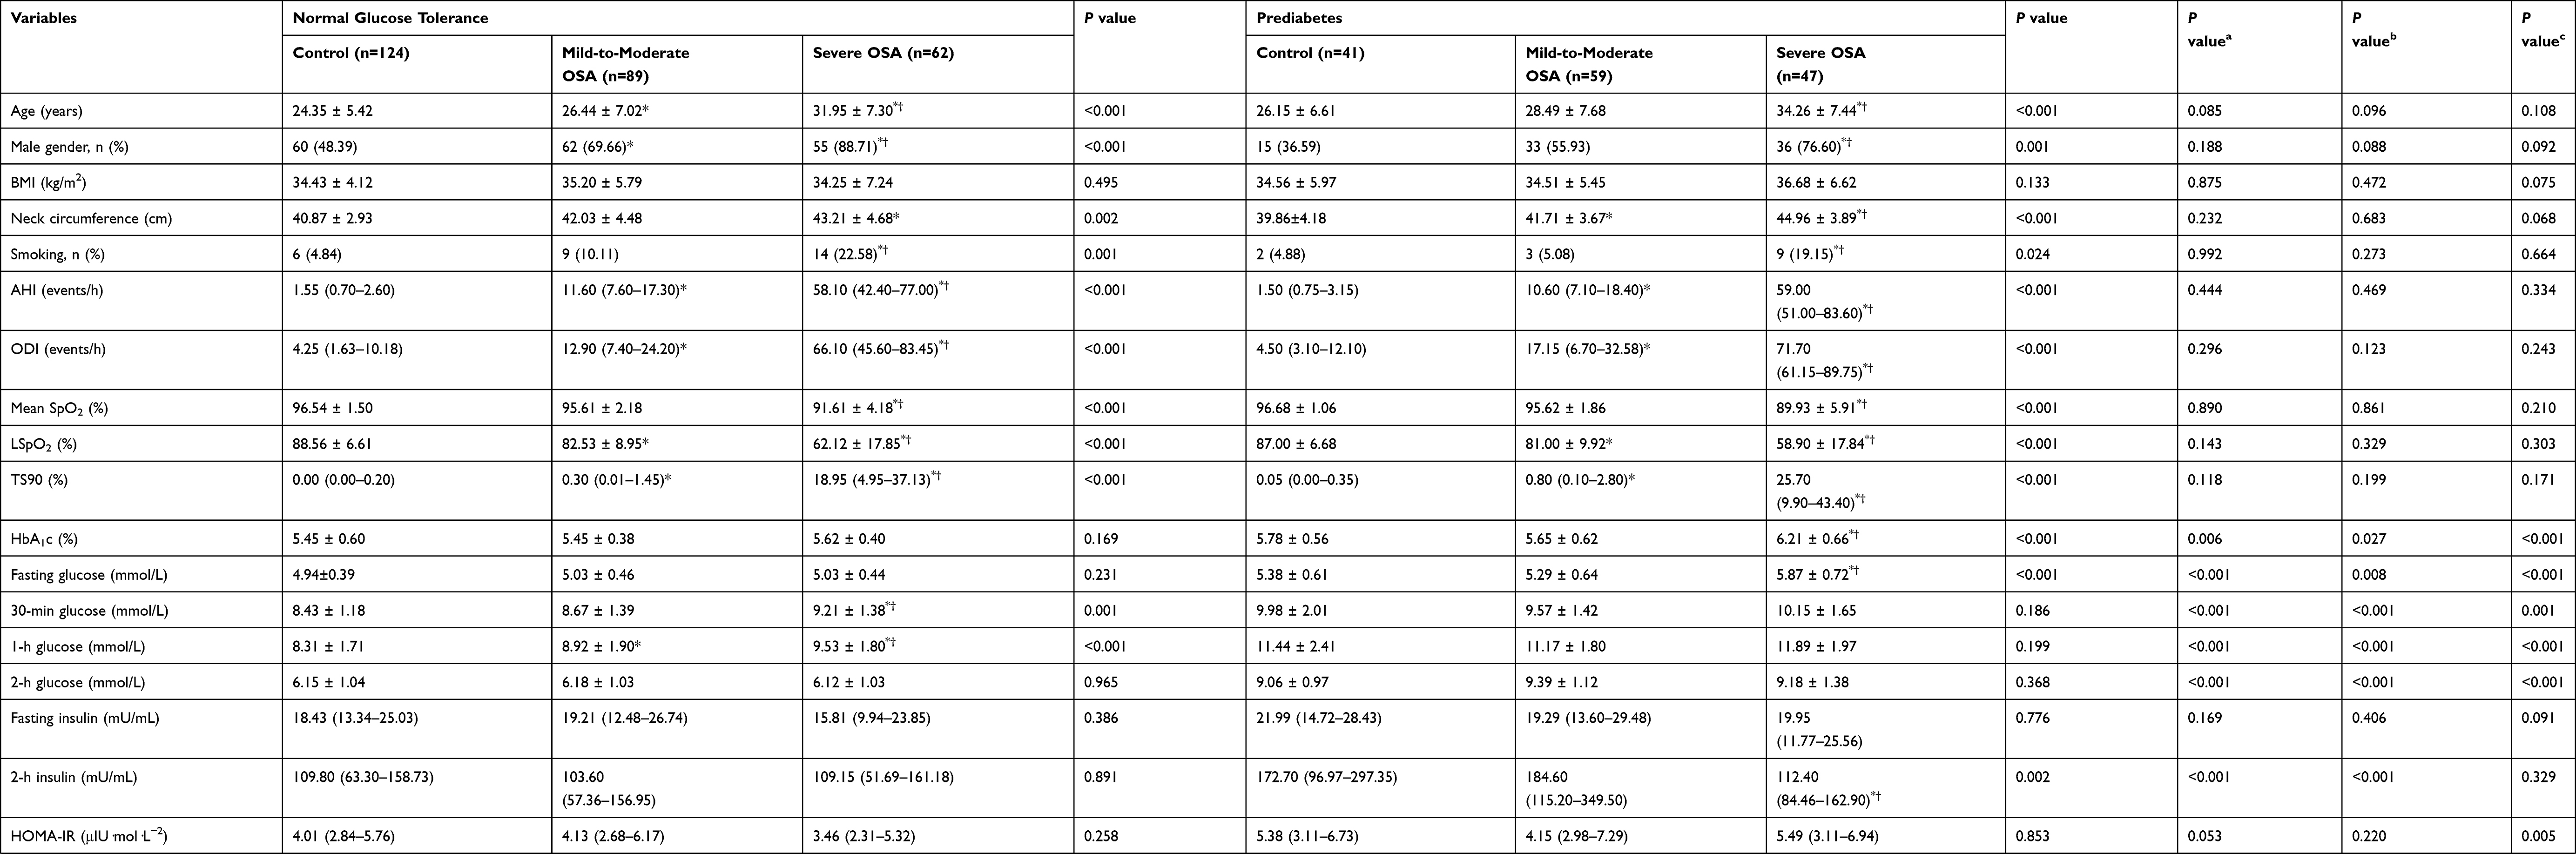 |
Table 2 Glucose Tolerance and Pancreatic β-Cell Function Among Subjects with Different Severities of OSA |
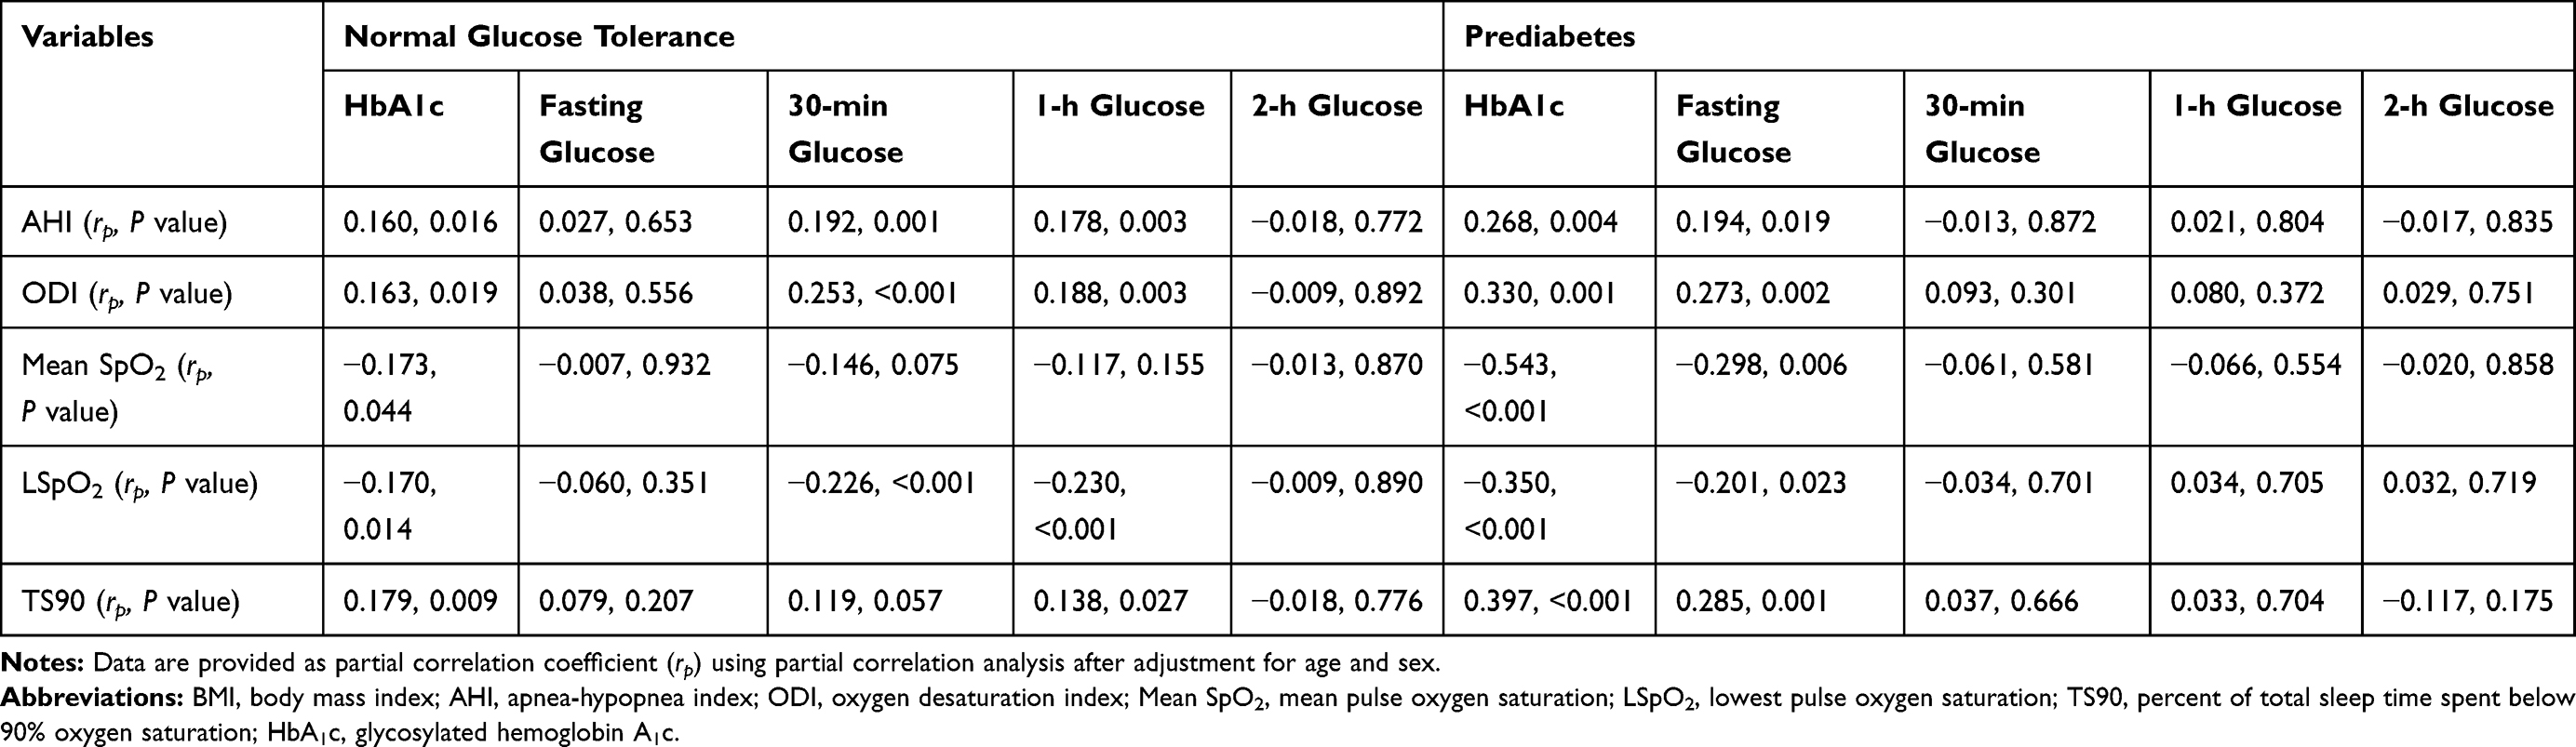 |
Table 3 Correlation of Sleep Apnea Variables with Glucose Metabolic Parameters |
Pancreatic β-Cell Function
The majority of these overweight and obese young subjects had hyperinsulinemia and IR, especially in the preDM group, while the HOMA-β, ΔI30/ΔG30 and DIO significantly declined in the preDM group than in the NGT group (P < 0.01, Table 1). The effect of OSA severity on the pancreatic β-cell dysfunction was further evaluated in both NGT and preDM groups, respectively. As shown in Table 2, insulin secretion parameters during OGTT, such as HOMA-β, ΔI30/ΔG30, and AUC-I180, decreased with the increase of OSA severity. In the NGT subjects, only HOMA-β and ΔI30/ΔG30 were significantly lower in the severe OSA group as compared to the control group (P < 0.05, Table 2). In the preDM subjects, HOMA-β, ΔI30/ΔG30, AUC-I180 and DIO were all the lowest in the severe OSA group, while the 2-h insulin level in the severe OSA group was significantly lower than in the control and mild-to-moderate OSA groups (P=0.004 and P=0.001, respectively; Table 2). Moreover, patients with severe OSA were found to have markedly higher HOMA-IR and lower DIO in the preDM group than in the NGT group (P <0.01, Table 2). Partial correlation analysis confirmed that HOMA-IR and HOMA-β were negatively related to mean SpO2 in NGT patients after adjusting for sex and age (P <0.05, Table 4). In addition, the lower DIO was significantly associated with higher ODI and lower mean SpO2 (P <0.05, Table 4), and AUC-I180 was negatively related to TS90 (P<0.05, Table 4) in the preDM group.
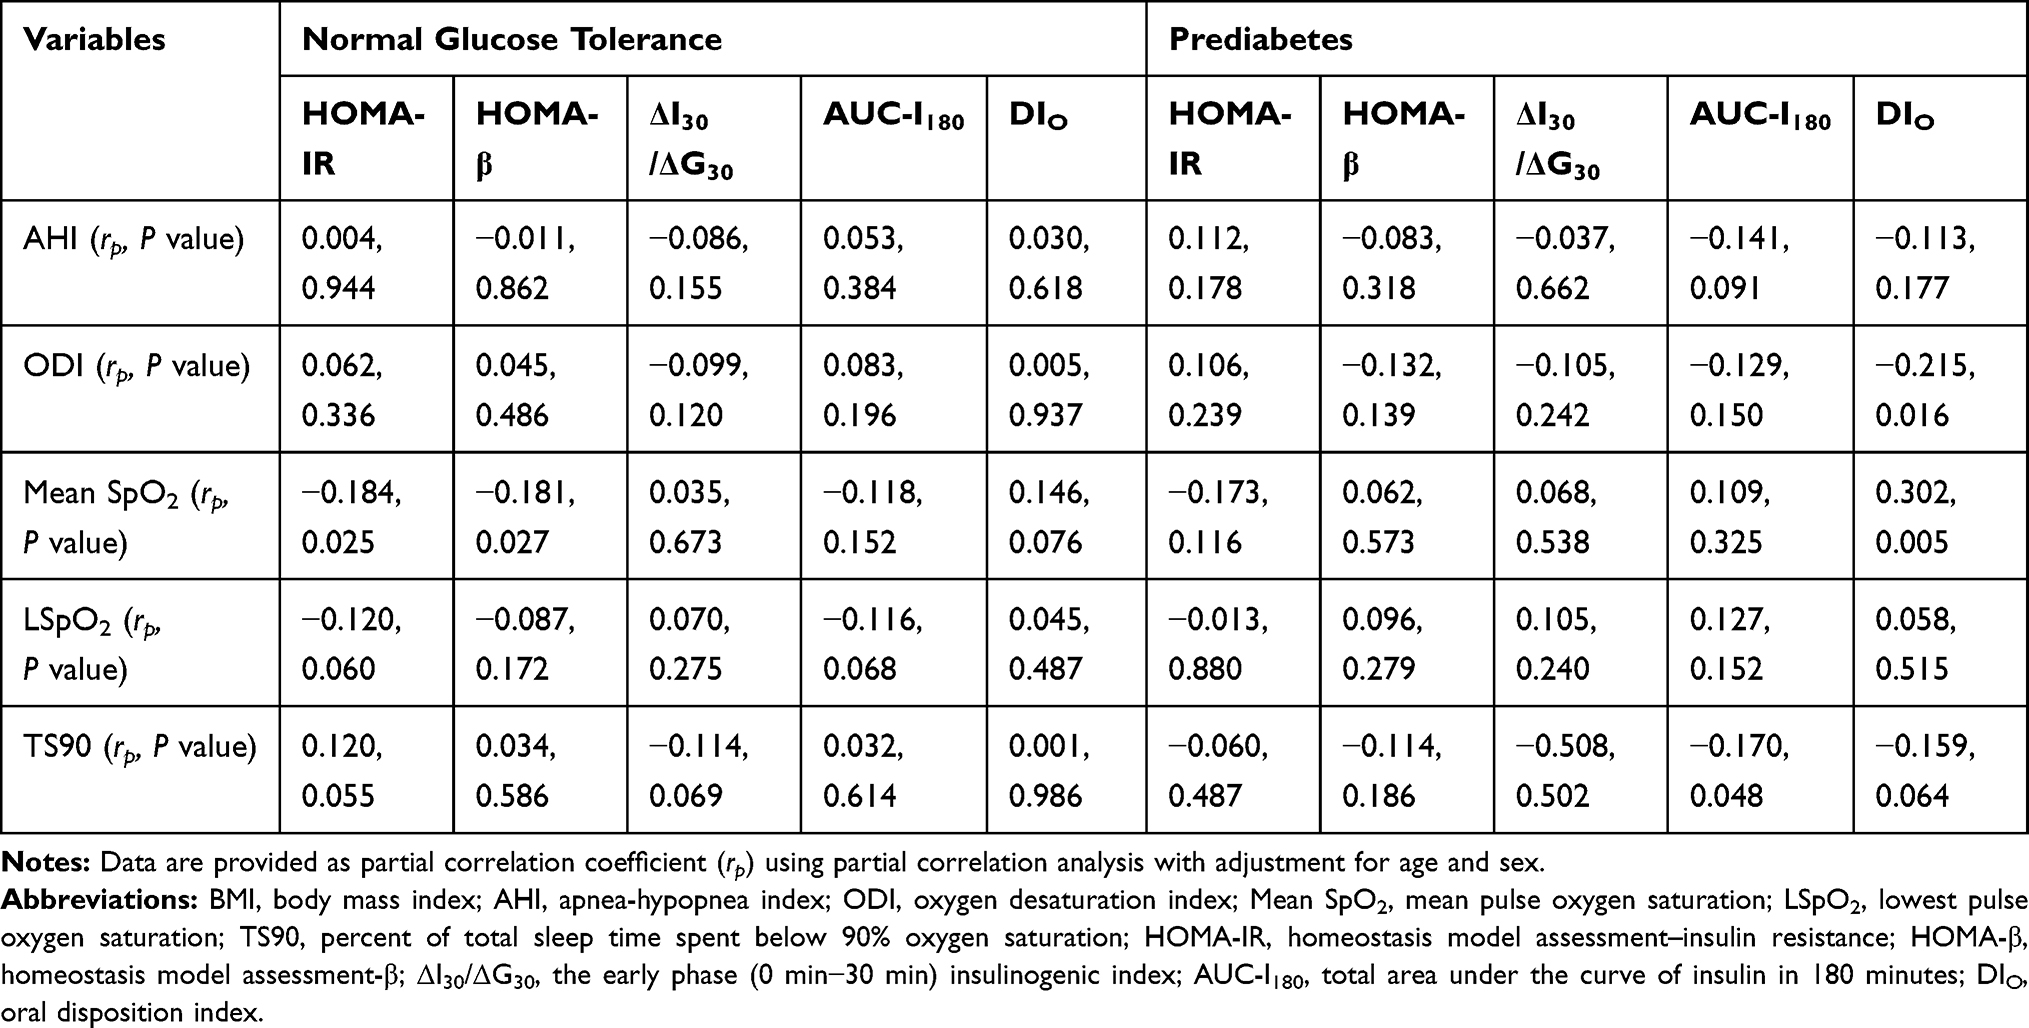 |
Table 4 Correlation Between Sleep Apnea Variables and Pancreatic β-Cell Function |
Discussion
There were three major findings in the present study. First, there was a high OSA prevalence in the overweight and obese nondiabetic young adults. The subjects with preDM tended to have higher AHIs and lower nocturnal SpO2 than those with NGT. Second, OSA-related hypoxemia exacerbated the obesity-induced glucose dysmetabolism, and especially the disordered glucose tolerance was observed early after glucose post load in the NGT subjects. Third, OSA could induce IR and increased compensatory secretion of the pancreatic β-cells in the NGT subjects, while pancreatic β-cell dysfunction was present in the preDM subjects with severe OSA.
Both obesity and OSA are risk factors for glucose dysmetabolism, and OSA has a higher prevalence among obese adults with diabetes.29 In the Look AHEAD study, 86% of overweight and obese adults with T2DM were diagnosed with OSA.30 Leong et al found the prevalence of OSA was 80.1% in the T2DM patients and 63.1% in the nondiabetic individuals with severely obese.31 Similarly, our study showed the overall prevalence of OSA was 60.9% in the overweight and obese nondiabetic young subjects, including 54.91% and 72.11% of subjects with the NGT and preDM groups, respectively. The risk of OSA in the preDM patients increases by more than two folds compared with the NGT subjects, which was consistent with previously reported.32 OSA and glucose dysmetabolism have a bidirectional relationship.6 OSA affects the whole process of diabetes development, from preDM to the final clinical diabetes.25 Based on our findings, the prevalence of preDM increased significantly with the increase in the OSA severity. Chen et al13 found young preDM subjects suffered a worse β-cell dysfunction among i–IFG subjects. Our results also revealed the proportion of i-IGT subjects was higher in the mild-to-moderate OSA group than in the control group, whereas the proportions of i-IFG and IFG/IGT subjects were the highest in the severe OSA group.
To evaluate glucose metabolism, the majority of previous studies relating OSA have used static measures, such as the HOMA.33 However, fasting glucose and insulin levels provide limited information about the glucose fluctuations,27 and fail to reflect the degree of β-cells dysfunction.12 Considering insulin sensitivity and compensatory response of pancreatic β-cell function, OGTT was used to assess the glucose metabolism.14,25 In our study, all the subjects received overnight PSG, standard OGTT-IRT and HbA1c measurement to evaluate the relationship between OSA and glucose metabolism. Among the NGT subjects, the 1-h glucose level significantly elevated with the increase in the OSA severity, and it was higher than 8.6 mmol/L in both mild-to-moderate OSA group and severe OSA group (8.92±1.90 mmol/L and 9.53±1.80 mmol/L, respectively). This finding is clinically relevant, given that, even in the early stage of glucose homeostasis, disordered tolerance early after glucose post load may be observed and represent an early manifestation of metabolic dysfunction.34 Indeed, 1-h post-load glucose level of more than 8.6 mmol/L has recently been identified as a better predictor of future T2DM and related complications than the fasting or 2-h glucose level.35 Furthermore, 1-h glucose of ≥ 7.4 mmol/L has been found as an independent predictor of progression to preDM in the obese young subjects with NGT.36
The lower oxygen desaturation or intermittent hypoxemia is closely related to the poorer glycemic control.29,30 Useful oximetric measures related to OSA include ODI, LSpO2, mean SpO2, and TS90.23 The European Sleep Apnea Database (ESADA) study stated ODI and nocturnal mean SpO2 were better predictors of HbA1c levels than AHI among 2375 nondiabetic subjects who had undergone PSG.24 Available study also indicated that nocturnal hypoxemia from OSA was associated with poorer glycemic control in the extremely obese subjects.31 Our study found HbA1c and 1-h glucose levels were positively related to ODI and TS90, while negatively to LSpO2 in overweight and obese subjects of NGT group. In the preDM group, higher HbA1c was also independently associated with the OSA-related hypoxia parameters, and their partial correlation coefficients were higher than AHI. HbA1c correlates directly with the mean plasma glucose level in prior 2–3 months, and subjects with higher HbA1c level are more likely to progress from preDM to T2DM over 5 years.12,28 The positive relationship between nocturnal hypoxemia and glycemia implies that it is necessary to assess the correction of OSA-related hypoxemia as a strategy for the glycemic control in obese patients.31
Notably, intermittent hypoxia (IH) is a hallmark of OSA.37 Regarding OSA-related exposures, pancreatic β-cells are exquisitely sensitive to hypoxia.8 Evidence from animal studies has indicated IH that imitates OSA may lead to pancreatic β-cell injury and worsen the obesity-induced glucose dysmetabolism.37,38 We investigated the pancreatic β-cell function in the overweight and obese nondiabetic young adults. The glucose tolerance remained normal in the NGT subjects, however HOMA-β and HOMA-IR were negatively associated with nocturnal mean SpO2, which was consistent with previous findings.32,39 Results showed OSA could exacerbate IR and compensatory increase in the pancreatic β-cell function before the presence of preDM in overweight and obese NGT adults, despite a significant predisposition to IR in obesity subjects.40 In preDM subjects, the indicators of pancreatic β cell function, including basal and compensatory secretion, decreased with the increase in the severity of OSA and appeared to be the lowest in the severe OSA group. This could explain that the preDM subjects with OSA had a poorer glucose tolerance. DIO is the product of measures of insulin sensitivity and first-phase insulin secretion, and it can be used to predict the progression into diabetes over 10 years.6,27 In our study, DIO decreased with the increase in the OSA severity, but it was the lowest in the preDM subjects with severe OSA. Partial correlation analysis also confirmed that DIO was related to ODI and nocturnal mean SpO2 in the preDM group. In addition, preDM subjects with severe OSA had the lowest 2-h insulin level in our study, though they still possessed hyperinsulinemia and IR. As such, severe OSA imposes an extreme functional demand on the pancreatic β-cells in the overweight and obese young adults with preDM, which may give rise to impaired secretory capacity and facilitate the exhaustion of β-cells over time.41
There were several limitations in our study. First, this was a cross-sectional study, and thus we failed to determine the causal relationship between OSA and glucose dysmetabolism. Second, most subjects in this study were recruited from a center from sleep disorders, and disordered breathing during sleep was a predominant symptom, which may limit the generalization of our findings to the whole population. Last but not least, parameters from OGTT-IRT still have limitations in the evaluation of insulin sensitivity and pancreatic β-cell function despite their correlation with glucose clamp test. Interpretation of these parameters is sometimes sophisticated for the hyperbolic correlation between insulin sensitivity and β-cell secretion.8,18 Thus, more prospective clinical studies with larger sample size are needed to confirm the relationship of OSA with glucose dysmetabolism and pancreatic β-cell function in overweight and obese nondiabetic young adults.
Conclusion
In conclusion, our study indicates a higher prevalence of OSA in the overweight and obese nondiabetic young adults, especially the preDM subjects. OSA-related hypoxemia may exacerbate the obesity-induced glucose dysmetabolism, and the impaired glucose tolerance can be observed early after glucose post load in the NGT subjects. There is significant interaction between OSA severity and pancreatic β-cell dysfunction, including basic and compensatory secretion, in both NGT and preDM subjects. OSA may induce the compensatory increase in the pancreatic β-cell function in NGT subjects, while pancreatic β-cell dysfunction is present in the preDM subjects with severe OSA. Further prospective studies are needed to explore the impact of OSA on the pancreatic β-cell function. Meanwhile, clinical trials with CPAP treatment and those in lean subjects with OSA should be included in the future studies to confirm our findings.
Acknowledgments
This study was supported by the National Natural Science Foundation of China (No. 81770084 and 81570082), the National Key Technology Research and Development Program of China (No. 2018YFC1311900) and the Key Research Program of Shanghai Science and Technology Commission (No. 18140903600).
Disclosure
The authors report no conflicts of interest in this work.
References
1. Yip WCY, Sequeira IR, Plank LD, Poppitt SD. Prevalence of pre-diabetes across ethnicities: a review of impaired fasting glucose (IFG) and impaired glucose tolerance (IGT) for classification of dysglycaemia. Nutrients. 2017;9(11):1273. doi:10.3390/nu9111273
2. Wang L, Gao P, Zhang M, et al. Prevalence and ethnic pattern of diabetes and prediabetes in China in 2013. JAMA. 2017;317(24):2515–2523. doi:10.1001/jama.2017.7596
3. Deconinck B, Mathieu C, Benhalima K. Characteristics and cardiovascular complications of a large cohort of adults diagnosed with type 2 diabetes <45 years. Diabetol Metab Syndr. 2017;9:28.
4. Lascar N, Brown J, Pattison H, Barnett AH, Bailey CJ, Bellary BS. Type 2 diabetes in adolescents and young adults. Lancet Diabetes Endocrinol. 2018;6(1):69–80. doi:10.1016/S2213-8587(17)30186-9
5. Wilmot E, Idris I. Early onset type 2 diabetes: risk factors, clinical impact and management. Ther Adv Chronic Dis. 2014;5(6):234–244. doi:10.1177/2040622314548679
6. Framnes SN, Arble DM. The bidirectional relationship between obstructive sleep apnea and metabolic disease. Front Endocrinol (Lausanne). 2018;9:440. doi:10.3389/fendo.2018.00440
7. Benjafield AV, Ayas NT, Eastwood PR, et al. Estimation of the global prevalence and burden of obstructive sleep apnoea: a literature-based analysis. Lancet Respir Med. 2019;7(8):687–698. doi:10.1016/S2213-2600(19)30198-5
8. Ogilvie RP, Patel SR. The epidemiology of sleep and diabetes. Curr Diab Rep. 2018;18(10):82. doi:10.1007/s11892-018-1055-8
9. Singh P, Somers VK. Obstructive sleep apnea, diabetes, and obesity: partners in crime? Sleep Med. 2016;25:162–163. doi:10.1016/j.sleep.2016.06.009
10. Song SO, He K, Narla RR, Kang HG, Ryu HU, Boyko EJ. Metabolic consequences of obstructive sleep apnea especially pertaining to diabetes mellitus and insulin sensitivity. Diabetes Metab J. 2019;43(2):144–155. doi:10.4093/dmj.2018.0256
11. Jia W, Weng J, Zhu D, et al. Standards of medical care for type 2 diabetes in China 2019. Diabetes Metab Res Rev. 2019;35(6):e3158. doi:10.1002/dmrr.3158
12. Wilson ML. Prediabetes: beyond the borderline. Nurs Clin North Am. 2017;52(4):665–677. doi:10.1016/j.cnur.2017.07.011
13. Chen G, Shi L, Cai L, et al. Comparison of insulin resistance and beta-cell dysfunction between the young and the elderly in normal glucose tolerance and prediabetes population: a prospective study. Horm Metab Res. 2017;49(2):135–141. doi:10.1055/s-0042-111325
14. Cersosimo E, Solis-Herrera C, Trautmann ME, Malloy J, Triplitt CL. Assessment of pancreatic β-cell function: review of methods and clinical applications. Curr Diabetes Rev. 2014;10(1):2–42. doi:10.2174/1573399810666140214093600
15. Belongie KJ, Ferrannini E, Johnson K, Andrade-Gordon P, Hansen MK, Petrie JR. Identification of novel biomarkers to monitor beta-cell function and enable early detection of type 2 diabetes risk. PLoS One. 2017;12(8):e0182932. doi:10.1371/journal.pone.0182932
16. American Diabetes Association. Standards of medical care in diabetes-2017: summary of revisions. Diabetes Care. 2017;40(Suppl 1):S4–S5. doi:10.2337/dc17-S003
17. Leitner DR, Fruhbeck G, Yumuk V, et al. Obesity and type 2 diabetes: two diseases with a need for combined treatment strategies – EASO can lead the way. Obes Facts. 2017;10(5):483–492. doi:10.1159/000480525
18. Jehan S, Myers AK, Zizi F, Pandi-Perumal SR, Jean-Louis G, McFarlane SI. Obesity, obstructive sleep apnea and type 2 diabetes mellitus: epidemiology and pathophysiologic insights. Sleep Med Disord. 2018;2(3):52–58.
19. Engin A. The definition and prevalence of obesity and metabolic syndrome. Adv Exp Med Biol. 2017;960:1–17.
20. Malenica M, Prnjavorac B, Bego T, et al. Effect of cigarette smoking on haematological parameters in healthy population. Med Arch. 2017;71(2):132–136. doi:10.5455/medarh.2017.71.132-136
21. Berry RB, Brooks R, Gamaldo CE, et al. American Academy of Sleep Medicine. The AASM Manual for the Scoring of Sleep and Associated Events: Rules, Terminology and Technical Specifications. Version 2.4. Darien, IL: American Academy of Sleep Medicine; 2017.
22. Kapur VK, Auckley DH, Chowdhuri S, et al. Clinical practice guideline for diagnostic testing for adult obstructive sleep apnea: an American academy of sleep medicine clinical practice guideline. J Clin Sleep Med. 2017;13(3):479–504. doi:10.5664/jcsm.6506
23. Rashid NH, Zaghi S, Scapuccin M, Camacho M, Certal V, Capasso R. The value of oxygen desaturation index for diagnosing obstructive sleep apnea: a systematic review. Laryngoscope. 2020. doi:10.1002/lary.28663
24. Kent BD, Grote L, Bonsignore MR, et al.; European Sleep Apnoea Database collaborators. Sleep apnoea severity independently predicts glycaemic health in nondiabetic subjects: the ESADA study. Eur Respir J. 2014;44(1):130–139. doi:10.1183/09031936.00162713
25. den Biggelaar LJ, Sep SJ, Eussen SJ, et al. Discriminatory ability of simple OGTT-based beta cell function indices for prediction of prediabetes and type 2 diabetes: the CODAM study. Diabetologia. 2017;60(3):432–441. doi:10.1007/s00125-016-4165-3
26. Tang Q, Li X, Song P, Xu L. Optimal cut-off values for the homeostasis model assessment of insulin resistance (HOMA-IR) and pre-diabetes screening: developments in research and prospects for the future. Drug Discov Ther. 2015;9(6):380–385. doi:10.5582/ddt.2015.01207
27. Hannon TS, Kahn SE, Utzschneider KM, et al. Review of methods for measuring beta-cell function: design considerations from the Restoring Insulin Secretion (RISE) consortium. Diabetes Obes Metab. 2018;20(1):14–24. doi:10.1111/dom.13005
28. Fiorentino TV, Pedace E, Succurro E, et al. Individuals with prediabetes display different age-related pathophysiological characteristics. J Clin Endocrinol Metab. 2019;104(7):2911–2924. doi:10.1210/jc.2018-02610
29. Gohil A, Hannon TS. Poor sleep and obesity: concurrent epidemics in adolescent youth. Front Endocrinol (Lausanne). 2018;9:364. doi:10.3389/fendo.2018.00364
30. Foster GD, Sanders MH, Millman R, et al. Obstructive sleep apnea among obese patients with type 2 diabetes. Diabetes Care. 2009;32(6):1017–1019. doi:10.2337/dc08-1776
31. Leong WB, Banerjee D, Nolen M, Adab P, Thomas GN, Taheri S. Hypoxemia and glycemic control in type 2 diabetes mellitus with extreme obesity. J Clin Endocrinol Metab. 2014;99(9):E1650–E1654. doi:10.1210/jc.2014-1260
32. Pallayova M, Steele KE, Magnuson TH, et al. Sleep apnea predicts distinct alterations in glucose homeostasis and biomarkers in obese adults with normal and impaired glucose metabolism. Cardiovasc Diabetol. 2010;9(1):83. doi:10.1186/1475-2840-9-83
33. Lesser DJ, Bhatia R, Tran WH, et al. Sleep fragmentation and intermittent hypoxemia are associated with decreased insulin sensitivity in obese adolescent Latino males. Pediatr Res. 2012;72(3):293–298. doi:10.1038/pr.2012.73
34. Perez-Pevida B, Diaz-Gutierrez J, Miras AD, et al. High body adiposity drives glucose intolerance and increases cardiovascular risk in normoglycemic subjects. Obesity (Silver Spring). 2018;26(4):672–682. doi:10.1002/oby.22147
35. Alyass A, Almgren P, Akerlund M, et al. Modelling of OGTT curve identifies 1 h plasma glucose level as a strong predictor of incident type 2 diabetes: results from two prospective cohorts. Diabetologia. 2015;58(1):87–97. doi:10.1007/s00125-014-3390-x
36. Trico D, Galderisi A, Mari A, Santoro N, Caprio S. One-hour post-load plasma glucose predicts progression to prediabetes in a multi-ethnic cohort of obese youths. Diabetes Obes Metab. 2019;21(5):1191–1198. doi:10.1111/dom.13640
37. Ryan S. Adipose tissue inflammation by intermittent hypoxia: mechanistic link between obstructive sleep apnoea and metabolic dysfunction. J Physiol. 2017;595(8):2423–2430. doi:10.1113/JP273312
38. Song S, Tan J, Miao Y, Sun Z, Zhang Q. Intermittent-hypoxia-induced autophagy activation through the ER-stress-related PERK/eIF2α/ATF4 pathway is a protective response to pancreatic β-cell apoptosis. Cell Physiol Biochem. 2018;51(6):2955–2971. doi:10.1159/000496047
39. Temple KA, Leproult R, Morselli L, Ehrmann DA, Van Cauter E, Mokhlesi B. Sex differences in the impact of obstructive sleep apnea on glucose metabolism. Front Endocrinol (Lausanne). 2018;9:376. doi:10.3389/fendo.2018.00376
40. Verma S, Hussain ME. Obesity and diabetes: an update. Diabetes Metab Syndr. 2017;11(1):73–79. doi:10.1016/j.dsx.2016.06.017
41. Briancon-Marjollet A, Weiszenstein M, Henri M, Thomas A, Godin-Ribuot D, Polak J. The impact of sleep disorders on glucose metabolism: endocrine and molecular mechanisms. Diabetol Metab Syndr. 2015;7:25.
 © 2020 The Author(s). This work is published and licensed by Dove Medical Press Limited. The
full terms of this license are available at https://www.dovepress.com/terms
and incorporate the Creative Commons Attribution
- Non Commercial (unported, 3.0) License.
By accessing the work you hereby accept the Terms. Non-commercial uses of the work are permitted
without any further permission from Dove Medical Press Limited, provided the work is properly
attributed. For permission for commercial use of this work, please see paragraphs 4.2 and 5 of our Terms.
© 2020 The Author(s). This work is published and licensed by Dove Medical Press Limited. The
full terms of this license are available at https://www.dovepress.com/terms
and incorporate the Creative Commons Attribution
- Non Commercial (unported, 3.0) License.
By accessing the work you hereby accept the Terms. Non-commercial uses of the work are permitted
without any further permission from Dove Medical Press Limited, provided the work is properly
attributed. For permission for commercial use of this work, please see paragraphs 4.2 and 5 of our Terms.