Back to Journals » Neuropsychiatric Disease and Treatment » Volume 15
Objective diagnosis of post-stroke depression using NMR-based plasma metabonomics
Authors Hu Z, Fan S, Liu M, Zhong J, Cao D, Zheng P, Wang Y, Wei Y, Fang L, Xie P
Received 26 October 2018
Accepted for publication 3 March 2019
Published 10 April 2019 Volume 2019:15 Pages 867—881
DOI https://doi.org/10.2147/NDT.S192307
Checked for plagiarism Yes
Review by Single anonymous peer review
Peer reviewer comments 2
Editor who approved publication: Dr Jun Chen
Zicheng Hu,1–3 Songhua Fan,1–3 Meiling Liu,1–3 Jiaju Zhong,1–3 Du Cao,1–3 Peng Zheng,1–3 Ying Wang,1–3 Youdong Wei,1–3 Liang Fang,1–3 Peng Xie1–3
1Department of Neurology, The First Affiliated Hospital of Chongqing Medical University, Chongqing, People’s Republic of China; 2Institute of Neuroscience and the Collaborative Innovation Center for Brain Science, Chongqing Medical University, Chongqing, People’s Republic of China; 3Chongqing Key Laboratory of Neurobiology, Chongqing, People’s Republic of China
Background: Post-stroke depression (PSD) is a frequent and serious complication of stroke. However, the underlying molecular basis of PSD remains largely unknown, and no empirical laboratory tests were available to diagnose this disorder.
Materials and methods: A proton nuclear magnetic resonance (1H NMR)-based metabonomic approach was employed to profile plasma samples from 32 PSD, 35 stroke patients and 35 healthy comparison subjects (the training set) in order to identify metabolite biomarkers for PSD. Then, 10 PSD, 11 stroke patients and 11 healthy comparison subjects (test set) were used to validate the diagnostic performance of these biomarkers.
Results: The multivariate statistical analysis demonstrated that PSD group was significantly distinguishable from non-PSD groups (non-depression stroke patients and healthy comparison group). Five plasma metabolites (phenylalanine, tyrosine, 1-methylhistidine, 3-methylhistidine and LDL CH3-(CH2)n-) were identified responsible for distinguishing PSD from non-PSD subjects. These metabolites were mainly involved in neurotransmitter metabolism and oxidative stress. The biomarker panel composing of these metabolites was capable of distinguishing test samples with a sensitivity of 100.0% and a specificity of 95.5%.
Conclusion: Our findings suggest that plasma disturbances of neurotransmitter levels and oxidative stress were implicated in the onset of PSD; these disturbed metabolites biomarkers facilitate to the development of diagnostic tool for PSD.
Keywords: post-stroke depression, stroke, metabonomics, diagnosis, NMR
Introduction
Post-stroke depression (PSD) is a serious complication in a variety of strokes, affecting approximately one-third of stroke survivors.1 PSD hampers stroke rehabilitation and negatively impacts the quality of life.2–5 Previously, several hypotheses have attempted to explain the pathogenesis of PSD.6–9 The pathophysiology of PSD is complex and likely involves a combination of biological and psychosocial factors. Proposed biological factors include lesion location, genetic susceptibility, inflammation, neurogenesis in response to ischemia, alterations in neurotrophic factors, disruption of cortico-striato-pallido-thalamic-cortical projections and alterations in serotonergic, noradrenergic and dopaminergic pathways, leading to changes in amine levels.10 However, the definite molecular mechanisms of PSD remain obscure. PSD is considered to be a mood disorder due to stroke with depressive features, or major depressive-like episode. Stroke patients with a diagnosis of PSD should have either a persistent depressed mood or loss of interest or pleasure. Currently, due to lack of objective diagnostic methods, PSD diagnosis still solely relies on subjective identification of clinical symptoms. PSD patients usually suffer from physical and cognitive impairments that may hinder performance during psychiatric interview,11,12 resulting in underdiagnosed.13 In light of these facts, understanding the molecular basis of PSD and development of objective diagnostic approaches for PSD is of considerable clinical value.
Metabonomics, which focuses on investigation of metabolic perturbations in disease states, has shown promising potential in diagnosis of various diseases.14,15 Nuclear magnetic resonance (NMR)-based metabonomic method has proven to be an effective strategy for diagnosing diseases.16 In the field of neuropsychiatry, this method has been used in the diagnosis of stroke, bipolar disorder and schizophrenia.17–19 Deranged blood–brain barrier permeability has been reported in depressive disorder,20 which implies that small molecule exchange may occur between the brain and peripheral bloodstream. Therefore, the plasma metabolic profile may hold pathophysiological information related to PSD. Recently, using this platform, this group found that plasma and urine metabolomics enabled distinguishing between depression and healthy comparison subjects with high accuracy.21–23 Given previous studies have demonstrated that both stroke patients and depression display plasma metabolic abnormalities,17,21 this group hypothesizes that the metabolic signature of PSD may be significantly disturbed in plasma and this specific changes may be used to diagnose this disorder.
Here, proton nuclear magnetic resonance (1H NMR) spectra of plasma sampled from 32 PSD subjects, 35 stroke patients and 35 healthy controls were recorded and analyzed by multivariate statistical analysis. The metabolic phenotype homogeneity between ischemic and hemorrhagic subjects, major PSD and minor PSD Subjects were assessed separately by OPLS-DA model. The first purpose of this study was to determine whether the NMR-based plasma metabonomic approach enabled effectively discriminating the PSD group from non-PSD groups (non-depression stroke and healthy control group). The second purpose of this study was to identify metabolite biomarkers responsible for discriminating PSD subjects from non-PSD subjects. The functional enrichment of these metabolites was also performed to uncover the potential molecular basis of PSD. The third purpose of this study was to validate the diagnostic performance of these PSD biomarkers using independent test samples (10 PSD, 11 stroke patients and 11 healthy comparison subjects).
Material and methods
Clinical samples
The study was conducted in accordance with the Declaration of Helsinki. Written informed consents were obtained from all participants. The Ethical Committee of Chongqing Medical University reviewed and approved the protocol of this study and the procedures employed for sample collection. 42 PSD subjects and 46 stroke patients were enrolled in the Department of Neurology of the First Affiliated Hospital at Chongqing Medical University. Candidates with either ischemic or hemorrhagic stroke were recruited. The inclusion criteria were as follows: 1) age 18 years or older, 2) elapsed time of 6 months or less after stroke onset, 3) no history of neurological or psychiatric disorders and antidepressant drug used before stroke, 4) no disorders of consciousness, 5) no severe comprehension deficits, as demonstrated by inability to complete Hamilton Depression Rating Scale (HDRS) or patients with neuropsychological testing who showed impaired decision-making capacity, 6) no life-threatening heart or respiratory failure, renal or hepatic failure, severely disabling musculoskeletal disorder, cancer and neurodegenerative disorders such as Parkinson disease or Alzheimer disease, 7) no alcohol or substance abuse within the past 12 months prior to enrollment. The PSD recruits must have met the DSM-5 criteria; patient with a diagnosis of mood disorder due to stroke with a major depression-like episode must have depressed mood or loss of interest or pleasure along with four other symptoms of depression lasting 2 or more weeks, and have a 17-item HDRS score of greater than 8.24 In addition, 46 healthy comparison subjects were recruited in the medical examination center of the First Affiliated Hospital at Chongqing Medical University. These healthy comparison subjects were required to have no current or previous lifetime history of neurological, DSM-V Axis I/II and/or systemic medical illness. 10 of 32 PSD were administrated antidepressant treatment in training set group, and 4 of 10 PSD were administrated antidepressant treatment in test set group; however, there was no significant relief of depressive symptoms when recruited. There was no history of neurological or psychiatric disorders and antidepressant drug used in both stroke patients and healthy controls.
The recruited subjects were divided into a training set and a test set. The training set, including 32 PSD (21 ischemic stroke and 11 hemorrhagic stroke; 14 Major depression and 18 Minor depression), 35 stroke patients (25 ischemic stroke, 10 hemorrhagic stroke) and 35 healthy comparison subjects, metabolic phenotype homogeneity between ischemic and hemorrhagic subjects, major PSD and minor PSD subjects were assessed separately by OPLS-DA model; then, the samples were used to identify potential metabolite markers for PSD; the remaining subjects were used to construct the test set to further validate the diagnostic performance of these metabolite markers.
Comparisons of demographic characteristics of recruited subjects
As appropriate, the ANOVA test, the parametric Student’s t-test or Mann–Whitney test was used to compare continuous variables (eg, HDRS and age). The Chi-square test was applied to analyze categorical data. All the statistical analyses were carried out with SPSS software (version 13.0). A P-value of less than 0.05 was deemed to be statistically significant.
Sample preparation and NMR acquisition
After overnight fasting, morning plasma samples were collected in 5-mL vacutainer tubes containing the chelating agent ethylene diamine tetraacetic acid (EDTA). Plasma samples were centrifuged at 1500 g for 15 mins. The resulting supernatant was immediately divided into equal aliquots and stored at –80°C. No plasma sample underwent more than two freeze-thaw cycles prior to undergoing NMR analysis.
Prior to NMR analysis, plasma samples were thawed and centrifuged at 15,000 g for 10 mins to remove precipitation. To ensure pH stabilization, 200 µl of plasma was mixed with 400 µl of phosphate buffer (0.2 M Na2HPO4/0.2 M NaH2PO4, pH 7.4). After centrifugation at 12,000 g for 10 mins, 500 µl samples of supernatant were transferred into 5 mm NMR tubes. The proton spectra of the samples were collected on a Bruker Avance 600 spectrometer operating at a 600.13 MHz 1H frequency with a standard CPMG (Carr−Purcell−Meiboom−Gill) sequence D−[−90°−137 (τ−180°−τ)n−ACQ].25 Blood plasma metabolites were assigned by comparison with chemical shift, which is detailed both in our previous work and published literature.21,26
Processing of NMR spectra and multivariate pattern recognition
All spectra were manually phased and baseline referenced to lactate resonance at δ1.33. The NMR spectra (0.5–8.5 ppm) were segmented into equal widths (0.002 ppm) using the AMIX package (Bruker Biospin, Germany). Spectral regions of δ3.69–3.57, δ3.26–3.06 and δ2.72–2.51 were excluded to eliminate variations caused by imperfect water suppression, EDTA and EDTA metal complexes. The integral values of samples were imported into SIMCA-P + 12.0 software (Umetrics, Umea, Sweden) as variables for multivariable statistical analysis.
Orthogonal partial least-squares discriminant analysis (OPLS-DA) was applied to the unit variance-scaled spectral data to visualize discrimination among groups.27,28 The coefficient loading plots of the OPLS-DA model were used to identify the spectral variables contributing to sample discrimination on the scores plot.29 Based on the number of samples (32 PSD, 35 stroke patients, 35 HC [health comparison]) used to construct the OPLS-DA model, the correlation coefficients were considered to be significant when | r | >0.35, which corresponded to the critical value of a correlation coefficient at P<0.05. The hues assigned to spectral signals projected onto the coefficient plot proportionally represent the magnitude of the metabolites responsible for the separation between groups based on r values. Red coloring denotes a high correlation, and blue coloring denotes no correlation. The quality of the OPLS-DA model was described by three parameters (R2X, R2Y and Q2Y), which were calculated by the default leave-one-out procedure. R2X and R2Y were used to quantify the goodness-of-fit; Q2Y was employed to assess model predictability.30
Metabonomic analysis of plasma samples
Initially, the OPLS-DA models were constructed to compare PSD and stroke patients samples with healthy comparison samples. Moreover, the OPLS-DA model was further employed to assess whether this NMR-based metabonomic approach is capable of distinguishing PSD subjects from stroke patients. The reliability of constructed OPLS-DA model was assessed by the original trainging samples.31 Specifically, all original trainging samples were randomly divided into a training set and a test set. The training set accounted for 80% samples and the test set for the remaining 20% samples. Initially, the OPLS-DA model was regenerated by the samples from the training set. Then, the reconstructed OPLS-DA model was used to predict the class membership of the remaining 20% of samples. Combining the foregoing analysis, the diagnostic accuracy of the OPLS-DA model was calculated. In order to assess the homogeneity of the metabolic phenotypes between ischemic and hemorrhagic subjects, the OPLS-DA model was initially constructed to compare 21 ischemic PSD samples with 25 ischemic stroke samples. Then, the reconstructed OPLS-DA model was used to predict the class membership of the 11 hemorrhagic PSD subjects and 10 hemorrhagic stroke subjects. The OPLS-DA models were constructed to compare minor PSD subjects with stroke patients or healthy comparison subjects to assess the homogeneity of metabolic phenotype between the minor PSD and major PSD subjects.
The overall flowchart of this metabonomic study was summarized in Figure S1. The OPLS-DA method was used to explore the metabolic differences among the PSD, stroke patients and healthy comparison groups (representative plasma 600 MHz 1D-CPMG 1H NMR spectra obtained from a PSD subject, a stroke subject and a healthy comparison subject are shown in Figure S2).
Results
Demographic and clinical characteristics of subjects
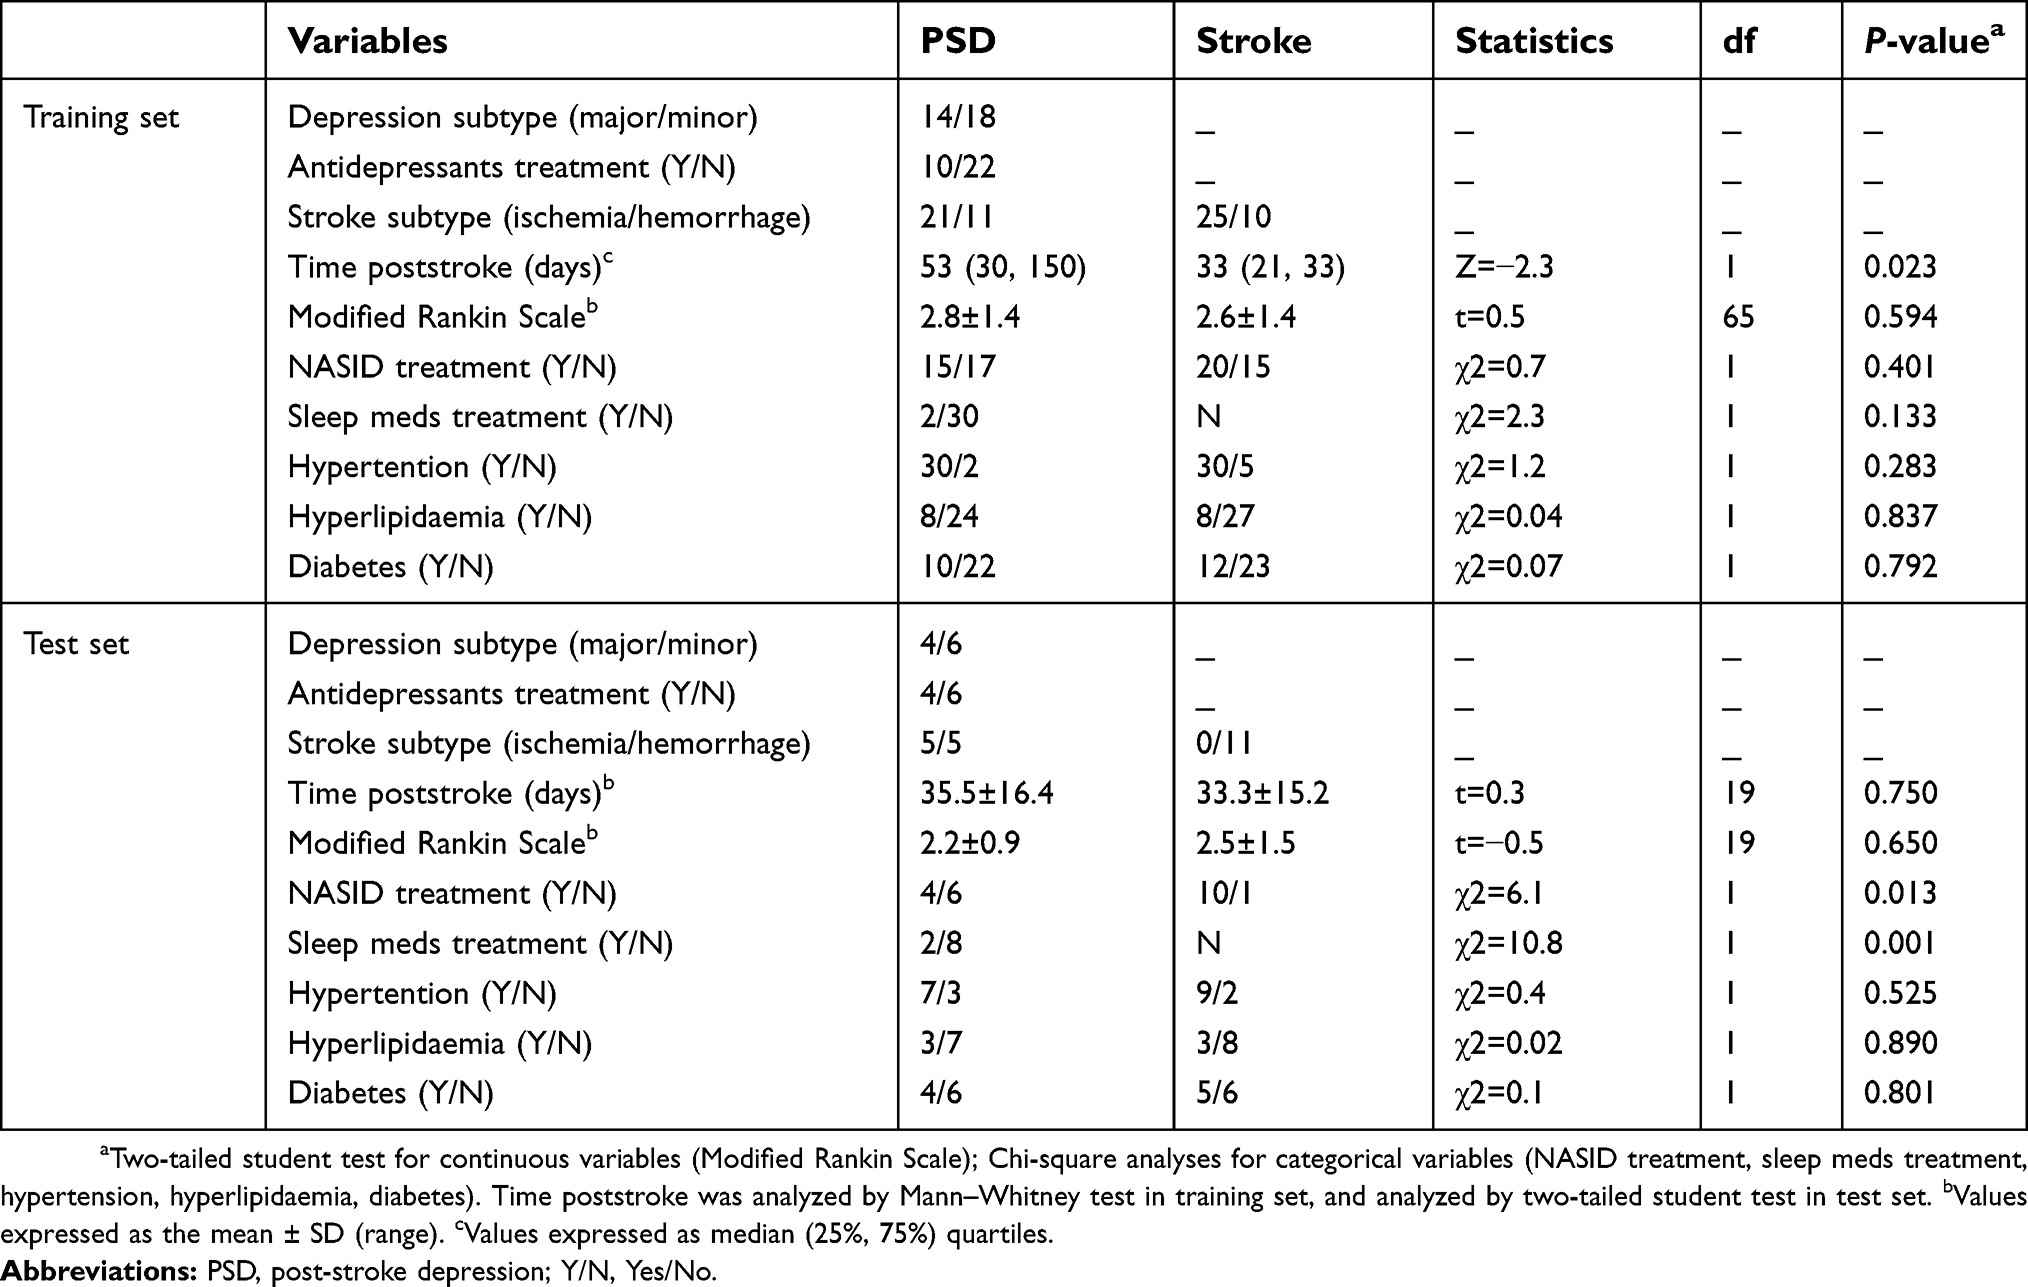
The detailed characteristics of demographic and clinical data obtained from the PSD and non-PSD stroke groups (non-depression stroke patients and healthy comparison groups) are provided in Tables 1 and S1. The PSD group scored higher on the Hamilton Depression Rating Scale than non-PSD groups in both training set and test set. In addition, the three groups were not differentiable by any key demographic characteristic (age, gender or BMI) in both sets (Table 1).
 | Table 1 Demographic and clinical details of the recruited subjects |
Metabonomic analysis of plasma samples
OPLS-DA score plots demonstrated that both PSD and stroke subjects were significantly differentiated from healthy comparison subjects (Figure 1A, PSD vs HC, R2X=0.323, R2Y=0.624, Q2=0.335; Figure 1B, stroke vs HC, R2X=0.368, R2Y=0.773, Q2=0.633). OPLS-DA score plots demonstrated that the PSD group was significantly distinguishable from the stroke group (Figure 2, R2X=0.358, R2Y=0.604, Q2=0.163). As the three parameters for assessing the OPLS-DA models (R2X, R2Y and Q2Y) were all positive, these findings suggest that plasma metabolic perturbation observed in PSD subjects relative to stroke patients and healthy comparison subjects was robust.
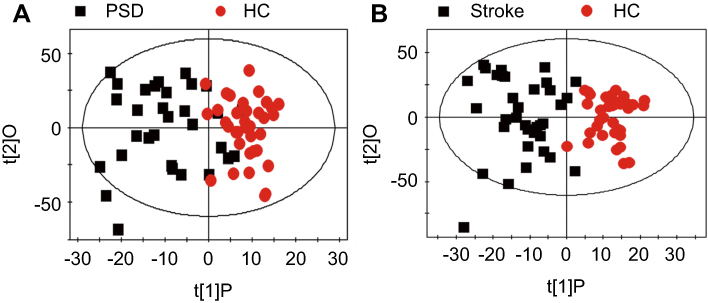 | Figure 1 (A) The OPLS-DA model score plots show that PSD subjects were clearly distinguished from healthy comparison subjects; (B) A clear discrimination between and stroke and control group was observed.Abbreviations: HC, healthy comparison; OPLS-DA, orthogonal partial least-squares discriminant analysis; PSD, post-stroke depression. |
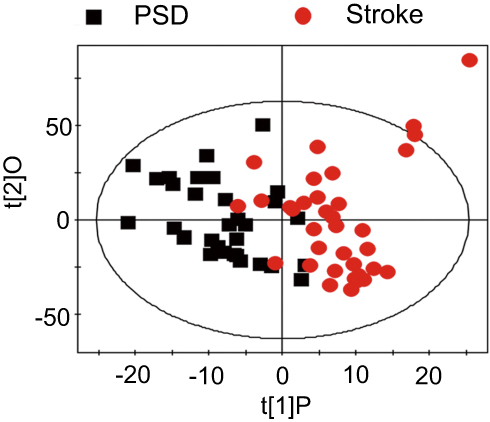 | Figure 2 The score plots of the OPLS-DA model showing a clear separation between PSD subjects and stroke subjects. Abbreviations: OPLS-DA, orthogonal partial least-squares discriminant analysis; PSD, post-stroke depression. |
To assess the reliability of constructed OPLS-DA model, 80% of the recruited training subjects were randomly selected to construct new OPLS-DA models. Then, these models were used to predict class membership in the remaining 20% of subjects. Initially, using the plasma metabolic profiling from the 25 PSD subjects and 28 stroke patients, a new OPLS-DA model was reconstructed. This analysis resulted in a clear discrimination between the PSD and stroke groups. The T-predicted scatter plots of the OPLS-DA model are shown in Figure 3A and B. 6 of the 7 PSD subjects and 6 of the 7 stroke patients were correctly predicted by the OPLS-DA model, yielding a sensitivity of 85.7%, specificity of 85.7% and accuracy of 85.7%. A similar OPLS-DA model was then reconstructed with data from the 25 PSD subjects and 28 healthy comparison subjects, and a clear discrimination between the two groups was observed therein. Using this regenerated OPLS-DA model to classify the 7 PSD subjects and 7 healthy comparison subjects, 6 of the 7 PSD subjects and all 7 healthy comparison subjects were correctly classified, resulting in a sensitivity of 85.7%, specificity of 100% and accuracy of 92.8% (Figure 3C and D). The foregoing results confirm the reliability of constructed OPLS-DA model.
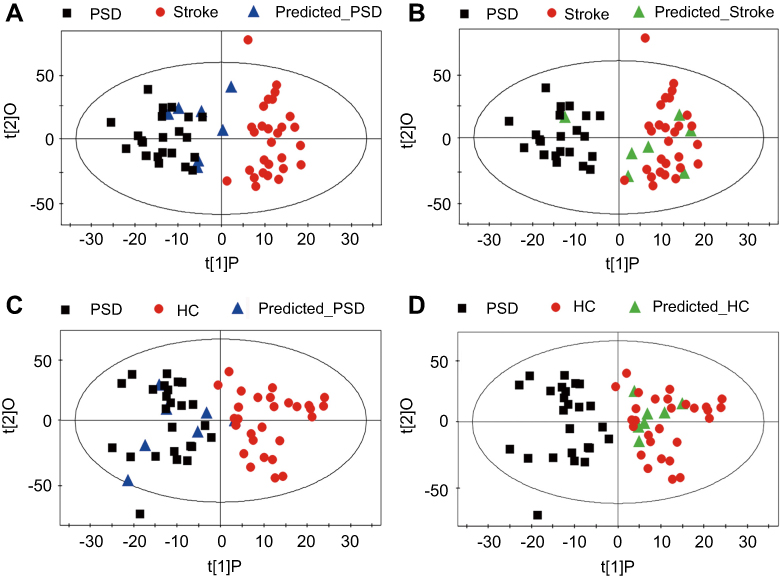 | Figure 3 Assessing reliability of constructed OPLS-DA model. The new OPLS-DA models constructed with 80% of the recruited subjects were used to predict class membership in the remaining 20% of subjects. (A and B) 6 of the 7 PSD subjects and 6 of the 7 stroke subjects were correctly predicted, yielding an accuracy of 85.7%; (C and D) 6 of the 7 PSD subjects and all 7 healthy comparison subjects were correctly classified, resulting in an accuracy of 92.8%. Abbreviations: HC, healthy comparison; OPLS-DA, orthogonal partial least-squares discriminant analysis; PSD, post-stroke depression. |
Assessment of metabolic phenotype homogeneity between ischemic and hemorrhagic subjects
To assess the homogeneity of the metabolic phenotypes in ischemic and hemorrhagic subjects, the OPLS-DA model was initially constructed to compare 21 ischemic PSD samples with 25 ischemic stroke samples. Then, the reconstructed OPLS-DA model was used to predict the class membership of the 11 hemorrhagic PSD subjects and 10 hemorrhagic stroke subjects. Consequently, all hemorrhagic PSD samples were mixed with ischemic PSD samples (Figure S3A); 8 of the 10 hemorrhagic stroke samples were mixed with the ischemic stroke samples (Figure S3B). To further validate these findings, an OPLS-DA model using 21 ischemic PSD samples and 35 healthy comparison samples was constructed. This regenerated OPLS-DA model was used to classify the remaining 11 hemorrhagic PSD subjects. 9 of the 11 hemorrhagic PSD subjects were correctly classified (Figure S3C). Identical procedures were also used to classify the 10 hemorrhagic stroke subjects in the OPLS-DA model that was from the 25 ischemic stroke subjects and 35 healthy comparison subjects. This analysis showed that all 10 hemorrhagic stroke subjects were correctly predicted (Figure S3D). These combined findings suggest that the lesion type (ischemic versus hemorrhagic) may not significantly influence the metabolic phenotypes of individuals with stroke or post-stroke depression.
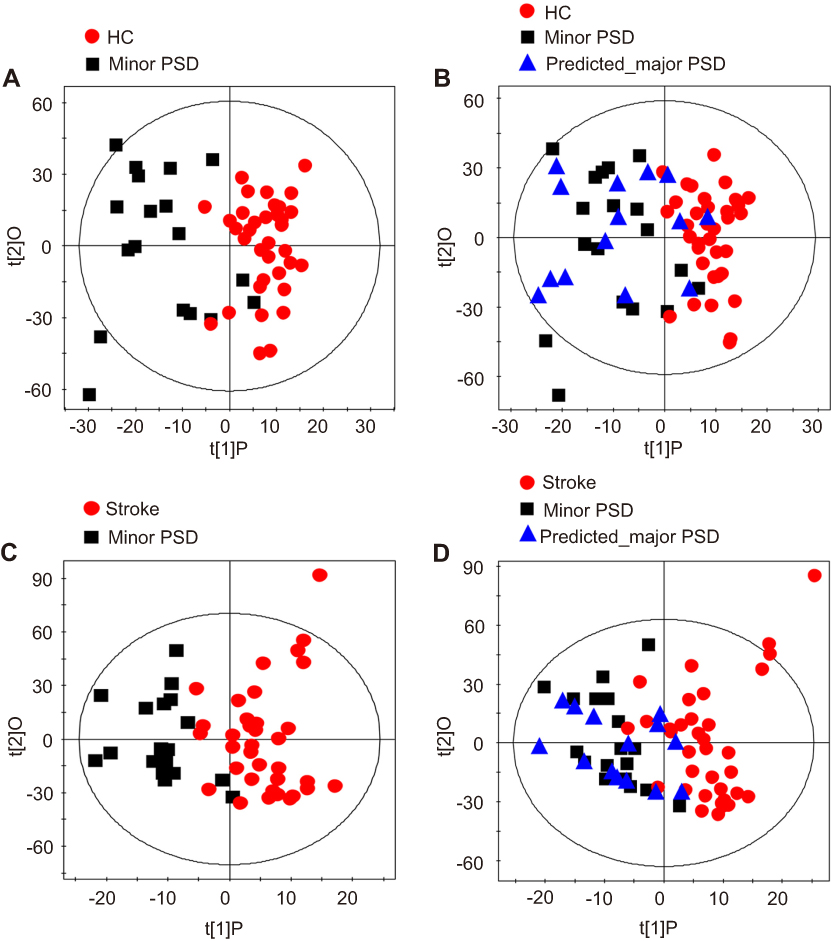
Assessment of metabolic phenotype homogeneity between major PSD and minor PSD subjects
To assess the homogeneity of metabolic phenotype between the minor PSD and major PSD subjects, the OPLS-DA models were initially constructed to compare minor PSD subjects with stroke patients or healthy comparison subjects. The reconstructed OPLS-DA score plots demonstrated that the minor PSD group was significantly distinguishable from the stroke and healthy comparison group (Figure S4A, minor PSD vs HC, R2X=0.348, R2Y=0.683, Q2=0.380; Figure S4C, minor PSD vs stroke, R2X=0.382, R2Y=0.667, Q2=0.242). Then, the reconstructed OPLS-DA models were used to predict the class membership of the remaining 14 major PSD subjects. This analysis showed that 10 of 14 major PSD subjects were correctly predicted by the OPLS-DA model constructed with minor PSD and healthy comparison subjects (Figure S4B). Moreover, 12 of 14 major PSD subjects were correctly predicted by the OPLS-DA model generated from minor PSD subjects and stroke subjects (Figure S4D). These findings demonstrated that the type of depression may not significantly influence the metabolic phenotypes of individuals with episode PSD.
Identification for metabolite biomarkers discriminating PSD patients from non-PSD patients
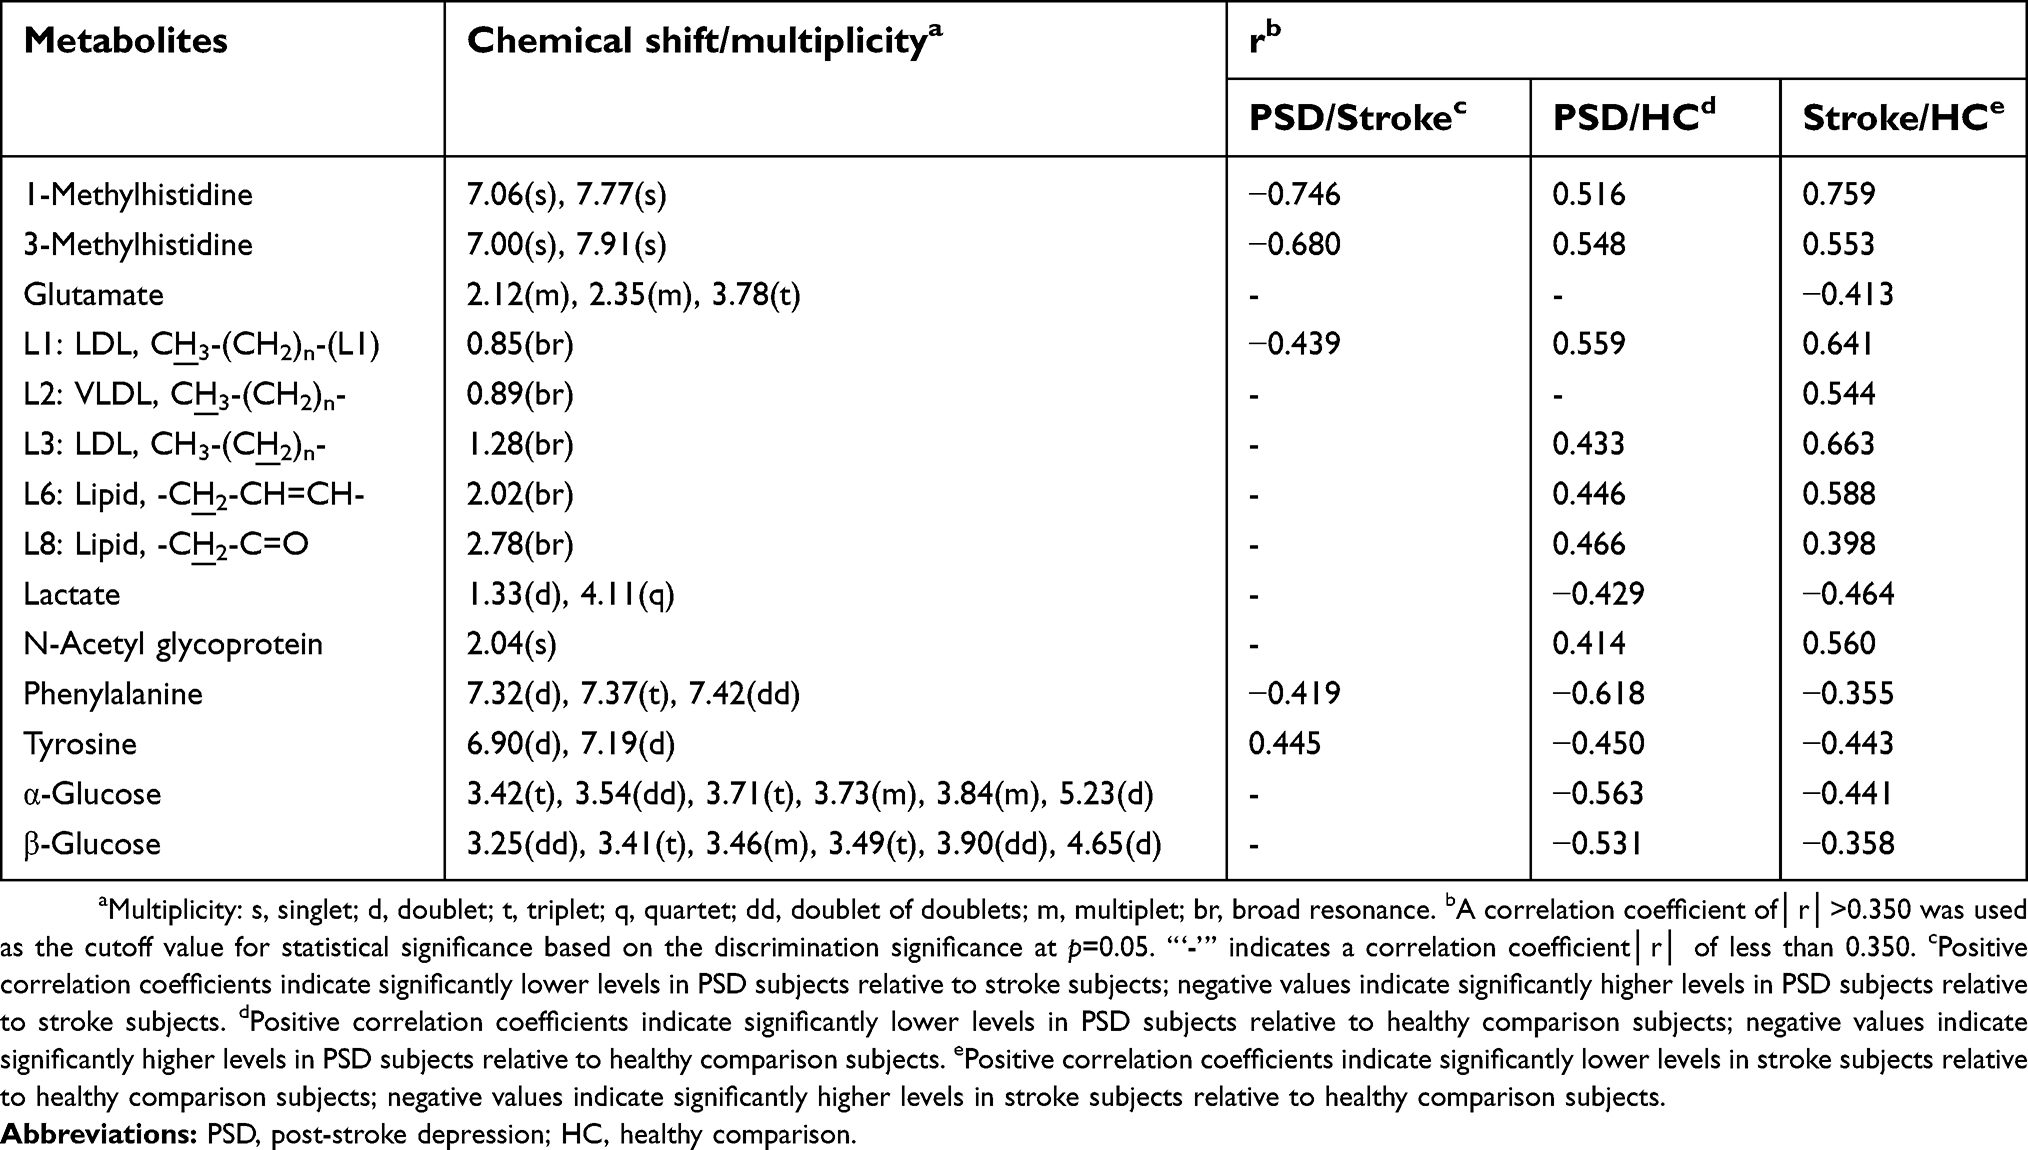
To identify the differential plasma metabolites responsible for discriminating the PSD subjects from non-PSD subjects, the corresponding coefficient loading plots of the OPLS-DA models were analyzed. By analyzing the coefficient loading plots of the OPLS-DA model derived from the PSD and healthy comparison groups, 12 metabolites contributing to the discrimination of PSD subjects from healthy comparison subjects were identified (Figure 4A). Compared to healthy comparison subjects, the plasma of the PSD subjects were characterized by higher levels of lactate, phenylalanine, tyrosine and glucose combined with lower levels of 1-methylhistidine, 3-methylhistidine, LDL CH3-(CH2)n- lipid -CH2-CH=CH-, lipid -CH2-C=O and N-acetyl glycoprotein. Moreover, using the same analysis, 14 metabolites contributing to the discrimination of stroke subjects from healthy comparison subjects were also identified (Figure 4B). Interestingly, 12 of the 14 perturbed plasma metabolites in stroke subjects were consistently changed in PSD subjects (Table 2), suggesting the evolution of metabolic profiling in stroke potentially associated with the development of PSD.
 | Table 2 Key differential metabolites among PSD, stroke and healthy comparison groups |
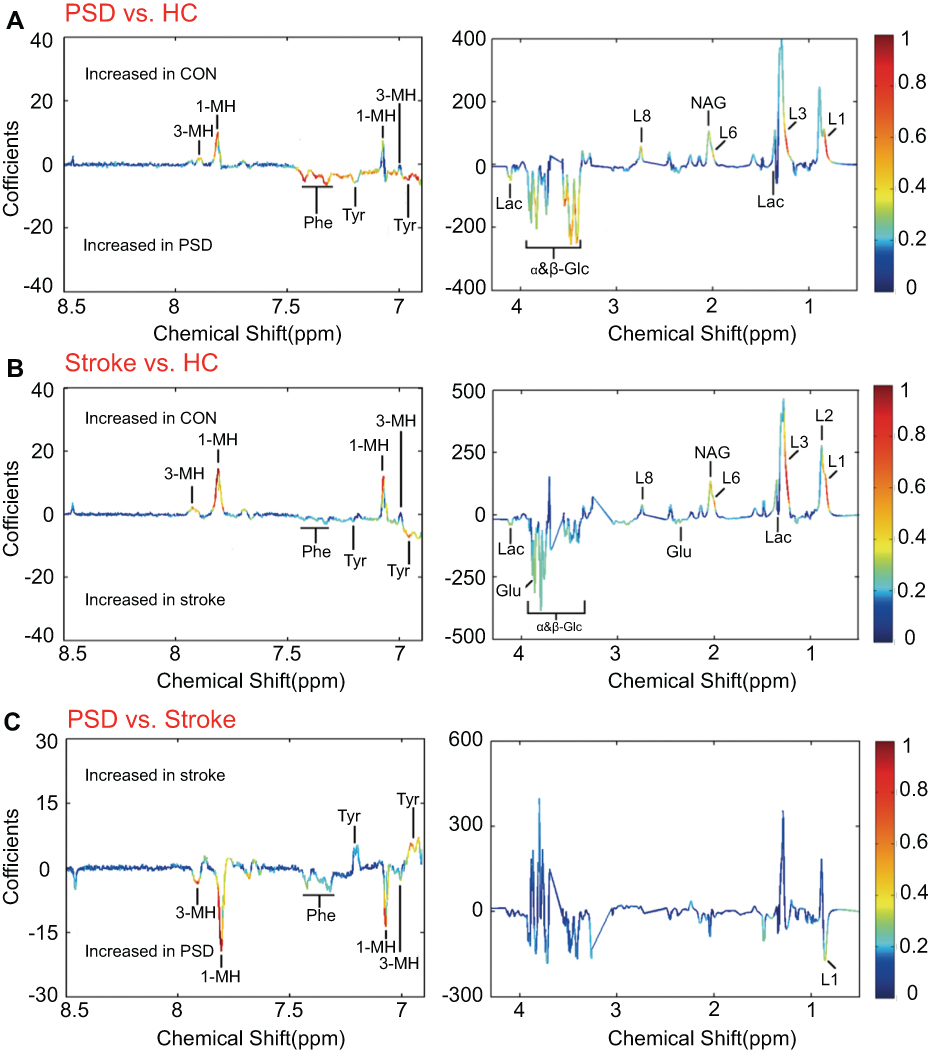 | Figure 4 Identification of differential metabolites responsible for discrimination among PSD, stroke and healthy comparison groups. (A and B) The loading coefficient plots of the OPLS-DA models show metabolite variations attributable to distinguishing the PSD group from the stroke and healthy comparison groups; (C) The plasma metabolites responsible for discrimination between stroke and healthy comparison subjects.Abbreviations: HC, healthy comparison; OPLS-DA, orthogonal partial least-squares discriminant analysis; PSD, post-stroke depression. |
To specify the PSD-specific metabolites, the OPLS-DA loading coefficient plots (PSD group versusnon-depression stroke group) were analyzed. This analysis resulted in identification of five differential plasma metabolites attributing to the discrimination between these two groups (Figure 4C). Compared to stroke subjects, the plasma of PSD subjects were characterized by higher levels of 1-methylhistidine, 3-methylhistidine, LDL CH3-(CH2)n- and phenylalanine combined with lower levels of tyrosine (Table 2). Functional enrichment of these differential metabolites suggests that disturbance of neurotransmitter metabolism (phenylalanine and tyrosine) and oxidative stress (1-methylhistidine, 3-methylhistidine and LDL CH3-(CH2)n-) were implicated in the onset of PSD. All the differentially expressed metabolites in PSD subjects relative to stroke subjects were also changed in PSD subjects or stroke patients relative to healthy comparison subjects. These combined findings demonstrate that different levels of those metabolites account for discriminating PSD patients from stroke patients and healthy comparison subjects.
Independent validation of diagnostic performance of PSD-biomarkers
To independently validate the diagnostic performance of these PSD-specific metabolites, new OPLS-DA models were reconstructed with plasma NMR spectra obtained from five metabolites to compare PSD with non-PSD samples. These analyses resulted in a clear discrimination between PSD and non-PSD groups (Figure 5A, PSD vs stroke, R2X=0.482, R2Y=0.485, Q2=0.354; Figure 5D, PSD vs HC, R2X=0.447, R2Y=0.537, Q2=0.397). T-predicted scatter plots of these OPLS-DA models were then used to predict class membership of test samples. 10 of the 11 healthy comparison subjects, all PSD and stroke subjects were correctly predicted by the reconstructed OPLS-DA models (Figure 5B, C, E and F). These findings suggest that the PSD-specific metabolite panel may serve as an effective diagnostic approach for PSD, achieving a sensitivity of 100.0%, specificity of 95.5% and accuracy of 96.9%.
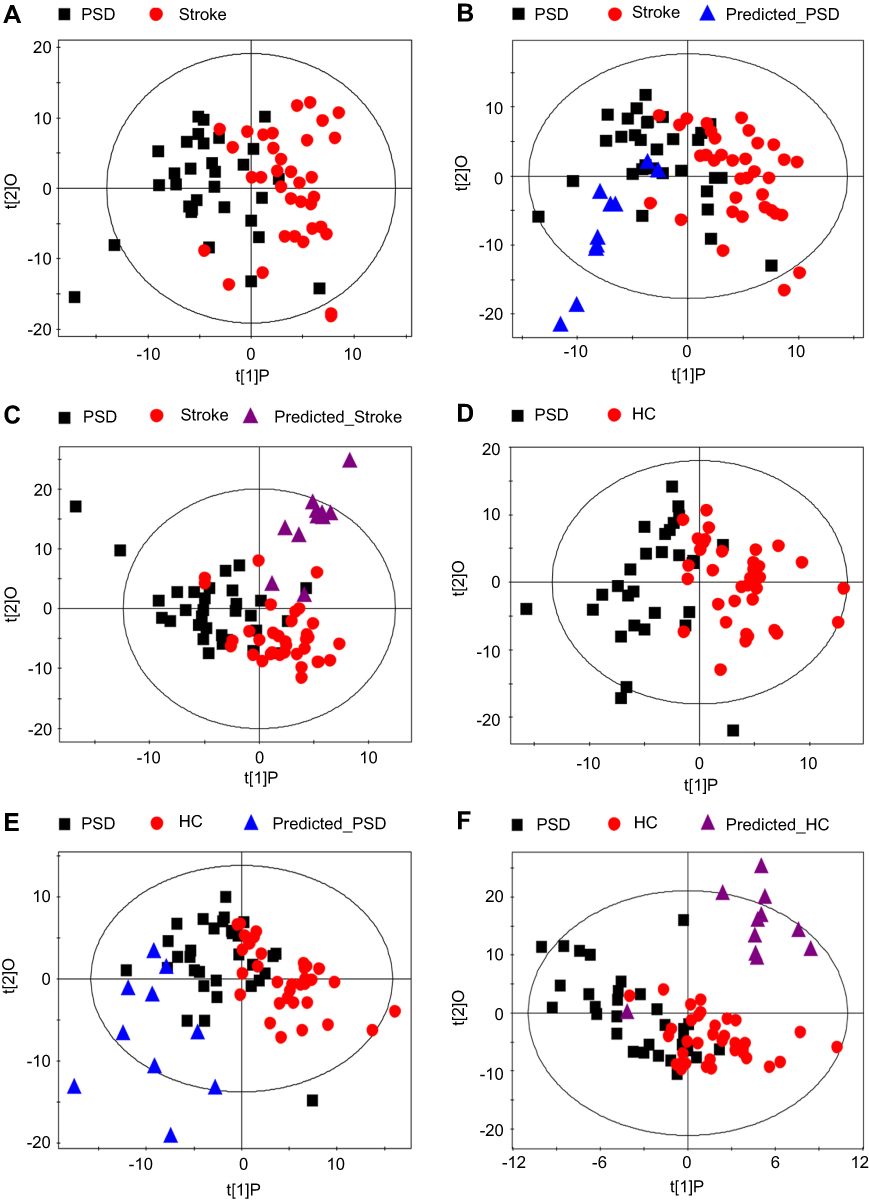 | Figure 5 Independent validation of diagnostic performance of PSD-biomarkers. (A–C) The OPLS-DA model constructed with PSD-specific metabolites showing a clear discrimination between PSD and stroke subjects in the training set; The reconstructed OPLS-DA models correctly predicted all PSD and stroke subjects in test set. (D and E) The OPLS-DA model constructed with PSD-specific metabolites showing a clear separation between PSD subjects and healthy comparison subjects. 10 of the 11 healthy comparison subjects and all PSD subjects were correctly predicted by the regenerated OPLS-DA model.Abbreviations: HC, healthy comparison; OPLS-DA, orthogonal partial least-squares discriminant analysi;PSD, post-stroke depression. |
Discussion
Current diagnosis of PSD remains subjective, and the underlying molecular mechanisms remain largely unknown. Here, we showed that NMR-based plasma metabolomics provide excellent performance in distinguishing PSD subjects from the non-PSD subjects in both training set and test set. The satisfactory predictability of this method suggests that it may serve as a useful tool in diagnosing PSD. In addition, a PSD-specific metabolic signature was identified, suggesting disturbance of neurotransmitter metabolism (phenylalanine and tyrosine) and oxidative stress (1-methylhistidine, 3-methylhistidine and LDL CH3-(CH2)n-) were implicated in the onset of PSD.
The key characteristic of any diagnostic method is accuracy of detection. Here, PSD-biomarkers identified by NMR-based metabolomics approach enabled distinguishing PSD subjects from non-PSD subjects with a sensitivity of 100.0%, specificity of 95.5% and accuracy of 96.9%. The diagnostic performance of this method is significantly higher than the currently available psychiatric interview-based method.13 To develop deeper insight into the underlying molecular mechanisms of PSD, the functional analysis of PSD-specific differential metabolites was undertaken. These five metabolites are involved in 1) monoamine neurotransmitter metabolism (phenylalanine (Phe) and tyrosine (Tyr)), and 2) oxidative stress (1-methylhistidine, 3-methylhistidine and LDL CH3-(CH2)n-). This finding is not surprising, as there is ample reported evidence indicating that the two processes are implicated in the pathophysiology of PSD.7,32
Monoamine neurotransmitter metabolism
The aromatic amino acids Phe and Tyr are the biosynthetic precursors of the monoamine neurotransmitters (dopamine (DA) and noradrenaline (NA)). The rates of these neurotransmitter synthesis and release are directly affected by the CNS levels of their amino acid precursors, namely Phe and Tyr, which in turn are driven by their plasma bioavailability.33 Therefore, any pathophysiologic factor such as PSD that perturbs plasma levels of these amino acids and/or the branched-chain amino acids that compete for the common large neutral amino acids (LNAA) transporter at the blood–brain barrier (BBB) will change the CNS levels of the foregoing aromatic amino acids, the formation and release of monoamine neurotransmitters, and therefore brain function. More specifically, as the LNAA transporter is competitive, increases in the plasma levels of LNAA (such as Phe) can reduce the uptake of other LNAA and thus lower their CNS levels. Besides, tyrosine hydroxylase which catalyzes the conversion of tyrosine to dopa could be inhibited by high levels of phenylalanine. Therefore, in the present case, the increased plasma levels of Phe in PSD subjects relative to stroke patients result in decreased CNS levels of both Tyr and its downstream catecholamines (DA, NA), since the initial Tyr hydroxylation step in the catecholamine synthesis pathway is rate-limiting and thus controls the rate of catecholamine synthesis. This deduction is consistent with previous work that has found evidence of reduced brain catecholamine levels in the pathophysiology of PSD.10,34
Oxidative stress
In this study, we observed that the levels of 1-methylhistidine and 3-methylhistidine were increased in PSD group relative to the stroke group. 1-methylhistidine and 3-methylhistidine are the metabolic byproducts of two carnosine (beta-alanyl-L-histidine) analogs: anserine (beta-alanyl-L-1-methyl-histidine) and balenine (ophidine, beta-alanyl-L-3-methylhistidine), respectively. Carnosine and its analogs are antioxidant molecules found in the brain, and have been thoroughly investigated in vivo and in vitro as free-radical scavengers and inducers of antioxidant systems in oxidative stress-related conditions, such as neurodegenerative disorders and hypoxic–ischemic injuries.35,36 Interestingly, the level of another antioxidant marker, LDL, was also elevated in the PSD patients, which has been linked to increased production of oxygen-derived free radicals, contributing to the oxidative stress burden.37 Taken together, the upregulation of the foregoing antioxidant stress markers observed here may be indicative of excess oxidative damage in PSD patients relative to stroke patients. In agreement with this speculation, increased oxidative stress was implicated in the development of PSD in previous study.32
The results of this study should be cautiously interpreted on account of the following limitations. The sample size used in this study was relatively small. This was limited by the fact that the PSD always affected the aged people and was always comorbided with other systemic medical illness. Moreover, all subjects were of the same ethnicity and were recruited from the same site. Thus, ethno- and site-specific biases cannot be ruled out. Further studies recruiting heterogeneous populations conducted across different sites should be performed. Lastly, the detailed mechanisms of disturbed plasma neurotransmitter levels and oxidative stress were required to validate in the animal studies.
Conclusion
To our knowledge, this is the first metabolomic-based study investigating plasma molecular disturbances for PSD. Here, we provided evidence that NMR-based plasma metabonomics may serve as a useful tool in the clinical diagnosis of PSD. Moreover, peripheral disturbances of neurotransmitter levels and oxidative stress were implicated in the onset of PSD.
Acknowledgments
This work was supported by the National Basic Research Program of China (973 Program) (Grant No. 2009CB9-18300), the National Natural Science Foundation of China (Grant Nos. 30900456 and 81371310). Our sincere gratitude is extended to Dr. ND Melgiri for editing and proofreading the manuscript.
Disclosure
The authors report no conflicts of interest in this work.
References
1. Hackett ML, Yapa C, Parag V, Anderson CS. Frequency of depression after stroke: a systematic review of observational studies. Stroke. 2005;36(6):1330–1340. doi:10.1161/01.STR.0000165928.19135.35
2. van de Weg FB, Kuik DJ, Lankhorst GJ. Post-stroke depression and functional outcome: a cohort study investigating the influence of depression on functional recovery from stroke. Clin Rehabil. 1999;13(3):268–272. doi:10.1191/026921599672495022
3. King RB. Quality of life after stroke. Stroke. 1996;27(9):1467–1472.
4. Schmid AA, Kroenke K, Hendrie HC, Bakas T, Sutherland JM, Williams LS. Poststroke depression and treatment effects on functional outcomes. Neurology. 2011;76(11):1000–1005. doi:10.1212/WNL.0b013e318210435e
5. Bozikas VP, Gold G, Kövari E, et al. Pathological correlates of poststroke depression in elderly patients. Am J Geriatr Psychiatry. 2005;13(2):166–169. doi:10.1176/appi.ajgp.13.2.166
6. Gaete JM, Bogousslavsky J. Post-stroke depression. Expert Rev Neurother. 2008;8(1):75–92. doi:10.1586/14737175.8.1.75
7. Murakami T, Hama S, Yamashita H, et al. Neuroanatomic pathways associated with poststroke affective and apathetic depression. Am J Geriatr Psychiatry. 2013;21(9):840–847. doi:10.1016/j.jagp.2013.01.057
8. Brodaty H, Withall A, Altendorf A, Sachdev PS. Rates of depression at 3 and 15 months poststroke and their relationship with cognitive decline: the Sydney Stroke Study. Am J Geriatr Psychiatry. 2007;15(6):477–486. doi:10.1097/JGP.0b013e3180590bca
9. Tenev VT, Robinson RG, Jorge RE. Is family history of depression a risk factor for poststroke depression? Meta-analysis. Am J Geriatr Psychiatry. 2009;17(4):276–280. doi:10.1097/JGP.0b013e3181953b6e
10. Loubinoux I, Kronenberg G, Endres M, et al. Post-stroke depression: mechanisms, translation and therapy. J Cell Mol Med. 2012;16(9):1961–1969. doi:10.1111/j.1582-4934.2012.01555.x
11. Berg A, Lönnqvist J, Palomäki H, Kaste M. Assessment of depression after stroke: a comparison of different screening instruments. Stroke. 2009;40(2):523–529. doi:10.1161/STROKEAHA.108.527705
12. Spalletta G, Ripa A, Caltagirone C. Symptom profile of DSM-IV major and minor depressive disorders in first-ever stroke patients. Am J Geriatr Psychiatry. 2005;13(2):108–115. doi:10.1176/appi.ajgp.13.2.108
13. Schubert DS, Burns R, Paras W, Sioson E. Increase of medical hospital length of stay by depression in stroke and amputation patients: a pilot study. Psychother Psychosom. 1992;57(1–2):61–66. doi:10.1159/000288575
14. Nicholson JK, Lindon JC. Systems biology: metabonomics. Nature. 2008;455(7216):1054–1056. doi:10.1038/4551054a
15. Quinones MP, Kaddurah-Daouk R. Metabolomics tools for identifying biomarkers for neuropsychiatric diseases. Neurobiol Dis. 2009;35(2):165–176. doi:10.1016/j.nbd.2009.02.019
16. Brindle JT, Antti H, Holmes E, et al. Rapid and noninvasive diagnosis of the presence and severity of coronary heart disease using 1H-NMR-based metabonomics. Nat Med. 2002;8(12):1439–1444. doi:10.1038/nm802
17. Jung JY, Lee HS, Kang DG, et al. 1H-NMR-based metabolomics study of cerebral infarction. Stroke. 2011;42(5):1282–1288. doi:10.1161/STROKEAHA.110.598789
18. Sussulini A, Prando A, Maretto DA, et al. Metabolic profiling of human blood serum from treated patients with bipolar disorder employing 1H NMR spectroscopy and chemometrics. Anal Chem. 2009;81(23):9755–9763. doi:10.1021/ac901502j
19. Yang J, Chen T, Sun L, et al. Potential metabolite markers of schizophrenia. Mol Psychiatry. 2013;18(1):67–78. doi:10.1038/mp.2011.131
20. Hampel H, Kötter HU, Möller HJ. Blood-cerebrospinal fluid barrier dysfunction for high molecular weight proteins in Alzheimer disease and major depression: indication for disease subsets. Alzheimer Dis Assoc Disord. 1997;11(2):78–87.
21. Zheng P, Gao HC, Li Q, et al. Plasma metabonomics as a novel diagnostic approach for major depressive disorder. J Proteome Res. 2012;11(3):1741–1748. doi:10.1021/pr2010082
22. Zheng P, Wang Y, Chen L, et al. Identification and validation of urinary metabolite biomarkers for major depressive disorder. Mol Cell Proteomics. 2013;12(1):207–214. doi:10.1074/mcp.M112.021816
23. Zheng P, Chen JJ, Huang T, et al. A novel urinary metabolite signature for diagnosing major depressive disorder. J Proteome Res. 2013;12(12):5904–5911. doi:10.1021/pr400939q
24. Fang J, Yan W, Jiang GX, Li W, Cheng Q. Serotonin transporter gene polymorphism in Chinese patients with poststroke depression: a case-control study. Stroke. 2011;42(5):1461–1463. doi:10.1161/STROKEAHA.110.598672
25. Nicholson JK, Foxall PJ, Spraul M, Farrant RD, Lindon JC. 750 MHz 1H and 1H-13C NMR spectroscopy of human blood plasma. Anal Chem. 1995;67(5):793–811.
26. Sui W, Li L, Che W, et al. A proton nuclear magnetic resonance-based metabonomics study of metabolic profiling in immunoglobulin a nephropathy. Clinics (Sao Paulo). 2012;67(4):363–373.
27. Trygg J, Wold S. Orthogonal projections to latent structures (O-PLS). J Chemom. 2002;16(3):119–128. doi:10.1002/cem.695
28. Zheng P, Wei YD, Yao GE, et al. Novel urinary biomarkers for diagnosing bipolar disorder. Metabolomics. 2013;9(4):800–808. doi:10.1007/s11306-013-0508-y
29. Cloarec O, Dumas ME, Trygg J, et al. Evaluation of the orthogonal projection on latent structure model limitations caused by chemical shift variability and improved visualization of biomarker changes in 1H NMR spectroscopic metabonomic studies. Anal Chem. 2005;77(2):517–526. doi:10.1021/ac048803i
30. Mahadevan S, Shah SL, Marrie TJ, Slupsky CM. Analysis of metabolomic data using support vector machines. Anal Chem. 2008;80(19):7562–7570. doi:10.1021/ac800954c
31. Oikonomopoulou K, Li L, Zheng Y, et al. Prediction of ovarian cancer prognosis and response to chemotherapy by a serum-based multiparametric biomarker panel. Br J Cancer. 2008;99(7):1103–1113. doi:10.1038/sj.bjc.6604630
32. Aggarwal A, Gaur V, Kumar A. Nitric oxide mechanism in the protective effect of naringin against post-stroke depression (PSD) in mice. Life Sci. 2010;86(25–26):928–935. doi:10.1016/j.lfs.2010.04.011
33. Fernstrom JD, Fernstrom MH. Tyrosine, phenylalanine, and catecholamine synthesis and function in the brain. J Nutr. 2007;137(6 Suppl 1):1539S–1547S; discussion 1548S. doi:10.1093/jn/137.3.798S
34. Kronenberg G, Balkaya M, Prinz V, et al. Exofocal dopaminergic degeneration as antidepressant target in mouse model of poststroke depression. Biol Psychiatry. 2012;72(4):273–281. doi:10.1016/j.biopsych.2012.02.026
35. Wu HC, Shiau CY, Chen HM, Chiou TK. Antioxidant activities of carnosine, anserine, some free amino acids and their combination. J Food Drug Anal. 2003;11(11):148–153.
36. Bellia F, Vecchio G, Cuzzocrea S, Calabrese V, Rizzarelli E. Neuroprotective features of carnosine in oxidative driven diseases. Mol Aspects Med. 2011;32(4–6):258–266. doi:10.1016/j.mam.2011.10.009
37. Esterbauer H, Puhl H, Dieber-Rotheneder M, Waeg G, Rabl H. Effect of antioxidants on oxidative modification of LDL. Ann Med. 1991;23(5):573–581.
Supplementary materials
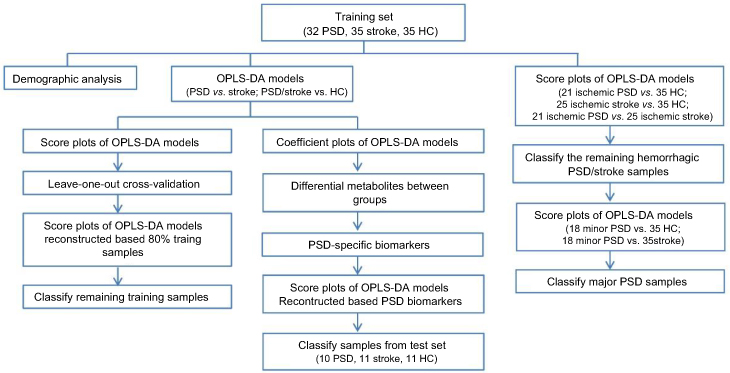 | Figure S1 The overall flowchart of this metabonomic study. |
 | Figures S2 Representative plasma 600 MHz one-dimensional Carr-Purcell- Meiboom-Gill (1D-CPMG) 1 H NMR spectra obtained from a PSD subject, a stroke subject, and a healthy control subject. The spectrum resonances assigned to the metabolites including 1-methylhistidine, 3-hydroxybutyrate, 3-methylhistidine, acetoacetate, acetate, acetone, alanine, creatine, formate, glucose, glutamine, glutamate, glycerolphosphocholine, isoleucine, LDL CH 3 -(CH 2 )n -, VLDL CH 3 -(CH 2 )n -, lipid - CH2 -CH=CH-, lipid -CH2 -C=O, lipid, -CH=CH-, lactate, leucine, lysine, N-acetyl glycoprotein, phenylalanine, succinate, tyrosine, and valine are noted. |
 | Figures S3 Assessment of Metabolic Phenotype Homogeneity in Ischemic and Hemorrhagic Subjects. (A-B) A new generated OPLS-DA model constructed with 21 ischemic PSD samples and 25 ischemic stroke samples was used to predict the class membership of the 11 hemorrhagic PSD subjects and 10 hemorrhagic stroke subjects. All hemorrhagic PSD samples were mixed with ischemic PSD samples; 8 of the 10 hemorrhagic stroke samples were mixed with the ischemic stroke samples; (C) An OPLS- DA model using 21 ischemic PSD samples and 35 healthy control samples was constructed. This regenerated OPLS-DA model was used to classify the remaining 11 hemorrhagic PSD subjects. 9 of the 11 hemorrhagic PSD subjects were correctly classified; (D) Identical procedures were also used to classify the 10 hemorrhagic stroke subjects in the OPLS-DA model that was from the 25 hemorrhagic stroke subjects and 35 healthy controls. This analysis showed that all 10 hemorrhagic stroke subjects were correctly predicted. |
 | Table S1 Clinical details of the recruited PSD and stroke subjects |
 | Figures S4 Assessment of Metabolic Phenotype Homogeneity between Major PSD and Minor PSD Subjects. (A)The new OPLS-DA models were constructed to compare minor PSD subjects with stroke or healthy comparison subjects. (B)The reconstructed OPLS-DA models were used to predict the class membership of the remaining 14 major PSD subjects. 10 of 14 major PSD subjects were correctly predicted. (C-D) 12 of 14 major PSD subjects were correctly predicted by the OPLS-DA model generated from minor PSD subjects and stroke subjects. |
 © 2019 The Author(s). This work is published and licensed by Dove Medical Press Limited. The
full terms of this license are available at https://www.dovepress.com/terms
and incorporate the Creative Commons Attribution
- Non Commercial (unported, 3.0) License.
By accessing the work you hereby accept the Terms. Non-commercial uses of the work are permitted
without any further permission from Dove Medical Press Limited, provided the work is properly
attributed. For permission for commercial use of this work, please see paragraphs 4.2 and 5 of our Terms.
© 2019 The Author(s). This work is published and licensed by Dove Medical Press Limited. The
full terms of this license are available at https://www.dovepress.com/terms
and incorporate the Creative Commons Attribution
- Non Commercial (unported, 3.0) License.
By accessing the work you hereby accept the Terms. Non-commercial uses of the work are permitted
without any further permission from Dove Medical Press Limited, provided the work is properly
attributed. For permission for commercial use of this work, please see paragraphs 4.2 and 5 of our Terms.