Back to Journals » Clinical Ophthalmology » Volume 13
Objective assessment of optical quality in dry eye disease using a double-pass imaging system
Authors Gouvea L, Waring GO IV, Brundrett A, Crouse M, Rocha KM ![]()
Received 9 April 2019
Accepted for publication 9 August 2019
Published 9 October 2019 Volume 2019:13 Pages 1991—1996
DOI https://doi.org/10.2147/OPTH.S211584
Checked for plagiarism Yes
Review by Single anonymous peer review
Peer reviewer comments 2
Editor who approved publication: Dr Scott Fraser
Larissa Gouvea,1 George Oral Waring IV,2 Ashley Brundrett,1,3 Michelle Crouse,4 Karolinne Maia Rocha1,3
1Storm Eye Institute, Medical University of South Carolina, Charleston, SC, USA; 2Waring Vision Institute, Mount Pleasant, SC, USA; 3Department of Ophthalmology, Medical University of South Carolina, Charleston, SC, USA; 4Department of Internal Medicine, Tulane University School of Medicine, New Orleans, LA, USA
Correspondence: Larissa Gouvea
Storm Eye Institute, Medical University of South Carolina, 167 Ashley Avenue, Charleston, SC 29425, USA
Email [email protected]
Purpose: To assess optical quality dynamics using a double-pass (DP) system in patients with dry eye disease (DED).
Methods: Seventy-six eyes with DED and 44 control subjects were enrolled in this study. Each patient underwent ocular surface evaluation including fluorescein corneal staining and Schirmer’s II test. Ocular Surface Disease Index (OSDI) questionnaire was used to assess subjective symptoms. Optical quality dynamics and tear film instability was analyzed using a DP system (HD AnalyzerTM, Visiometrics, Spain). Mean objective scatter index (OSI), maximum and minimum OSI, difference between maximum and minimum OSI (ΔOSI) were recorded with 40 consecutive scans over 20 s.
Results: The DED group had pronounced impairment of optical quality compared to the control group. Mean OSI (4.29±4.07), minimum (3.22±3.51) and maximum (5.72±4.52) OSI, ΔOSI (2.50±1.96), OSDI score (36.94±16.55), and fluorescein corneal staining (0.79±0.96) were statistically significantly higher than controls (p<0.05). Schirmer’s II test was statistically significantly lower in the DED group compared to controls (10.08±7.85, 26.41±6.75, respectively; p<0.001). Three patterns of dynamic changes of OSI were proposed: ladder (continuous increase of OSI), seesaw (instability of OSI without improvement after blinking), and plateau (steady-high OSI). The ladder group showed the highest value of maximum OSI (6.93±4.13; p=0.03) and ΔOSI (3.76±2.08; p<0.001).
Conclusion: DP imaging system provides an objective measurement of the visual quality in DED. Tear film instability may be assessed by dynamic changes of OSI over 20 s. In particular, the highest OSI values were observed in the ladder pattern group.
Keywords: dry eye disease, quality of vision, tear film analysis, double-pass imaging system, objective scatter index, ocular surface disease index, fluorescein corneal staining, Schirmer’s test
Dry eye disease (DED) is a multifactorial inflammatory disease resulting in tear film instability, ocular discomfort, and optical quality degradation.1 According to the Dry Eye Workshop (DEWS), DED is associated with increased osmolarity and inflammation of the ocular surface.1–4 Irregularities of the air-tear film interface of the ocular surface contribute to fluctuation of vision in the form of ocular light scatter as measured by double-pass (DP) imaging system, degrading retinal image quality.2–6
Quality of vision in DED may be assessed through subjective and objective tests. Subjective evaluations include the Ocular Surface Disease Index (OSDI) or the Standardized Patient Evaluation of Eye Dryness questionnaires.1 Objective measurements of visual function include wavefront analysis,7 high-speed videokeratoscopy,8 lateral shearing interferometry,8,9 compensation comparison of retinal straylight,10 and DP retinal imaging technique.1,6,11,12 The DP system captures dynamic changes of the point spread function (PSF) and calculates the mean value of objective scatter index (OSI) over 20 s.2,3,13,14 Temporal changes of OSI provide a functional analysis of the impact of tear film instability on retinal image quality.2,3,5,6,11,15 Recent studies have demonstrated increased aberrations and forward ocular scatter in patients with DED.2,3,5,6,10,15
This study aims to evaluate the use of a DP imaging system to objectively analyze visual quality as a function of tear film instability and to correlate to clinical findings and subjective symptoms of DED, as well as to characterize dynamic changes of OSI.
Materials and methods
Patients diagnosed with DED according to the definition of the DEWS1 were enrolled in this observational study from January 2016 to May 2017. The control group was comprised of healthy subjects with no clinical signs or symptoms of DED.
OSDI, corneal staining, and Schirmer’s II test were used in our evaluation of DED. Corneal staining was determined by counting punctate epithelial erosions (PEE) stained with fluorescein.16 Scores ranged from 0 to 3 according to the number of PEE (no PEE equals 0, 1–5 PEE score 1, 6–30 PEE score 2, >30 PEE score 3).16 Schirmer’s test was conducted with anesthesia (Schirmer’s II). Standardized strips were placed in the lateral third of the lower eyelid and the length of the moistened portion of the strip after 5 mins was measured. Eyes that presented an OSDI score greater than 20, PEE score equal or greater than 1, and Schirmer’s II test worse than 15 mm were included in the DED group.
Dynamic optical quality was assessed using the tear film analysis software of the DP imaging system (HD AnalyzerTM; Visiometrics, Spain).2,3,5 A laser diode of 780 nm wavelength is emitted on the retina and DPs through the ocular media, after which the light reflection is recorded in a camera. OSI is calculated by the ratio between light in the periphery (circle of a radius between 12 and 20 mins of arc) and in the central peak (circle of a radius of 1 min of arc) of the DP image of the PSF, and ΔOSI is measured as the difference between maximum and minimum OSI.2,5,9 Higher intraocular scatter correlates with high OSI. The tear film analysis software provides dynamic changes of the optical quality through fluctuation of OSI every 0.5 s. Forty images are recorded over a period of 20 s.2 The images were acquired before instillation of topical anesthetic drops. The testing was conducted in a room with reduced illumination to maximize pupil size. All subjects were allowed to blink at will.
Exclusion criteria for all subjects were: age younger than 18, history of ocular trauma, corneal scar and opacity, infectious keratitis, glaucoma, diabetic retinopathy, ocular surgery in the previous 6 months, cataract greater than NC2C1P1 according to the Lens Opacities Classification System III (LOCS III). The study protocol followed the tenets of the Declaration of Helsinki and was approved by the Institutional Review Board of Medical University of South Carolina. All subjects agreed with the procedures and were informed in detail about the nature of this study. Written informed consent was obtained from all subjects.
Statistical analysis
For each subject, both eyes were tested and only the right eye was selected. A one-way ANOVA and Student's t-test for normal distribution were used to compare values between groups and the Pearson correlation test was used to evaluate the correlation between objective and subjective parameters of dry eye tests. A multivariate linear regression analysis was used to investigate the correlation between parameters. A p-value <0.05 was considered significant. Statistical analysis was performed using EXCEL (Microsoft® 2016 Version 15.9, Redmond, WA).
Results
Seventy-six eyes with DED and 44 controls were enrolled in this study. Demographics and clinical data are shown in Table 1.
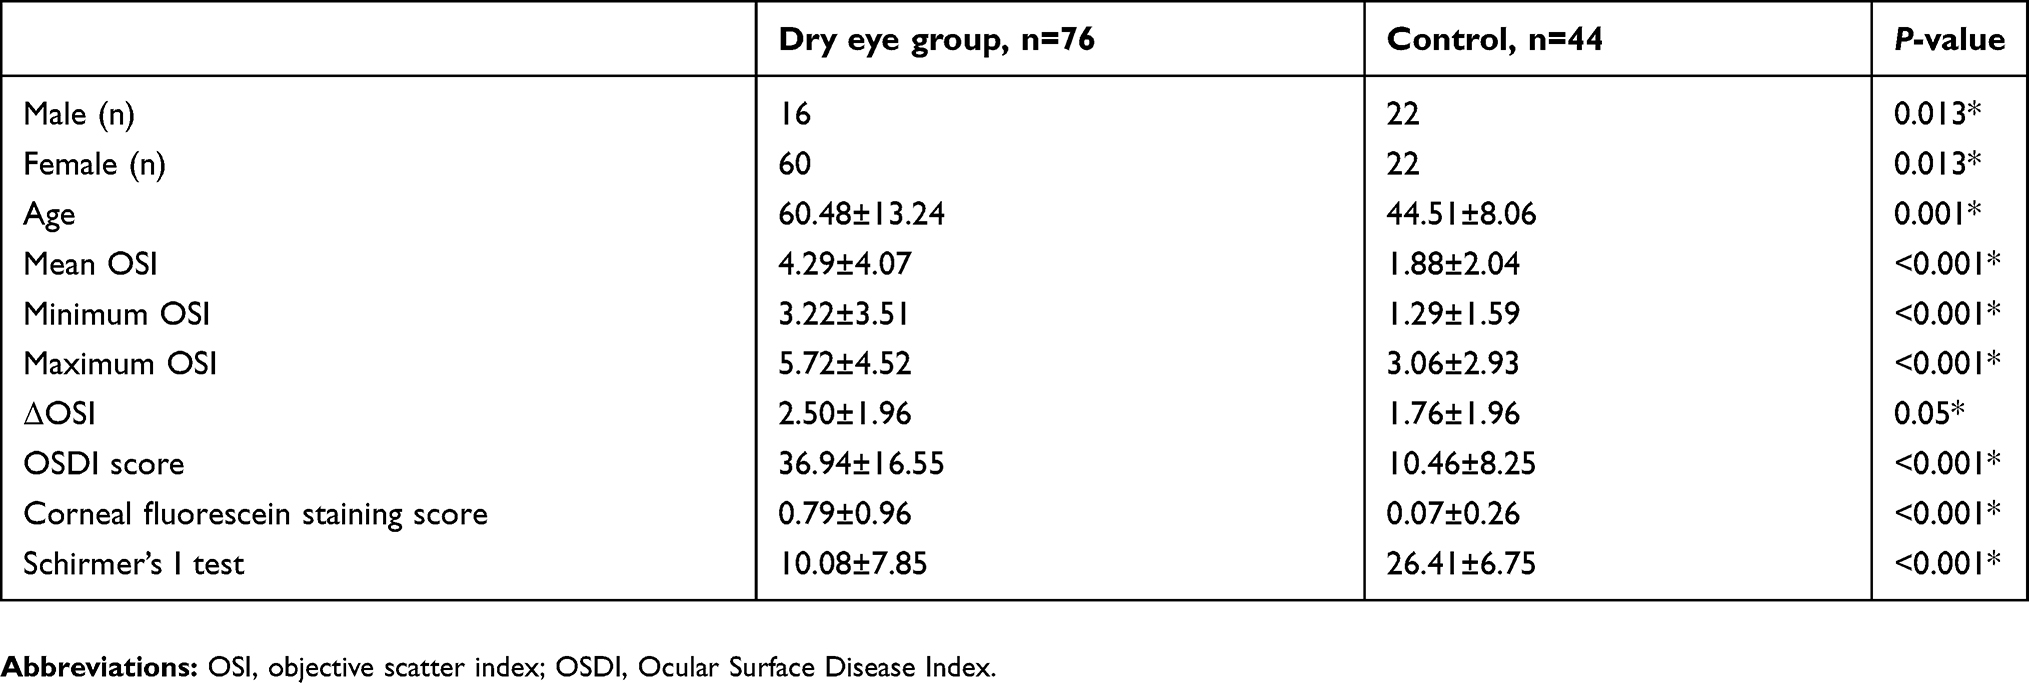 |
Table 1 Patients’ demographics and clinical tests in dry eye disease and controls |
Mean OSI was 4.29±4.07 and 1.88±2.05 in the DED group and control group, respectively (p<0.001). Minimum OSI was 3.22±3.51 in the DED group compared to 1.29±1.59 in controls (p<0.001). Maximum OSI was 5.72±4.52 in the DED group compared to 3.06±2.93 in controls (p=0.001). ΔOSI was found to be 2.50±1.96 in the DED group and 1.76±1.96 in the control group (p=0.05).
In the DED group, OSDI score was 36.84±16.55, Schirmer’s II test was 10.08±7.85, and fluorescein corneal staining score was 0.79±0.96. All three metrics were statistically significantly different than controls (p<0.05). Mean OSI did not correlate to age (r=−0.01, p=0.98), OSDI score (r=0.11; p=0.34), Schirmer’s II test (r=−0.13; p=0.26), or fluorescein corneal staining (r=0.20; p=0.09). OSDI score did not correlate to Schirmer’s II test (r=−0.18; P=0.13) nor corneal staining (r=0.16; p=0.16). Schirmer’s test did not correlate to corneal staining (r=−0.08; p=0.51). Notably, age had a weak negative correlation to corneal staining (r=−0.33; p=0.009) (Table 2).
 |
Table 2 Correlation between subjective and objective metrics in dry eye disease |
The majority of subjects in the control group (59%) showed steadylow OSI with minimal changes over 20 s (Figure 1A). Three patterns of temporal changes in OSI were recorded. Subjects in the DED group were divided into subgroups according to tear film analysis dynamics (Figure 1B–D):
- Ladder pattern: continuous increase in OSI over time
- Seesaw pattern: greater instability of tear film and optical quality. OSI fluctuation without improvement after blinking
- Plateau pattern: steady high OSI with minimal temporal changes
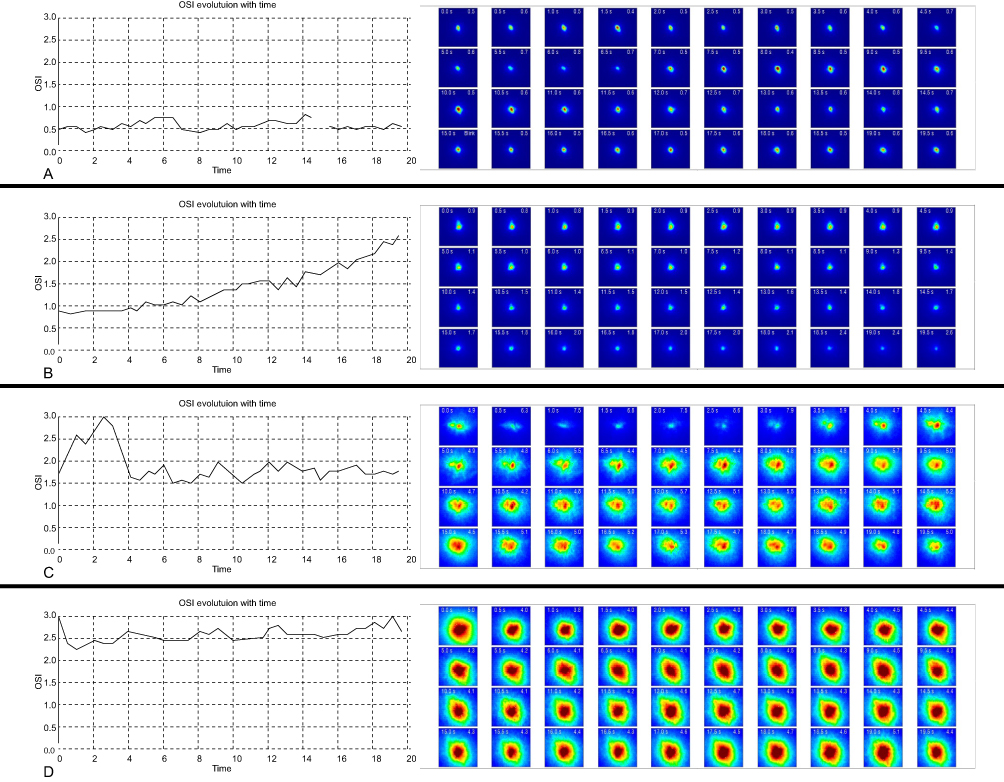 |
Figure 1 Dynamic changes of objective scatter index (OSI) of an illustrative case in the control (A) and dry eye disease groups (B–D). A) Steady-low value of OSI; (B) ladder pattern displayed ascending values of OSI; (C) seesaw pattern revealed repeatedly fluctuation of OSI; (D) plateau pattern showed a steady-high value of OSI. |
Sixty percent of patients in the DED group fit into a seesaw pattern, whereas 32% showed a ladder pattern, and 8% a plateau. The ladder group showed the highest maximum OSI value (6.93±4.13) and ΔOSI value (3.76±2.08) when compared to seesaw and plateau (p=0.03 and p<0.001, respectively). Schirmer’s II test was worse in the seesaw group (9.23±5.57) than in the ladder group (12.2±10.23; p=0.01), but not statistically significantly different than in the plateau group (10.7±6.83; p=0.47). Mean OSI, minimum OSI, OSDI score, and corneal staining did not differ significantly among groups. Details are outlined in Table 3.
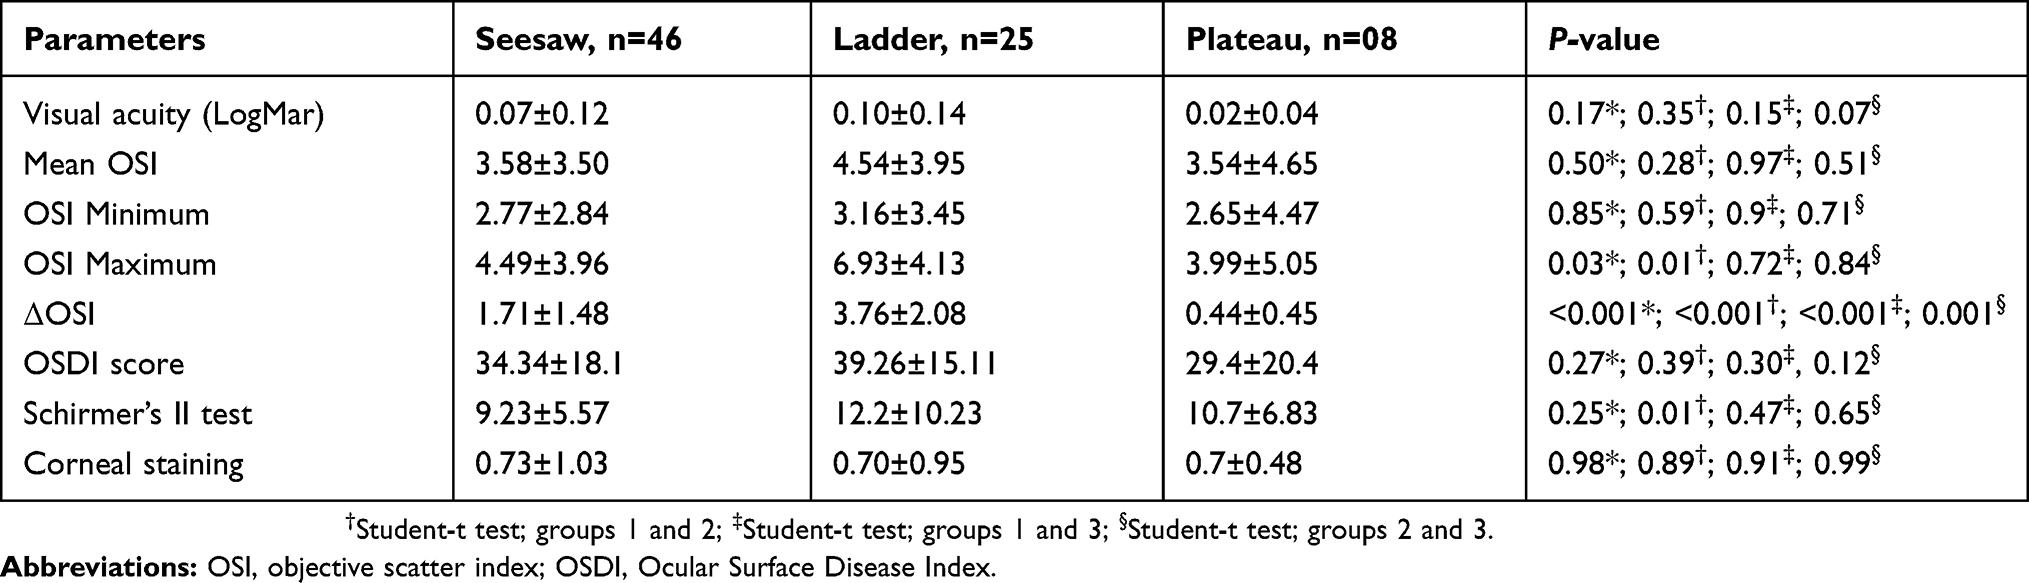 |
Table 3 Subjective and objective tests in the DED subgroups |
Discussion
In this study, we used the tear film analysis software of the DP imaging system to analyze dynamic changes of optical quality in patients with DED compared to healthy subjects with no clinical signs of DED. Dynamic changes of OSI measured by DP wavefront have been shown to be reproducible13,17,18 and repeatable18–20 as a surrogate for visual instability in DED. Dry eye patients may present with subjective visual disturbances not well characterized by historical visual acuity tests such as Snellen acuity.1–6,11,13,15 Often, cataract and refractive surgeons search for an explanation of why dry eye patients complain about their vision despite acceptable objective visual acuity.
Historically, low levels of androgen, high levels of estrogen, and aging are associated with meibomian gland dysfunction (MGD), and tear film instability.1 As a result, aging females are more likely to be affected by DED.1 Comparable, in our study, the majority of patients in the DED group were aging females (78%). In the elderly, the aging crystalline lens has a positive correlation with OSI.13 Nevertheless, the tear film analysis software measurement of OSI in 20 s accounts only for tear film alterations, since variations in the cornea, lens, and vitreous do not occur in such short period.6 Furthermore, cataract greater than NC2C1P1 according to LOCS III were excluded from the study to minimize the impact of intraocular scatter on OSI.
Benito et al,5 Koh at al,11 and Diaz-Valle et al14 have demonstrated the impact of tear film dynamics on visual quality, describing a higher mean OSI in DED when compared to normal eyes. Similarly, we observed poor tear film dynamics in the DED group (mean OSI, maximum and minimum OSI, and ΔOSI) compared to controls. Interestingly, as opposed to Herbeut et al,6 we failed to notice a correlation between objective (OSI) and subjective (OSDI score) measurements of DED. Furthermore, Schimer’s II test did not correlate with OSI scores, which may be explained by the possibility of achieving different values depending on the type of DED (normal or high values of Schrimer’s for evaporative DED and low values for aqueous deficiency).6,17
Three patterns of dynamic changes of OSI were observed in the DED group: ladder (continuous increase of OSI), seesaw (instability of OSI without improvement after blinking), and plateau (steady high OSI) (Figure 1B–D). The ladder pattern was consistent with a study by Yu et al,14 in which DED subjects presented with ascending values of OSI. Yu et al14 proposed four categories of tear film dynamics in healthy subjects based on optical quality parameters, in which most subjects were included in categories of either steady-high or steady-low values of OSI. Our study also demonstrated a plateau pattern, with steady-high values of OSI in the DED group (Figure 1D) and a pattern of steady-low values of OSI in the control group (Figure 1A). Interestingly, the ladder pattern displayed the highest mean OSI, maximum OSI, ΔOSI, and OSDI scores. Surprisingly, the ladder pattern exhibited the highest Schimer’s test score, which may be related to evaporative DED, such as MGD, low blinking rates, vitamin-A deficiency, or contact lens wear.1
Visual performance can be degraded by several optical phenomena, including diffraction, higher-order aberrations, and light scatter. DED and tear film irregularities increase forward ocular scatter,2,4–6,14 worsening contrast sensitivity4,13 and optical quality,2–5 and may affect visual performance after cataract and refractive surgery.7,11,15 Therefore, dynamic analysis of the tear film may constitute an important tool to assess ocular surface preoperatively, even in asymptomatic patients, as a mean to improve surgical planning and to maximize visual outcomes. Moreover, temporal changes of OSI may also be useful to evaluate compliance with treatment and changes in optical quality post-treatment.
Conclusion
Dynamic measurements of the PSF as a function of OSI utilizing DP system may allow clinicians to better evaluate the impact of DED on visual performance. Furthermore, dynamic changes in optical quality metrics may be used to monitor therapeutic approaches in DED.
Disclosure
Dr. Waring is a consultant and shareholder to Visiometrics and reports personal fees from Johnson & Johnson Vision, personal fees from Allergan, personal fees from Shire, during the conduct of the study. The authors report no other conflicts of interest in this work.
References
1. The definition classification of dry eye disease: report of the definition and classification subcommittee of the International Dry Eye Workshop. Ocul Surf. 2007;5(2):108–152.
2. Tan CH, Labbé A, Liang Q, et al. Dynamic change of optical quality in patients with dry eye disease. Invest Ophthalmol Vis Sci. 2015;56(5):2848–2854. doi:10.1167/iovs.14-15757
3. Kobashi H, Kamiya K, Yanome K, Igarashi A, Shimizu K. Longitudinal assessment of optical quality and intraocular scattering using the double-pass instrument in normal eyes and eyes with short tear breakup time. PLoS One. 2013;8(12):8–13. doi:10.1371/journal.pone.0082427
4. Koh S, Maeda N, Ikeda C, et al. Ocular forward light scattering and corneal backward light scattering in patients with dry eye. Invest Ophthalmol Vis Sci. 2014;55(10):6601–6606. doi:10.1167/iovs.14-15125
5. Benito A, Pérez GM, Mirabet S, et al. Objective optical assessment of tear-film quality dynamics in normal and mildly symptomatic dry eyes. J Cataract Refract Surg. 2011;37(8):1481–1487. doi:10.1016/j.jcrs.2011.03.036
6. Herbaut A, Liang H, Rabut G, et al. Impact of dry eye disease on vision quality: an optical quality analysis system study. Transl Vis Sci Technol. 2018;7(4):1–8. doi:10.1167/tvst.7.4.5
7. Koh S, Maeda N, Kuroda T, et al. Effect of tear film break-up on higher-order aberrations measured with wavefront sensor. Am J Ophthalmol. 2002;134:115–117. doi:10.1016/s0002-9394(02)01430-7
8. Szczesna D, Alonso-Carneiro D, Iskander D, et al. Lateral shearing interferometry, dynamic wavefront sensing and high-speed videokeraoscopy for noninvase assessment of tear film surface characteristics: a comparative study. J Biomed Opt. 2010;15(3):037005. doi:10.1117/1.3431103
9. Szczesna D, Iskander D. Lateral shearing interferometry for analysis of tear film surface kinetics. Optom Vis Sci. 2010;87(7):513–517.
10. Franssen L, Coppens J, van Den Berg T. Compensation comparison method for assessment of retinal straylight. Invest Ophthalmol Vis Sci. 2006;47:768–776. doi:10.1167/iovs.05-0690
11. Koh S, Tung CI, Inoue Y, Jhanji V. Effects of tear film dynamics on quality of vision. Br J Ophthalmol. 2018;102(12):1615–1620.
12. Hu A-L, Qiao L-Y, Zhang Y, Cai X-G, Li L, Wan X-H. Reproducibility of optical quality parameters measured at objective and subjective best focuses in a double-pass system. Int J Ophthalmol. 2015;8(5):1043–1050. doi:10.3980/j.issn.2222-3959.2015.05.34
13. Artal P, Benito A, Pérez GM, et al. An objective scatter index based on double-pass retinal images of a point source to classify cataracts. PLoS One. 2011;6(2):1–7. doi:10.1371/journal.pone.0016823
14. Yu A-Y, Lu T, Pan A-P, et al. Assessment of tear film optical quality dynamics. Invest Ophthalmol Vis Sci. 2016;57:3821–3827. doi:10.1167/iovs.16-19420
15. Diaz-Valle D, Arriola-Villalobos P, García-Vidal SE, et al. Effect of lubricating eye-drops on ocular light scattering as a measure of vision quality in patients with dry eye. J Cataract Refract Surg. 2012;38(7):1192–1197. doi:10.1016/j.jcrs.2012.02.040
16. Whitcher J, Shiboski C, Shiboski S, et al. A simplified quantitative method for assessing keratoconjunctivitis sicca from the Sjogren’s syndrome international registry. Am J Ophthalmol. 2010;149(2):405–415. doi:10.1016/j.ajo.2009.09.013
17. Nichols KK, Nichols JJ, Mitchell GL. The lack of association between signs and symptoms in patients with dry eye disease. Cornea. 2004;23(8):762–770.
18. Xu -C-C, Xue T, Wang Q-M, Zhou Y-N, Huang J-H, Yu A-Y. Repeatability and reproducibility of a double-pass optical quality analysis device. PLoS One. 2015;10(2):e0117587. doi:10.1371/journal.pone.0117587
19. Fernández J, Rodríguez-Vallejo M, Martínez J, Tauste A, García-Montesinos J, Piñero DP. Agreement and repeatability of objective systems for assessment of the tear film. Graefe’s Arch Clin Exp Ophthalmol. 2018;256(8):1535–1541. doi:10.1007/s00417-018-3986-9
20. Saab A, Saab M, Gatinel D. Repeatability of measurements with a double-pass system. J Cataract Refract Surg. 2010;36:28–33. doi:10.1016/j.jcrs.2009.07.033
 © 2019 The Author(s). This work is published and licensed by Dove Medical Press Limited. The
full terms of this license are available at https://www.dovepress.com/terms
and incorporate the Creative Commons Attribution
- Non Commercial (unported, 3.0) License.
By accessing the work you hereby accept the Terms. Non-commercial uses of the work are permitted
without any further permission from Dove Medical Press Limited, provided the work is properly
attributed. For permission for commercial use of this work, please see paragraphs 4.2 and 5 of our Terms.
© 2019 The Author(s). This work is published and licensed by Dove Medical Press Limited. The
full terms of this license are available at https://www.dovepress.com/terms
and incorporate the Creative Commons Attribution
- Non Commercial (unported, 3.0) License.
By accessing the work you hereby accept the Terms. Non-commercial uses of the work are permitted
without any further permission from Dove Medical Press Limited, provided the work is properly
attributed. For permission for commercial use of this work, please see paragraphs 4.2 and 5 of our Terms.