Back to Journals » Diabetes, Metabolic Syndrome and Obesity » Volume 13
Obesity Indices for Identifying Metabolic Syndrome Among Type Two Diabetes Patients Attending Their Follow-Up in Dessie Referral Hospital, North east Ethiopia
Authors Zerga AA ![]() , Bezabih AM, Adhanu AK
, Bezabih AM, Adhanu AK ![]() , Tadesse SE
, Tadesse SE ![]()
Received 18 December 2019
Accepted for publication 27 March 2020
Published 23 April 2020 Volume 2020:13 Pages 1297—1304
DOI https://doi.org/10.2147/DMSO.S242792
Checked for plagiarism Yes
Review by Single anonymous peer review
Peer reviewer comments 2
Editor who approved publication: Prof. Dr. Antonio Brunetti
Aregash Abebayehu Zerga,1 Afework Mulugeta Bezabih,2 Amaha Kahsay Adhanu,2 Sisay Eshete Tadesse1
1School of Public Health, College of Medicine and Health Sciences, Wollo University, Dessie, Ethiopia; 2Department of Nutrition and Dietetics, College of Health Sciences, Mekelle University, Mekelle, Ethiopia
Correspondence: Aregash Abebayehu Zerga Email [email protected]
Introduction: Worldwide, metabolic syndrome is a common problem among T2DM patients. Even though the International Diabetes Federation recommended waist circumference as a diagnostic tool for metabolic syndrome, the appropriate indices and cut-off point remain controversial.
Objective: To assess obesity indices in identifying metabolic syndrome among type 2 diabetes mellitus patients in Dessie Referral Hospital, North east Ethiopia.
Methods: A hospital-based cross-sectional study was conducted among 363 consecutively selected T2DM in Dessie Referral Hospital from February to March 2017. Data were collected by interviewer-administered questionnaire. Height, weight, waist circumference, hip circumference, lipid profile, blood glucose levels and blood pressure were taken. Descriptive statistics were computed. Receiver operator characteristic curve analysis with a 95% confidence interval and p-value < 0.05 was used to identify the discriminate ability of each index, while the optimal cut point of each index was determined by Youden’s index.
Results: A total of 330 study participants were included in the study. Based on ATP III definition, the magnitude of metabolic syndrome among T2DM patients was 59.4% (53.6– 64.5%). Waist to height ratio (optimal cut point=0.54, AUC=0.85) and waist circumference (optimal cut point= 83 cm, AUC=0.75) were the best predictor of metabolic syndrome for women and men, respectively. For the entire study participant, waist to height ratio (optimal cut point=0.51, AUC=0.79) was the best predictor of metabolic syndrome among type 2 diabetes patients.
Conclusion and Recommendation: Waist to height ratio and waist circumference was the best predictor of metabolic syndrome for women and men, respectively. So, appropriate indices optimal cut-off point should be included to diagnose metabolic syndrome among T2DM.
Keywords: metabolic syndrome, type 2 diabetes, Dessie Referral Hospital, obesity indices
Introduction
Metabolic syndrome (MetS) is a group of interrelated risk factors for cardiac morbidity and mortality.1 In the general population, the worldwide prevalence of MetS varies from 7.9% to 43% among males and 7% to 56% among females,2 whereas its prevalence among type two diabetes mellitus (T2DM) patients reached up to 96%.3 In Ethiopia, its prevalence among employed adults of Addis Ababa and outpatients of Jimma university teaching hospital was 17.9% and 26%, respectively,4,5; however, it was 48% among diabetes patients in Ayder referral hospital, Mekelle (unpublished).
This high prevalence of MetS could be because of the worldwide increase of obesity, sedentary lifestyle, increasing urbanization, tobacco use and rapid nutrition transition.6–8 As a risk factor, obesity is independently associated with MetS and has a high contribution to the occurrence of other components of MetS.9 Studies showed that a higher frequency of MetS was reported among obese and overweight patients than normal-weight patients.10,11
Waist circumference (WC), Body Mass Index (BMI), Waist to Height Ratio (WHtR) as well as Waist to Hip Ratio (WHR) have been used to assess obesity and as indicative of MetS. According to the International Diabetes Federation (IDF), abdominal obesity is an important component of MetS and proposes gender and race-specific cut-offs for WC. On the other hand, different studies showed that WHtR is better in predicting MetS.12–14 While another study revealed that obesity indices had equal performance in predicting the presence of MetS.15
The cut-off points for each obesity index to examine the associated adverse health risks in sub-Saharan Africa warrant further investigation. World health organization (WHO) recommended different cut-off points to be used for ethnic and racial variation.16 Based on the recommendation, South Asians, Chinese and Japanese population have ethnic-specific cut-off.17 But in Sub-Saharan Africa, there is no sufficient study to recommend appropriate cut-off point for obesity indices to predict MetS in many health services among T2DM patients.17 Because of this limited information, obesity indices and their cut-offs were adopted from the European reference population without evaluating its validity.18 Therefore, this study was designed to compare BMI, WC, WHR, and WHtR in identifying the presence of MetS among T2DM patients who attend their follow-up in Dessie referral hospital which can be used as an input for further research, program planning, as well as for resource allocation to design effective prevention and management of MetS and to prevent T2DM complication.
Methods and Materials
Study Area, Period and Design
A hospital-based cross-sectional study design was employed in Dessie Referral Hospital among T2DM patients from February to March 2017. Dessie referral hospital was found in Dessie town which is located 401 km north of Addis Ababa, the capital city of Ethiopia. It gives health services for a catchment area of five zones with an approximated population of 7 million. The total number of DM patients in Dessie Referral Hospital was around 548. According to the report of the hospital, on average the DM clinic was visited by 30 DM (both type 1 and 2) patients per day.
Eligibility Criteria
All T2DM patients age ≥30 years who were already registered and had follow-up for at least 6 months at diabetes clinic of Dessie referral hospital were included in the study. While pregnant mothers, severely ill patients, those having difficulty to stand or with physical deformity, patients on anti-retroviral therapy, those who eat breakfast, and with card inconsistency were excluded from the study.
Sample Size Determination and Sampling Technique
Since the aim of the study was to compare the diagnostic ability of obesity indices, the sample size was determined using the area under the receiver operator characteristic (ROC) curve sample size estimation formula: N=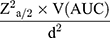 .19 Where N = sample size, d= margin of error, V(AUC) = variance of area under the curve, and Za/2= the value under the standard normal table for a given value of confidence level. By taking AUC of 0.83 for WC from a study done in Kenya,20 power of 80%, confidence interval of 95%, margin of error of 5% and 10% for non-response rate, the calculated sample size was 363. The study participants were taken consecutively until the required sample size was obtained.
Data Collection Tools and Measurement
Data were collected by face to face interview using a structured questionnaire adapted from previous literature.21,22 It was collected by four trained Bachelor of science nurses. Height was measured on barefoot using a height measuring board in a standing position and recorded to the nearest 0.1 cm. Weight was measured using SECA weight measuring scale and recorded to the nearest 0.1 kg. WC and hip circumference (HC) were also measured and noted to the nearest 0.1 cm with non-stretchable measuring tape while participant were in a standing position.21 WC was measured at the mid-point of the inferior margin of the last rib and the iliac crest at the end of expiration.17 HC was measured at the level of the maximum extension of the buttock’s posterior in a horizontal plane.
Repeated blood pressure measurements were taken using a sphygmomanometer from the right arm after participants were taken a rest for a minimum of 5 mins. FBG, total cholesterol, TG and HDL-C level in mg/dl were determined using the DIRUI CS-T240 Auto chemistry analyzer by laboratory technologist. In addition to this, data were assembled from patient monitoring card if they took treatment for blood pressure/hypertension and/or lipid abnormality.
Operational Definition
Based on BMI, patients were grouped as obese, overweight, normal weight and underweight, when BMI ≥30 kg/m2, 25–29.9 kg/m2, 18.5–24.9 kg/m2 and <18.5 kg/m2, respectively. WC ≥102 cm for men and ≥88 cm for women, WHR of >1 for men and >0.8 for women and WHtR of ≥0.5 for both women and men were used as cut points for central obesity.16
MetS have different definitions. But for this study the revised National Cholesterol Education Program: Third Adult Treatment Panel (ATP III) definition was used because it is this definition commonly used in most of the literature in which the presence of at least three of these risk factors diagnoses the MetS: FBG ≥ 110 mg/dl or on treatment; BP>130/85 mmHg or on treatment; triglyceride ≥ 150 mg/dl or on treatment; HDL: Men <40 mg/dl; women <50 mg/dl; WC >102 for men, >88 cm for women.23
Data Quality Assurance
For consistency, the questionnaire was interpreted in Amharic and back-translated to English. Training was given for data collectors and a supervisor. A pre-test was done on 5% (19 T2DM patients) of the sample size before the actual data collection at Boru Meda hospital. Data completeness was monitored daily during the data collection process. Individual anthropometric measurements were taken two times and the average was taken. But, if the difference exceeds 1 cm (100 g for weight), the measurement was repeated. Double counting was avoided by placing a code at the tip of each interviewed patient’s card.
Data Analysis
Data were entered into Epi Data version 3.1 and exported to SPSS version 20.0 for analysis. For continuous variables, the normality of the data was checked with a Q-Q plot. Descriptive statistics was computed and the result was reported with a mean (standard deviation) for normally distributed and median (interquartile range) for not normally distributed continuous variables. Categorical variables were reported by frequency, tables and percentiles. ROC curve with 95% CI was plotted for each index in which participants with ≥2 of non-obese components of MetS were grouped as positive and with less than 2 of non-obese components were classified as negative for MetS.24 The area under the curves (AUC) was used as a measure of performance of obesity indices in which AUC of 1 indicates perfect diagnostic ability, (1–0.8) good diagnostic ability, (0.7–0.8) fair diagnostic ability, and (0.6–0.7) indicates poor diagnostic ability of obesity indices.25 The optimal cut-off points for each index were calculated from the ROC curve using Youden’s index (J), a point where the sum of specificity and sensitivity can be maximum = max [sensitivity +specificity-1]. Statistical significance was set at p-value <0.05
Ethical Consideration
The proposal was reviewed and approved by the Institutional Review Committee of the College of Health Sciences, Mekelle University. A written agreement was obtained from Dessie Referral Hospital. After the objectives of the study were informed, written informed consent was obtained from each study participant. This study was conducted based on the Helsinki Declaration. They were informed as the participation was on a voluntary basis. Confidentiality was kept throughout the study. To keep their privacy sex was considered during the assignment of data collectors for anthropometric measurements. Counseling was given to individuals with a problem.
Results
Socio-Demographic Characteristics
A total of 330 study participants were included in the study. This makes a response rate of 90%. Males were slightly greater than half 170 (51.5%). The mean (±SD) age of the study participants was 53.79±11.3 years. Two fifth 135 (40.9%) of study participants had no formal education and 70 (21.2%) of study participants had a diploma and above level of education. Slightly above two-third (68.5%) of participants were married and almost one fourth (24.5%) were housewives. Nearly three fourth 256 (77.3%) of study participants were urban residents (Table 1).
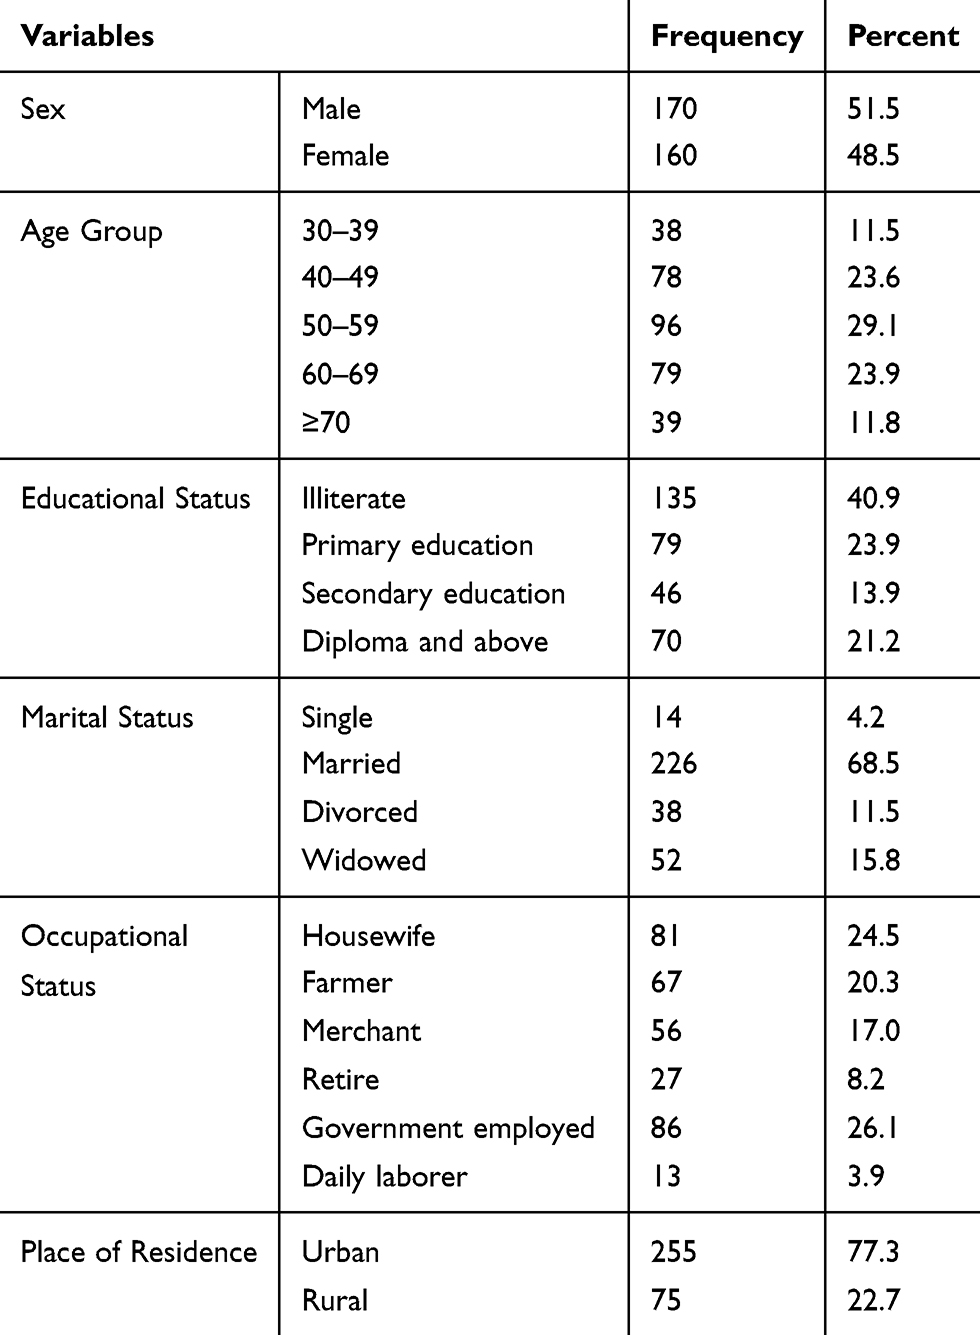 |
Table 1 Socio-Demographic Information of T2DM Patients, Dessie Referral Hospital, Northeast Ethiopia, 2017 (n = 330) |
Physical and Biochemical Measurements and Magnitude of MetS
Ninety-two (27.9%) study participants had a positive family history of chronic diseases. The mean length of treatment was 6.3 ±5.5 years. Two fifths (38.5%) and 54 (16.4%) of the study participants used anti-hypertensive and lipid-lowering treatment, respectively. From the total study participants, 87 (26.4%) were overweight, 37 (11.2%) were obese and 18 (5.5%) were underweight. Slightly above one-third (34.8%) and two-third (67.9%) of study participants had high WC and WHtR, respectively. Two-third (66.4%) of the study participants had high blood pressure. The median blood glucose level of the study participants was 131±76 mg/dl. Nearly half (48.5%) of the study participants had low HDL-C. Almost half (51.5%) of participants had high triglycerides. According to the revised ATP III definition; the magnitude of MetS was 59.4% (53.6% to 64.5%).
Optimal Cut-off Points of Each Obesity Indices in Identifying MetS
The ROC curve showed that WHtR was the best predictor of MetS (AUC=0.79) for both sexes analyzed together (Figure 1).
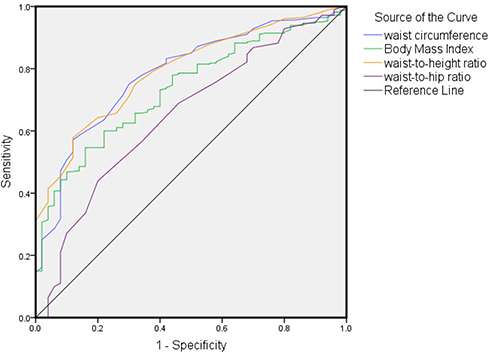 |
Figure 1 Receiver operator characteristic curve of obesity indices in identifying Metabolic Syndrome among T2DM patients, Dessie Referral Hospital, North east Ethiopia, 2017. |
For males, WC was the best predictor (AUC of 0.75) (Figure 2).
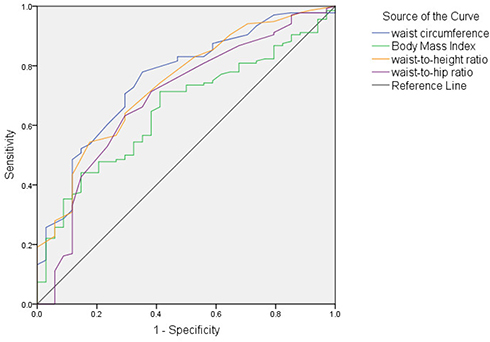 |
Figure 2 Receiver operator characteristic curve of obesity indices in identifying Metabolic Syndrome among male T2DM patients, Dessie Referral Hospital, North east Ethiopia, 2017. |
For females, WHtR (AUC =0.85) was the best predictor of MetS (Figure 3).
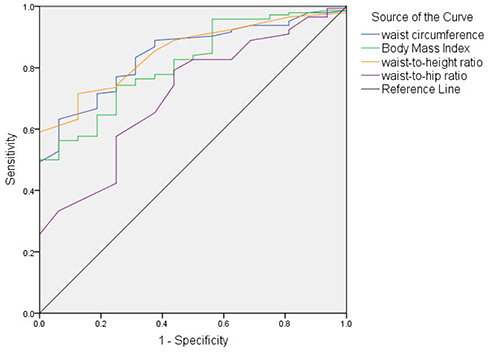 |
Figure 3 Receiver operator characteristic curve of obesity indices in identifying Metabolic Syndrome among female T2DM patients, Dessie Referral Hospital, North east Ethiopia, 2017. |
The optimal cut-off point of WC was 83 cm for males and 82 cm for females. The optimal cut-off point of BMI was 23.2 kg/m2 for both sexes. The optimal cut-off point of WHtR was 0.5 for males and 0.54 for females. WHR of 0.91 was the optimal cut-off for both sexes (Table 2).
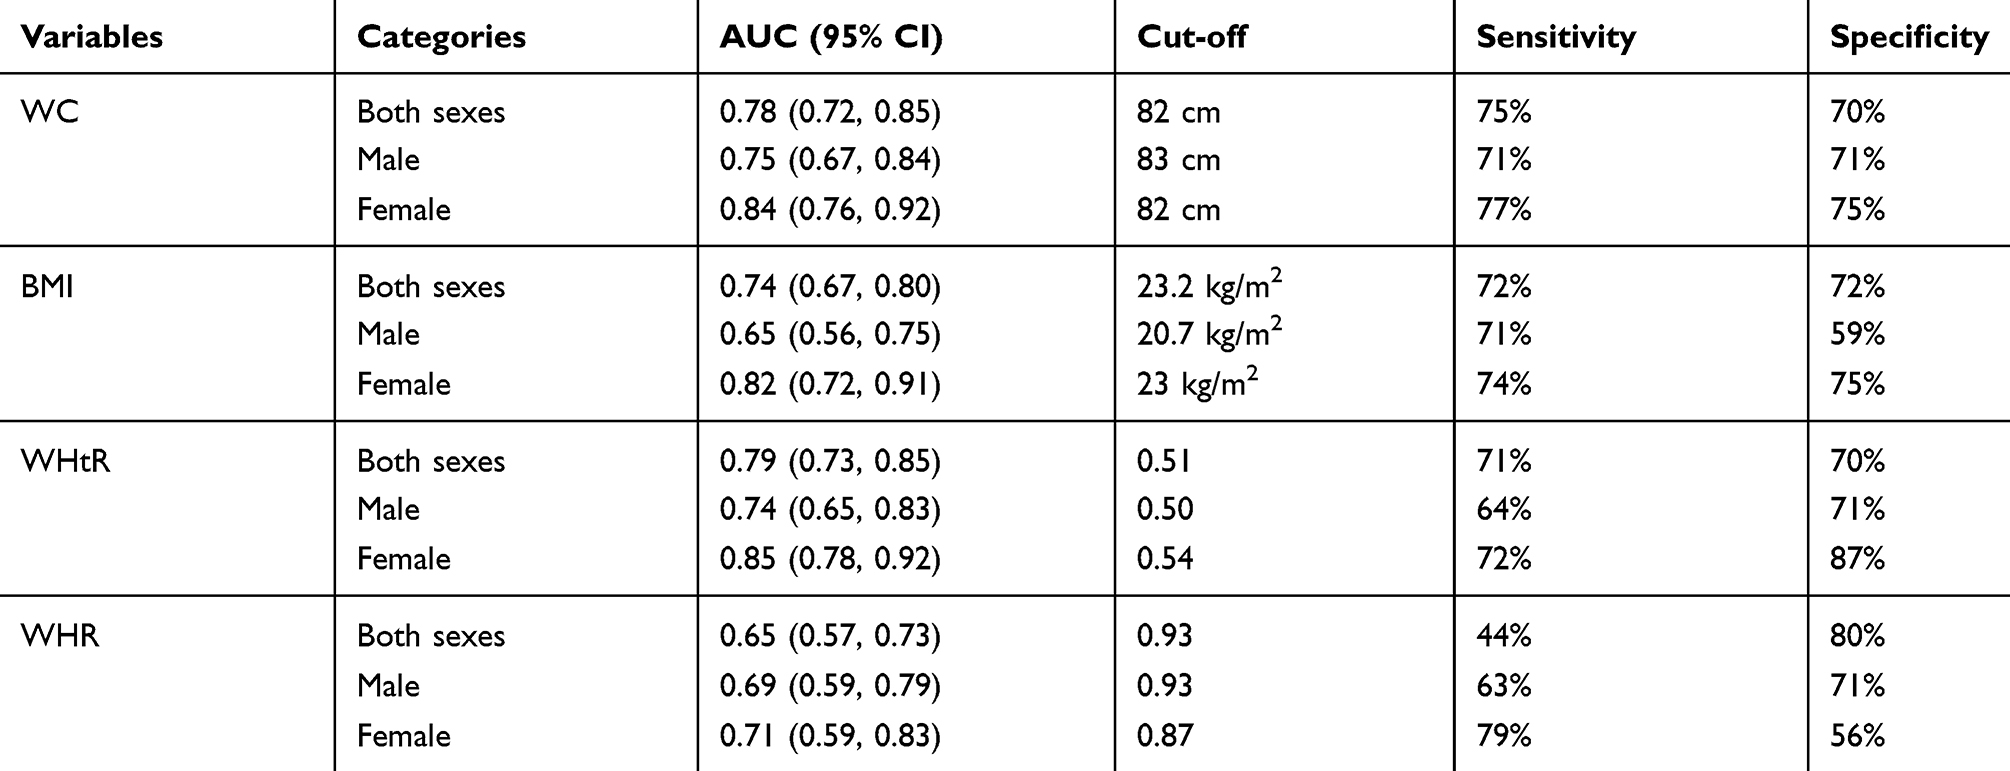 |
Table 2 Area Under the Curve and Optimal Cut-off Points of Each Obesity Indices in Identifying MetS Among T2DM Patients, Dessie Referral Hospital, Northeast Ethiopia, 2017 (n = 330) |
Discussion
This study was designed to assess obesity indices in identifying MetS for the effective prevention and management of MetS among T2DM patients. WHtR was found to be the best index for the entire study participants (AUC = 0.79) and females (AUC = 0.85), and WC was the best index for men (AUC = 0.75). Similarly, a study done among Jordanian adults showed that WC for males, and WHtR for females were the best predictor for MetS.26 It was also in line with a study done in Haryana, India which stated that WHtR was the best predictor of MetS irrespective of their sex, whereas WC was the best predictor for males and females.24 However, studies done in Japan, Xinjiang (China) and Nigeria stated that WHtR was the best predictor for males and females.13,14,18 This showed that controversy existed between WHtR and WC which might be due to differences in methods of data collection, population characteristics and differences with the position used to measure WC. Nonetheless, it can be established that WHtR and WC were superior to BMI and WHR in predicting MetS which might be due to the limited ability of BMI in distinguishing excess adipose tissue from high muscle mass and the less sensitivity of WHR to the weight change.
The optimal cut-off point of WC was 82 cm for females and 83 cm for males. The results were close to the findings reported from Nigeria where four cross-sectional studies revealed that the optimal cut-off points were 83 cm for females and 85 cm for males. And also it was consistent with a study done among Chinese adults (80 cm for women and 84 cm for men) and females cut point in Haryana (83 cm).18,24,27 The cut-off point for women was found to be within the range of the IDF recommendation (≥80 cm). But for men, it was out of the range of the IDF recommendation (≥94 cm). The discrepancy might result in a 38% sensitivity improvement in men when the optimal cut point from the current study is used. Similarly, the result of the current study showed that the optimal cut-point (83 cm for women and 85 cm for men) was found to be below ATP III recommendations cut-off (88 cm for women and 102 cm for men). A cut point of 102 cm for men was highly specific (97%) but it increases the false-negative rates in which it correctly classifies as diseased only 15% of patients with the disease. Similarly, the 88 cm cut point for women had high specificity (94%) but its sensitivity reduced to 56%. Furthermore, the current optimal cut-offs were lower compared to studies done in north Iran (91 cm in women and 90 cm in men), Jordan (95.6 cm women and 97.8 cm for men), and Kenya (85.5 cm for women and 93.5 cm for men).20,28,29 This implies that the adoption of the European cut point may not be appropriate for this community.
This study revealed 0.5 and 0.54 were the optimal cut-off points for WHtR for males and females, respectively, in agreement with the study conducted in Cape Town (South Africa) where 0.5 cut-off point was appropriate for men and 0.59 for women.30 This result was further supported by other study findings where the cut-off point for women was larger than men (0.59 versus 0.5, 0.58 versus 0.53, and 0.53 versus 0.51).15,28,30 While studies from Jordan and Singapore indicated that the optimal cut-off point was similar in both sex 0.61 and 0.5, respectively.29,31
The optimal BMI cut-off point for the entire study participants was found to be 23.2 kg/m2 with sensitivity and specificity of 72%. Similarly, 23 kg/m2 for females and 20.7 kg/m2 for males were found to be the optimal BMI cut-off point in this study. The usual cut point of 25 kg/m2 increased the false-negative rates to 47% or reduced sensitivity from 72% to 53% for total study participants. When stratified with sex, a cut-off point of 25 kg/m2 had a sensitivity of 34% and specificity of 91% for males and sensitivity of 51% and specificity of 94% for females. This is in line with studies from Ayder comprehensive hospital (22kg/m2), Singapore (>23 kg/m2), China (>23.3 kg/m2 for women), Haryana (>23 kg/m2), and the cut-off point of Asian population (>23kg/m2).15,24,31 But it was lower when compared to studies from Cape Town (24.1 kg/m2 for men and 32.1 kg/m2 for women), Northern Iran (26 kg/m2 for men and 29.0kg/m2 for women), and Jordan (28.4 kg/m2 for men and 30.3 kg/m2 for women).28–30 So, like the Asian population lower cut-off points for BMI may be suggested for T2DM patients.
The optimal cut-off point of WHR was 0.93 for the entire study participants and males and 0.87 for females. The cut-off point of women was comparable with WHO recommendation (0.8), a study in Cape Town (0.85), Jordan (0.84) and with the results from a review of various studies (0.86).28–30 But in the case of men, a high discrepancy with the WHO recommendation (1.0) was found. The use of 0.93 as an optimal cut-off point for men has better sensitivity (63%) than the WHO recommendation of 1.0 (16%) in which WHO recommendation would result in truly identifying only 16% of male patients with MetS. Similarly, results from Cape Town, Jordanian, and North Indian studies indicated that the cut-off point varies between 0.89 and 0.9 which was lower than the WHO recommendation.28–30 This showed that a cut point of 1.0 may misclassify diseased patients as free of diseases.
The use of its own (ROC curve) sample size estimation formula could be considered as the strength of the study. Among the limitation worth mentioning, data from the questionnaire may be subjected to recall bias so it may induce some degree of inaccuracy in the reporting of family history of chronic diseases.
In conclusion, WHtR is better in identifying MetS for entire study participants irrespective of gender. WHtR was the best predictor of metabolic syndrome for women. And WC was found to be the best in identifying MetS in men. Therefore, the introduction of appropriate indices optimal cut-off point should be included to diagnose MetS among T2DM. And also, further research is required on the predictive ability of these indices with their respective cut-point in the general community.
Abbreviations
ATP III, Adult Treatment Panel III; AUC, Area Under the Curve; BMI, Body Mass Index; FBG, Fasting Blood Glucose; HC, Hip Circumference; HDL, High-Density Lipoprotein; HTN, Hypertension; IDF, International Diabetes Federation; MetS, Metabolic Syndrome; ROC, Receiver Operator Characteristics; T2DM, Type 2 Diabetes Mellitus; TG, Triglyceride; WC, Waist Circumference; WHO, World Health Organization; WHR, Waist-to-Hip Ratio; WHtR, Waist-to-Height Ratio.
Data Sharing Statement
All the required data has been included in the manuscript.
Consent for Publication
Consent for publication is secured from study participants.
Acknowledgment
The authors would like to thank Wollo University and Mekelle University for their support in undertaking this research. The authors were also indebted to Dessie Referral Hospital for giving them relevant information and for its cooperation. Last but not least the authors' acknowledgment extends to the study participants, data collectors and a supervisor for their cooperation.
Author Contributions
All authors contributed to data analysis, drafting and revising the article, gave final approval of the version to be published, and agreed to be accountable for all aspects of the work.
Funding
This research was sponsored by Wollo University.
Disclosure
The authors report no conflicts of interest in this work.
References
1. Alberti K, Eckel RH, Grundy SM, et al. Harmonizing the metabolic syndrome a joint interim statement of the international diabetes federation task force on epidemiology and prevention; national heart, lung, and blood institute; American heart association; world heart federation; international atherosclerosis society; and international association for the study of obesity. Circulation. 2009;120(16):1640–1645. doi:10.1161/CIRCULATIONAHA.109.192644
2. Cameron AJ, Shaw JE, Zimmet PZ. The metabolic syndrome: prevalence in worldwide populations. Endocrinol Metab Clin North Am. 2004;33(2):351–375. doi:10.1016/j.ecl.2004.03.005
3. Yadav D, Mahajan S, Subramanian SK, Bisen PS, Chung CH, Prasad G. Prevalence of metabolic syndrome in type 2 diabetes mellitus using NCEP-ATPIII, IDF and WHO definition and its agreement in Gwalior Chambal region of Central India. Glob J Health Sci. 2013;5(6):142. doi:10.5539/gjhs.v5n6p142
4. Abda E, Hamza L, Tessema F, Cheneke W. Metabolic syndrome and associated factors among outpatients of Jimma University Teaching hospital. Diabetes Metab Syndr Obes. 2016;9:47.
5. Wai WS, Dhami RS, Gelaye B, et al. Comparison of measures of adiposity in identifying cardiovascular disease risk among Ethiopian adults. Obesity. 2012;20(9):1887–1895. doi:10.1038/oby.2011.103
6. Misra A, Singhal N, Khurana L. Obesity, the metabolic syndrome, and type 2 diabetes in developing countries: role of dietary fats and oils. J Am Coll Nutr. 2010;29(sup3):289S–301S. doi:10.1080/07315724.2010.10719844
7. Dunstan D, Salmon J, Owen N, et al. Associations of TV viewing and physical activity with the metabolic syndrome in Australian adults. Diabetologia. 2005;48(11):2254–2261. doi:10.1007/s00125-005-1963-4
8. Woo HD, Shin A, Kim J, Gupta V. Dietary patterns of Korean adults and the prevalence of metabolic syndrome: a cross-sectional study. PLoS One. 2014;9(11):e111593. doi:10.1371/journal.pone.0111593
9. Eckel RH, Grundy SM, Zimmet PZ. The metabolic syndrome. Lancet. 2005;365(9468):1415–1428. doi:10.1016/S0140-6736(05)66378-7
10. Kaur J. Assessment and screening of the risk factors in metabolic syndrome. Med Sci. 2014;2(3):140–152. doi:10.3390/medsci2030140
11. RezaDerakhshan D, Asghar K. Evaluation of abdominal obesity prevalence in diabetic patients and relationships with metabolic syndrome factors. Int J Endocrinol Metab. 2010;2010(3, Summer):143–146.
12. Ashwell M, Gunn P, Gibson S. Waist‐to‐height ratio is a better screening tool than waist circumference and BMI for adult cardiometabolic risk factors: systematic review and meta‐analysis. Obes Rev. 2012;13(3):275–286. doi:10.1111/j.1467-789X.2011.00952.x
13. Hori A, Nanri A, Sakamoto N, et al. Comparison of body mass index, waist circumference, and waist-to-height ratio for predicting the clustering of cardiometabolic risk factors by age in Japanese workers. Circ J. 2014;78(5):1160–1168. doi:10.1253/circj.CJ-13-1067
14. Zhang X-H, Zhang M, He J, et al. Comparison of anthropometric and atherogenic indices as screening tools of metabolic syndrome in the Kazakh adult population in Xinjiang. Int J Environ Res Public Health. 2016;13(4):428. doi:10.3390/ijerph13040428
15. Liu Y, Tong G, Tong W, Lu L, Qin X. Can body mass index, waist circumference, waist-hip ratio and waist-height ratio predict the presence of multiple metabolic risk factors in Chinese subjects? BMC Public Health. 2011;11(1):1. doi:10.1186/1471-2458-11-35
16. Organization WH. Obesity: Preventing and Managing the Global Epidemic. World Health Organization; 2000.
17. Consultation WE. Waist Circumference and Waist-Hip Ratio. Report of a WHO Expert Consultation Geneva. World Health Organization; 2008:8–11.
18. Oguoma VM, Nwose EU, Ulasi II, et al. Maximum accuracy obesity indices for screening metabolic syndrome in Nigeria: a consolidated analysis of four cross-sectional studies. Diabetes Metab Syndr. 2016;10(3):121–127. doi:10.1016/j.dsx.2016.01.001
19. Hajian-Tilaki K. Sample size estimation in diagnostic test studies of biomedical informatics. J Biomed Inform. 2014;48:193–204. doi:10.1016/j.jbi.2014.02.013
20. Omuse G, Maina D, Hoffman M, et al. Metabolic syndrome and its predictors in an urban population in Kenya: a cross sectional study. BMC Endocr Disord. 2017;17(1):37. doi:10.1186/s12902-017-0188-0
21. Organization WH. WHO STEPS Surveillance Manual: The WHO STEPwise Approach to Chronic Disease Risk Factor Surveillance; 2005.
22. Yahia N, Brown C, Rapley M, Chung M. Assessment of college students’ awareness and knowledge about conditions relevant to metabolic syndrome. Diabetol Metab Syndr. 2014;6(1):111. doi:10.1186/1758-5996-6-111
23. Grundy Ea SM. Third report of the National Cholesterol Education Program (NCEP) expert panel on the detection, evaluation and treatment of high blood cholesterol in adults (Adult treatment pannel III) final report. 2002.
24. Rajput R, Rajput M, Bairwa M, Singh J, Saini O, Shankar V. Waist height ratio: a universal screening tool for prediction of metabolic syndrome in urban and rural population of Haryana. Indian J Endocrinol Metab. 2014;18(3):394. doi:10.4103/2230-8210.131201
25. Shiwaku K, Anuurad E, Enkhmaa B, et al. Predictive values of anthropometric measurements for multiple metabolic disorders in Asian populations. Diabetes Res Clin Pract. 2005;69(1):52–62. doi:10.1016/j.diabres.2004.11.001
26. Obeidat AA, Ahmad MN, Haddad FH, Azzeh FS. Evaluation of several anthropometric indices of obesity as predictors of metabolic syndrome in Jordanian adults. Nutr Hosp. 2015;32(2):667–677.
27. He Y-H, Chen Y-C, Jiang G-X, et al. Evaluation of anthropometric indices for metabolic syndrome in Chinese adults aged 40 years and over. Eur J Nutr. 2012;51(1):81–87. doi:10.1007/s00394-011-0195-2
28. Motamed N, Sohrabi M, Poustchi H, et al. The six obesity indices, which one is more compatible with metabolic syndrome? A population based study. Diabetes Metab Syndr. 2017;11(3):173–177.
29. Al-Odat AZ, Ahmad MN, Haddad FH. References of anthropometric indices of central obesity and metabolic syndrome in Jordanian men and women. Diabetes Metab Syndr. 2012;6(1):15–21. doi:10.1016/j.dsx.2012.05.012
30. Peer N, Steyn K, Levitt N. Differential obesity indices identify the metabolic syndrome in Black men and women in Cape Town: the CRIBSA study. J Public Health. 2015;38(1):175–182.
31. Lam BCC, Koh GCH, Chen C, Wong MTK, Fallows SJ. Comparison of body mass index (BMI), body adiposity index (BAI), waist circumference (WC), waist-to-hip ratio (WHR) and waist-to-height ratio (WHtR) as predictors of cardiovascular disease risk factors in an adult population in Singapore. PLoS One. 2015;10(4):e0122985. doi:10.1371/journal.pone.0122985
 © 2020 The Author(s). This work is published and licensed by Dove Medical Press Limited. The
full terms of this license are available at https://www.dovepress.com/terms
and incorporate the Creative Commons Attribution
- Non Commercial (unported, 3.0) License.
By accessing the work you hereby accept the Terms. Non-commercial uses of the work are permitted
without any further permission from Dove Medical Press Limited, provided the work is properly
attributed. For permission for commercial use of this work, please see paragraphs 4.2 and 5 of our Terms.
© 2020 The Author(s). This work is published and licensed by Dove Medical Press Limited. The
full terms of this license are available at https://www.dovepress.com/terms
and incorporate the Creative Commons Attribution
- Non Commercial (unported, 3.0) License.
By accessing the work you hereby accept the Terms. Non-commercial uses of the work are permitted
without any further permission from Dove Medical Press Limited, provided the work is properly
attributed. For permission for commercial use of this work, please see paragraphs 4.2 and 5 of our Terms.