Back to Journals » Cancer Management and Research » Volume 12
Obesity and Waist Circumference are Possible Risk Factors for Thyroid Cancer: Correlation with Different Ultrasonography Criteria
Authors Eissa MS ![]() , Abdellateif MS
, Abdellateif MS ![]() , Elesawy YF, Shaarawy S, Al-Jarhi UM
, Elesawy YF, Shaarawy S, Al-Jarhi UM ![]()
Received 31 March 2020
Accepted for publication 30 June 2020
Published 21 July 2020 Volume 2020:12 Pages 6077—6089
DOI https://doi.org/10.2147/CMAR.S256268
Checked for plagiarism Yes
Review by Single anonymous peer review
Peer reviewer comments 2
Editor who approved publication: Dr Eileen O'Reilly
Marwa S Eissa,1 Mona S Abdellateif,2 Yasmine F Elesawy,3 Sabry Shaarawy,2 Ula M Al-Jarhi1
1Internal Medicine and Endocrinology Department, Faculty of Medicine, Cairo University, Cairo, Egypt; 2Medical Biochemistry and Molecular Biology, Cancer Biology Department, National Cancer Institute, Cairo University, Cairo, Egypt; 3Pathology Department, Faculty of Medicine, Cairo University, Cairo, Egypt
Correspondence: Mona S Abdellateif Email [email protected]
Background: Obesity has an important role in the pathogenesis of cancer; however, there are no clear mechanisms explaining the association between obesity and risk of thyroid cancer (TC).
Methods: It is a cross-sectional study including 184 patients with benign thyroid nodules (BN) and 19 patients with TC. Body mass index (BMI), waist circumference (WC), hip circumference (HC), waist/hip (W/H) ratio were assessed and correlated to relevant clinico-pathological features of the patients, different ultra-sonographic (U/S) criteria and risk of malignancy.
Results: There was a significant increase in BMI, WC and W/H ratio in TC patients compared to BN group (P=0.001, 0.011 and 0.003). Increased BMI, WC and HC were associated significantly with solid nodules (P< 0.05). WC increased in hypoechoic (103.1± 15.4cm) and heterogeneous (103.8± 16.7cm) nodules, compared to isoechoic (97.3± 15.5cm) and hyperechoic (96.1± 10cm) nodules (P=0.046). It also increased with lymph nodes enlargement (P=0.04). There was a significant association between WC and TIRADS classification (P=0.032), as it increased with TR4b (118.5 ± 12.9 cm) and TR5 (117.3 ± 13.9 cm) compared to TR2 (114.1 ± 15.7 cm, P=0.025 and 0.008, respectively). WC is an independent predictor for TC [OR: 1.092, CI: 1.020– 1.170, P=0.012]. It achieved sensitivity, specificity and AUC (71.4%, 68.7% and 0.750; respectively), at a cutoff value of 108.5 cm (P=0.003), and when combined with BMI at a cutoff value of 32.59 (77.8% and 68.4%, respectively, AUC: 0.780, P< 0.001).
Conclusion: Central adiposity is strongly associated with the risk of TC. WC is more superior to BMI when correlated with TIRADS classification and also is an independent predictor for TC.
Keywords: thyroid nodules, BMI, WC, obesity, ultrasonography
Introduction
Thyroid cancer (TC) is the most common malignant endocrine tumor worldwide. It ranks the ninth position in tumor incidence, and it accounts for about 5.1% of the total estimated cancer burden in women in 2018.1 Thyroid cancer occurs most frequently in females, as it becomes the second most commonly diagnosed cancer in young women, and its incidence is 3 times higher than that in males.1,2 The past 3 decades have shown significant technological developments in the diagnosis of thyroid nodules and thyroid cancer.3 These methods included highly experienced ultrasound and fine-needle aspiration biopsies. Accordingly, thyroid cancer has shown the so-called epidemic, with increased public concern and patient pressure for asymptomatic screening. Over-diagnosis of thyroid cancer to include lesions that may carry absolutely no prognostic risks on morbidity and mortality is an ongoing problem facing endocrine physicians.4 Thus, seeking high-risk population for thyroid cancer is mandatory in order to limit unnecessary screening.5
It had been reported that obesity is a risk factor for many cancers including esophageal adenocarcinoma, colon cancer, renal cancer, and thyroid cancer.6–8 A 5 kg/m2 increase in body mass index (BMI) is associated significantly with increased incidence of papillary thyroid cancer (PTC).9 In addition, several studies have already documented the association between obesity and occurrence of thyroid nodules, whether BMI denoting general adiposity, or waist circumference denoting central obesity and metabolic syndrome; all are linked to thyroid nodules.10,11 The hypothesis that adipose tissue is involved in carcinogenesis is now called “adiponcosis”.12 However, till now there is no clear mechanism postulated to explain the association between obesity and incidence of TC. It has been hypothesized that low-grade chronic inflammation, deregulation of growth signaling pathways, chronic hyperinsulinemia, estrogen and obesity-associated hypoxia, may be potential mediators for cancer pathogenesis.13,14
Therefore, we sought to investigate the association between obesity and risk of malignancy in thyroid nodules, through assessment of BMI, WC, HC and W/H ratio in patients with benign thyroid nodules compared to malignant thyroid cancer patients. Data were correlated to relevant clinic-pathological features of the patients. In addition, we investigate the impact of these anthropometric measurements on different sonographic criteria of patients’ thyroid nodules.
Patients and Methods
This is a cross-sectional study including 203 patients with thyroid nodules, who attended the ultrasound unit of Endocrinology outpatient clinic in Kasr Alainy Hospital, Cairo University during the period between 2016 and 2019. Patients were excluded from the study if they were pregnant or had a previous history of bariatric surgery. All patients were subjected to full clinical history taking including family or past history of thyroid nodules. Full examination of the thyroid gland and draining lymph nodes was done. Serological examination including serum-free T3, free T4, TSH, thyroglobulin, complete blood picture, kidney function tests, Random blood sugar and liver enzymes was assessed.
Anthropometric Measurements
Weight was measured using a mechanical platform scale with a maximum capacity of 300 kg and a precision level of 100 g. Height was measured using a stadiometer coupled to the mechanical scale, with a precision level of 0.1 cm. Body mass index (BMI) was calculated by dividing the body weight in kilograms by the square of the patient’s height in meters.15 Waist-hip ratio was measured by dividing waist circumference in centimeter by hip circumference in centimeter.
Thyroid Ultrasound
All participants underwent a thorough thyroid ultrasound examination, with conventional B-mode scanning, and Color Doppler analysis of the blood flow to the thyroid nodules. It was assessed by experienced two endocrinology specialists, using high-resolution sonographic instruments equipped with 7 to 9 MHz linear probes.
Ultrasonographic criteria included number of nodules, size (3 dimensions of the nodules width, tall and depth were measured then the volume estimated by multiplying the previous 3 dimensions), site, echogenicity (hypoechoic, hyperechoic, isoechoic or heterogeneous), consistency (solid, cystic or complex nodules), breakdown (divided according to the site in the affected nodules into central breakdown, peripheral breakdown, both, or no breakdown), vascularity of the nodules (divided into nodules with increased vascularity or decreased vascularity, or according to the site of increased vascularity into central vascularity, peripheral or both), halo (complete, incomplete or interrupted halo), calcifications either microcalcifications or macro-calcifications (scattered, eggshell or stellate). Patients with suspicious ultra-sonographic features of TC were eligible for FNAC according to the American thyroid association (ATA) 2015.16 Signs of increased risk of malignancy by U/S include Hypo-echogenicity, Micro- or interrupted rim calcifications, Irregular Margins, Absence of Halo or incomplete halo, Increased Intra-nodular blood flow, Increase AP/T diameter, Significant increase in size over time, Invasion of anterior strap muscles, and Presence of abnormal cervical lymphadenopathy (Figures 1 and 2).
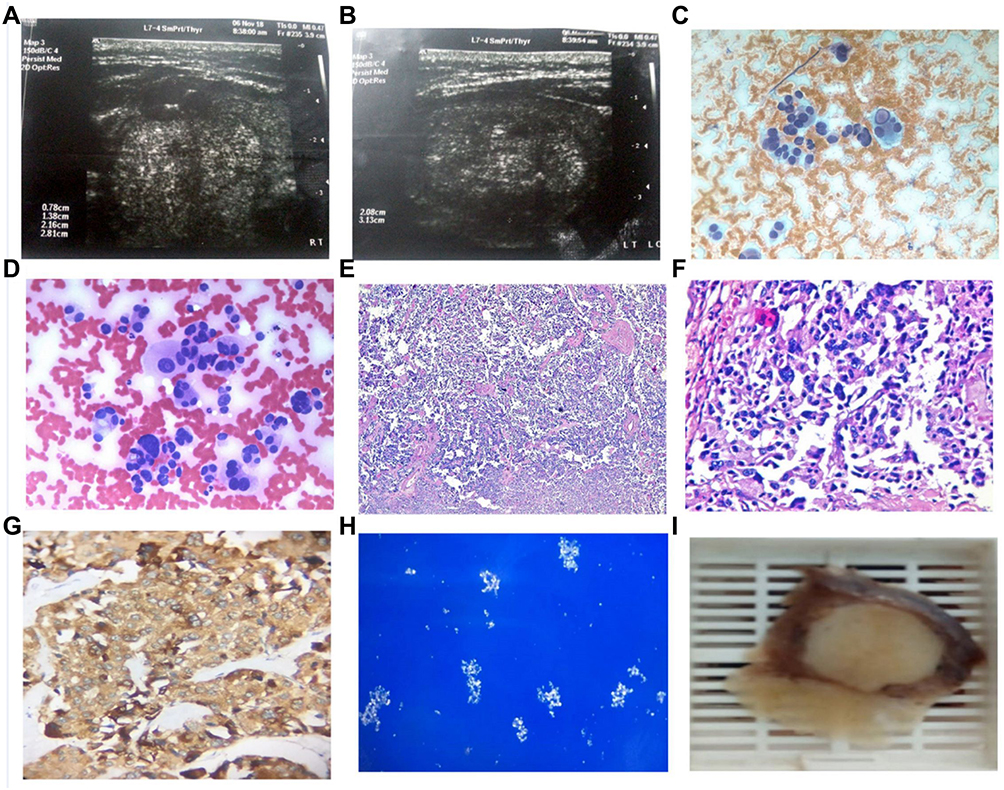 |
Figure 1 A 56 years old female with medullary thyroid cancer, not diabetic or hypertensive has a positive family history of thyroid disease. She was euthyroid with multinodular goiter. Weight=119kg, Height=159cm, body mass index (BMI): 47, waist circumference (WC): 141cm, and hip circumference (HC): 137cm. (A&B) Ultrasonography showed the largest nodule was 2.08cm X 3.12cm X 2.5cm, isoechoic, with both micro/macro calcifications, interrupted halo, irregular outlines and increased peripheral vascularity. Cytopathology with (C) Papanicolaou and (D) Hematoxylin and eosin (H&E) stains showed dispersed cells with abundant dense cytoplasm and eccentric nuclei. Evident pseudonuclear inclusion, multinucleation and bizarre forms were detected, 400x original power. Histopathology (E) H&E stain, 40x and (F) H&E stain, 200x original powers, showed Round, polygonal and bizarre cells arranged in nests or in single loose patterns, with detected eosinophilic dense amyloid material. (G) Immunohistochemistry showed positive brown pigmentation of the cytoplasm of malignant cells (Chromogranin immune marker, 200x original power). (H) Congo red stain with polarized light showed apple-green birefringence of amyloid, 100x original power. (I) Gross pathology showed a suspicious white-defined nodule was detected with rubbery cut section. |
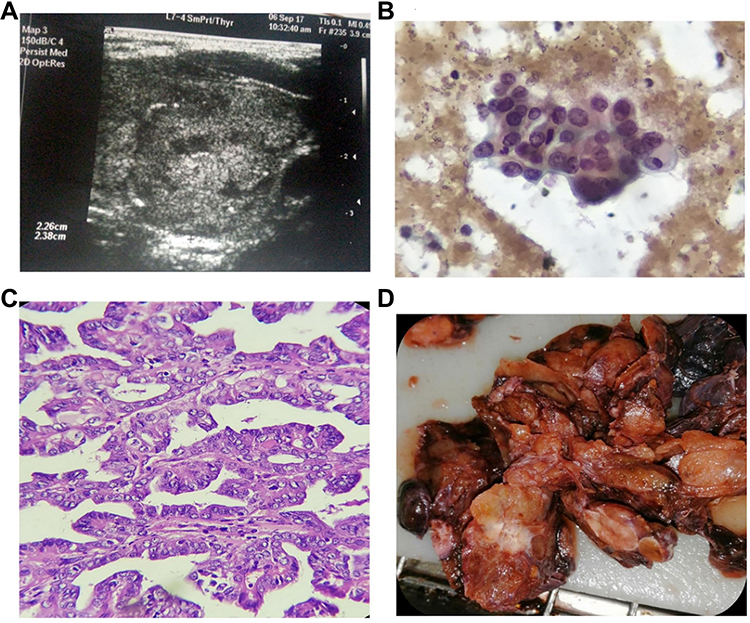 |
Figure 2 A 32 years old female with papillary thyroid cancer (PTC), she was not diabetic or hypertensive, with negative family history for thyroid disease. She was euthyroid, Weight: 98 kg, Height: 164 cm, body mass index (BMI): 36.4, waist circumference (WC): 104 cm. (A) Ultrasonography showed the left thyroid nodule was 2.26 x 2.38 x 2.00 cm. The nodule was complex and isoechoic with eggshell calcifications, marked increase central/peripheral vascularity, incomplete halo, as well as irregular outline. (B) Cytopathology showed follicular cells with abundant cytoplasm, enlarged nuclei with vesicular chromatin, conspicuous eccentric nucleoli, focal nuclear overlapping and grooving (Pap stain, 400x original power). (C) Histopathology showed Papillae of malignant follicular cells with fibrovascular cores. The cells showed optically clear enlarged nuclei with overlapping and grooving (Hematoxylin and eosin stain, 100x original power). (D) Gross pathology showed a suspicious white firm thyroid nodule was detected grossly. |
Fine Needle Aspiration Biopsy (FNAC)
All cytology specimens were obtained under ultrasound guidance using a 21-gauge needle attached to a plastic syringe from 3 different sites of the targeted nodule. In case of cystic/complex nodule, aspirate of the cyst was first centrifuged in the cytopathology unit. The aspirated samples were immediately thin evenly smeared, wet fixed in 95% ethyl alcohol for minimum 15 mins, and stained with modified Papanicolaou stain for routine cytological evaluation. The smears for each case were examined under the microscope and categorized according to Bethesda System for reporting thyroid cytology.17 Follow-up of cytologically atypical/suspicious cases was done, thyroid surgical excision specimens were received and histopathological diagnosis was performed according to protocols for histopathology reporting of thyroid cancer as issued by US College of American Pathologists (CAP), and the 8th Edition, American Joint Committee on Cancer (AJCC) Staging Manual.18
Statistical Analysis
Statistical analysis was performed using the statistical package SPSS (version 22; SPSS, Chicago, IL, USA). Data were presented as percentages for categorical variables and as mean and standard deviation for continuous variables. Correlations between categorical variables were assessed by the chi-square test or Fisher exact test, which appropriate. Differences in continuous variables were assessed by independent T-test and ANOVA. ROC (receiver operating characteristic) curve analysis was performed to measure the cut-off value for significant variables with respective sensitivities and specificities. Univariate and multivariate logistic regression analysis was used to identify independent risk factor for thyroid malignancy. In all cases, two-tailed P< 0.05 was considered significant.
Results
Patients’ characteristics: the current study included 184 patients with benign thyroid nodules (BN), and 19 patients with thyroid cancer (TC). The mean age of the TC patients is 43.3±11.9 years, and of the BN patients is 42.7±12.3 years (P=0.837). Females represented 100% (19/19) of TC group and 95.1% (175/204) of the BN patients (P=0.604). Positive family history was present in 68/184 (37.2%) of BN group, and in 10/19 (52.6%) of the TC patients (P=0.218). Diabetic patients represented 13% and 15.8% in BN and TC patients, respectively (P=0.724). Thyroid function was found to be euthyroid (90.2%), hypothyroid (8.7%) and hyperthyroid (1.1%) in BN group, similarly it was euthyroid (89.5%), hypothyroid (10.5%) and hyperthyroid (0.0%) in the TC patients (P=0.873). According to TIRADS classification, BN patients were classified into T2 (22.7%), T3 (8.3%), T4a (5.5%), T4b (42.5%) and T5 (21%). While TC patients were classified into T2 (5.3%), T3 (10.5%), T4a (0.0%), T4b (47.4%) and T5 (36.8%), the difference between the two groups was not significant (P=0.228, Table 1).
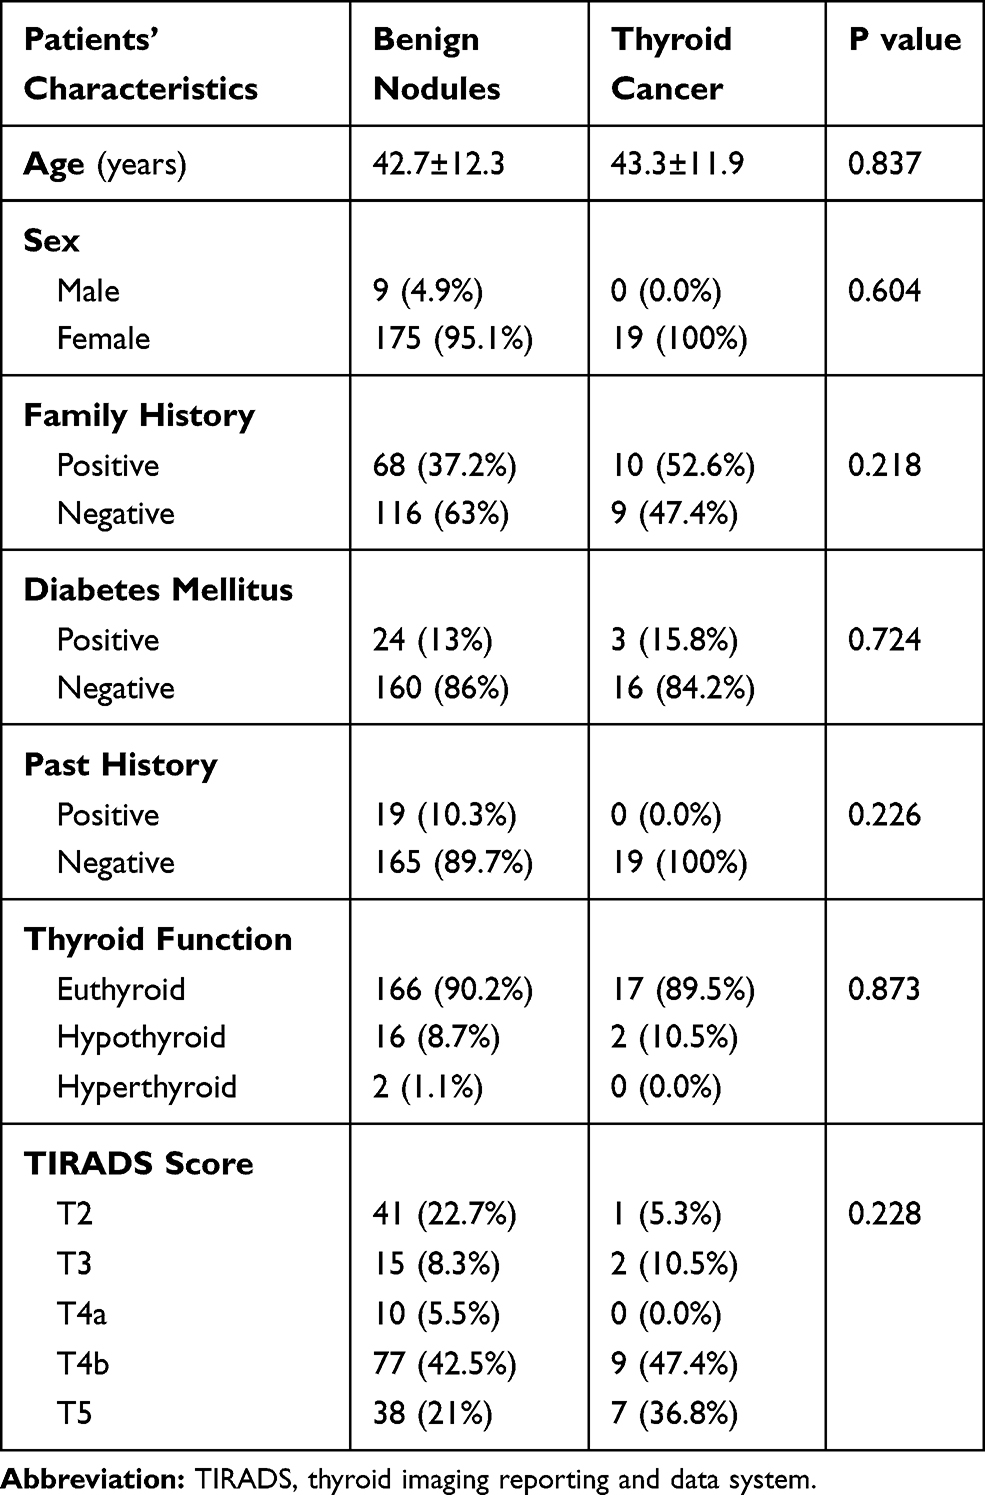 |
Table 1 Clinico-Pathological Features of the Assessed Patients |
Assessment of BMI, WC and HC in the Patients’ Groups
There was a significant increase in the mean of BMI in TC patients (36.2±6.4cm) compared to BN group (30.3±7.3cm, P=0.001). Waist circumference (WC) is also significantly increased in TC patients (111.7±20.6 cm), compared to BN patients (98.1±13.5 cm, P=0.011). On the other hand, there were no significant differences between the hip circumference (HP) in TC patients (121±13.8cm) and BN group (116.3±13.6cm, P= 0.22, Figure 3). Moreover, increased W/H ratio associated significantly with the incidence of TC, since out of 19 patients with TC, there were 13 (68.4%) patients with W/H<1 compared to 6 (31.6%) with W/H≥1. On the other hand, the W/H ratio in BN patients was lower than 1 in 176 (95.6%) patients compared to 8 (4.4%) with W/H≥1 (P=0.003, Table 2).
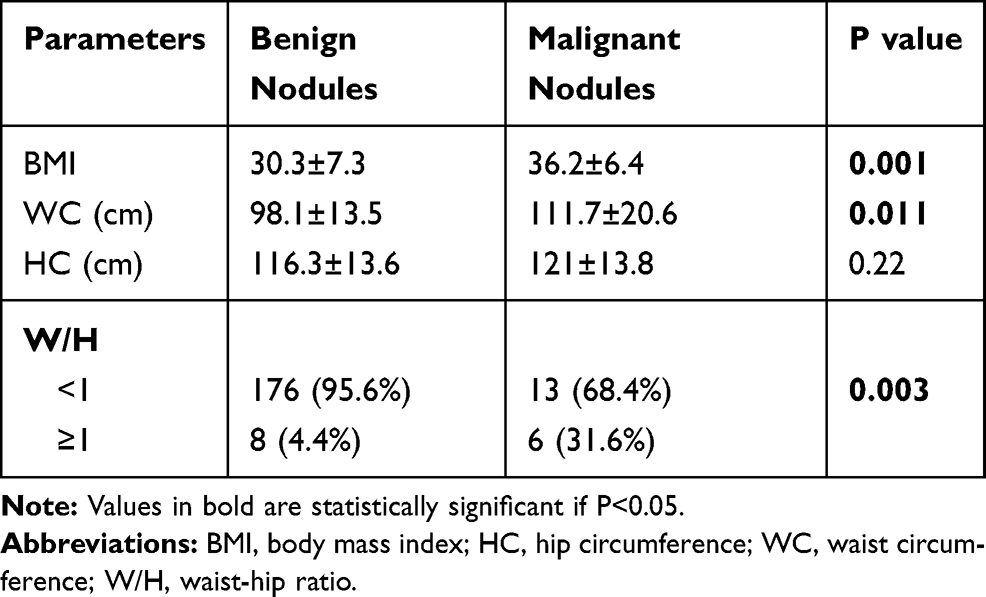 |
Table 2 Assessment of BMI, WC and HC in the Assessed Patients |
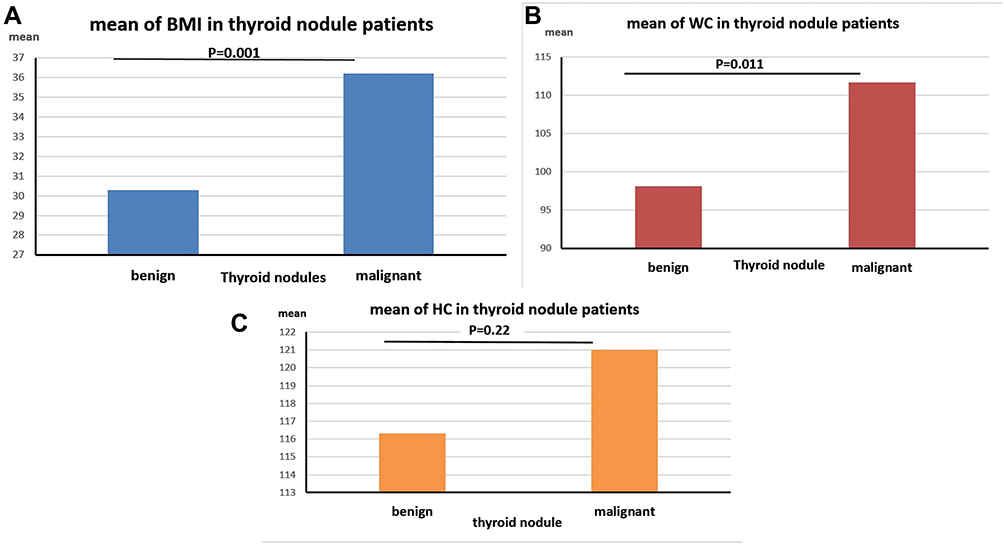 |
Figure 3 Assessment of (A) BMI: body mass index, (B) WC: waist circumference and (C) HC: hip circumference in benign and malignant thyroid cancer patients. |
Association Between BMI, WC, HC and U/S Criteria of the Patients
There was a significant association between the BMI and the consistency of the nodules (P=0.026), as it increased significantly in solid nodules (32.5±7.8), compared to complex nodules (29.7±7). BMI was also associated significantly with the breakdown of the nodules; it was 29.5±6.8 in the presence of the breakdown, and 32.6±7.8 in the absence of the breakdown (P=0.005). Concerning WC, it associated significantly with the echogenicity of the nodules, it increased in hypoechoic (103.1±15.4cm) and heterogeneous (103.8±16.7cm) nodules, compared to isoechoic (97.3±15.5cm) and hyperechoic (96.1±10cm) nodules (P=0.046). Similarly, WC associated significantly with the consistency of the nodules, it increased significantly in solid nodules (103.1±15.8 cm), compared to complex nodules (96.8±13.6 cm, P=0.009). There was a significant association between WC and the breakdown of the nodules; it was 96.1±13.3cm in the presence of the breakdown, compared to 103.5±15.7cm in the absence of the breakdown (P=0.001). WC is also increased in patients with LN affection (104 ±13.5cm), compared to those who did not have LN enlargement (98.4±14.7cm), with a significant difference between the two groups (P=0.04).
Regarding the association between HC and US criteria, there was a significant association between the HC and the consistency of the nodules, as it increased significantly in solid nodules (121±12.7 cm), compared to complex nodules (113.5±14 cm, P=0.012). HC was also associated significantly with the breakdown of the nodules; it was 113.2±13.6 cm in the presence of the breakdown, compared to 121±12.8 cm in the absence of the breakdown (P<0.001). Moreover, HC associated significantly with the presence of the vascularity of the nodules, it was 123.9±9.4 cm in decreased vascularity, compared to 115.5±14.1 cm with increased vascularity (P=0.004, Table 3, Figure 4A–E). There was no significant association found between W/H ratio and any of the assessed U/S criteria nor the clinico-pathological features of the patients (data not presented).
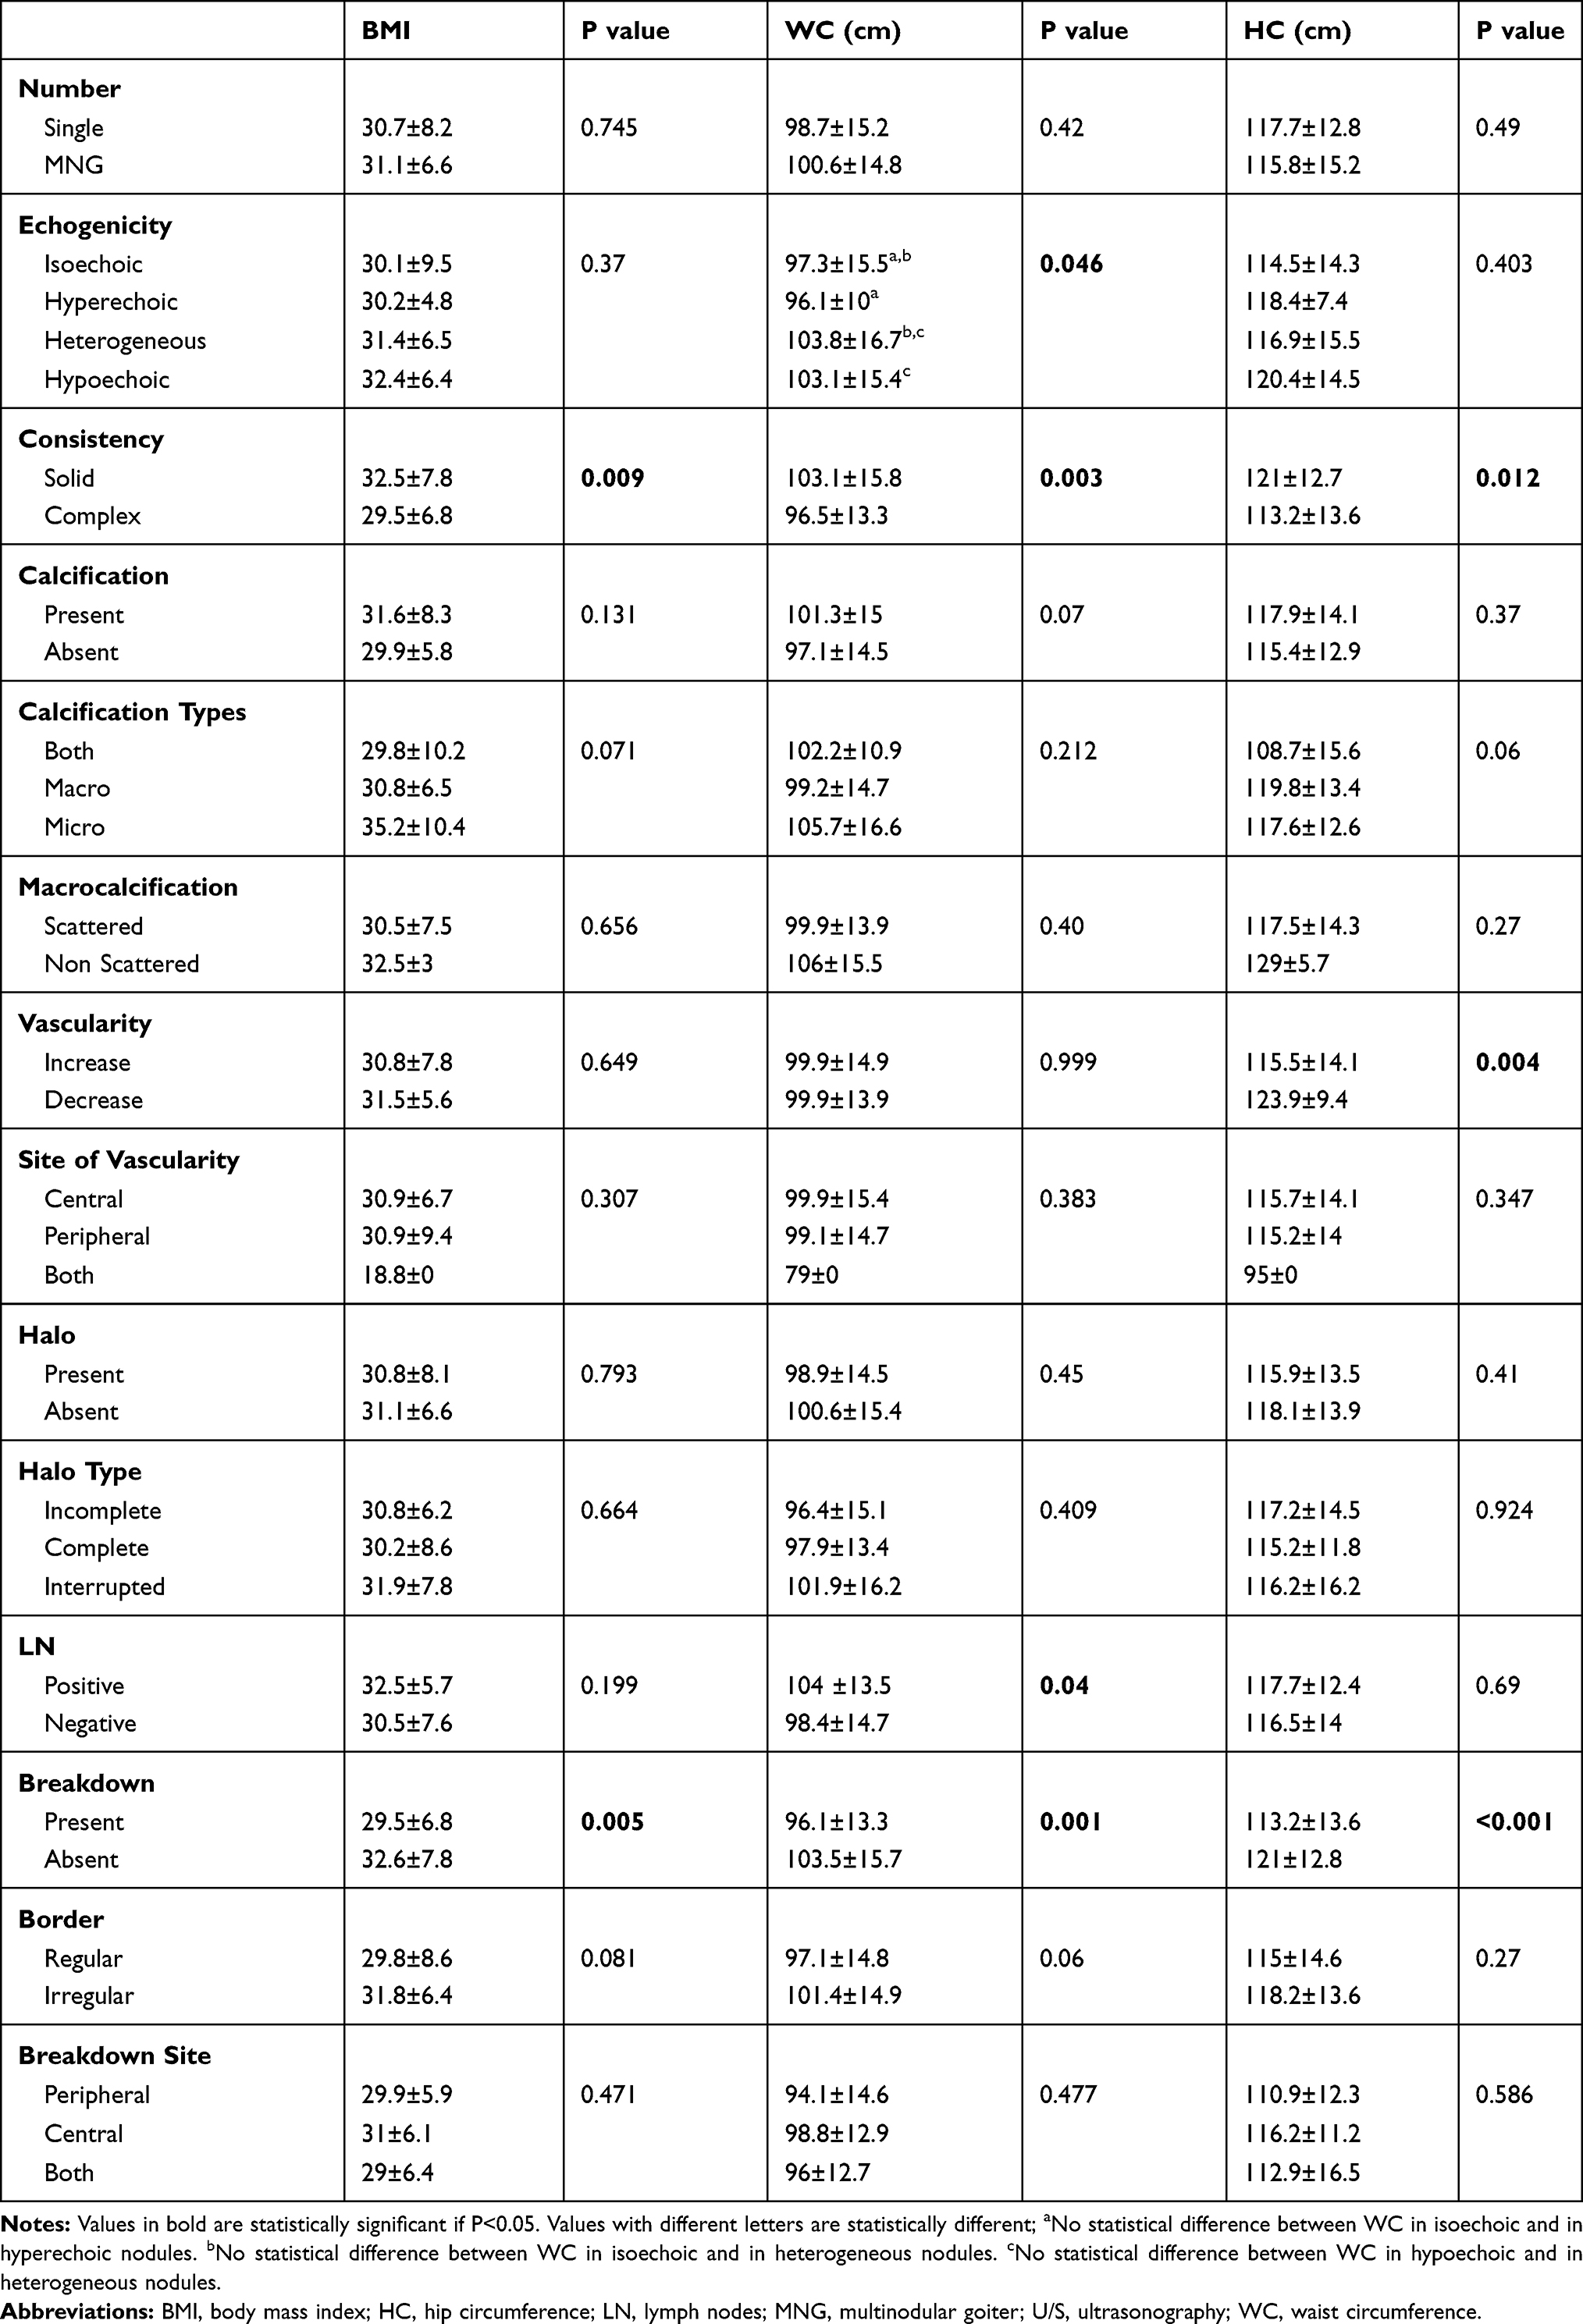 |
Table 3 Association Between BMI, WC, HC and U/S Criteria of the Patients’ Nodules |
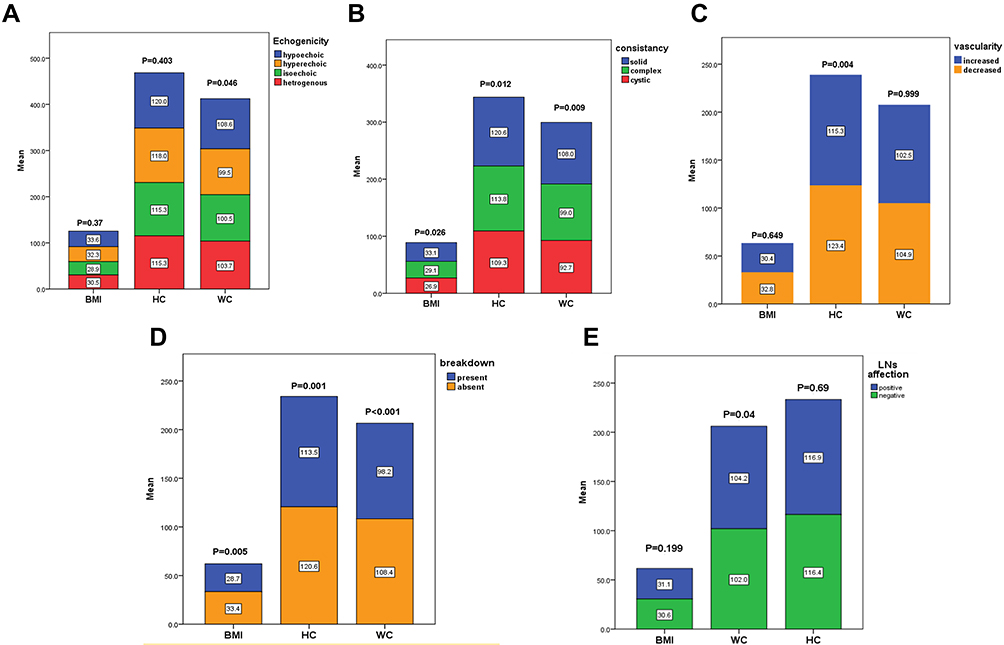 |
Figure 4 Association between BMI (body mass index), WC (waist circumference), HC (hip circumference) and U/S (Ultrasonography) criteria of the patients’ nodules regarding (A) echogenicity, (B) consistency, (C) vascularity, (D) breakdown, (E) Lymph nodes (LNs) affection. |
Association Between BMI, WC, HC and TIRADS Classification of the Patients
There was no significant association between TIRADS classification and BMI or HC of the patients (P=0.217 and 0.535; respectively). While WC associated significantly with TIRADS classification (P=0.032), as there was a significant increase in WC with TR4b (118.5 ± 12.9 cm) and TR5 (117.3 ± 13.9 cm) compared to TR2 (114.1 ± 15.7 cm, P=0.025 and 0.008; respectively). Also, there was a significant difference in WC between TR4a (108.8 ± 14.3 cm) and TR5 (117.3 ± 13.9 cm, P=0.047, Table 4, Figure 5A)
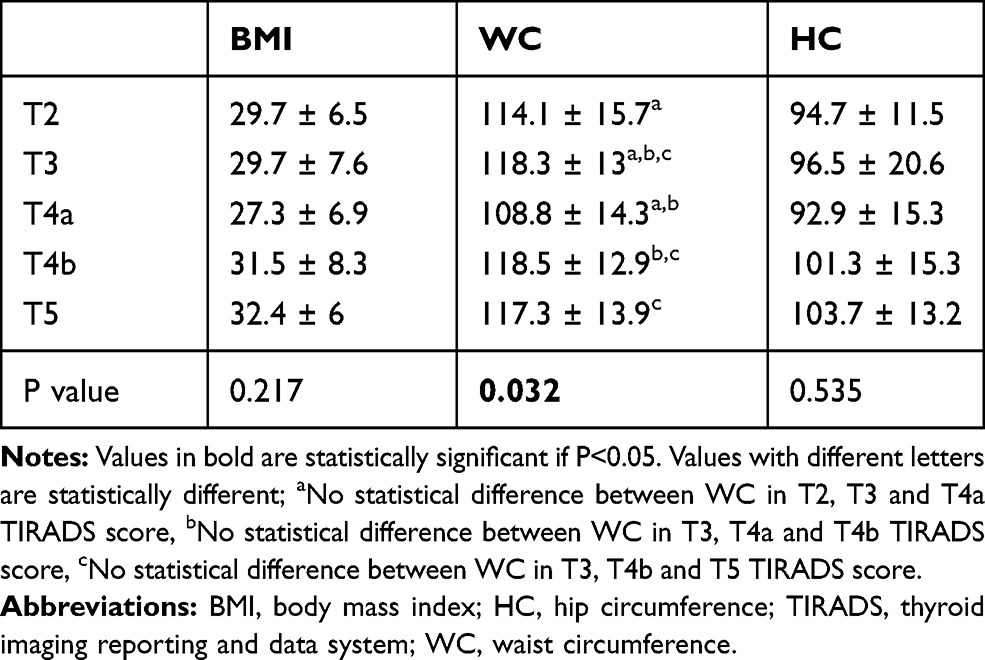 |
Table 4 Association Between BMI, WC, HC and TIRADS Classification of the Patients |
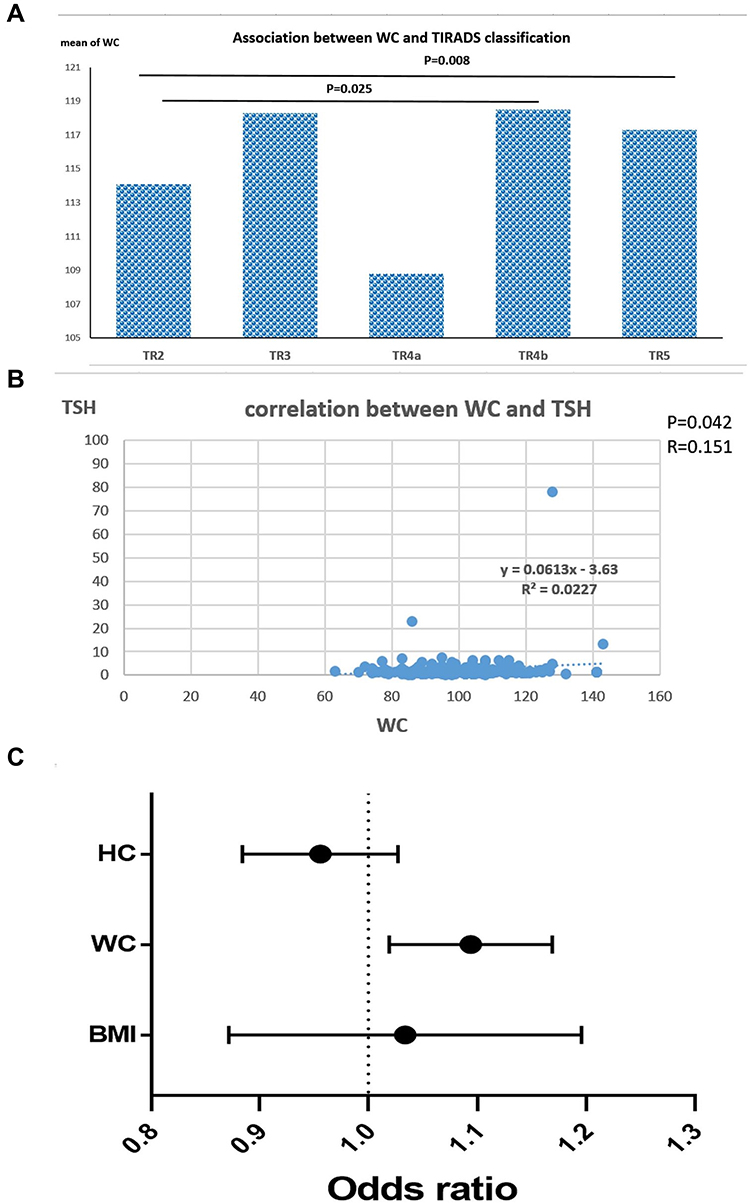 |
Figure 5 (A) Association between WC (waist circumference) and TIRADS classification of the assessed Thyroid nodule patients, (B) correlation between WC and TSH (thyroid-stimulating hormone) levels in the Thyroid nodule patients, (C) odds ratio of BMI (body mass index), WC (waist circumference), HC (hip circumference) for diagnosis of thyroid cancer compared to benign nodules. |
Correlations Between the Thyroid Profiles of the Patients and the Assessed Anthropometric Measurements
There was a positive significant correlation between WC of the patients and TSH serum level (r=0.151, P=0.042). While there was no significant correlation between any other anthropometric measurements assessed and FT3, FT4, or TSH (P>0.05, Table 5, Figure 5B).
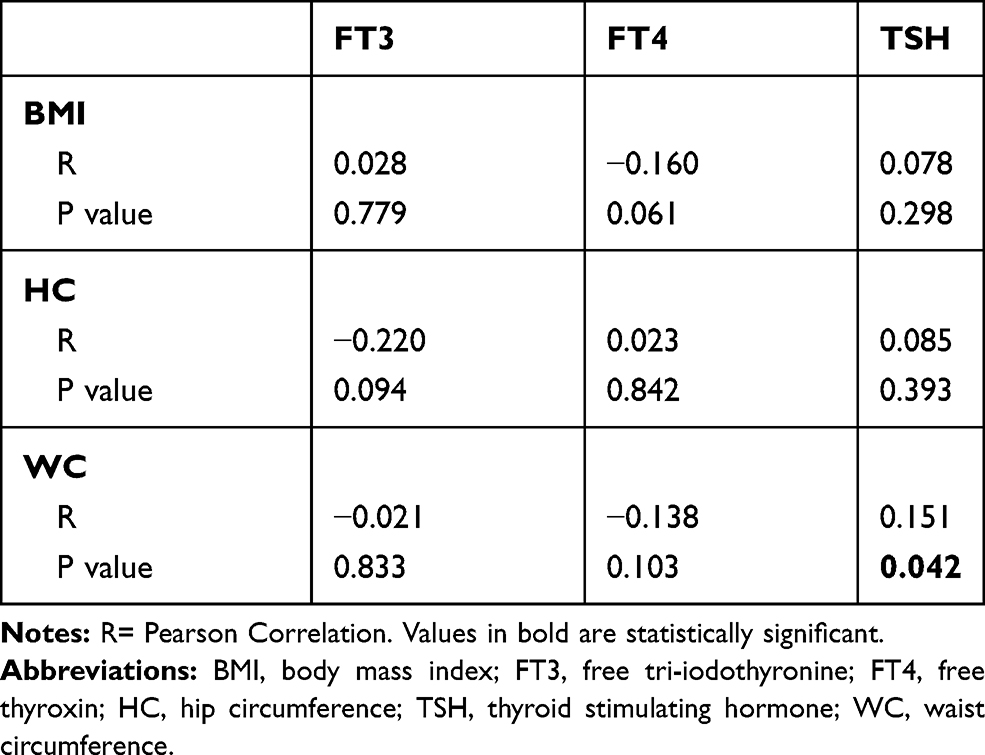 |
Table 5 Correlations Between the Thyroid Profiles of the Patients and the Assessed Anthropometric Measurements |
Univariate and Multivariate Logistic Regression Analysis
Univariate analysis was done for age, sex, TSH, FT3, TIRADS score, BMI, HC, WC to assess the association with risk of malignant thyroid nodules. The only significant factors were BMI, HC and WC (P=0.003, 0.022 and P<0.001; respectively). On multivariate logistic regression analysis, it showed that WC is an independent predictor for TC [OR: 1.092, CI: 1.020–1.170, P=0.012], whereas, BMI [OR: 1.025, CI: 0.876–1.200] and HC [OR: 0.954, CI: 0.885–1.028] are not considered as independent predictors for TC (P=0.755 and 0.218; respectively, Table 6, Figure 5C).
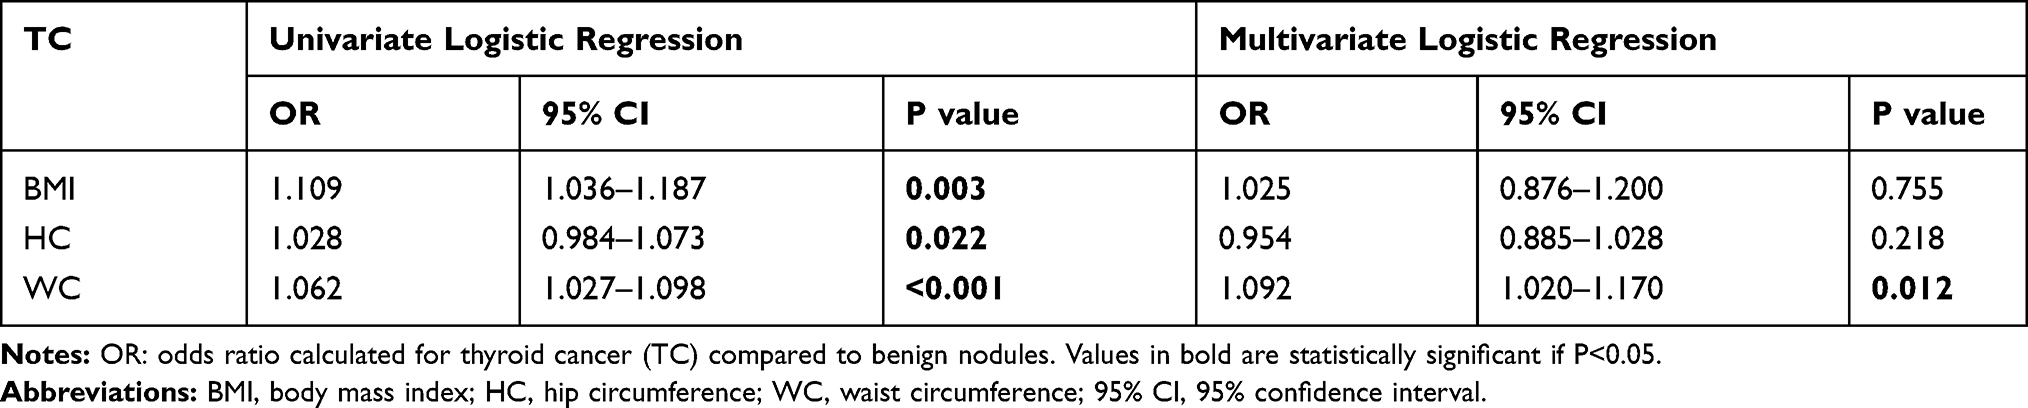 |
Table 6 Multivariate Logistic Regression Analysis of the Assessed Anthropometric Measurements |
Diagnostic Value of the BMI, WC and HC for the Assessment of Thyroid Nodules
ROC curve analysis was performed to assess the role of the studied Anthropometric measurements in the diagnosis of malignant thyroid nodules, it showed that the sensitivity, specificity and AUC of the BMI were (64.3%, 62.5% and 0.722; respectively, P=0.008) at a cutoff value 32.59, and that of the HB were (64.3%, 60% and 0.662; respectively, P=0.053) at a cutoff value 120.5 cm, compared to that of WC which achieved the highest sensitivity (71.4%), specificity (68.7%), AUC (0.750), at a cutoff value of 108.5 cm (P=0.003, Figure 6A). Whereas, when combining BMI and WC for the assessment of TC, it showed the highest sensitivity (77.8%), while the specificity was 68.4% and AUC was 0.780 (P <0.001, Figure 6B). While when combining the three markers (BMI+WC+HC) together, they achieved the highest specificity (70%), with a sensitivity (71.4%) and AUC 0.737 (P=0.005, Table 7, Figure 6C).
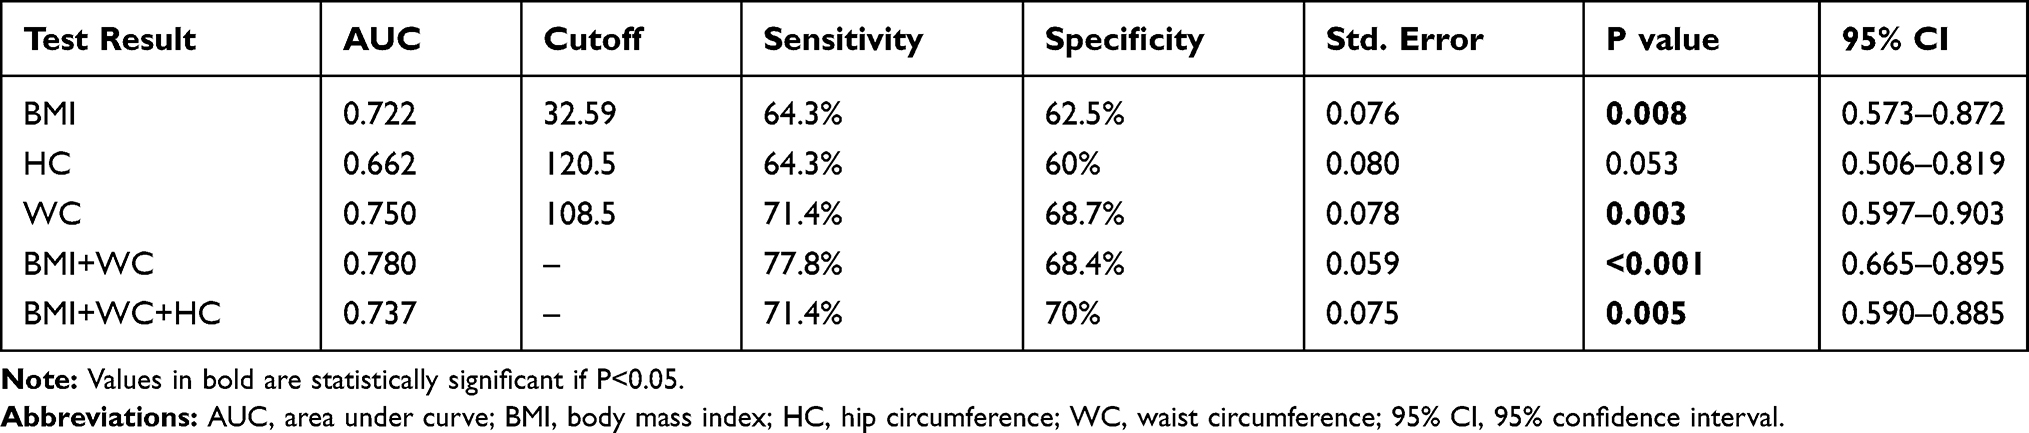 |
Table 7 Diagnostic Significance of BMI, WC and HC for the Assessment of Malignant Thyroid Nodules |
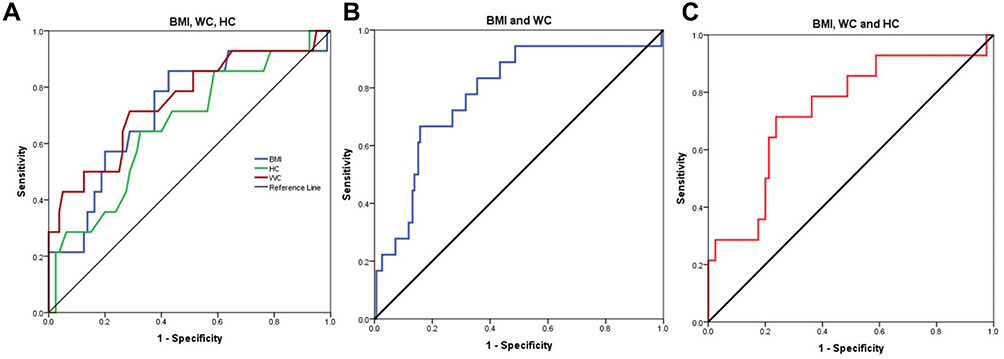 |
Figure 6 (A) ROC curve analysis of BMI (Body mass index), WC (waist circumference), HC (Hip circumference) for diagnosis of thyroid cancer patients, (B) combined ROC curve of BMI and WC for diagnosis of thyroid cancer, (C) combined ROC curve for the three markers; BMI, WC and HC for diagnosis of thyroid cancer. |
Discussion
Incidence of thyroid cancer has been dramatically increased over the last few years, and in parallel, the prevalence of obesity has also been increased. Growing body of evidence suggests that the change in the obesity rate is associated with increased incidence of thyroid cancer all over the world.19 Though many studies confirmed the association between obesity in the form of BMI and the incidence of TC,20–22 however, other studies negated this link, and concluded that there was no significant association between BMI and thyroid cancer.23–25 Thus, the data are controversial and still there is a debate around the causal relationship between obesity including its different types whether central or peripheral, and the risk of TC.
The current study showed that there was a significant increase in BMI, WC and W/H ratio in TC patients compared to patients with benign nodules (BN), While there was no significant difference between the studied two groups regarding hip circumference (HP). These data are in concordance with that of Arduc et al,26 who reported that increased BMI and large WC were associated with higher thyroid cancer risk, but not with baseline aggressive tumor characteristics. They added that these two measurements could be prognostic factors to determine the extent of thyroid surgical procedure, such as a thyroidectomy or a lobectomy. Similarly, another nationwide population-based cohort study done by Kwon et al,27 on 11,323,006 Korean subjects reported the incidence of thyroid cancer increased significantly in subjects with larger WC, higher BMI as well as in subjects who were lean and became obese. Comparable results were also observed in a large pooled analysis of 22 prospective studies (833,176 men and 1,260,871 women) done by Kitahara et al.21 They reported a significant association between risk of thyroid cancer and increased BMI and/or WC, while on contrary to our results, they reported that waist/hip ratio did not significantly affect the incidence of thyroid cancer.
Additionally, multivariate logistic regression analysis performed for recruited patients showed that WC is an independent predictor for TC, despite adding all classic confounding factors as age, gender, TIRADS score, BMI and TSH. As Waist circumference and waist-hip ratio are mainly reflecting abdominal fat mass,28,29 whereas hip circumference reflects mainly subcutaneous fat.30 This data could explain that adipose tissue in the waist area may affect the pathogenesis of thyroid cancer differently from adipose tissue in other sites of the body. Our data are consistent with that reported by Song et al,31 who performed a community-based population study in China and concluded that Waist circumference is superior to BMI for assessing the risk of developing TC. On the contrary, Handelsman et al32 reported inverse relationship between increased BMI and decreased rate of Papillary thyroid cancer, they suggested that there were other factors that may be involved in thyroid carcinogenesis other than BMI. The conflicting data in the literature around the association between BMI and the risk of TC are mainly due to that BMI is a quite nonspecific measure of adiposity including muscle mass, bone mass, peripheral and abdominal adipose tissue.33 Whereas, Waist circumference specifically reflects abdominal adiposity, which mainly consists of subcutaneous and visceral adipose tissue.34,35
Another finding observed in the current study is that there was a positive significant correlation between WC of the assessed patients and TSH level. While there was no significant correlation between any other anthropometric measurements assessed and FT3, FT4, or TSH. These results are in agreement with De Pergola et al,36 who found a significant positive correlation between TSH level and WC in obese patients. However, they also found that FT3 level was directly associated with BMI and WC, which we did not observe in our cohort of patients. He concluded that central obesity is associated with an increase in both FT3 and TSH serum levels independently of insulin sensitivity, metabolic parameters and blood pressure. In addition, these data were confirmed by Reinehr et al,37 who reported a significant causal relationship between TSH and obesity, which might be through several mechanisms mainly leptin secretion. On the other hand, these data are contradictory to that observed by Handelsman et al32 that increased BMI is significantly associated with decreased serum TSH level in patients who underwent thyroid lobectomy or total thyroidectomy. This discrepancy in data could be explained by that BMI is not a real indicator of central obesity, as the later had been proved to be associated with other health problems like insulin resistance and metabolic syndrome.
Furthermore, regarding the association between the anthropometric measurements and the ultrasound criteria of thyroid nodules, the present study demonstrated that increased BMI, WC and HC associated significantly with solid nodules with no breakdown, rather than complex ones with breakdown. In addition, increased WC is significantly observed in hypoechoic and heterogeneous nodules, compared to isoechoic and hyperechoic nodules. WC is also associated significantly with lymph nodes enlargement in thyroid cancer patients. Another finding observed in the present study is that HC increased significantly with the absence of the vascularity of the nodules. No significant association was detected between anthropometric measurements and number of the nodules, calcification and halo type. Our study in this context is not consistent with de Siqueira et al38 and Zhao et al39 who reported a significant association between BMI and increased parenchymal hypo-echogenicity as well as increased frequency of thyroid nodules on ultra-sonographic evaluation.
For more confirmation, we assessed the association between the BMI, WC, HC and TIRADS classification of the patients. Interestingly, we found a significant association between TIRADS classification and WC of the assessed patients, WC increased significantly in patients with TR4b and TR5 compared to those with TR2. However, this finding is not in agreement with de Siqueira et al,38 who found no significant difference in TIRADS classification between obese and non-obese TC patients. Thus, we recommend that further studies are required to address this issue deeply.
The current study provides an evidence that waist circumference as a cheap, easily measured clinical parameter is a potential independent predictor of thyroid cancer that should be taken into consideration. According to our analysis, BMI of 33 or more and/or WC of 109 cm or more may be considered as strong predictors of thyroid cancer with even greater significance if both criteria are present with a sensitivity of 77.8% and specificity of 68.4%. These criteria are specific to patients presenting with thyroid nodules that are indicated for further evaluation rather than the general population, according to our study cohort.
Strong points in this study include that patients were enrolled consecutively, so selection bias of cancer patients was eliminated, and the percentage of cancer among thyroid nodules is genuine. Also, thyroid cancer patients were compared to patients with benign nodules rather than healthy individuals, so risk factors common to benign thyroid nodules and cancer were eliminated. This explains why classic risk factors of thyroid nodules were not significant in the multivariate analysis. However, further studies on a large number of patients are needed to validate these results. Plus, including complementary tests for assessment of insulin resistance in order to take part in the multivariable analysis.
Therefore, we can conclude that first, central adiposity is strongly associated with thyroid cancer which provides insights into the pathogenesis and prevention of a common disease. Second, the identification of high-risk individuals which may guide screening and limit over diagnosis. A BMI of 33 or more and WC of 109cm or more may be considered as strong predictors of thyroid cancer. Third, there is an association between BMI and WC with the ultrasonographic criteria of the thyroid nodules like hypoechogenicity, solid consistency, presence of breakdown and LN affection. However, WC is more superior to BMI when correlated with TIRADS classification, as well as an independent predictor for thyroid cancer.
Ethical Consideration
The study protocol was approved by the internal medicine department ethical committee of faculty of medicine, cairo university, which were in accordance with 2011 declaration of Helsinki. A signed informed consent was obtained from each patient before enrollment in the study.
Disclosure
All authors declare that there is no conflict of interest.
References
1. Bray F, Ferlay J, Soerjomataram I, Siegel RL, Torre LA, Jemal A. Global cancer statistics 2018: GLOBOCAN estimates of incidence and mortality worldwide for 36 cancers in 185 countries. CA Cancer J Clin. 2018;68(6):394–424.
2. Di Zazzo E, Polito R, Bartollino S, et al. Adiponectin as link factor between adipose tissue and cancer. Int J Mol Sci. 2019;20(4):839. doi:10.3390/ijms20040839
3. James BC, Mitchell JM, Jeon HD, Vasilottos N, Grogan RH, Aschebrook-Kilfoy B. An update in international trends in incidence rates of thyroid cancer, 1973–2007. Cancer Causes Control. 2018;29(4–5):465–473. doi:10.1007/s10552-018-1023-2
4. Vaccarella S, Franceschi S, Bray F, Wild CP, Plummer M, Dal Maso L. Worldwide thyroid-cancer epidemic? The increasing impact of overdiagnosis. N Engl J Med. 2016;375(7):614–617. doi:10.1056/NEJMp1604412
5. Jiang H, Tian Y, Yan W, et al. The prevalence of thyroid nodules and an analysis of related lifestyle factors in Beijing communities. Int J Environ Res Public Health. 2016;13(4):442. doi:10.3390/ijerph13040442
6. Azagury DE, Lautz DB. Obesity overview: epidemiology, health and financial impact, and guidelines for qualification for surgical therapy. Gastrointest Endosc Clin. 2011;21(2):189–201. doi:10.1016/j.giec.2011.02.001
7. Wartofsky L. Increasing world incidence of thyroid cancer: increased detection or higher radiation exposure? Hormones. 2010;9(2):103–108. doi:10.14310/horm.2002.1260
8. Meinhold CL, Ron E, Schonfeld SJ, et al. Nonradiation risk factors for thyroid cancer in the US radiologic technologists study. Am J Epidemiol. 2010;171(2):242–252. doi:10.1093/aje/kwp354
9. Cheng SP, Yin PH, Hsu YC, et al. Leptin enhances migration of human papillary thyroid cancer cells through the PI3K/AKT and MEK/ERK signaling pathways. Oncol Rep. 2011;26(5):1265–1271. doi:10.3892/or.2011.1388
10. Feng S, Zhang Z, Xu S, et al. The prevalence of thyroid nodules and their association with metabolic syndrome risk factors in a moderate iodine intake area. Metab Syndr Relat Disord. 2017;15(2):93–97. doi:10.1089/met.2016.0077
11. Xu W, Chen Z, Li N, et al. Relationship of anthropometric measurements to thyroid nodules in a Chinese population. BMJ Open. 2015;5(12):e008452. doi:10.1136/bmjopen-2015-008452
12. Bifulco M, Ciaglia E. Updates on “adiponcosis”: more new incoming evidence strengthening the obesity-cancer link. Eur J Intern Med. 2017;41:e19–e20. doi:10.1016/j.ejim.2016.12.016
13. Stone TW, McPherson M, Darlington LG. Obesity and cancer: existing and new hypotheses for a causal connection. EBioMedicine. 2018;30:14–28. doi:10.1016/j.ebiom.2018.02.022
14. Young O, Crotty T, O’Connell R, O’Sullivan J, Curran AJ. Levels of oxidative damage and lipid peroxidation in thyroid neoplasia. Head & neck. J Sci Spec Head Neck. 2010;32(6):750–756.
15. World Health Organization. Monitoring and Evaluation for Viral Hepatitis B and C: Recommended Indicators and Framework. 2016.
16. Haugen BR. The 2015 American thyroid association evidence-based guidelines for management of patients with thyroid nodules and differentiated thyroid cancer: key recommendations. In: Practical Management of Thyroid Cancer. Cham: Springer; 2018:17–20.
17. Cibas ES, Ali SZ. The 2017 bethesda system for reporting thyroid cytopathology. Thyroid. 2017;27(11):1341–1346. doi:10.1089/thy.2017.0500
18. Tuttle RM, Haugen B, Perrier ND. Updated American Joint Committee on Cancer/Tumor-Node-Metastasis Staging System for Differentiated and Anaplastic Thyroid Cancer: What Changed and Why? 2017.
19. He Q, Sun H, Li F, Liang N. Obesity and risk of differentiated thyroid cancer: a large‐scale case‐control study. Clin Endocrinol (Oxf). 2019;91(6):869–878. doi:10.1111/cen.14091
20. Schmid D, Ricci C, Behrens G, Leitzmann MF. Adiposity and risk of thyroid cancer: a systematic review and meta‐analysis. Obes Rev. 2015;16(12):1042–1054. doi:10.1111/obr.12321
21. Kitahara CM, McCullough ML, Franceschi S, et al. Anthropometric factors and thyroid cancer risk by histological subtype: pooled analysis of 22 prospective studies. Thyroid. 2016;26(2):306–318. doi:10.1089/thy.2015.0319
22. Son H, Lee H, Kang K, Lee I. The risk of thyroid cancer and obesity: a nationwide population-based study using the Korea national health insurance corporation cohort database. Surg Oncol. 2018;27(2):166–171. doi:10.1016/j.suronc.2018.03.001
23. Dobbins M, Decorby K, Choi BCK. The association between obesity and cancer risk: a meta-analysis of observational studies from 1985 to 2011. ISRN Prev Med. 2013;2013:1–16. doi:10.5402/2013/680536
24. Stansifer KJ, Guynan JF, Wachal BM, Smith RB. Modifiable risk factors and thyroid cancer. Otolaryngol Head Neck Surg. 2015;152(3):432–437. doi:10.1177/0194599814564537
25. Mijović T, How J, Pakdaman M, et al. Body mass index in the evaluation of thyroid cancer risk. Thyroid. 2009;19(5):467–472. doi:10.1089/thy.2008.0386
26. Arduc A, Dogan BA, Tuna MM, et al. Higher body mass index and larger waist circumference may be predictors of thyroid carcinoma in patients with Hürthle‐cell lesion/neoplasm fine‐needle aspiration diagnosis. Clin Endocrinol (Oxf). 2015;83(3):405–411. doi:10.1111/cen.12628
27. Kwon H, Han KD, Park CY. Weight change is significantly associated with risk of thyroid cancer: a nationwide population-based cohort study. Sci Rep. 2019;9(1):1–8. doi:10.1038/s41598-018-37186-2
28. Klein S, Allison DB, Heymsfield SB, et al. Waist circumference and cardiometabolic risk: a consensus statement from shaping America’s health: association for weight management and obesity prevention; NAASO, the obesity society; the American society for nutrition; and the American diabetes association. Obesity. 2007;15(5):1061–1067. doi:10.1038/oby.2007.632
29. Welborn TA, Dhaliwal SS, Bennett SA. Waist–hip ratio is the dominant risk factor predicting cardiovascular death in Australia. Med J Aust. 2003;179(11):580–585. doi:10.5694/j.1326-5377.2003.tb05704.x
30. Cameron AJ, Magliano DJ, Shaw JE, et al. The influence of hip circumference on the relationship between abdominal obesity and mortality. Int J Epidemiol. 2012;41(2):484–494. doi:10.1093/ije/dyr198
31. Song B, Zuo Z, Tan J, et al. Association of thyroid nodules with adiposity: a community-based cross-sectional study in China. BMC Endocr Disord. 2018;18(1):3. doi:10.1186/s12902-018-0232-8
32. Handelsman RS, Alvarez AL, Picado O, Farrá JC, Lew JI. Inverse relationship of BMI to TSH and risk of papillary thyroid cancer in surgical patients. J Surg Res. 2019;244:96–101. doi:10.1016/j.jss.2019.06.017
33. Kramer H, Gutiérrez OM, Judd SE, et al. Waist circumference, body mass index, and ESRD in the REGARDS (reasons for geographic and racial differences in stroke) study. Am J Kidney Dis. 2016;67(1):62–69. doi:10.1053/j.ajkd.2015.05.023
34. Power ML, Schulkin J. Sex differences in fat storage, fat metabolism, and the health risks from obesity: possible evolutionary origins. Br J Nutr. 2008;99(5):931–940. doi:10.1017/S0007114507853347
35. Lemieux S, Prud’homme D, Bouchard C, Tremblay A, Després JP. Sex differences in the relation of visceral adipose tissue accumulation to total body fatness. Am J Clin Nutr. 1993;58(4):463–467. doi:10.1093/ajcn/58.4.463
36. De Pergola G, Ciampolillo A, Paolotti S, Trerotoli P, Giorgino R. Free triiodothyronine and thyroid stimulating hormone are directly associated with waist circumference, independently of insulin resistance, metabolic parameters and blood pressure in overweight and obese women. Clin Endocrinol (Oxf). 2007;67(2):265–269. doi:10.1111/j.1365-2265.2007.02874.x
37. Reinehr T. Obesity and thyroid function. Mol Cell Endocrinol. 2010;316(2):165–171. doi:10.1016/j.mce.2009.06.005
38. de Siqueira RA, Rodrigues APDS, Miamae LM, Tomimori EK, Silveira EA. Thyroid nodules in severely obese patients: frequency and risk of malignancy on ultrasonography. Endocr Res. 2020;45(1):9–16. doi:10.1080/07435800.2019.1625056
39. Zhao S, Jia X, Fan X, et al. Association of obesity with the clinicopathological features of thyroid cancer in a large, operative population: a retrospective case-control study. Medicine. 2019;98(50):e18213. doi:10.1097/MD.0000000000018213
 © 2020 The Author(s). This work is published and licensed by Dove Medical Press Limited. The
full terms of this license are available at https://www.dovepress.com/terms
and incorporate the Creative Commons Attribution
- Non Commercial (unported, 3.0) License.
By accessing the work you hereby accept the Terms. Non-commercial uses of the work are permitted
without any further permission from Dove Medical Press Limited, provided the work is properly
attributed. For permission for commercial use of this work, please see paragraphs 4.2 and 5 of our Terms.
© 2020 The Author(s). This work is published and licensed by Dove Medical Press Limited. The
full terms of this license are available at https://www.dovepress.com/terms
and incorporate the Creative Commons Attribution
- Non Commercial (unported, 3.0) License.
By accessing the work you hereby accept the Terms. Non-commercial uses of the work are permitted
without any further permission from Dove Medical Press Limited, provided the work is properly
attributed. For permission for commercial use of this work, please see paragraphs 4.2 and 5 of our Terms.