Back to Journals » OncoTargets and Therapy » Volume 11
Nuclear factor-κB p65 regulates glutaminase 1 expression in human hepatocellular carcinoma
Authors Dong M, Miao L, Zhang F, Li S, Han J, Yu R, Qie S
Received 6 March 2018
Accepted for publication 8 May 2018
Published 28 June 2018 Volume 2018:11 Pages 3721—3729
DOI https://doi.org/10.2147/OTT.S167408
Checked for plagiarism Yes
Review by Single anonymous peer review
Peer reviewer comments 2
Editor who approved publication: Dr Samir Farghaly
Meng Dong,1 Lin Miao,2 Fengmei Zhang,3 Shengshui Li,3 Jingzhi Han,1 Ruohui Yu,1 Shuo Qie4
1Department of Hepatobiliary Surgery, Hebei Cangzhou Hospital of Integrated Traditional Chinese and Western Medicine, Cangzhou, Hebei 061001, China; 2Departments of Obstetrics and Gynecology, Yixingbu Hospital, Beichen, Tianjin 300402, China; 3Department of Pathology, Hebei Cangzhou Hospital of Integrated Traditional Chinese and Western Medicine, Cangzhou, Hebei 061001, China; 4Department of Biochemistry and Molecular Biology, Medical University of South Carolina, Charleston, SC 29425, USA
Background: Glutaminase (GLS), the key enzyme that catalyzes glutamine catabolism, facilitates the production of energy, building blocks, and factors resisting stresses. Two isoforms of GLS have been identified: GLS1 and GLS2. Elevated GLS1 contributes to tumorigenesis and tumor progression. This study investigates the molecular mechanism by which GLS1 is regulated in human hepatocellular carcinoma (HCC).
Methods: Online databases were investigated to search for factors that co-overexpress with GLS1. siRNA knockdown or chemical compounds were utilized to manipulate the activation or inactivation of nuclear factor-κB (NF-κB) p65 signaling. Both the mRNA and protein levels of GLS1 were detected. The biological and clinical importance of p65-GLS1 in HCC was also demonstrated.
Results: NF-κB p65 regulates GLS1 expression in HCC cells. Knockdown or suppression of GLS1 compromises HCC cell proliferation. Elevated GLS1 expression correlates with neoplasm histological grade, and the dysregulation of p65-GLS1 is associated with poor prognosis in human HCC patients.
Conclusion: GLS1 can be developed as a diagnostic and therapeutic target for human HCC.
Keywords: hepatocellular carcinoma, NF-κB p65, glutaminase, proliferation, prognosis
Introduction
Hepatocellular carcinoma (HCC) ranks as the sixth most common cancer and is one of the leading causes of death globally.1 More than 500,000 new cases are diagnosed every year. Although the diagnosis and treatment of HCC have been improved a lot, the prognosis remains poor for most patients.2 The development and progression of HCC are the results of aberrant genetic and epigenetic changes that lead to dysregulated signaling pathways. The complexity of these regulating networks makes current treatment ineffective; therefore, there is an urgent need for new therapeutic targets.
Tumorigenesis is a process depending on metabolic reprogramming as the results of activation of oncogenes and/or loss of function of tumor suppressors.3,4 For example, dysregulated glucose and glutamine metabolism has been demonstrated in human tumors.5,6 Glutamine, a conditionally essential amino acid, can be utilized for energy production, as an nitrogen source, and for antagonizing reactive oxygen species, thus contributing to various biological processes of human tumors.7 The key enzymes for glutamine metabolism include two isoforms of glutaminase (GLS): GLS1 and GLS2.8 GLS1 is elevated in HCC tissues compared to normal liver and other liver diseases, including hepatocellular adenoma, dysplastic nodules, focal nodular hyperplasia, and fibrotic liver; moreover, elevated GLS1 expression correlates with poor prognosis, highlighting that GLS1 can be targeted as a therapeutic candidate.9 Although GLS2 has been extensively studied in HCC, its biological function remains elusive. Some studies showed that restoration of GLS2 suppresses the growth of HCC cells both in vitro and in vivo,10 and elevated GLS2 expression correlates with longer survival;9 while another study demonstrated that GLS2 promotes the proliferation of Hepa 1.6 cells in mouse xenograft in a liver receptor homologue-1 (LRH-1)-dependent manner.11 Various mechanisms are involved in the regulation of GLS1 expression in HCC, such as the miR-192/-204–HOTTIP axis,12 p53,13 LRH-1, and peroxisome proliferator-activated receptor-α;14 however, it remains unclear whether other mechanisms also regulate GLS1 expression.
Nuclear factor-κB (NF-κB), as a transcription factor, regulates various aspects of cell cycle progression, immune responses, cell and tissue differentiation, and DNA damage repair.15 The NF-κB family includes NF-κB1 (p50/p105), NF-κB2 (p52/p100), RelA (p65), RelB, and c-Rel, which form dimers and regulate gene transcription.16 Among these dimers, the most commonly activated one is formed by p50 and p65 subunits. Several studies have demonstrated that NF-κB activation facilitates the production of cytokines and chemokines and the maintenance of an inflammatory environment, leading to the development of HCC.17 NF-κB p65 regulates the expression and activity of GLS1 in human breast cancer cells and leukemic cells, and knockdown of GLS1 compromises cell proliferation.18–20
In this study, online cancer Genomewise databases from Oncomine™ and cBioPortal were utilized to identify factors that co-overexpress with GLS1 in human HCC; thereafter, genetic manipulation or chemical treatment was performed to consolidate the correlation between NF-κB p65 and GLS1 in HCC cell lines; lastly, the biological function and clinical significance of GLS1 were analyzed.
Materials and methods
Patient samples
Six HCC tumor tissues and their normal counterparts were collected from the Department of Pathology at Cangzhou Hospital of Integrated Traditional Chinese and Western Medicine (TCM-WM), Hebei, China.
Ethics approval and informed consent
All patients whose tissue samples were used in this research have provided written informed consent, and the Institutional Review Board for Human Research from Cangzhou Hospital of Integrated TCM-WM approved this study.
Oncomine analysis
Oncomine analysis was performed using the online cancer microarray database.21,22 The expression of c-Myc, p65, and GLS1 was analyzed at the transcriptional level in selected HCC data sets.
cBioPortal analysis
The cBioPortal for Cancer Genomics was accessed.23 It provides a good source through which to visualize, analyze, and download different cancer genomic data sets.24 Among the HCC data sets, Liver Hepatocellular Carcinoma (LIHC) (The Cancer Genome Atlas [TCGA], Provisional) with 442 samples was selected for further analyses of GLS1 and neoplasm histological grade.25,26
Cell culture
Human HCC HepG2 and Hep3B cells were obtained from the Chinese Academy of Sciences Cell Bank of Type Culture Collection (CBTCCCAS, Shanghai, China). The cells were cultured in DMEM with 10% fetal bovine serum, 2 mM L-glutamine, and 100 U/L penicillin–streptomycin, and maintained at 37°C in a humidified incubator with 5% CO2.
Chemicals and antibodies
Phorbol 12-myristate 13-acetate (PMA) (P8139) and BAY 11-7082 (B5556) were bought from Sigma-Aldrich (St. Louis, MO, USA). Bis-2-(5-phenyl acetamido-1,3,4-thiadiazol-2-yl)ethyl sulfide (BPTES) (S7753) was purchased from Selleck Chemicals (Houston, TX, USA).
Mouse anti-GLS1 (ab60709), rabbit anti-GLS1 (ab156876), and rabbit anti-p65 (ab16502) antibodies were bought from Abcam (Cambridge, UK); c-Myc (sc-40), β-actin (sc-130300), and Lamin B (sc-6216) antibodies were purchased from Santa Cruz (Dallas, TX, USA).
siRNA transfection
Prior to transfection, cells were seeded into 60 mm dishes and cultured overnight. On the following day, the medium was removed and fresh Opti-MEM (Thermo Fisher Scientific, Waltham, MA, USA) was added. siRNAs were transfected at a concentration of 100 nM. Six hours later, fresh complete medium was added to the cells. Four-eight hours post-transfection, the cells were collected for further analysis. Control, c-Myc, p65, and GLS1 siRNAs were purchased from Sigma-Aldrich (St. Louis, MO, USA).
Quantitative real-time reverse transcription polymerase chain reaction (qRT-PCR)
Upon relative treatment, cells were lysed, and total RNA was isolated using TRIzol (Thermo Fisher Scientific, Waltham, MA, USA). Total mRNA was reverse transcribed to cDNA using the iScript™ cDNA Synthesis Kit (Bio-Rad, Hercules, CA, USA) following the manufacturer’s protocol. After the cDNA was synthesized, qRT-PCR was performed using the SsoAdvanced™ Universal SYBR® Green Supermix (Bio-Rad) on the CFX96 Touch™ Real-Time PCR Detection System (Bio-Rad). Human GLS1 primers were 5′-CTCCAAGAATACCAAGTC-3′ and 5′-TTACAACAATCCATCAAGA-3′, and β-actin primers were 5′-ATATGAGATGCGTTGTTA-3′ and 5′-AAGTATTAAGGCGA AGAT-3′. Data were analyzed in CFX Manager software (Bio-Rad, Hercules, CA, USA).
Protein fractionation
Cells treated with NF-κB activator or inhibitor were fractionated to test the localization of p65 in the cytoplasm and nucleus. In general, after treatment, cells were collected in harvest buffer (10 mM HEPES pH 7.9, 50 mM NaCl, 0.5 M sucrose, 0.1 mM EDTA, and 0.5% Triton X 100) supplemented with protease and phosphatase inhibitors plus 1 mM DTT. Pelleted nuclei were washed in buffer A with 10 mM HEPES pH 7.9, 10 mM KCl, 0.1 mM EDTA, and 0.1 mM EGTA, and then lysed in buffer C including 10 mM HEPES pH 7.9, 500 mM NaCl, 0.1 mM EDTA, 0.1 mM EGTA, and 0.1% NP-40. Both cytoplasmic and nuclear extracts were centrifuged at 15,000 rpm for 15 min at 4°C and resolved by Western blot.
Western blot analysis
For total protein isolation, cells were lysed in RIPA buffer (50 mM Tris pH 7.5, 150 mM NaCl, 1.0% NP-40, 0.1% sodium dodecyl sulfate [SDS], and 0.5% deoxycholic acid) supplemented with protease and phosphatase inhibitors. The same amount of protein was resolved by 10% SDS–polyacrylamide gel electrophoresis and transferred to a polyvinylidene difluoride (PVDF) membrane (Immobilon P; Millipore, Burlington, MA, USA) using standard procedures. After blocking in 5% non-fat milk, membranes were incubated with primary antibodies overnight at 4°C. Upon incubation with horseradish peroxidase-conjugated secondary antibodies, the signal was monitored using enhanced chemiluminescence (ECL) reagent (Pierce, Waltham, MA, USA).
Cell proliferation
HepG2 and Hep3B cells, transfected with control and GLS1 siRNA or treated with BPTES, were seeded in 24-well plates with a starting number of 2×10³. At 6, 24, 72, and 120 h post-seeding, cells were fixed in 4% paraformaldehyde for 15 min and then stained with 0.1% crystal violet for 20 min. After washing, the crystal violet signal was extracted using 10% acetic acid. The signal was read at 595 nm in a Bio-Tek Epoch Microplate Reader (Winooski, VT, USA). The 6 h signal was set as Day 0, and the “fold change” was calculated by dividing data of Day 1, Day 3, and Day 5 by data of Day 0.
Immunohistochemical (IHC) staining
Paraffin-embedded sections were microwaved, blocked, and incubated with p65 and GLS1 antibodies, and the signal was amplified using the SP-9000 kit (Zhangshan Golden Bridge Biotechnology Co., Beijing, China) and detected by Elivision Plus (Zhongshan Golden Bridge Biotechnology Co., Beijing, China). Following IHC staining, all sections were counterstained with hematoxylin, dehydrated, and mounted. Normal rabbit immunoglobulin G was used as a negative control. Sections were assessed by two independent pathologists who were blinded to the clinical information. The staining index was evaluated as previously reported.27,28
SurvExpress survival analysis
SurvExpress is an online biomarker database that can be used to explore patients’ survival rate with specific biomarkers.29,30 The tool takes a gene list as an input and generates Kaplan–Meier curves as well as gene expression heatmaps. In this study, two data sets with the most HCC samples were chosen. The default setting of SurvExpress was set to perform the correlation analysis between p65-GLS1 and patients’ outcome.
Statistical analysis
SPSS version 24.0 (IBM Corp., Armonk, NY, USA) was used for statistical analysis. Student’s t-test, one-way analysis of variance, and Kruskal–Wallis test were used to compare data. For survival analysis, survival rates were calculated using the Kaplan–Meier method, and statistical significance was identified using the log-rank test. The significance level was set at 0.05 for all the analyses.
Results
Oncomine analysis indicates co-overexpression of GLS1 with p65 in HCC
To directly test the expression of c-Myc, p65, and GLS1 in HCC, Oncomine analysis was performed. Oncomine is an online cancer microarray database that is suitable for genome-wise expression analyses.21 Three independent data sets were chosen from the eight liver cancer data sets: Wurmbach Liver, with 35 HCC and 10 normal tissues; Roessler Liver, with 22 HCC and 21 normal tissues; and Roessler Liver 2, with 225 HCC and 220 normal tissues. A clear upregulation of GLS1 in HCC was detected in all three data sets. Elevated NF-κB p65 expression was also monitored in these data sets (Figure 1A, B, D, E, G, and H), however, c-Myc did not change accordingly (Figure 1C, F, and I), suggesting co-overexpression of GLS1 with p65 but not c-Myc in HCC samples.
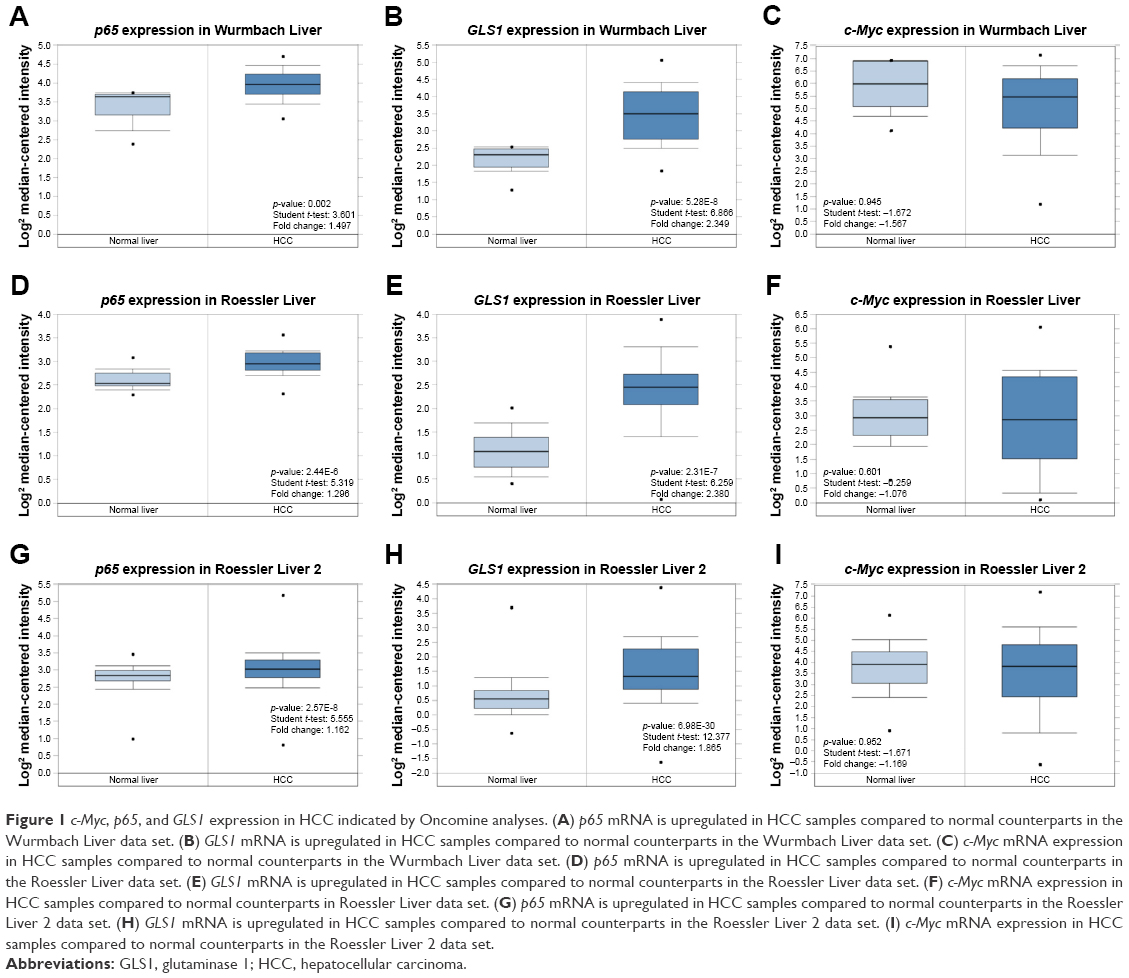 | Figure 1 c-Myc, p65, and GLS1 expression in HCC indicated by Oncomine analyses. (A) p65 mRNA is upregulated in HCC samples compared to normal counterparts in the Wurmbach Liver data set. (B) GLS1 mRNA is upregulated in HCC samples compared to normal counterparts in the Wurmbach Liver data set. (C) c-Myc mRNA expression in HCC samples compared to normal counterparts in the Wurmbach Liver data set. (D) p65 mRNA is upregulated in HCC samples compared to normal counterparts in the Roessler Liver data set. (E) GLS1 mRNA is upregulated in HCC samples compared to normal counterparts in the Roessler Liver data set. (F) c-Myc mRNA expression in HCC samples compared to normal counterparts in Roessler Liver data set. (G) p65 mRNA is upregulated in HCC samples compared to normal counterparts in the Roessler Liver 2 data set. (H) GLS1 mRNA is upregulated in HCC samples compared to normal counterparts in the Roessler Liver 2 data set. (I) c-Myc mRNA expression in HCC samples compared to normal counterparts in the Roessler Liver 2 data set. |
Knockdown or suppression of p65 reduces GLS1 expression in HCC cells
To investigate how GLS1 is regulated in HCC, c-Myc knockdown was performed in HCC cells. Consistent with the Oncomine data, c-Myc knockdown did not alter GLS1 expression in HCC cells (Figure 2A). Since co-overexpression of p65 and GLS1 was detected, to further establish the direct relation between p65 and GLS1, siRNA was transfected to knockdown p65 in HCC cells. Western blot showed effective knockdown of p65 in accordance with GLS1 downregulation (Figure 2B). A previous report showed that NF-κB p65 alters GLS1 expression at mRNA levels.18 To demonstrate whether GLS1 is also transcriptionally regulated by p65 in HCC cells, qRT-PCR was applied to detect GLS1 mRNA levels. Knockdown of p65 reduced GLS1 mRNA levels (Figure 2C), highlighting a transcriptional regulation. To address the importance of p65 in controlling GLS1 expression, chemical compounds were applied to either activate (PMA) or inhibit (BAY 11-7082) the NF-κB signaling pathway. p65 activation is indicated by its localization to the nucleus.18 Western blot indicated the localization of p65 in the nucleus upon PMA treatment, while BAY 11-7082 antagonized its activation (Figure 2D and G). Transcriptionally, PMA induced GLS1 mRNA while BAY 11-7082 reversed the induction (Figure 2F and I). Consistent with the changing of mRNA levels, GLS1 protein was also induced by PMA while BAY 11-7082 reversed the induction (Figure 2E and H).
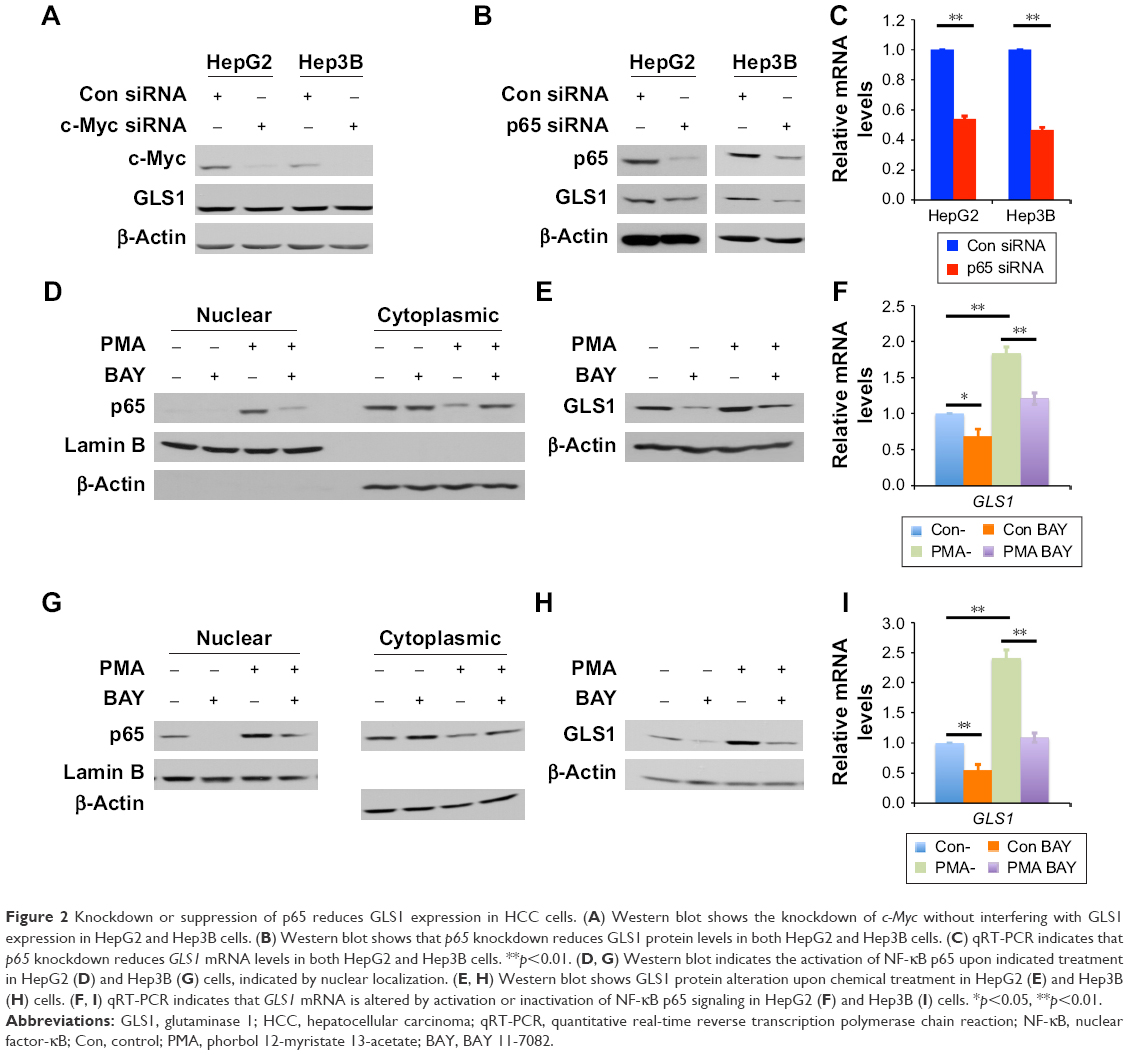 | Figure 2 Knockdown or suppression of p65 reduces GLS1 expression in HCC cells. (A) Western blot shows the knockdown of c-Myc without interfering with GLS1 expression in HepG2 and Hep3B cells. (B) Western blot shows that p65 knockdown reduces GLS1 protein levels in both HepG2 and Hep3B cells. (C) qRT-PCR indicates that p65 knockdown reduces GLS1 mRNA levels in both HepG2 and Hep3B cells. **p<0.01. (D, G) Western blot indicates the activation of NF-κB p65 upon indicated treatment in HepG2 (D) and Hep3B (G) cells, indicated by nuclear localization. (E, H) Western blot shows GLS1 protein alteration upon chemical treatment in HepG2 (E) and Hep3B (H) cells. (F, I) qRT-PCR indicates that GLS1 mRNA is altered by activation or inactivation of NF-κB p65 signaling in HepG2 (F) and Hep3B (I) cells. *p<0.05, **p<0.01. |
GLS1 facilitates the proliferation of HCC cells
GLS1, the key enzyme to catalyze glutaminolysis, facilitates the production of ATP and building blocks for cell proliferation.31 The biological significance of GLS1 was studied by siRNA knockdown in HCC cells. Western blot showed the knockdown of GLS1 in HepG2 and Hep3B cells (Figure 3B and E). GLS1 knockdown suppressed cell proliferation in both cells (Figure 3A and D). To assess whether this finding can be developed for clinical treatment, BPTES, a small molecular GLS1 inhibitor, was applied to HCC cells. Crystal violet assay demonstrated that BPTES successfully inhibited the cell proliferation in a dose-dependent manner (Figure 3C and F).
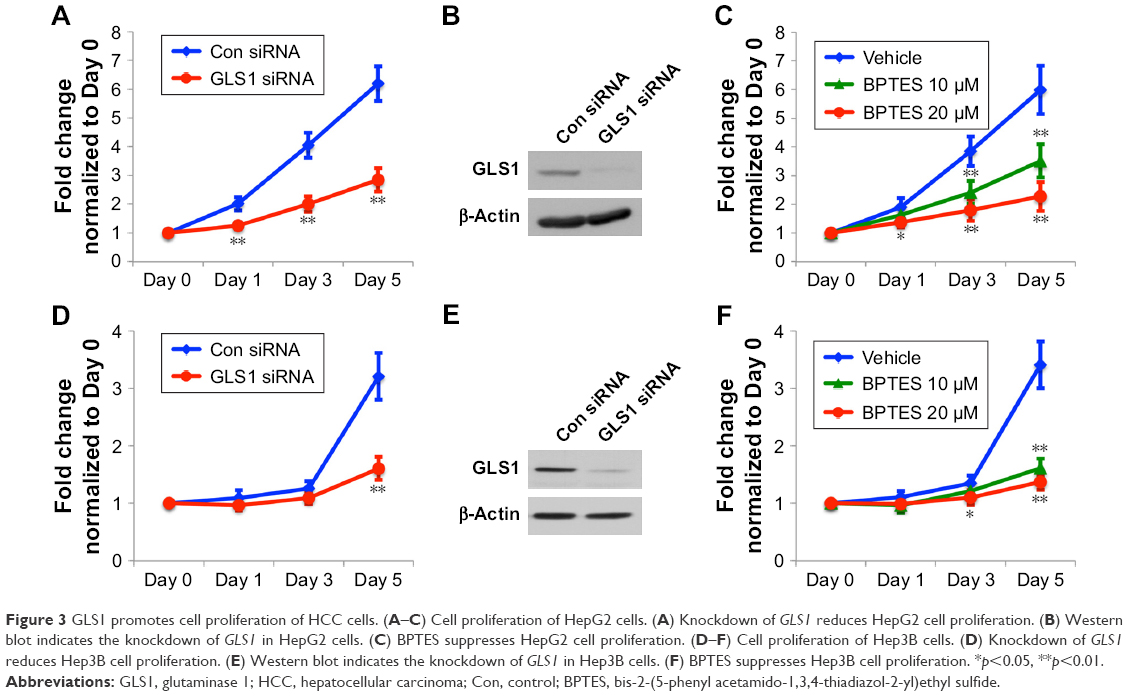 | Figure 3 GLS1 promotes cell proliferation of HCC cells. (A–C) Cell proliferation of HepG2 cells. (A) Knockdown of GLS1 reduces HepG2 cell proliferation. (B) Western blot indicates the knockdown of GLS1 in HepG2 cells. (C) BPTES suppresses HepG2 cell proliferation. (D–F) Cell proliferation of Hep3B cells. (D) Knockdown of GLS1 reduces Hep3B cell proliferation. (E) Western blot indicates the knockdown of GLS1 in Hep3B cells. (F) BPTES suppresses Hep3B cell proliferation. *p<0.05, **p<0.01. |
p65 regulates GLS1 expression in human tissues
To further test the importance of p65 in regulating GLS1, HCC tumor samples and their normal counterparts were collected for IHC staining. Haematoxylin & Eosin staining showed normal and HCC tissues (Figure 4A). IHC staining demonstrated higher p65 and GLS1 in tumor than in normal tissues (Figure 4B–D). cBioPortal data analysis indicated that GLS1 levels correlated with neoplasm histological grade of HCC patients (Figure 4E), suggesting that enhanced glutamine metabolism may promote the progression of HCC.
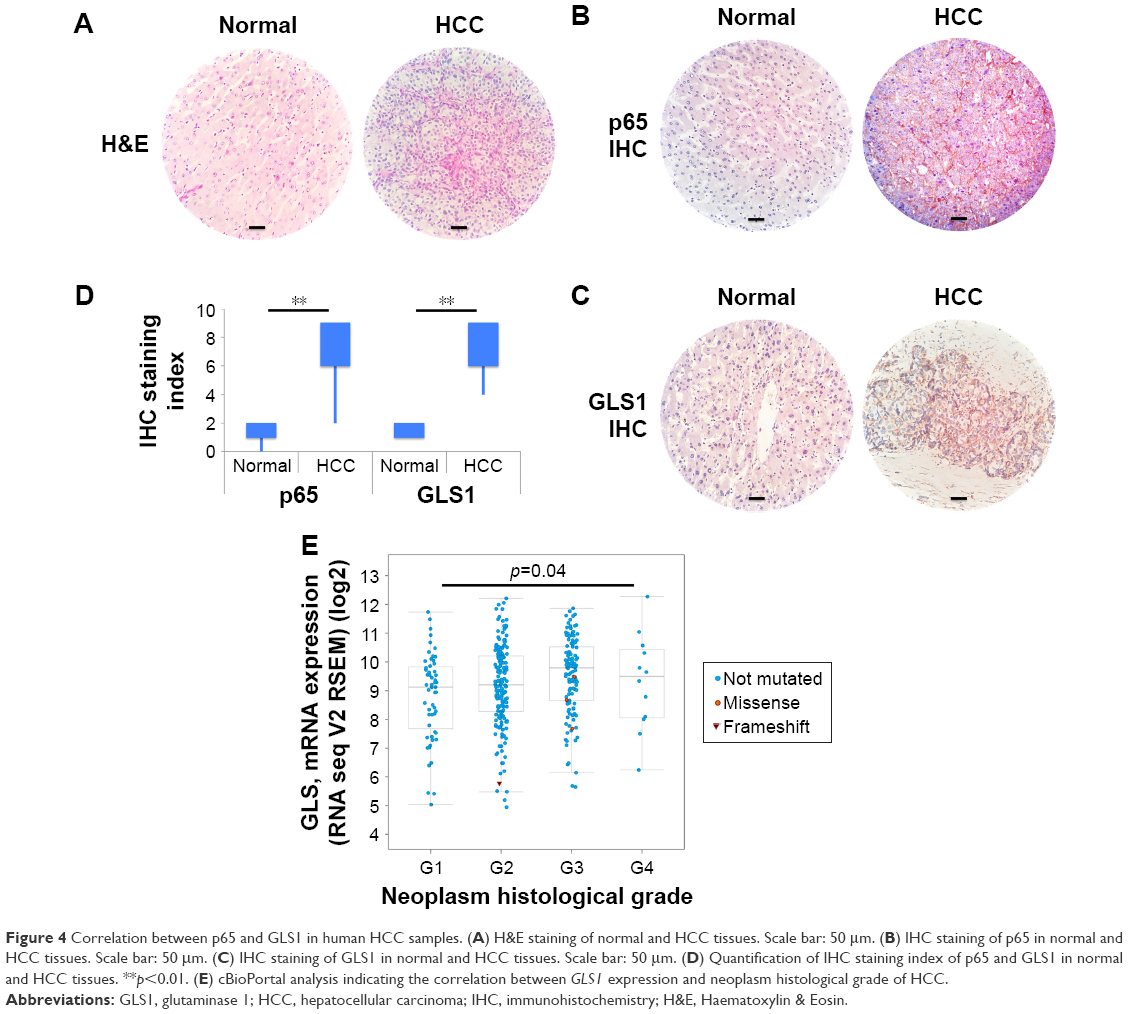 | Figure 4 Correlation between p65 and GLS1 in human HCC samples. (A) H&E staining of normal and HCC tissues. Scale bar: 50 μm. (B) IHC staining of p65 in normal and HCC tissues. Scale bar: 50 μm. (C) IHC staining of GLS1 in normal and HCC tissues. Scale bar: 50 μm. (D) Quantification of IHC staining index of p65 and GLS1 in normal and HCC tissues. **p<0.01. (E) cBioPortal analysis indicating the correlation between GLS1 expression and neoplasm histological grade of HCC. |
p65-GLS1 correlates with poor prognosis of HCC patients
To demonstrate the clinical significance of p65-GLS1 expression in human HCC patients, SurvExpression analyses were performed. Two independent human HCC TCGA data sets were chosen: “Liver-LIHC-TCGA-Liver hepatocellular carcinoma June 2016,” with 361 patients; and “Liver-TCGA-Liver-Cancer,” with 381 patients. Kaplan–Meier analyses found that the dysregulation of p65-GLS1 correlated with poor prognosis (Figure 5A–D), indicating the importance of this signaling pathway in controlling HCC patients’ outcomes.
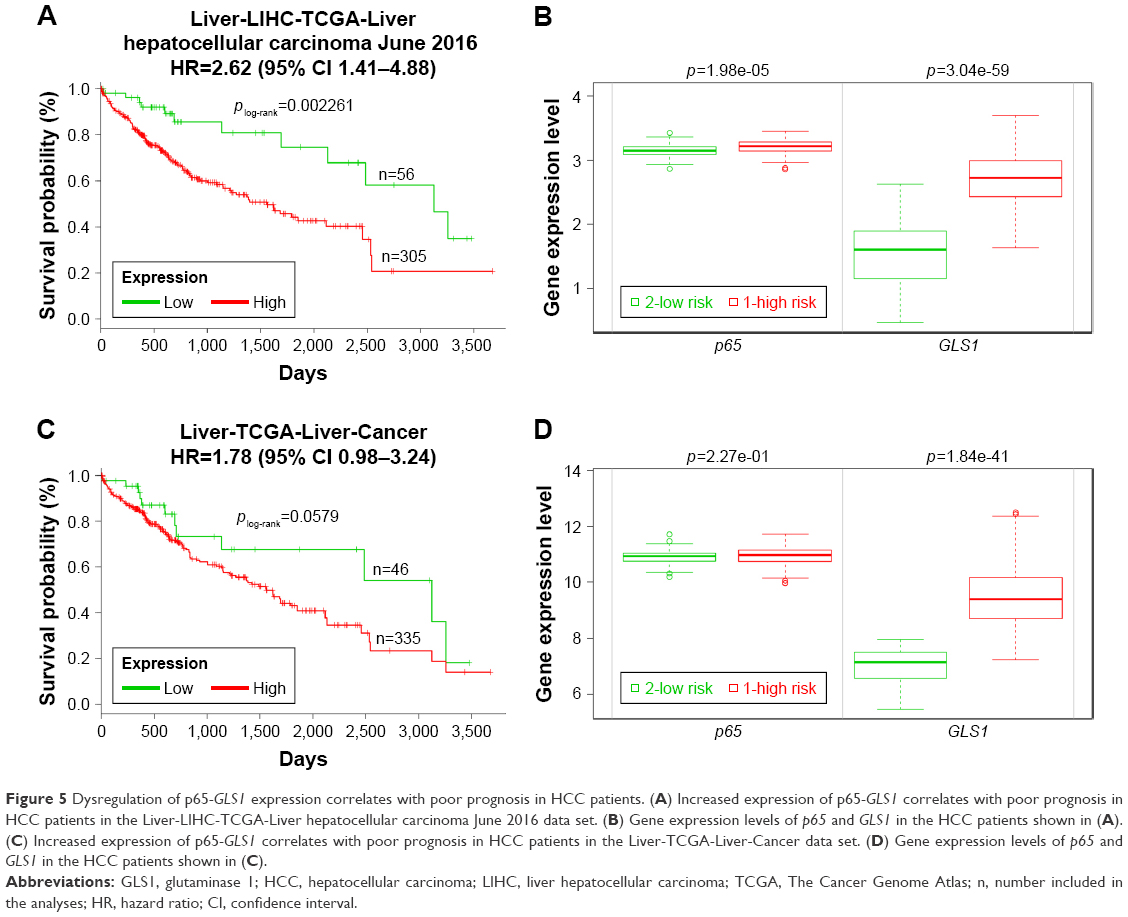 | Figure 5 Dysregulation of p65-GLS1 expression correlates with poor prognosis in HCC patients. (A) Increased expression of p65-GLS1 correlates with poor prognosis in HCC patients in the Liver-LIHC-TCGA-Liver hepatocellular carcinoma June 2016 data set. (B) Gene expression levels of p65 and GLS1 in the HCC patients shown in (A). (C) Increased expression of p65-GLS1 correlates with poor prognosis in HCC patients in the Liver-TCGA-Liver-Cancer data set. (D) Gene expression levels of p65 and GLS1 in the HCC patients shown in (C). |
Discussion
Dysregulated nutrient metabolism is a hallmark of tumorigenesis.4 The activation of tumor oncogenes and/or inactivation of tumor suppressors can not only promote tumor cell proliferation, but also enhance the nutrient metabolism, which provides energy, building blocks, and factors resisting stress conditions.32 The two most commonly dysregulated metabolic processes are the Warburg effect and glutaminolysis. The Warburg effect defines high aerobic glycolysis even in the presence of oxygen, while glutaminolysis is a process in which glutamine is actively catabolized by GLS to favor tumorigenesis and tumor progression.31 Two isoforms of GLS have been identified: GLS1 and GLS2. Oncogenes, such as c-Myc,33 epidermal growth factor receptor 2 (ErbB2),18 and epidermal growth factor (EGF),34 promote glutaminolysis through upregulating or activating GLS1. On the other hand, increased GLS1 expression promotes tumor cells’ dependency on glutamine for survival.35 Because of its role in regulating cell survival and proliferation, GLS1 is an ideal candidate to be developed as a therapeutic target.
Although its diagnosis and treatment have been improved, HCC remains one of the most lethal cancers and the patients’ prognosis remains poor owing to tumor invasion, metastasis, and recurrence. These conditions mean that there is an urgent need to look for novel therapeutic targets. The reprogramming of cancer metabolism has provided a new direction to solve this problem. In recent years, more and more studies have investigated the metabolic reprogramming of human HCC,5 among which glutamine metabolism has been extensively studied. Clinically, elevated GLS1 associates with poor prognosis of HCC, while there is still disagreement over the role of GLS2. In this study, GLS1 was chosen because of its importance in regulating cell proliferation. Our study demonstrated consistent results with previous reports: GLS1 is a prognostic factor for HCC; importantly, GLS1 shows a strong correlation with neoplasm histological grade.
Mechanistically, c-Myc is a well-known oncogene that controls GLS1 expression through downregulating microRNA, miR-23a/b.33 In one study, human HCC samples were collected to compare both mRNA and protein levels of GLS1 and GLS2 in tumor and normal tissues.36 GLS1 mRNA was upregulated, while GLS2 mRNA was downregulated in most tumors; moreover, IHC staining indicated high GLS1 expression while the changing of GLS2 protein levels was variable.36 Although a clear increase in c-Myc mRNA levels was detected, its expression did not correlate with GLS1 mRNA levels, indicating that a factor other than c-Myc controls GLS1 expression in HCC.36 Our previous study demonstrated that ErbB2 can upregulate GLS1 via NF-κB activation in human breast cancer cells.18 Oncomine microarray data sets implicated that NF-κB p65 and GLS1 co-overexpress in human HCC samples; moreover, knockdown of p65 further strengthens our hypothesis that the correlation between p65 and GLS1 is direct, and this regulation is through transcription. Treatment with chemical compounds also ascertained our proposed model. Although GLS1 is regulated by p65 in HCC cells, the detailed mechanism remains elusive. We and another group found that no NF-κB binding sites exist in the GLS1 promoter region, while a mechanism depending on miR-23a was demonstrated.18,19 Further study is proposed to unveil the mechanism of GLS1 regulation in HCC cells.
Conclusion
Our study identified a novel signaling pathway, independent of c-Myc, that controls GLS1 upregulation in HCC through NF-κB p65 activation. Elevated GLS1 promotes tumor cell proliferation and correlates with neoplasm histological grade; furthermore, SurvExpress analyses indicate that p65-GLS1 expression correlates with poor prognosis of HCC patients. Further studies are required to search for upstream factors that control GLS1 expression through the activation of NF-κB p65.
Data sharing statement
The authors declare that all the data supporting the findings of this study are available within the article and from the corresponding author on reasonable request.
Acknowledgment
The authors thank the Department of Pathology in Cangzhou Hospital of Integrated TCM-WM, Hebei, for helping with the IHC staining.
Author contributions
SQ, MD, and LM designed and interpreted the experiments. MD, LM, FZ, SL, JH, RY, and SQ performed the experiments. SQ, MD, and LM wrote and edited the manuscript. All authors contributed toward data analysis, drafting and revising the paper and agree to be accountable for all aspects of the work.
Disclosure
The authors declare no conflict of interest in this work.
References
Goh GB, Chang PE, Tan CK. Changing epidemiology of hepatocellular carcinoma in Asia. Best Pract Res Clin Gastroenterol. 2015;29(6):919–928. | ||
Desai JR, Ochoa S, Prins PA, He AR. Systemic therapy for advanced hepatocellular carcinoma: an update. J Gastrointest Oncol. 2017;8(2):243–255. | ||
Qie S, Liang D, Yin C, et al. Glutamine depletion and glucose depletion trigger growth inhibition via distinctive gene expression reprogramming. Cell Cycle. 2012;11(19):3679–3690. | ||
Hanahan D, Weinberg RA. Hallmarks of cancer: the next generation. Cell. 2011;144(5):646–674. | ||
Shang RZ, Qu SB, Wang DS. Reprogramming of glucose metabolism in hepatocellular carcinoma: Progress and prospects. World J Gastroenterol. 2016;22(45):9933–9943. | ||
Wang D, Meng G, Zheng M, et al. The Glutaminase-1 Inhibitor 968 Enhances Dihydroartemisinin-Mediated Antitumor Efficacy in Hepatocellular Carcinoma Cells. PLoS One. 2016;11(11):e0166423. | ||
Altman BJ, Stine ZE, Dang CV. From Krebs to clinic: glutamine metabolism to cancer therapy. Nat Rev Cancer. 2016;16(10):619–634. | ||
Zhang C, Liu J, Zhao Y, et al. Glutaminase 2 is a novel negative regulator of small GTPase Rac1 and mediates p53 function in suppressing metastasis. Elife. 2016;5:e10727. | ||
Yu D, Shi X, Meng G, et al. Kidney-type glutaminase (GLS1) is a biomarker for pathologic diagnosis and prognosis of hepatocellular carcinoma. Oncotarget. 2015;6(10):7619–7631. | ||
Liu J, Zhang C, Lin M, et al. Glutaminase 2 negatively regulates the PI3K/AKT signaling and shows tumor suppression activity in human hepatocellular carcinoma. Oncotarget. 2014;5(9):2635–2647. | ||
Xu P, Oosterveer MH, Stein S, et al. LRH-1-dependent programming of mitochondrial glutamine processing drives liver cancer. Genes Dev. 2016;30(11):1255–1260. | ||
Ge Y, Yan X, Jin Y, et al. MiRNA-192 [corrected] and miRNA-204 Directly Suppress lncRNA HOTTIP and Interrupt GLS1-Mediated Glutaminolysis in Hepatocellular Carcinoma. PLoS Genet. 2015;11(12):e1005726. | ||
Jennis M, Kung CP, Basu S, et al. An African-specific polymorphism in the TP53 gene impairs p53 tumor suppressor function in a mouse model. Genes Dev. 2016;30(8):918–930. | ||
Velázquez-Villegas LA, Charabati T, Contreras AV, Alemán G, Torres N, Tovar AR. PPARα Downregulates Hepatic Glutaminase Expression in Mice Fed Diets with Different Protein:Carbohydrate Ratios. J Nutr. 2016;146(9):1634–1640. | ||
Park MH, Hong JT. Roles of NF-κB in Cancer and Inflammatory Diseases and Their Therapeutic Approaches. Cells. 2016;5(2).pii:E15. | ||
Pires BR, Mencalha AL, Ferreira GM, et al. NF-kappaB Is Involved in the Regulation of EMT Genes in Breast Cancer Cells. PLoS One. 2017;12(1):e0169622. | ||
Shinoda K, Kuboki S, Shimizu H, et al. Pin1 facilitates NF-κB activation and promotes tumour progression in human hepatocellular carcinoma. Br J Cancer. 2015;113(9):1323–1331. | ||
Qie S, Chu C, Li W, Wang C, Sang N. ErbB2 activation upregulates glutaminase 1 expression which promotes breast cancer cell proliferation. J Cell Biochem. 2014;115(3):498–509. | ||
Rathore MG, Saumet A, Rossi JF, et al. The NF-κB member p65 controls glutamine metabolism through miR-23a. Int J Biochem Cell Biol. 2012;44(9):1448–1456. | ||
Wang JB, Erickson JW, Fuji R, et al. Targeting mitochondrial glutaminase activity inhibits oncogenic transformation. Cancer Cell. 2010;18(3):207–219. | ||
Rhodes DR, Yu J, Shanker K, et al. ONCOMINE: a cancer microarray database and integrated data-mining platform. Neoplasia. 2004;6(1):1–6. | ||
Oncomine™ [www.oncomine.org]. Massachusetts: Thermo Fisher Scientific Inc. Available from: www.oncomine.org. Accessed April 11, 2018. | ||
cBioPortal for Cancer Genomics [www.cbioportal.org]. New York: Memorial Sloan Kettering Cancer Center; Version 1.13.3-SNAPSHOT. Available from: www.cbioportal.org. Accessed April 11, 2018. | ||
Cancer Genome Atlas Network. Comprehensive molecular portraits of human breast tumours. Nature. 2012;490(7418):61–70. | ||
Gao J, Aksoy BA, Dogrusoz U, et al. Integrative analysis of complex cancer genomics and clinical profiles using the cBioPortal. Sci Signal. 2013;6(269):pl1. | ||
Cerami E, Gao J, Dogrusoz U, et al. The cBio cancer genomics portal: an open platform for exploring multidimensional cancer genomics data. Cancer Discov. 2012;2(5):401–404. | ||
Sun B, Qie S, Zhang S, et al. Role and mechanism of vasculogenic mimicry in gastrointestinal stromal tumors. Hum Pathol. 2008;39(3):444–451. | ||
Qie S, Majumder M, Mackiewicz K, et al. Fbxo4-mediated degradation of Fxr1 suppresses tumorigenesis in head and neck squamous cell carcinoma. Nat Commun. 2017;8(1):1534. | ||
Aguirre-Gamboa R, Gomez-Rueda H, Martinez-Ledesma E, et al. SurvExpress: an online biomarker validation tool and database for cancer gene expression data using survival analysis. PLoS One. 2013;8(9):e74250. | ||
SurvExpress Biomarker validation for cancer gene expression [http://bioinformatica.mty.itesm.mx:8080/Biomatec/SurvivaX.jsp]. Monterrey, Nuevo León, México: Cátedra de Bioinformática, Tecnológico de Monterrey. Available from: http://bioinformatica.mty.itesm.mx:8080/Biomatec/SurvivaX.jsp. Accessed April 12, 2018. | ||
Yin C, Qie S, Sang N. Carbon source metabolism and its regulation in cancer cells. Crit Rev Eukaryot Gene Expr. 2012;22(1):17–35. | ||
Pavlova NN, Thompson CB. The Emerging Hallmarks of Cancer Metabolism. Cell Metab. 2016;23(1):27–47. | ||
Gao P, Tchernyshyov I, Chang TC, et al. c-Myc suppression of miR-23a/b enhances mitochondrial glutaminase expression and glutamine metabolism. Nature. 2009;458(7239):762–765. | ||
Thangavelu K, Pan CQ, Karlberg T, et al. Structural basis for the allosteric inhibitory mechanism of human kidney-type glutaminase (KGA) and its regulation by Raf-Mek-Erk signaling in cancer cell metabolism. Proc Natl Acad Sci U S A. 2012;109(20):7705–7710. | ||
Yuneva M, Zamboni N, Oefner P, Sachidanandam R, Lazebnik Y. Deficiency in glutamine but not glucose induces MYC-dependent apoptosis in human cells. J Cell Biol. 2007;178(1):93–105. | ||
Xiang Y, Stine ZE, Xia J, et al. Targeted inhibition of tumor-specific glutaminase diminishes cell-autonomous tumorigenesis. J Clin Invest. 2015;125(6):2293–2306. |
 © 2018 The Author(s). This work is published and licensed by Dove Medical Press Limited. The
full terms of this license are available at https://www.dovepress.com/terms
and incorporate the Creative Commons Attribution
- Non Commercial (unported, 3.0) License.
By accessing the work you hereby accept the Terms. Non-commercial uses of the work are permitted
without any further permission from Dove Medical Press Limited, provided the work is properly
attributed. For permission for commercial use of this work, please see paragraphs 4.2 and 5 of our Terms.
© 2018 The Author(s). This work is published and licensed by Dove Medical Press Limited. The
full terms of this license are available at https://www.dovepress.com/terms
and incorporate the Creative Commons Attribution
- Non Commercial (unported, 3.0) License.
By accessing the work you hereby accept the Terms. Non-commercial uses of the work are permitted
without any further permission from Dove Medical Press Limited, provided the work is properly
attributed. For permission for commercial use of this work, please see paragraphs 4.2 and 5 of our Terms.