Back to Journals » International Journal of Nanomedicine » Volume 17
Novel Mucoadhesive Chitosomes as a Platform for Enhanced Oral Bioavailability of Cinnarizine
Authors Oransa HA, Boughdady MF ![]() , EL-Sabbagh HM
, EL-Sabbagh HM
Received 12 August 2022
Accepted for publication 12 November 2022
Published 24 November 2022 Volume 2022:17 Pages 5641—5660
DOI https://doi.org/10.2147/IJN.S384494
Checked for plagiarism Yes
Review by Single anonymous peer review
Peer reviewer comments 3
Editor who approved publication: Prof. Dr. Anderson Oliveira Lobo
Hagar Ahmed Oransa, Mariza Fouad Boughdady, Hassan Mohamed EL-Sabbagh
Department of Pharmaceutics, Faculty of Pharmacy, Mansoura University, Mansoura, Dakahlia, Egypt
Correspondence: Hagar Ahmed Oransa, Department of Pharmaceutics, Faculty of Pharmacy, Mansoura University, El-Gomhoria Street, Mansoura, Dakahlia, Egypt, Tel +201065838485, Fax +20502247496, Email [email protected]
Purpose: Cinnarizine (CIN) is a class II BSC drug, suffering from erratic bioavailability due to its pH-dependent solubility. It has preferential absorption in the stomach. In this study, new chitosan (CS) coated niosomes of CIN (CIN-loaded chitosomes) have been developed to extend the gastric retention and ameliorate CIN oral bioavailability.
Methods: Various CIN-loaded niosomes were fabricated by thin-film hydration technique and fully characterized. Based on the predetermined criteria of low particle size (PS) and high entrapment efficiency percent (EE%), niosomal formulation F1 was selected and further coated with different CS concentrations. The optimized chitosomal formulation (C2) was evaluated through solid state characterization and mucoadhesive efficiency testing. It was also subjected to cytotoxicity study on Caco-2 cells; besides, in vitro drug release, stability and pharmacokinetic studies were assessed.
Results: The optimized chitosomal formulation (C2) exhibited an EE% of 58.30± 2.75%, PS of 440 ± 13.03 nm, PDI of 0.335± 0.21 and ZP of +28.1± 0.10 mv. Solid state characterization results revealed the compatibility between the vesicle components and the entrapment of CIN within niosomal vesicles. C2 formulation demonstrated favorable mucoadhesive efficiency. The cytotoxicity study on Caco-2 cells manifested the safety of the optimized chitosomal formulation (C2) over the free drug. Additionally, it displayed a remarkable sustaining of CIN in vitro release up to 8 h and exhibited a good stability at the refrigerated temperature up to 3 months. In vivo pharmacokinetic assessment revealed that the CIN bioavailability from the optimized chitosomal formulation C2 was enhanced by 2.79 and 1.92 folds compared to the free drug and uncoated niosomal formulation F1, respectively. The priority of the chitosomal formulation (C2) over the niosomal one (F1) was also conferred.
Conclusion: Novel formulation of chitosan coated niosomes (chitosomes) could be presented as a promising platform to improve the oral bioavailability of drugs with narrow absorption window.
Keywords: cinnarizine, niosome, chitosan, mucoadhesion
Introduction
Cinnarizine (CIN) (Figure 1) (1-(diphenylmethyl)-4-(3-phenyl-2-propenyl) piperazine) is a calcium channel blocker and antihistaminic drug, which is used in the treatment of nausea, vomiting, vertigo, motion sickness and Meniere’s disease. It has mainly a peripheral anti-vasoconstrictive action.1,2
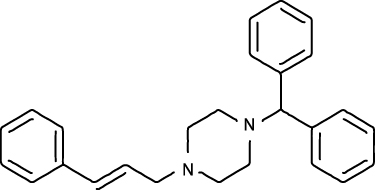 |
Figure 1 Chemical structure of CIN. |
CIN is a lipophilic drug that belongs to class II BSC. It is a weak base that suffers from poor solubility. CIN is characterized by erratic bioavailability due to pH-dependent solubility (higher solubility at pH<4) with preferential absorption in the stomach.3,4 Furthermore, frequent administration of CIN is usually required due to its short half-life (3–6 h).5 Consequently, Several gastroretentive drug delivery systems were adopted to enhance CIN bioavailability like floating tablets,6 floating beads,4,5 and gastroretentive microballoons.7
Amongst the innovative drug delivery systems, vesicular structures have gained a distinct role in enhancing the bioavailability of various active pharmaceutical ingredients than conventional dosage forms; one of these outstanding systems is niosomes. They are shaped by the self-assembly of nonionic surfactants with or without cholesterol (CH) and thus gaining a unique structure that makes niosomes capable of encapsulating both lipophilic and hydrophilic substances.8,9
Niosomes have attracted a conspicuous attention owing to their ability to improve the solubility of poorly soluble substances, increase drug permeation, sustain drug release,10,11 and enhance the drug stability against oxidation; besides, they possess good compatibility with biological systems.12 Additionally, their surface modification is much easier than that of liposomes due to the higher stability of niosomes.13 Niosomal surface modifications could be employed for various purposes like imparting a bioadhesive property14 and improving the target specificity in cancer treatment.15 Interestingly, surface modification by positive charge introduction can be advantageous to improve system stability, allow effective drug delivery in addition to overcoming conventional formulation drawbacks. Generally, positively charged drug delivery carriers can regulate the drug release and boost drug uptake by electrostatic interaction with mucin in gastrointestinal tract (GIT) membrane.16
Chitosan (CS) (deacetylated chitin, poly (D-glucosamine)) is a biocompatible, biodegradable and bioadhesive polymer. CS-loaded formulations were proven to exhibit improved drug solubility, prolonged drug retention in gastrointestinal tract and enhanced drug bioavailability.17 Additionally, CS is widely employed in gastroretentive drug delivery; it has notably the feasibility to create an electrostatic complex with anionic mucous layer in acidic conditions, thus increasing the gastric residence time of drugs.18 Hence, it was verified as an absorption promoter that has the ability to extend the tight junctions between epithelial cells.
In this context, several attempts have been endeavored to prepare CIN-loaded niosomes,19 nevertheless none of them has addressed niosomal coating with CS. In the current study, new CS-coated niosomes of CIN (CIN-loaded chitosomes) were suggested as a promising strategy to combine the virtues of CS in increasing the gastric residence time of CIN through muco-adhesion, as well as achieving higher drug absorption.
Materials and Methods
Materials
Cinnarizine (CIN) (CAS no. 298-57-7, Batch no. CIN/08161056) was kindly provided from Amoun pharmaceutical company, Egypt. Sorbitan monolaurate (span 20) was obtained from SDFCL, India. Cholesterol (CH) and sorbitan monostearate (span60) were procured from Loba Chemie, India. HPLC grades of chloroform, methanol, acetonitrile, ethanol and Millipore filter (0.45 µm) were obtained from Cornell lab, Cairo, Egypt. Chitosan (CS) (deacetylation degree ≥75% with low molecular weight) and mucin (from porcine stomach) were purchased from Sigma-Aldrich Co. (St Louis, MO, USA). Analytical grades of glacial acetic acid (99%), potassium dihydrogen orthophosphate and disodium hydrogen phosphate were obtained from El-Nasr Pharmaceutical Chemical Co., Cairo, Egypt.
Preparation of CIN-Loaded Niosomes
Cinnarizine niosomes were fabricated by the previously reported thin-film hydration method.20 Niosomes were prepared using span (20 or 60) and CH in different molar ratios (3:1, 2:1, 1:1 and 1:2) as illustrated in Table 1. Ten milligrams of CIN were added to each formulation.
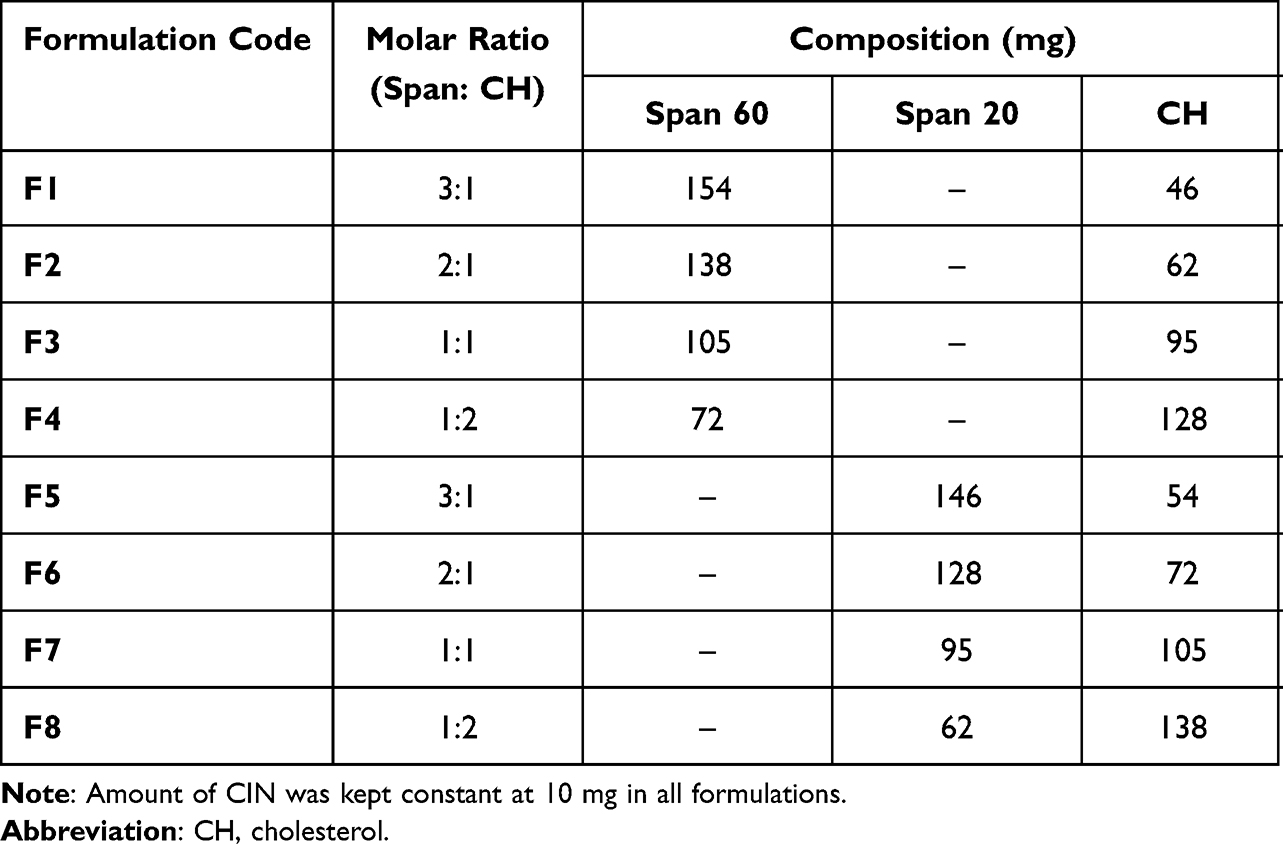 |
Table 1 Composition of CIN-Loaded Niosomes |
Accurately, 200 mg of surfactant and CH, in addition to the drug, were dissolved in 10 mL methanol/chloroform mixture (2:1 v/v). The solvents were evaporated at 60±2 °C under reduced pressure using a rotary evaporator (Wheaton rotary evaporator, USA) until a thin dry film was obtained. The film was then hydrated for 1 h at 60±2 °C with 10 mL of deionized water until a milky suspension was obtained. The niosomal suspension was sonicated at 25°C for 10 min using an ultrasonic bath (Sonix IV, SS101H230, USA) in order to decrease the particle size of the prepared vesicles.14 The different obtained formulations were kept overnight in the refrigerator at 4±1 °C for further characterization.21
Characterization of CIN-Loaded Niosomes
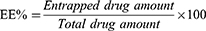
Drug Entrapment Efficiency (EE%) and Drug Loading Efficiency Percent (DLE%)
The obtained dispersions were centrifuged at 4°C for 90 min at 13,000 rpm using cooling centrifuge (CE16-4X100RD, Acculab, USA), followed by washing with deionized water to ensure the removal of unentrapped CIN. Then, EE% was estimated directly by the lysis of the precipitated niosomal vesicles in 100 mL absolute ethanol and sonication at 25°C for 20 min using an ultrasonic bath (Sonix IV USA, SS101H230) till the formation of a clear solution. Finally, the amount of the entrapped CIN was quantified spectrophotometrically (ultraviolet-visible double beam spectrophotometer, Labomed Inc., USA) at 253 nm. A plain formulation, treated similarly, served as blank. The EE % was calculated from Equation (1).22
Drug loading efficiency percent (DLE%) was estimated by dividing the amount of entrapped drug by the weight of CIN-loaded niosomal formulation according to Equation (2).

Measurements of Particle Size (PS) and Polydispersity Index (PDI)
CIN-loaded niosomes were evaluated through PS and PDI using Malvern Zetasizer (Malvern Instruments Limited, UK) via dynamic light scattering technique. The freshly prepared niosomal suspensions were properly diluted with deionized water in a ratio of 1:20 before the measurements. Three measurements were made for each sample and the mean was determined.
Zeta Potential (ZP)
The prepared niosomal dispersions were suitably diluted with deionized water and estimated for ZP values using photon correlation spectroscopy instrument (Malvern Instruments Limited, UK). The ZP values were recorded based on electrophoretic mobility of the particles under an electric field. Each experiment was performed in triplicate.
Preparation of CIN-Loaded Chitosomes
The selected formula (F1) was coated with CS at concentrations of 0.1, 0.2 and 0.3 mg/mL to impart the prepared niosomes a mucoadhesive property. Chitosan was dissolved in acetic acid solution (0.1% v/v), sonicated (Sonix IV USA, SS101H230) then filtered. Ten milliliters of each CS solution were added dropwise to an equal volume of the niosomal suspension while stirring at 500 rpm by magnetic stirrer (Heidolph, U.S.A.). The obtained dispersion was kept for 2 h on the stirrer. Three chitosomal formulations (C1, C2 and C3) were obtained after coating the selected formulation (F1) with CS solutions of 0.1, 0.2 and 0.3 mg/mL, respectively.
Characterization of CIN-Loaded Chitosomes
Measurement of EE%, DLE%, PS, PDI and ZP
EE%, DLE%, PS, PDI and ZP of the prepared chitosomes were estimated as mentioned before in the characterization of CIN-loaded niosomes section.
Transmission Electron Microscopy (TEM)
The niosomal formulation (F1) and the optimized chitosomal formulation (C2) were morphologically examined by transmission electron microscope (JEOL JEM 2100, Tokyo, Japan) to investigate the impact of CS coat on the morphology of the prepared niosomes. One milliliter of the freshly prepared niosomal suspensions was diluted twenty fold with deionized water. After this, one drop was dripped on a carbon-coated copper grid. The extra liquid was removed with filter paper and the samples were allowed to dry at room temperature. The samples were examined directly without staining. The image was captured by digital micrograph and analyzed using imaging viewer software.
Scanning Electron Microscopy (SEM)
SEM (JSM-IT 200; JEOL, Tokyo, Japan) was utilized to scrutinize the surface characteristics of the freeze-dried powder of the niosomal formulation (F1) and the optimized chitosomal formulation (C2). The sample was fixed on metal stub with the aid of the double-sided adhesive carbon tapes. It was then examined at 20 kV after coating with a gold layer.
Fourier Transform Infrared (FTIR) Spectroscopy Analysis
FTIR spectra of CIN, CH, span 60, CS, their physical mixture in weight ratio corresponding to the optimized chitosomal formulation (C2), as well as the lyophilized chitosomal formulation (C2) and its corresponding plain one were reported using FTIR spectrophotometer (Madison Instruments, Middleton, WI, USA) over a range from 500 cm−1 to 4000 cm−1. Samples were prepared with potassium bromide.
Differential Scanning Calorimetry (DSC)
Thermograms of CIN, CH, span 60, CS, their physical mixture corresponding to the optimized chitosomal formulation (C2), as well as the lyophilized chitosomal formulation (C2) and its corresponding plain one were obtained using DSC (Perkin-Elmer, New York, USA), which was calibrated with indium. Samples were sealed in standard aluminum pans. They were then heated under nitrogen gas (20 mL/min) over a range of 25–350°C with a rate of 10°C/min.
X-Ray Powder Diffraction (XRPD)
X-ray diffractometer (FW 1700 X-ray diffractometer; Philips, Amsterdam, the Netherlands) was used to analyze CIN, CH, span 60, CS, their physical mixture corresponding to the optimized chitosomal formulation (C2), in addition to the lyophilized chitosomal formulation (C2) and its corresponding plain one. The examination was assessed at 45 kV under the monochromatized Cu Kα radiation at 2θ angle over a range from 3°to 50° with a current of 9 mA.
Mucoadhesive Strength
Mucoadhesive efficiencies of CIN-loaded niosomal formulation (F1) and chitosomal formulation (C2) were estimated by measuring the adsorption of mucin on the formulations. Mucin dispersion was prepared by dispersing 50 mg of mucin in 100 mL phosphate buffer saline (pH 7.4); then, the dispersion was kept on the stirrer (Heidolph, USA) at 500 rpm overnight before the experiment. Equal volumes of 0.5 mg/mL mucin dispersion (in PBS (pH 7.4)) and either F1 or C2 (in PBS (pH 7.4)) were mixed and shaken for 2 h using thermostatically controlled shaking water bath (GFL 3033-Shaking incubator, Germany) at 37°C. Then, the mixtures were centrifuged at 11,000 rpm for 1 h (Sigma, D-37250, Germany). The supernatants were collected and analyzed spectrophotometrically at 257 nm (ultraviolet-visible double beam spectrophotometer, Labomed Inc., USA) for free mucin amount. A standard calibration curve with mucin concentrations of 50, 100, 150, 200, 250, 300, 350 and 400 µg/mL was pre-constructed. The mucoadhesive efficiency was calculated according to Equation (3).23
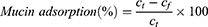
Where Ct is the total mucin amount used and Cf is the free mucin amount in the supernatant.
Cytotoxicity Study
The cytotoxicity of CIN and the optimized chitosomal formulation (C2) were evaluated on human colorectal adenocarcinoma cells (Caco-2 cells), which were obtained from American Type Culture Collection (Manassas, VA, USA) using methyl thiazolyl tetrazolium (MTT) assay. The culture medium for the cells was RPMI-1640 with 10% fetal bovine serum. The cells were seeded in 96 well plates for the cell confluency; then treated with either the free CIN or the chitosomal formulation C2 at different concentrations (1, 5, 10, 20, 40, 80 and 100 µg/mL of each). The corresponding plain chitosomal formulation C2 was treated similarly and served as a blank group, while the control group was the untreated cells. The plates were incubated for 24 h in 90% relative humidity and 5% CO2 at 37°C.
After that, twenty microliters of MTT solution (5 mg/mL) was added to the cells and allowed to incubate in a dark place at 37°C for 4 h. Then, the formed formazan crystals were dissolved by adding 200 µL acidic isopropanol for 1 h. The cell viability percent was calculated from Equation (4) after recording the absorbance of the solubilized formazan at 570 nm by a microplate reader (Biotek instruments, Inc., Winooski, VT, USA).24
In vitro Drug Release
CIN release studies from the niosomal formulation (F1), the optimized chitosomal formulation (C2) and the CIN solution were evaluated by the dialysis method using dialysis bags (MW cut off: 12,000–14,000 Da, Spectrum Medical Industries Inc., LA, USA). The bags were soaked in 0.1 N HCl (pH 1.2) for 24 h before the experiment. Equivalent amount of 2 mg of CIN from the freeze-dried niosomal formulation (F1) or chitosomal formulation (C2) were reconstituted with 2 mL of the release medium and placed in the dialysis bag. The two ends of the bag were sealed with clips. Then, the dialysis bag was hanged in 100 mL of the release medium (0.1 N HCl (pH 1.2)) that was shaken at 37°C and 100 rpm using thermostatically controlled shaking water bath (GFL 3033-Shaking incubator, Germany). Samples of 3 mL were withdrawn at predetermined time intervals (0.5, 1, 1.5, 2, 2.5, 3, 4, 5, 6, 7 and 8 h) and replenished with an equal volume of fresh release medium to maintain sink conditions. The withdrawn samples were filtered using 0.45 µm Millipore filter. The concentration of CIN released in the medium was quantified spectrophotometrically (ultraviolet-visible double beam spectrophotometer, Labomed Inc., USA) at 252 nm. A 2 mL of CIN solution (1mg/mL of CIN in 0.1 N HCl (pH 1.2)) was utilized as a control, and each experiment was performed in triplicate.
Drug Release Kinetics
In vitro drug release data from the niosomal formulation (F1) and the optimized chitosomal formulation (C2) were fitted to different mathematical kinetic models: Zero order, first order25 and Higuchi model.26 The release model describing the drug release kinetics was selected according to the highest correlation coefficient (r2). Additionally, Korsmeyer–Peppas Equation27 was used to explain the drug release mechanism according to the following Equation (5).

Where mt/m∞ is the fraction of the drug released, t is the release time, k is the kinetic constant, and n is the diffusional exponent of the drug release which equals to the slope of the curve representing the relation between log mt/m∞ vs log t.
Physical Stability Study
The physical stability study of the optimized chitosomal formulation (C2) suspension was evaluated at refrigerated temperature (4 °C ±1 °C) and at room temperature (25 °C ±2 °C). Freshly prepared chitosomal formulations (C2) were stored in screw capped glass bottles for 3 months28 and examined in terms of PS, PDI, ZP and drug retention % (DR %) at zero time and every month of the storage period. The optimized chitosomal formulation (C2) powder was examined concerning their physical appearance and DR%.
In vivo Bioavailability Study
Experimental Animal Protocol
Male Sprague Dawley rats (average weight 300±20 g) were caged with free access to food and water for one week before dosing. The rats were fasted prior to dosing for 12 h but free access of water was allowed. The study was approved by the Research Ethics Committee of Mansoura University, Egypt (code no. 2017-62, approval date: July 2017) in accordance with “principles of laboratory animal care NIH publication revised 1985”.
The rats were divided into three groups (n=6 for each group). Group I administered 80 mg/kg of CIN in suspension form, while groups II and III received what is equivalent from the freeze-dried powder of the selected niosomal formulation F1 and the optimized chitosomal formulation C2, respectively. The administered doses were dispersed in three milliliters aqueous suspension of sodium carboxy methyl cellulose (1% w/v) and administered by oral gavage under light ether anesthesia.
Sample Handling
Blood samples were collected from the retro-orbital venous plexus of the rats in heparinized tubes after (0.5, 1, 2, 4, 5, 6, 8, 10 and 12 h) following drug dosing. The plasma samples were separated after centrifugation (Centrifuge, Hettich Micro 22 R, Germany) of the blood samples for 10 min at 5000 rpm and kept at −20°C until analysis.
High Performance Liquid Chromatography (HPLC) Analysis
Extraction Method
A 500 µL of acetonitrile was added to 250 µL of each plasma sample and mixed well. The mixture was vortexed for 10 min using a vortex tube mixer (Gemmy Industrial Corporation, Taiwan) and centrifuged (Centrifuge, Hettich Micro 22 R, Germany) for 15 min at 9000 rpm. The supernatant was filtered using 0.45 µm Millipore filter and transferred to an Eppendorf tube. Finally, 100 µL was injected into a High-Performance Liquid Chromatography (HPLC) system.29
Chromatographic Conditions
The concentrations of CIN in the prepared plasma samples were assayed by an HPLC analysis method,30 with some modifications. The separation was accomplished by an HPLC system (Waters 2695 Alliance HPLC system equipped with a Waters 996 photodiode array detector) with C18 column (4.6x250mm, 5µm, Xterra) and detection at 254 nm. The mobile phase consisted of 0.01M phosphate buffer adjusted to pH 3 with orthophosphoric acid and acetonitrile (60:40% v/v). It was isocratically eluted with a rate of 1 mL/min.
Calibration Curve and Validation Method
Aliquots (250 µL) of drug-free plasma were spiked with 100 µL of different standard working CIN solutions (0.3125–3.125 µg/mL) prepared by different dilutions of 100 µg/mL CIN standard stock solution in methanol. Acetonitrile (500 µL) was added and subjected to the same aforementioned analysis procedure.
Validation of this method was inspected with respect to linearity, selectivity/specificity, precision and accuracy. Quantification limit (QL) and detection limit (DL) were calculated according to ICH guidelines31 from the following Equations (6 and 7).


where σ is the standard deviation of y intercept and S is the slope of the calibration curve.
Pharmacokinetic Study
The data obtained from the curve of CIN plasma concentration versus time was analyzed according to a non-compartmental model using GraphPad Prism 5 software computer program (GraphPad Software Inc., San Diego, CA, v5.03). The pharmacokinetic parameters including the maximum plasma concentration (Cmax), the time to reach the maximum plasma concentration (Tmax), the half-life time (t1/2), the elimination rate constant (kel), the area under the curve from 0 to ∞ (AUC0-∞), the area under the first moment curve from 0 to ∞ (AUMC0-∞) and the mean residence time (MRT) were calculated. Additionally, relative bioavailability (%f rel) of CIN from the niosomal formulation (F1) and the optimized chitosomal formulation (C2) compared to that of free CIN was calculated from the following Equation (8):

In vitro-in vivo Correlation
In vivo percentage drug absorbed from the optimized chitosomal formulation (C2) was plotted against the in vitro percentage drug released at time intervals 0.5, 1, 2 and 4 h in order to determine (r2) for in vitro-in vivo correlation of the optimized chitosomal formulation (C2). Wagner Nelson model32 was used to calculate the in vivo percentage absorbed from the drug according to the following Equation (9).
Where, ct is the plasma concentration of the drug at time t, kel is the elimination rate constant, AUC0-t is the area under the curve from time zero to time t, and AUC0-∞ is the area under the curve from time zero to time ∞.
Statistical Analysis
One-way ANOVA followed by Tukey–Kramer multiple comparisons test as well as Student unpaired t-test of significance p<0.05 using GraphPad Prism 5 software computer program (GraphPad Software Inc., San Diego, CA, v5.03) were used to accomplish the statistical analysis of the data which were expressed as mean ± SD and mean ± SEM for in vitro and in vivo data, respectively.
Results and Discussion
Characterization of CIN-Loaded Niosomes
Drug Entrapment Efficiency (EE%) and Drug Loading Efficiency Percent (DLE%)
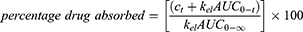
The obtained niosomal formulations exhibited EE% values ranging from 31.51±2.97 to 78.72±2.54, while the DLE% values of all prepared niosomal formulation ranged from 1.44±0.08 to 3.86±0.14.
Data in Table 2, revealed that the efficiency of CIN encapsulation is strongly affected by the ratio of CH to surfactant. EE% is significantly (p<0.05) increased with increasing CH ratio up to a certain limit. Regarding the niosomes prepared with span 60, F1 exhibited an EE% of 68.57±1.40% which was significantly (p<0.05) increased to 78.72±2.54% for F2 formulation upon increasing the CH ratio. On the contrary, further increase of the CH ratio emerged a significant (p<0.05) reduction in EE% (71.97±1.50 and 49.66± 2.93%) for F3 and F4 formulations, respectively. Similar results were also observed for span 20 which displayed the highest EE% for F7 formulation (55.23±0.88%) and significantly (p<0.05) decreased to 50.52±1.65% for F8 formulation. It was reported that upon increasing CH ratio, there is an increase in the niosomal stability and hydrophobicity, as well as a decrease in their permeability. CH is a membrane stabilizing agent, which imparts rigidity to the niosomes and improves the encapsulation of the hydrophobic drug within the vesicular bilayer. However, further increase of CH ratio may compete with CIN molecules for the available packing spaces, thus forcing the drug out with a consequent reduction in EE%.33
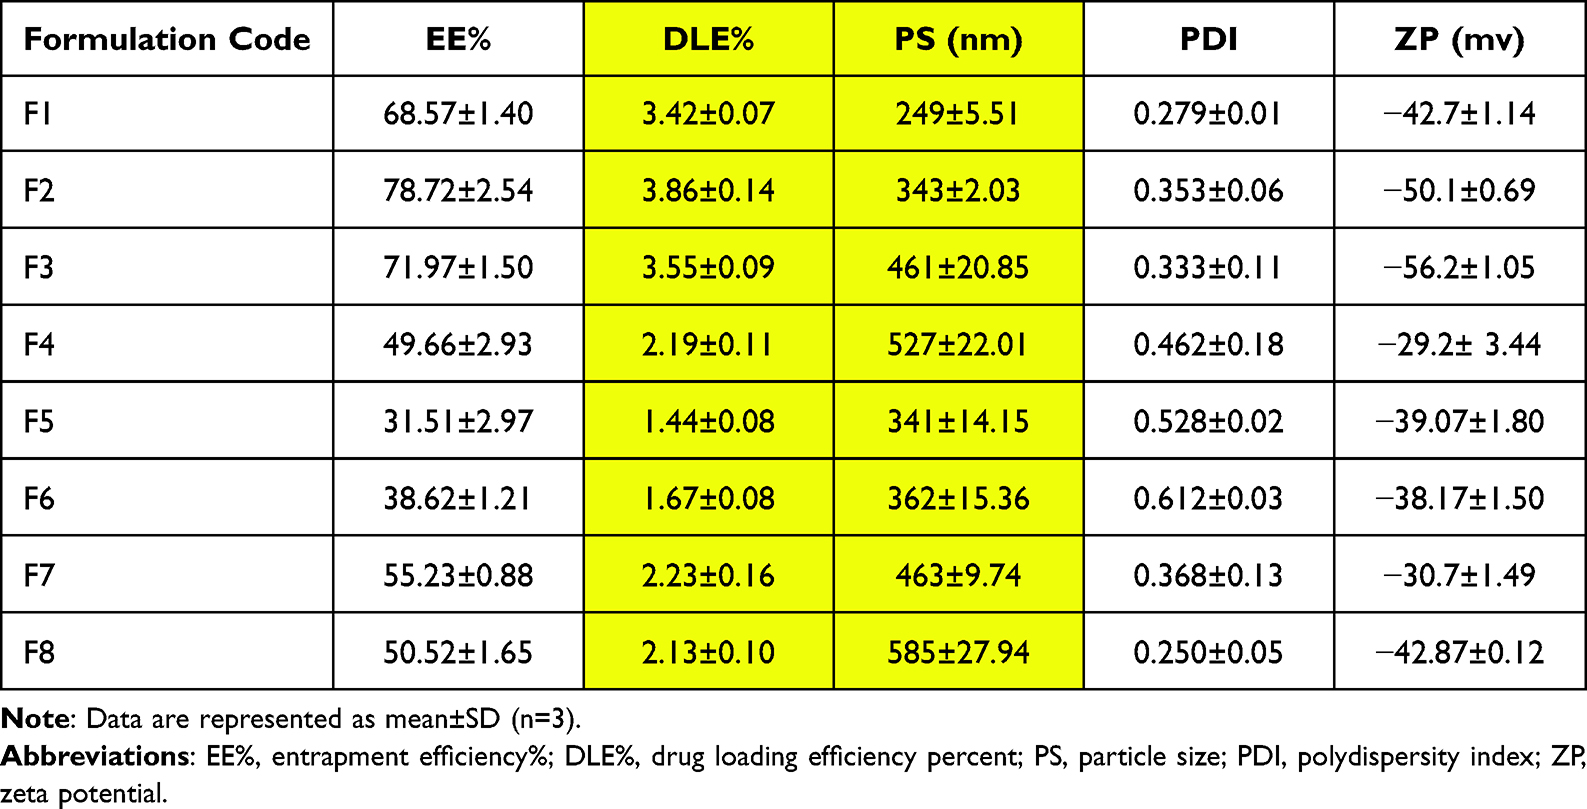 |
Table 2 Characterization of CIN-Loaded Niosomes |
Interestingly, the type of the surfactant had also demonstrated a prominent influence on EE% and DLE%. Table 2 divulged that the niosomes formulated with span 60 manifested higher EE% and DLE% than their analogues prepared with span 20 at the same molar ratios. This may be ascribed to the lower HLB value, the longer chain structure and the greater phase transition temperature of span 60 than span 20 which contributed to higher EE% and DLE% values.34
Careful examination of Table 2 clarifies that in the case of niosomes prepared with span 60, F2 formulation (prepared with span 60: CH of 2:1 molar ratio) exhibited the highest EE%. Regarding span 20, the maximum EE% was exhibited for F7 formulation (prepared with span 20: CH of 1:1 molar ratio). The relatively high hydrophobicity of span 60 expedited the formation of the bilayer membrane vesicles, hence accommodation of the drug with a lesser amount of CH. Contrastingly, the higher hydrophilicity of span 20 had a major impact in the requirement of larger CH amount for maximum EE%.35
Measurements of PS and PDI
PS and PDI are two leading factors in the characterization of the prepared niosomal formulations. As shown in Table 2, the particle size of CIN-loaded niosomes was gradually increased with the increment of CH ratio.36
Moreover, the HLB value of the surfactant used greatly affected the size of CIN-loaded niosomes; the size of the niosomes prepared by span 60 (HLB=4.6) was found to be smaller than those prepared by span 20 (HLB=8.6). This may be ascribed to the higher hydrophobicity of span 60, which decreases the surface free energy leading to the formation of smaller vesicles. Moreover, the water uptake of surfactants increases with increasing the hydrophilicity (higher HLB value), with a consequent increase in vesicular size.21,37
The values of PDI for the prepared CIN-loaded niosomes were ranged from 0.250±0.05 to 0.612±0.03 which are considered acceptable.38 The small PDI values could be related to the relatively homogeneous distribution of the prepared vesicles.39
Zeta Potential (ZP)
Zeta potential (ZP) is a measure of net charge on a niosomal surface. The repulsive force between the particles decreases when the charge on the niosomal surface decreases, leading to aggregation of particles with a consequent instability of the niosomal suspension.40
Results in Table 2 revealed that the ZP values of CIN-loaded niosomes ranged from −29.2±3.44 mv to −56.2±1.05 mv, indicating a good physical stability of the prepared niosomes. Generally, the ZP value around ±30 mV indicates the system stability due to the electrostatic repulsion between particles.41
From the previous results, F2 showed highest %EE (78.72±2.54%). However, F1 was preferred to F2, aside from its lower %EE (68.57±1.40%) because it possessed the smallest PS (249±5.51 nm). The size and the ZP value of F1 formulation were illustrated in Figure 2A and C, respectively. Accordingly, F1 was selected for further investigation through coating with CS to impart it mucoadhesive properties.
 |
Figure 2 Size distribution curve of niosomal formulation F1 (A), size distribution curve of chitosomal formulation C2 (B), ZP curve of niosomal formulation F1 (C) and ZP curve of chitosomal formulation C2 (D). |
Characterization of CIN-Loaded Chitosomes
Measurement of EE%, DLE%, PS, PDI and ZP
As illustrated in Table 3, the coated formulations exhibited a significant (p<0.05) reduction in %EE and DLE% when compared with uncoated one. This may be owed to CIN forcing out of the membrane bilayer due to the interaction between the positively charged CS and the negatively charged lipid.42 Furthermore, all the prepared chitosomes exhibited a significant (p<0.05) increase in PS, which confirmed the coating of the prepared niosomes with CS.42 Noticeably, the size of the prepared chitosomes significantly (p<0.05) increased with the increment of CS concentration.43 The most acceptable PS for mucoadhesion is 200–500 nm,23 which precludes the use of C3 for this purpose. The increase in the ZP value of the C1 formulation to −4.71±0.67 indicates an incomplete formation of CS coating around vesicles; however, the attainment of positive charge for both C2 and C3 formulations (+28.1±0.10 and +30.33±1.72, respectively) implies efficient coating with CS cationic polymer.44 Notably, the plateau in the ZP values of C2 and C3 emphasized the saturation of the chitosomal surface with the adsorbed CS.45 It is worthy to note that creation of positive charge through CS coating is essential for interaction with mucin layer and cellular uptake, thus improving CIN oral bioavailability. From the aforementioned results, C2 formulation exhibited an appropriate size of 440±13.03 nm and ZP value of +28.1±0.10 mv as shown in Figure 2B and D, respectively. For these reasons, C2 was chosen as an optimum formulation for further studies.
 |
Table 3 Characterization of CIN-Loaded Chitosomes |
Transmission Electron Microscopy (TEM)
TEM micrograph of the niosomal formulation F1 (Figure 3A) revealed the spherical contour of the prepared vesicles and the homogeneous distribution in nanometric size without aggregation. The photograph of the chitosomal formulation C2 (Figure 3B) showed a relative increase in size than the uncoated niosome (F1). The core is surrounded by a coat which is relatively faded in color. Conspicuously, these results emphasize the formation of the coat layer successfully.42,46
 |
Figure 3 TEM images of niosomal formulation F1 (A) and chitosomal formulation C2 (B). |
Scanning Electron Microscopy (SEM)
The SEM micrographs of the freeze-dried niosomal formulation F1 (Figure 4A) and the optimized chitosomal formulation C2 (Figure 4B) revealed that the shape of the particles was nearly spherical with a smooth surface in the nanosized range.47 It is noticeable that the particle size obtained by SEM was greater than that manifested by dynamic light scattering technique. This could be due to the transformation of the nanodispersion to the powder form by lyophilization technique, then coating of the dried formulation on the surface with gold before analysis under high vaccum.48
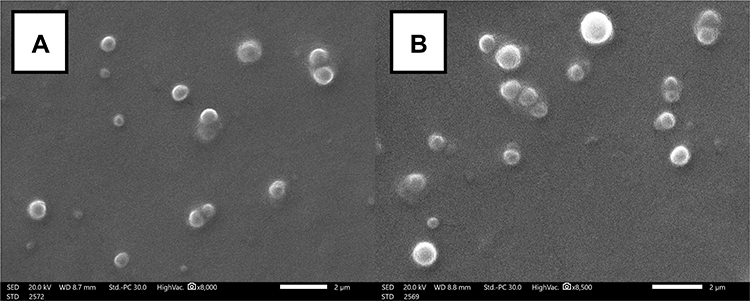 |
Figure 4 SEM image of the freeze-dried niosomal formulation F1 (A) and chitosomal formulation C2 (B). |
Fourier Transform Infrared (FTIR) Spectroscopy Analysis
FTIR spectroscopy is utilized to evaluate the compatibility between the drug and the niosomal components.49 As depicted in Figure 5, the FTIR spectrum of CIN (Figure 5 I) showed significant peaks corresponding to its functional groups. The peaks at 3066 and 3023cm−1 are due to CH stretching (aromatic and alkene). Peaks at 2959 and 2871cm−1 are indicative to CH stretch in the aliphatic chain. Besides, the peak at 1137 cm−1 is attributed to the C–N bond stretching. The peaks at 999 and 964 cm−1 are due to =C–H out of plane (aromatic and alkene).50
 |
Figure 5 FTIR spectra of CIN (I), CH (II), Span 60 (III), CS (IV), physical mixture (V), lyophilized plain C2 formulation (VI) and lyophilized CIN-loaded C2 formulation (VII). Abbreviations: FTIR, Fourier transform infrared spectroscopy; CIN, cinnarizine; CH, cholesterol; CS, chitosan; C2, optimized chitosomal formulation. |
The FTIR spectrum of CH (Figure 5 II) exhibited characteristic peak at 3422 cm−1 attributed to –OH stretching. The peak at 2868 cm−1 is due to symmetric stretching vibration of CH2, while the peak at 1465 cm−1 is assigned to CH2 and CH3 asymmetric stretching vibration. Besides, CH showed characteristic peaks at 1376 cm−1 which correlated to bending vibration of CH2 and CH3, as well as at 1056 cm−1, referring to bending vibration of C–O.51
The spectrum of span 60 (Figure 5 III) displayed specific peaks at 1468, 1739, 2919 and 3422 cm−1 corresponding to O–H bending, ester carbonyl stretching, C–H stretching and aliphatic O–H stretching, respectively.52
The CS spectrum (Figure 5 IV) exhibited peaks at 1658 and 1598 cm−1, due to amide I and amide II. The peaks at 1380–1426, 2875 and 3452 cm−1 are due to C–H bend, C–H stretch and N–H stretch, respectively.53
The physical mixture spectrum (Figure 5 V) of C2 components displayed the combined peaks of CH and span 60; this finding indicated that the drug was diluted by these components. Similarly, the FTIR spectra of the lyophilized plain chitosomal formulation C2 and the lyophilized CIN-loaded chitosomal formulation C2 (Figure 5 VI, VII respectively) exhibited characteristic peaks relating to CH and span 60, highlighting the absence of interaction between CIN and niosomal components. Moreover, the disappearance of the characteristic peaks of CIN in the case of CIN-loaded formulation could be related to the entrapment of CIN in the coated vesicle.49
Differential Scanning Calorimetry (DSC)
Figure 6 shows thermal analysis of pure CIN, CH, span 60, CS, their physical mixture corresponding to the optimized chitosomal formulation (C2), in addition to the lyophilized chitosomal formulation (C2) and its corresponding plain one.
 |
Figure 6 DSC thermograms of CIN (I), CH (II), Span 60 (III), CS (IV), physical mixture (V), lyophilized plain C2 formulation (VI) and lyophilized CIN-loaded C2 formulation (VII). Abbreviations: DSC, differential scanning calorimetry; CIN, cinnarizine; CH, cholesterol; CS, chitosan; C2, optimized chitosomal formulation. |
Figure 6 I elucidates the thermal behavior of CIN, showing a sharp melting endotherm at 123.71°C which indicates its crystalline nature.54 The DSC curves of CH (Figure 6 II) and span 60 (Figure 6 III) showed endothermic peaks at 143.90°C55 and 65.85°C56,respectively. Moreover, the thermogram of CS (Figure 6 IV) showed an endothermic peak at 73.63°C reflecting water loss; besides, an exothermic peak is evident at 289.02° reflecting CS degradation.53 Thermogram of the physical mixture (Figure 6 V) exhibited only the melting endotherm of span 60 with the absence of peaks corresponding to other components, owing to the dilution effect.
The thermogram of the CIN-loaded chitosomal formulation (C2) was identical to its corresponding plain analogue (Figure 6 VII and VI, respectively), along with a shift of the characteristic endotherm of span 60 to 58.15°C and 57.81°C, respectively. This could be attributed to the interaction between lipid components to form the bilayer vesicle.39 Besides, the absence of CIN endothermic peak in the CIN-loaded chitosomal formulation (C2) signifies the entrapment of the drug in the bilayer of the niosomal vesicle.57
X-Ray Powder Diffraction (XRPD)
X-ray powder diffraction is an important tool used for estimation of the changes in substance crystallinity during formulation. From the diffractograms in Figure 7, Diffractogram of CIN (Figure 7 I) displayed characteristic peaks at 10.31°, 13.36°, 14.70°, 18.23°, 21.03°, 22.13°, and 24.92° at 2θ, indicating the crystalline nature of CIN.58 The x-ray diffractogram of CH (Figure 7 II) showed characteristic peaks at 5.28°, 12.93°, 14.5°, 15.44°, 16.65°, and 17.05° at 2θ.22 Diffractogram of span 60 (Figure 7 III) exhibited a specific peak at 21.69° at 2θ.59 On the contrary, diffraction pattern of CS (Figure 7 IV) displayed no characteristic peaks, reflecting its amorphous nature.60 The physical mixture diffractogram (Figure 7 V) revealed the combined peaks of CH and span 60 with the absence of CIN peaks; this may be attributed to the dilution factor. The characteristic CIN peaks were vanished in the diffractogram of the lyophilized optimized CIN-loaded chitosomal formulation (C2) (Figure 7 VII), suggesting the entrapment of CIN within the prepared vesicles and its amorphization.28
 |
Figure 7 XRP diffractograms CIN (I), CH (II), Span 60 (III), CS (IV), physical mixture (V), lyophilized plain C2 formulation (VI) and lyophilized CIN-loaded C2 formulation (VII). Abbreviations: XRPD, X-ray powder diffraction; CIN, cinnarizine; CH, cholesterol; CS, chitosan; C2, optimized chitosomal formulation. |
Mucoadhesive Strength
Coating of niosomes with CS is thought to be a successful strategy to overcome the erratic bioavailability of CIN and prolong its gastric retention. The mucoadhesive properties of the niosomal formulation (F1) and the chitosomal formulation (C2) were evaluated based on mucin adsorption; the obtained results were illustrated in Figure 8. It was obvious that the binding efficiency of the chitosomal formulation (C2) was 1.42-fold higher than that of the corresponding uncoated niosomal formulation (F1). This finding may be attributed to the electrostatic force between the positively charged amino group of CS and the negatively charged protein. Also, the remarkable binding between mucin and uncoated niosomal formulation (F1) may be attributed to the hydrophobic interactions and hydrogen bonding.61 Since CIN has a pH-dependent solubility, the higher mucoadhesive strength of the optimized chitosomal formulation (C2) was anticipated to prolong its gastric residence time, leading to augmented CIN bioavailability and sustainability as well.42,62
 |
Figure 8 Mucoadhesive efficiency of niosomal formulation (F1) and chitosomal formulation (C2). Note: Data are represented as mean±SD (n=3).*Significant at p<0.05 niosomal formulation (F1) vs chitosomal formulation (C2). |
Cytotoxicity Study
In vitro cytotoxicity study is crucial before performing the in vivo study.63 The cell viabilities of the free CIN, the chitosomal formulation (C2) and the corresponding plain one were evaluated using MTT assay after incubation for 24 h with Caco-2 cells. The cell viability percent after treatment with different CIN concentrations (1–100 µg/mL) is illustrated in Figure 9, which declared a reduction in cell viability up on increasing CIN concentration.
 |
Figure 9 Cell viability of Caco-2 cells incubated with free CIN, chitosomal formulation C2 and its corresponding plain one for 24 h. Abbreviation: CIN, cinnarizine. Notes: Data are represented as mean±SD (n=3). *Free CIN or chitosomal formulation C2 are significantly different (p<0.05) vs plain C2 formulation at the same concentration, **Chitosomal formulation C2 is significantly different (p<0.05) vs free CIN at the same concentration. |
As manifested in Table 4, free CIN exhibited the highest cytotoxicity with a half inhibitory concentration (IC50) equals to 26.22 µg/mL. Previous results recorded the cytotoxicity of CIN on variable cell lines.64 Noticeably, the CIN-loaded chitosomal formulation C2 revealed a higher IC50 (68.09 µg/mL) than that of the free CIN (26.22 µg/mL). The difference in the cellular uptake of the free CIN and the entrapped form might be considered as a drug-induced cytotoxicity mechanism.65 This could be ascribed to the difficulty of entrapped CIN diffusion through the lipid layer to be available to act on the cells due to its lipophilic nature.66 These results clearly indicate that the chitosomal formulation C2 is biocompatible with low cytotoxic activity and could be presented as a potential drug carrier for CIN.
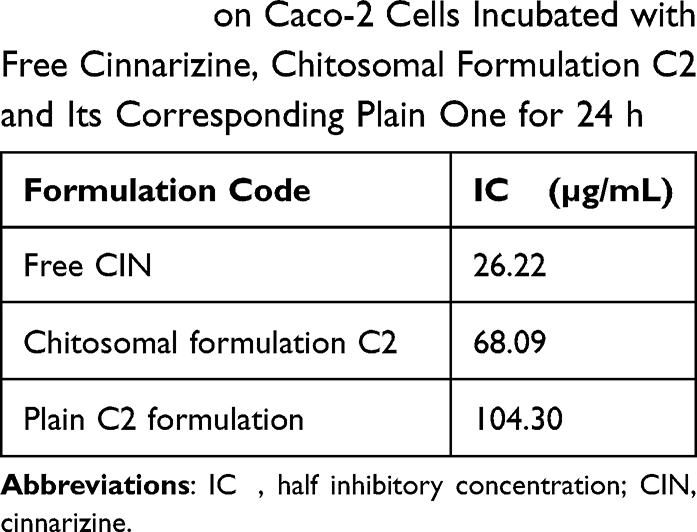 |
Table 4 IC50 on Caco-2 Cells Incubated with Free Cinnarizine, Chitosomal Formulation C2 and Its Corresponding Plain One for 24 h |
The plain C2 formulation displayed IC50 at 104.30 µg/mL which is greater than that of the corresponding CIN-loaded formulation (68.09 µg/mL). The lower IC50 of CIN-loaded chitosomal formulation (C2) may be owed to the drug adsorption on the chitosomal surface or its liberation during incubation.67
In vitro Drug Release
The drug release patterns from the CIN solution, the niosomal formulation (F1), as well as the chitosomal formulation (C2) are illustrated in Figure 10. The niosomal (F1) and chitosomal (C2) formulations showed a delayed release of CIN compared to that of the drug solution;68 the cumulative percent release during the first 2 h was about 47.62% and 42.79% for F1 and C2, respectively. On the other hand, the CIN solution showed a cumulative amount released of 88.76% within 2 h, signifying the higher solubility of CIN in lower pH (0.1N HCl pH1.2). Additionally, both formulations (F1 and C2) exhibited a biphasic release pattern with an initial rapid phase which could be attributed to the liberation of CIN adsorbed on the vesicles surface. After that, a sustained release phase prevailed up to 8 h, which is owed to the slow release of CIN through the bilayer membrane.17
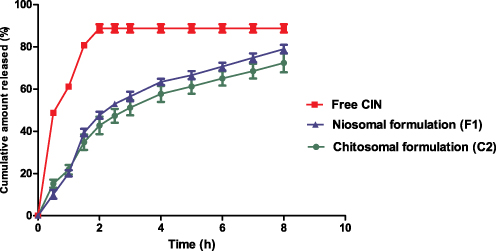 |
Figure 10 In vitro release pattern of free CIN, niosomal formulation (F1) and chitosomal formulation (C2). Abbreviation: CIN, cinnarizine. Note: Data are represented as mean±SD (n=3). |
The data revealed no significant (p<0.05) difference in the release profiles of niosomal (F1) and chitosomal (C2) formulations. Undoubtedly, the in vitro release rate could not be considered a definite factor as it did not highlight the in vivo mucoadhesive effect of CS coat.69
Drug Release Kinetics
The release profiles of niosomal (F1) and chitosomal (C2) formulations were fitted to different release kinetic models to demonstrate the release mechanism. The values of r2 for various kinetic models are illustrated in Table 5. The in-vitro release of both formulations could be explained by a diffusion-controlled mechanism (Higuchi model) according to the highest r2 value.17 CIN was released from both formulations by one-dimensional diffusion through the bilayer membrane. The hypothesis of this model is that the initial concentration of the drug in the matrix exceeds its solubility; meanwhile, the diffusivity of the drug is constant. So, the sink condition is maintained in the release environment.70 Furthermore, the n values of the Korsmeyer-Peppas model were 0.8982 and 0.6088 for F1 and C2, respectively, which manifested that the CIN was mainly released by diffusion and erosion (non-fickian transport).27
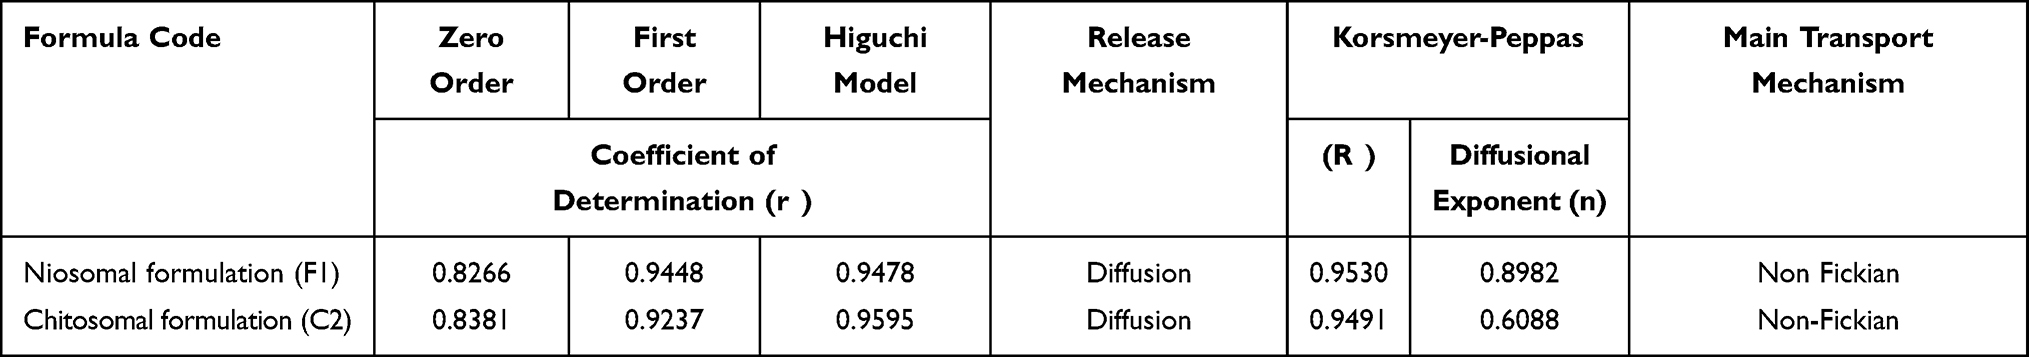 |
Table 5 Kinetic Analysis of the Release Data of CIN from Niosomal Formulation F1 and Chitosomal Formulation C2 Powders |
Physical Stability Study
Stability study is a critical concern for the evaluation of any prepared formulation. Undoubtedly, the analysis of particle size and zeta potential during the storage period is very essential to evaluate whether the vesicles retain their stability or not. The plateau of these parameters indicates the vesicles’ stability during the storage period and warrants drug retention. The stability study of the optimized chitosomal formulation C2 suspension was estimated at refrigerated temperature and room temperature for 3 months; the results are illustrated in Table 6. The ANOVA results manifested insignificant (p<0.05) changes in PS, PDI, ZP and DR % at the refrigerated temperature compared to the initial data. Generally, storage of vesicular systems at refrigerated temperature minimizes the physical instability hitches of the particles.71 On the contrary, PS and ZP were significantly (p<0.05) changed during storage at room temperature; meanwhile, the differences of other evaluation parameters were insignificant (p<0.05) with respect to the results at zero time. The size enlargement at room temperature could be related to the affinity of the particles to fuse and aggregate.72 Notably, the optimized chitosomal formulation (C2) showed higher stability at refrigerated temperature than that at room temperature.72
 |
Table 6 Stability Study of the Optimized Chitosomal Formulation (C2) Suspension at Refrigerated Temperature (4 °C ±1 °C) and at Room Temperature (25 °C ±2 °C) |
The results in Table 7 elucidated that the chitosomal formulation (C2) powders revealed no changes in the appearance or the color during all storage conditions throughout the designed storage period. Additionally, the values of DR% of C2 powders were statistically insignificant (p<0.05) compared to the initial data, which guarantee the retention of the drugs within the vesicles.
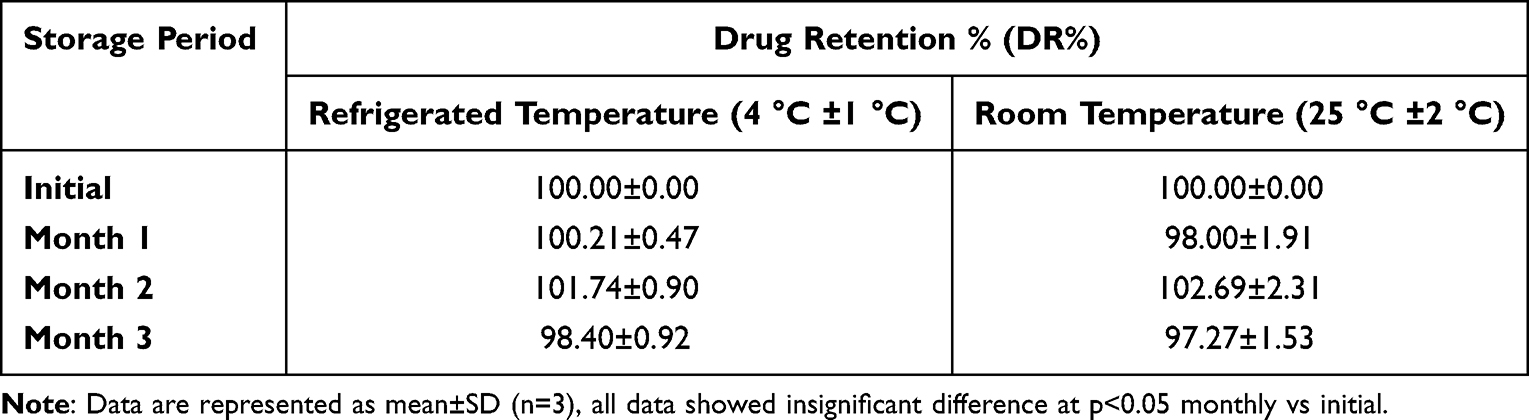 |
Table 7 Drug Retention Percent of Optimized Chitosomal Formulation (C2) Powder at Refrigerated Temperature (4 °C ±1 °C) and at Room Temperature (25 °C ±2 °C) |
In vivo Pharmacokinetic Study
The analysis method was validated regarding linearity, selectivity/specificity, precision and accuracy according to ICH guidelines.31 No interference of the retention times of CIN and the endogenous plasma components was exhibited in HPLC chromatogram of blank plasma spiked with CIN, indicating the selectivity of the analysis method. The retention time of the CIN was 9.486±0.053 min. The linearity of the analysis method for the calibration curve of CIN in plasma was achieved over a concentration range from 125 to 1250 ng/mL (correlation coefficient (r2) equals 0.9978). The linear regression equation was y=(139.409±2.383) x – (10206.4±462.64), where y was the CIN peak area, x was the concentration of CIN in plasma (ng/mL), (139.409±2.383) was the slope ±SEM and (10206.4±462.64) was the intercept ±SEM. The calculated QL and DL were 57.48 ng/mL and 18.97 ng/mL, respectively.
The precision values were in the range of (0.80±0.004 to 4.45±0.117%) and (3.94±0.09 to 12.153±0.88%) for intraday and interday measurements, respectively; while, the accuracy values were in the range of (90.01±2.31 to 102.76±1.37%) and (87.99±2.51 to 105.616±3.49%) for intraday and interday measurements, respectively. Therefore, the results were within the accepted criteria for both precision (nearly <15%) and accuracy (between 85% and 115%).
Figure 11 manifests the CIN plasma concentration-time curve following oral administration of the drug suspension, reconstituted freeze-dried niosomal formulation F1 and optimized chitosomal formulation C2 to male Sprague Dawley rats. The pharmacokinetic parameters were calculated and the data are listed in Table 8.
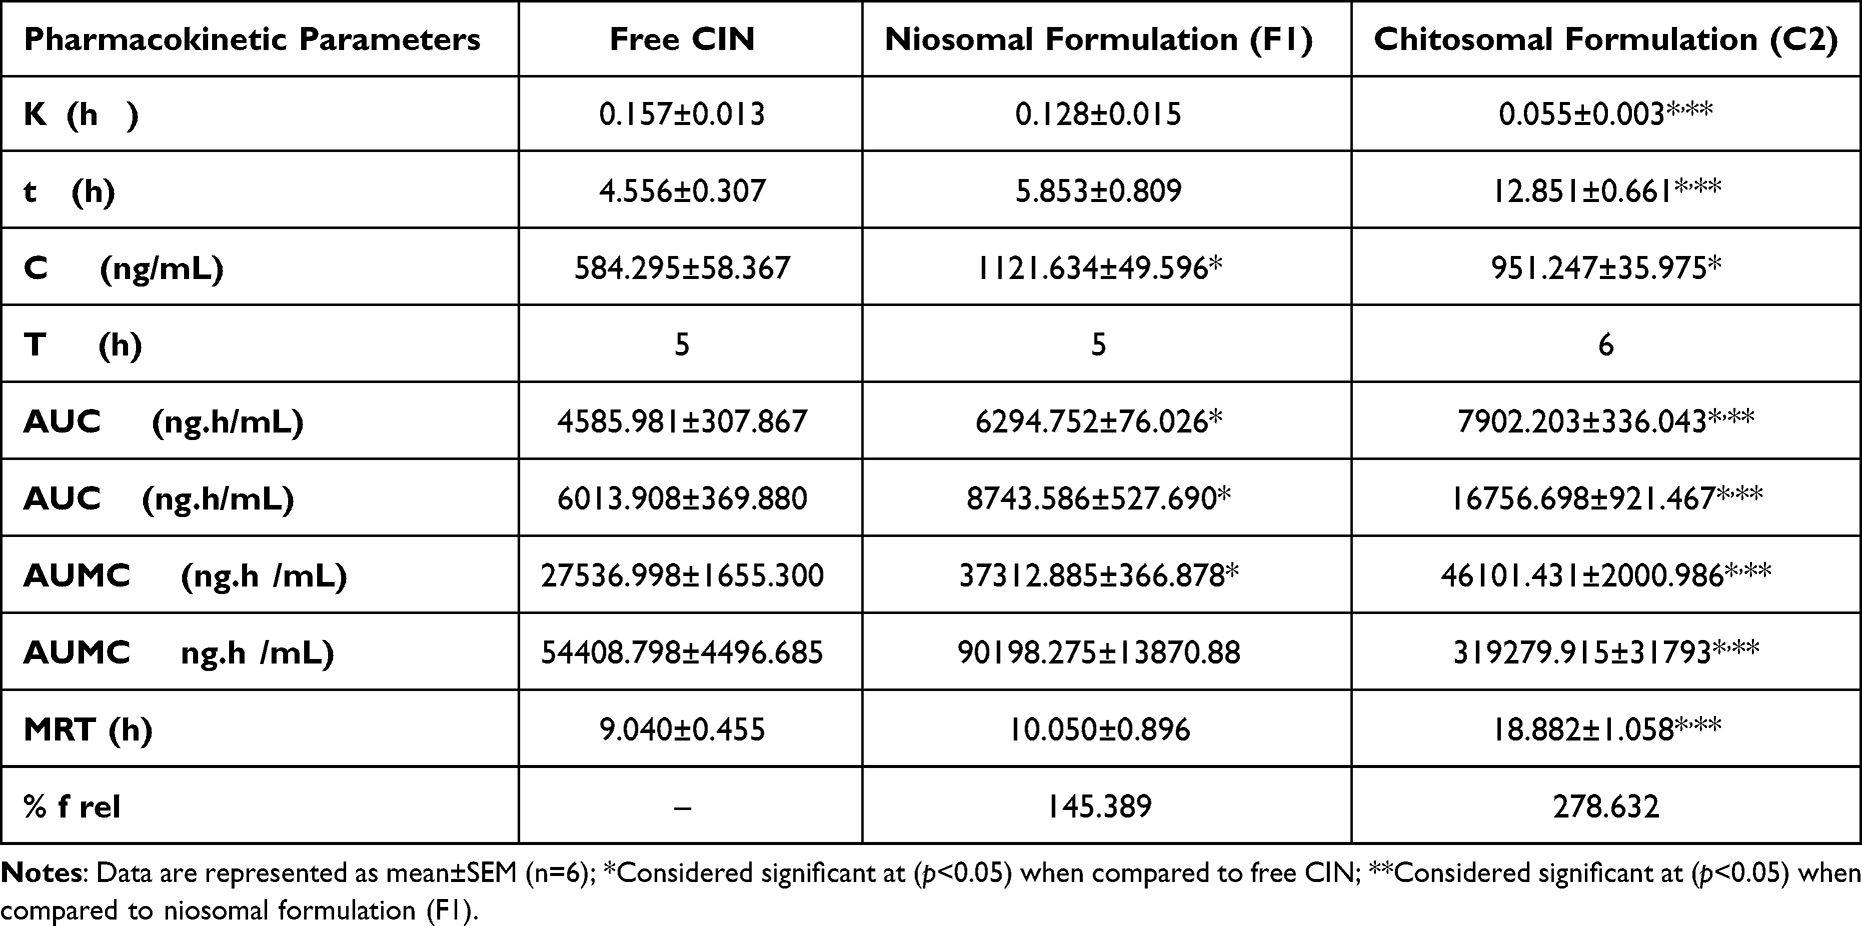 |
Table 8 Pharmacokinetic Parameters of Free Cinnarizine, Niosomal Formulation (F1) and Chitosomal Formulation (C2) After Oral Administration to Male Sprague Dawley Rats |
 |
Figure 11 Plasma concentration–time curve after oral administration of free CIN, niosomal formulation (F1) and chitosomal formulation (C2) to male Sprague Dawley rats. Note: Each point represents the mean±(SEM) (n=6). |
Both formulations (F1 and C2) achieved a significant (p<0.05) increase in Cmax compared to that of the free CIN (1121.634±49.596, 951.247±35.975 and 584.30±58.37ng/mL, respectively). Additionally, the oral administration of F1 and C2 formulations enhanced the CIN relative bioavailability with respect to free drug by 1.45 and 2.79 folds, respectively.
Table 8 also underlined the remarkable higher AUC0-∞ value of the chitosomal C2 formulation (16756.70±921.47 ng.h/mL) than that of the niosomal F1 formulation (8743.59±527.69 ng.h/mL) with an insignificant difference in their Cmax values. Perceptibly, the optimized chitosomal formulation (C2) depicted a higher t1/2 and delayed Tmax which highlighted the sustained release of CIN from the CS coated formulation.73 The longer MRT of C2 was also an evident of the ability of the prepared chitosome to prolong the release of CIN.74 Discernably, the pharmacokinetic parameters (t1/2, Cmax, Tmax, AUC0-∞ and MRT) values pointed that C2 is a new perspective for improving CIN oral bioavailability.
The augmented bioavailability of niosomal (F1) and chitosomal (C2) formulations could be accredited to the higher surface area exhibited by the nanosized vesicles.75 The superiority of the chitosomal formulation (C2) over the niosomal formulation (F1) may be ascribed to the positively charged surface of the particles which allowed the electrostatic attraction with the negatively charged gastrointestinal tract membrane.76,77 Additionally, CS could enhance the oral absorption of CIN by the tight junction opening effect which facilitates the paracellular transport pathway.78 Overall coating of the vesicles with CS is a promising paradigm to ameliorate CIN bioavailability.
In vitro–in vivo Correlation
As shown in Figure 12, it was obvious that the optimized chitosomal formulation (C2) exhibited a good in vitro-in vivo correlation with r2 value of 0.9618 at time intervals 0.5, 1, 2 and 4 h.
 |
Figure 12 In vitro-in vivo correlation of the optimized chitosomal formulation (C2). |
Conclusion
Mucoadhesive chitosan coated niosomes (chitosomes) containing CIN were successfully prepared. The vesicles exhibited a PS of (440± 13.03nm) and ZP of (+28.1± 0.1mv). The spherical contour of the particles was confirmed by TEM and SEM. The data obtained from DSC, FTIR and XRPD revealed the drug encapsulation within vesicles and the compatibility between the components. Thanks to the electrostatic force between the positively charged amino group of CS and the negatively charged protein, the binding efficiency of the chitosomal formulation (C2) with mucin was 1.42-fold higher than that of the corresponding uncoated niosomal formulation (F1). The IC50 of the optimized chitosomal formulation C2 on Caco-2 cells exceeded that of the free CIN, signifying the safety of the formulation. Furthermore, the relative bioavailability of CIN was highly ameliorated in chitosomal formulation over niosomal one, highlighting the prominent influence of CS in enhancing CIN oral absorption. Interestingly, the optimized formulation (C2) greatly boosted the bioavailability of CIN and sustained its release. Thus, chitosomes could be considered as a feasible strategy for oral administration of CIN. It is worthy to speculate that chitosomes could be presented as prospective platform for their future evaluation in human.
Disclosure
The authors report no conflicts of interest in this work.
References
1. Edrees F, Saad A, Alsaadi T, Amin N, Abdelwahab N. Experimentally designed chromatographic method for the simultaneous analysis of dimenhydrinate, cinnarizine and their toxic impurities. RSC Adv. 2021;11:1450–1460. doi:10.1039/D0RA09585K
2. Kirtane MV, Bhandari A, Narang P, Santani R. Cinnarizine: a contemporary review. Indian J Otolaryngol Head Neck Surg. 2019;71(Suppl 2):1060–1068. doi:10.1007/s12070-017-1120-7
3. Raghuvanshi S, Pathak K. Recent advances in delivery systems and therapeutics of cinnarizine: a poorly water soluble drug with absorption window in stomach. J Drug Deliv. 2014;2014:479246. doi:10.1155/2014/479246
4. Abouelatta SM, Aboelwafa AA, Khalil RM, El-Gazayerly ON. Utilization of ionotropic gelation technique for bioavailability enhancement of cinnarizine: in-vitro optimization and in-vivo performance in human. Drug Deliv. 2016;23(8):2736–2746. doi:10.3109/10717544.2015.1064187
5. Abouelatta SM, Aboelwafa AA, Khalil RM, ElGazayerly ON. Floating lipid beads for the improvement of bioavailability of poorly soluble basic drugs: in-vitro optimization and in-vivo performance in humans. Eur J Pharm Biopharm. 2015;89:82–92. doi:10.1016/j.ejpb.2014.11.011
6. Nagarwal RC, Ridhurkar DN, Pandit JK. In vitro release kinetics and bioavailability of gastroretentive cinnarizine hydrochloride tablet. AAPS PharmSciTech. 2010;11(1):294–303. doi:10.1208/s12249-010-9380-5
7. Ammar HO, Ghorab M, Kamel R, Salama AH. Design and optimization of gastro-retentive microballoons for enhanced bioavailability of cinnarizine. Drug Deliv Transl Res. 2016;6(3):210–224. doi:10.1007/s13346-016-0280-4
8. Mahmoud K, Mohamed M, Amr I, Louis D. An overview on niosomes: a drug nanocarrier. Drug Des Int Prop Int J. 2018. doi:10.32474/DDIPIJ.2018.01.000125
9. Moghassemi S, Hadjizadeh A. Nano-niosomes as nanoscale drug delivery systems: an illustrated review. J Control Release. 2014;185:22–36. doi:10.1016/j.jconrel.2014.04.015
10. Mahale NB, Thakkar PD, Mali RG, Walunj DR, Chaudhari SR. Niosomes: novel sustained release nonionic stable vesicular systems–an overview. Adv Colloid Interface Sci. 2012;183–184:46–54. doi:10.1016/j.cis.2012.08.002
11. Azeem A, Anwer MK, Talegaonkar S. Niosomes in sustained and targeted drug delivery: some recent advances. J Drug Target. 2009;17(9):671–689. doi:10.3109/10611860903079454
12. Machado ND, Silva OF, de Rossi RH, Fernández MA. Cyclodextrin modified niosomes to encapsulate hydrophilic compounds. RSC Adv. 2018;8(52):29909–29916. doi:10.1039/C8RA05021J
13. Gharbavi M, Johari B, Mousazadeh N, et al. Hybrid of niosomes and bio-synthesized selenium nanoparticles as a novel approach in drug delivery for cancer treatment. Mol Biol Rep. 2020;47(9):6517–6529. doi:10.1007/s11033-020-05704-z
14. Khallaf RA, Aboud HM, Sayed OM. Surface modified niosomes of olanzapine for brain targeting via nasal route; preparation, optimization, and in vivo evaluation. J Liposome Res. 2020;30(2):163–173. doi:10.1080/08982104.2019.1610435
15. Hanieh PN, Forte J, Di Meo C, et al. Hyaluronic acid derivative effect on niosomal coating and interaction with cellular mimetic membranes. Molecules. 2021;26(11):3434. doi:10.3390/molecules26113434
16. Choi K-O, Choe J, Suh S, Ko S. Positively charged nanostructured lipid carriers and their effect on the dissolution of poorly soluble drugs. Molecules. 2016;21(5):672. doi:10.3390/molecules21050672
17. Fakhria A, Gilani SJ, Imam SS, et al. Formulation of thymoquinone loaded chitosan nano vesicles: in-vitro evaluation and in-vivo anti-hyperlipidemic assessment. JDDST. 2019;50:339–346. doi:10.1016/j.jddst.2019.01.033
18. Salomon C, Goycoolea FM, Moerschbacher B. Recent trends in the development of chitosan-based drug delivery systems. AAPS PharmSciTech. 2017;18(4):933–935. doi:10.1208/s12249-017-0764-7
19. Yeo LK, Olusanya TOB, Chaw CS, Elkordy AA. Brief effect of a small hydrophobic drug (cinnarizine) on the physicochemical characterisation of niosomes produced by thin-film hydration and microfluidic methods. Pharmaceutics. 2018;10(4):185. doi:10.3390/pharmaceutics1004018
20. Baillie AJ, Florence AT, Hume LR, Muirhead GT, Rogerson A. The preparation and properties of niosomes–non-ionic surfactant vesicles. J Pharm Pharmacol. 1985;37(12):863–868. doi:10.1111/j.2042-7158.1985.tb04990.x
21. Khalil RM, Abdelbary GA, Basha M, Awad GEA, El-Hashemy HA. Enhancement of lomefloxacin Hcl ocular efficacy via niosomal encapsulation: in vitro characterization and in vivo evaluation. J Liposome Res. 2017;27(4):312–323. doi:10.1080/08982104.2016.1191022
22. El-Emam GA, Girgis GNS, El-Sokkary MMA, El-Azeem Soliman OA, Abd El Gawad AE. Ocular inserts of voriconazole-loaded proniosomal gels: formulation, evaluation and microbiological studies. Int J Nanomedicine. 2020;15:7825–7840. doi:10.2147/IJN.S268208
23. Shalaby TI, El-Refaie WM. Bioadhesive chitosan-coated cationic nanoliposomes with improved insulin encapsulation and prolonged oral hypoglycemic effect in diabetic mice. J Pharm Sci. 2018;107(8):2136–2143. doi:10.1016/j.xphs.2018.04.011
24. Imran M, Shah MR, Ullah F, et al. Sugar-based novel niosomal nanocarrier system for enhanced oral bioavailability of levofloxacin. Drug Deliv. 2016;23(9):3653–3664. doi:10.1080/10717544.2016.1214991
25. Martin AN, Bustamante P, Chun AHC. Physical Pharmacy: Physical Chemical Principles in the Pharmaceutical Sciences.
26. Higuchi T. Mechanism of sustained-action medication. Theoretical analysis of rate of release of solid drugs dispersed in solid matrices. J Pharm Sci. 1963;52(12):1145–1149. doi:10.1002/jps.2600521210
27. Ritger PL, Peppas NA. A simple equation for description of solute release I. Fickian and non-fickian release from non-swellable devices in the form of slabs, spheres, cylinders or discs. J Control Release. 1987;5(1):23–36. doi:10.1016/0168-3659(87)90034-4
28. Gurrapu A, Jukanti R, Bobbala SR, Kanuganti S, Jeevana JB. Improved oral delivery of valsartan from maltodextrin based proniosome powders. Adv Powder Technol. 2012;23(5):583–590. doi:10.1016/j.apt.2011.06.005
29. Abdelmonem R, Hamed RR, Abdelhalim SA, ElMiligi MF, El-Nabarawi MA. Formulation and characterization of cinnarizine targeted aural transfersomal gel for vertigo treatment: a pharmacokinetic study on rabbits. Int J Nanomedicine. 2020;15:6211–6223. doi:10.2147/IJN.S258764
30. Holm R, Olesen NE, Hartvig RA, Jørgensen EB, Larsen DB, Westh P. Effect of cyclodextrin concentration on the oral bioavailability of danazol and cinnarizine in rats. Eur J Pharm Biopharm. 2016;101:9–14. doi:10.1016/j.ejpb.201601.007
31. International Guideline. Q2 (R1), in: validation of analytical procedures: text and methodology.
32. Bala R, Khanna S, Pawar P. Design optimization and in vitro-in vivo evaluation of orally dissolving strips of clobazam. J Drug Deliv. 2014;2014:392783. doi:10.1155/2014/392783
33. El-Menshawe SF, Hussein AK. Formulation and evaluation of meloxicam niosomes as vesicular carriers for enhanced skin delivery. Pharm Dev Technol. 2013;18(4):779–786. doi:10.3109/10837450.2011.598166
34. Gugleva V, Titeva S, Rangelov S, Momekova D. Design and in vitro evaluation of doxycycline hyclate niosomes as a potential ocular delivery system. Int J Pharm. 2019;567:118431. doi:10.1016/j.ijpharm.2019.06.022
35. Manosroi A, Wongtrakul P, Manosroi J, et al. Characterization of vesicles prepared with various non-ionic surfactants mixed with cholesterol. Colloids Surf B Biointerfaces. 2003;30(1):129–138. doi:10.1016/S0927-7765(03)00080-8
36. Hashim F, El-Ridy M, Nasr M, Abdallah Y. Preparation and characterization of niosomes containing ribavirin for liver targeting. Drug Deliv. 2010;17(5):282–287. doi:10.3109/10717541003706257
37. Abdelbary GA, Aburahma MH. Oro-dental mucoadhesive proniosomal gel formulation loaded with lornoxicam for management of dental pain. J Liposome Res. 2015;25(2):107–121. doi:10.3109/08982104.2014.941861
38. Yaghoobian M, Haeri A, Bolourchian N, Shahhosseni S, Dadashzadeh S. The impact of surfactant composition and surface charge of niosomes on the oral absorption of repaglinide as a BCS II model drug. Int J Nanomedicine. 2020;15:8767–8781. doi:10.2147/ijn.s261932
39. Rahman SA, Abdelmalak NS, Badawi A, Elbayoumy T, Sabry N, El Ramly A. Formulation of tretinoin-loaded topical proniosomes for treatment of acne: in-vitro characterization, skin irritation test and comparative clinical study. Drug Deliv. 2015;22(6):731–739. doi:10.3109/10717544.2014.896428
40. Yadav K, Yadav D, Saroha K, Nanda S, Mathur P, Syan N. Proniosomal gel: a provesicular approach for transdermal drug delivery. Der Pharmacia Lettre. 2010;2(4):189–198.
41. Abdelbary AA, AbouGhaly MH. Design and optimization of topical methotrexate loaded niosomes for enhanced management of psoriasis: application of Box-Behnken design, in-vitro evaluation and in-vivo skin deposition study. Int J Pharm. 2015;485(1–2):235–243. doi:10.1016/j.ijpharm.2015.03.020
42. Khalifa AL, Abdul Rasool BK. Optimized mucoadhesive coated niosomes as a sustained oral delivery system of famotidine. AAPS PharmSciTech. 2017;18(8):3064–3075. doi:10.1208/s12249-017-0780-7
43. Ameeduzzafar ANK, Imam SS, Alotaibi NH, et al. Formulation of chitosan polymeric vesicles of ciprofloxacin for ocular delivery: box-behnken optimization, in vitro characterization, HET-CAM irritation, and antimicrobial assessment. AAPS PharmSciTech. 2020;21(5):167. doi:10.1208/s12249-020-01699-9
44. Arafa MG, Mousa HA, Afifi NN. Preparation of PLGA-chitosan based nanocarriers for enhancing antibacterial effect of ciprofloxacin in root canal infection. Drug Deliv. 2020;27(1):26–39. doi:10.1080/10717544.2019.1701140
45. Allam AN, Hamdallah SI, Abdallah OY. Chitosan-coated diacerein nanosuspensions as a platform for enhancing bioavailability and lowering side effects: preparation, characterization, and ex vivo/in vivo evaluation. Int J Nanomedicine. 2017;12:4733–4745. doi:10.2147/ijn.s139706
46. El-Haddad ME, Hussien AA, Saeed HM, Farid RM. Down regulation of inflammatory cytokines by the bioactive resveratrol-loaded chitoniosomes in induced ocular inflammation model. JDDST. 2021;66:102787. doi:10.1016/j.jddst.2021.102787
47. Kumbhar D, Wavikar P, Vavia P. Niosomal gel of lornoxicam for topical delivery: in vitro assessment and pharmacodynamic activity. AAPS PharmSciTech. 2013;14(3):1072–1082. doi:10.1208/s12249-013-9986-5
48. Motawea A, Abd El Hady WE, Ahmed El-Emam G. The protective impact of adapted trimebutine maleate-loaded nanostructured lipid carriers for alleviating the severity of acute colitis. Drug Deliv. 2022;29(1):906–924. doi:10.1080/10717544.2022.2050847
49. Kulkarni P, Rawtani D. Application of box-behnken design in the preparation, optimization, and in vitro evaluation of self-assembly-based tamoxifen- and doxorubicin-loaded and dual drug-loaded niosomes for combinatorial breast cancer treatment. J Pharm Sci. 2019;108(8):2643–2653. doi:10.1016/j.xphs.2019.03.020
50. Haress NG. Chapter one - cinnarizine: comprehensive profile. In: Brittain HG, editor. Profiles of Drug Substances, Excipients and Related Methodology. Academic Press; 2015:1–41. doi:10.1016/bs.podrm.2015.01.001
51. Elmowafy E, El-Derany MO, Biondo F, Tiboni M, Casettari L, Soliman ME. Quercetin loaded monolaurate sugar esters-based niosomes: sustained release and mutual antioxidant-hepatoprotective interplay. Pharmaceutics. 2020;12(2):143. doi:10.3390/pharmaceutics12020143
52. Fathalla D, Fouad EA, Soliman GM. Latanoprost niosomes as a sustained release ocular delivery system for the management of glaucoma. Drug Dev Ind Pharm. 2020;46(5):806–813. doi:10.1080/03639045.2020.1755305
53. Abd El Hady WE, Mohamed EA, Soliman OAE, El-Sabbagh HM. In vitro-in vivo evaluation of chitosan-PLGA nanoparticles for potentiated gastric retention and anti-ulcer activity of diosmin. Int J Nanomedicine. 2019;14:7191–7213. doi:10.2147/IJN.S213836
54. Thomas S, Chong YN, Chaw CS. Preparation and characterization of enteric microparticles by coacervation. Drug Dev Ind Pharm. 2013;39(7):1142–1151. doi:10.3109/03639045.2012.725734
55. Sezgin-Bayindir Z, Antep MN, Yuksel N. Development and characterization of mixed niosomes for oral delivery using candesartan cilexetil as a model poorly water-soluble drug. AAPS PharmSciTech. 2015;16(1):108–117. doi:10.1208/s12249-014-0213-9
56. Mady OY, Donia AA, Al-Shoubki AA, Qasim W. Paracellular pathway enhancement of metformin hydrochloride via molecular dispersion in span 60 microparticles. Front Pharmacol. 2019;10:713. doi:10.3389/fphar.2019.00713
57. ElMeshad AN, Mohsen AM. Enhanced corneal permeation and antimycotic activity of itraconazole against Candida albicans via a novel nanosystem vesicle. Drug Deliv. 2016;23(7):2115–2123. doi:10.3109/10717544.2014.942811
58. Ammar HO, Ghorab M, Kamel R, Salama AH. A trial for the design and optimization of pH-sensitive microparticles for intestinal delivery of cinnarizine. Drug Deliv Transl Res. 2016;6(3):195–209. doi:10.1007/s13346-015-0277-4
59. Ammar HO, Mohamed MI, Tadros MI, Fouly AA. Transdermal delivery of ondansetron hydrochloride via bilosomal systems: in vitro, ex vivo, and in vivo characterization studies. AAPS PharmSciTech. 2018;19(5):2276–2287. doi:10.1208/s12249-018-1019-y
60. Hafezi F, Scoutaris N, Douroumis D, Boateng J. 3D printed chitosan dressing crosslinked with genipin for potential healing of chronic wounds. Int J Pharm. 2019;560:406–415. doi:10.1016/j.ijpharm.2019.02.020
61. Vieira ACC, Chaves LL, Pinheiro S, et al. Mucoadhesive chitosan-coated solid lipid nanoparticles for better management of tuberculosis. Int J Pharm. 2018;536(1):478–485. doi:10.1016/j.ijpharm.2017.11.071
62. Jung IW, Han HK. Effective mucoadhesive liposomal delivery system for risedronate: preparation and in vitro/in vivo characterization. Int J Nanomedicine. 2014;9:2299–2306. doi:10.2147/ijn.s61181
63. Ullah S, Shah MR, Shoaib M, et al. Development of a biocompatible creatinine-based niosomal delivery system for enhanced oral bioavailability of clarithromycin. Drug Deliv. 2016;23(9):3480–3491. doi:10.1080/10717544.2016.1196768
64. Schmeel LC, Schmeel FC, Kim Y, Blaum-Feder S, Endo T, Schmidt-Wolf IG. In vitro efficacy of cinnarizine against lymphoma and multiple myeloma. Anticancer Res. 2015;35(2):835–841.
65. Moazeni E, Gilani K, Sotoudegan F, et al. Formulation and in vitro evaluation of ciprofloxacin containing niosomes for pulmonary delivery. J Microencapsul. 2010;27(7):618–627. doi:10.3109/02652048.2010.506579
66. Safwat S, Ishak RAH, Hathout RM, Mortada ND. Nanostructured lipid carriers loaded with simvastatin: effect of PEG/glycerides on characterization, stability, cellular uptake efficiency and in vitro cytotoxicity. Drug Dev Ind Pharm. 2017;43(7):1112–1125. doi:10.1080/03639045.2017.1293681
67. AbuElfadl A, Boughdady M, Meshali M. New Peceol™/Span™ 60 niosomes coated with chitosan for candesartan cilexetil: perspective increase in absolute bioavailability in rats. Int J Nanomedicine. 2021;16:5581–5601. doi:10.2147/IJN.S324171
68. Eid HM, Naguib IA, Alsantali RI, Alsalahat I, Hegazy AM. Novel chitosan-coated niosomal formulation for improved management of bacterial conjunctivitis: a highly permeable and efficient ocular nanocarrier for azithromycin. J Pharm Sci. 2021;110(8):3027–3036. doi:10.1016/j.xphs.2021.04.020
69. Fayed ND, Goda AE, Essa EA, El Maghraby GM. Chitosan-encapsulated niosomes for enhanced oral delivery of atorvastatin. JDDST. 2021;66:102866. doi:10.1016/j.jddst.2021.102866
70. Teaima MH, El Mohamady AM, El-Nabarawi MA, Mohamed AI. Formulation and evaluation of niosomal vesicles containing ondansetron HCL for trans-mucosal nasal drug delivery. Drug Dev Ind Pharm. 2020;46(5):751–761. doi:10.1080/03639045.2020.1753061
71. Tila D, Yazdani-Arazi SN, Ghanbarzadeh S, Arami S, Pourmoazzen Z. pH-sensitive, polymer modified, plasma stable niosomes: promising carriers for anti-cancer drugs. EXCLI J. 2015;14:21–32. doi:10.17179/excli2013-609
72. Jadon PS, Gajbhiye V, Jadon RS, Gajbhiye KR, Ganesh N. Enhanced oral bioavailability of griseofulvin via niosomes. AAPS PharmSciTech. 2009;10(4):1186–1192. doi:10.1208/s12249-009-9325-z
73. Chen T, Tu L, Wang G, et al. Multi-functional chitosan polymeric micelles as oral paclitaxel delivery systems for enhanced bioavailability and anti-tumor efficacy. Int J Pharm. 2020;578:119105. doi:10.1016/j.ijpharm.2020.119105
74. Abd-Elal RM, Shamma RN, Rashed HM, Bendas ER. Trans-nasal zolmitriptan novasomes: in-vitro preparation, optimization and in-vivo evaluation of brain targeting efficiency. Drug Deliv. 2016;23(9):3374–3386. doi:10.1080/10717544.2016.1183721
75. Zhang H, Wu F, Li Y, et al. Chitosan-based nanoparticles for improved anticancer efficacy and bioavailability of mifepristone. Beilstein J Nanotechnol. 2016;7:1861–1870. doi:10.3762/bjnano.7.178
76. Tian MP, Song RX, Wang T, Sun MJ, Liu Y, Chen XG. Inducing sustained release and improving oral bioavailability of curcumin via chitosan derivatives-coated liposomes. Int J Biol Macromol. 2018;120(Pt A):702–710. doi:10.1016/j.ijbiomac.201808.146
77. Shi LL, Lu J, Cao Y, et al. Gastrointestinal stability, physicochemical characterization and oral bioavailability of chitosan or its derivative-modified solid lipid nanoparticles loading docetaxel. Drug Dev Ind Pharm. 2017;43(5):839–846. doi:10.1080/03639045.2016.1220571
78. Han HK, Shin HJ, Ha DH. Improved oral bioavailability of alendronate via the mucoadhesive liposomal delivery system. Eur J Pharm Sci. 2012;46(5):500–507. doi:10.1016/j.ejps.2012.04.00
 © 2022 The Author(s). This work is published and licensed by Dove Medical Press Limited. The
full terms of this license are available at https://www.dovepress.com/terms
and incorporate the Creative Commons Attribution
- Non Commercial (unported, 3.0) License.
By accessing the work you hereby accept the Terms. Non-commercial uses of the work are permitted
without any further permission from Dove Medical Press Limited, provided the work is properly
attributed. For permission for commercial use of this work, please see paragraphs 4.2 and 5 of our Terms.
© 2022 The Author(s). This work is published and licensed by Dove Medical Press Limited. The
full terms of this license are available at https://www.dovepress.com/terms
and incorporate the Creative Commons Attribution
- Non Commercial (unported, 3.0) License.
By accessing the work you hereby accept the Terms. Non-commercial uses of the work are permitted
without any further permission from Dove Medical Press Limited, provided the work is properly
attributed. For permission for commercial use of this work, please see paragraphs 4.2 and 5 of our Terms.
Recommended articles
Evaluation of Chitosan–Pimelate Buccal Film Loaded with Duloxetine-Modified Sage Lipid Carriers Nanoformulation for Effective Antidepressant Activity in a Rat Model
El-Dakroury WA, Nomier YA, Said AR, Taura MG, Soliman Doghish A, Shalaby A, Sarhan OM
International Journal of Nanomedicine 2026, 21:569862
Published Date: 29 January 2026