Back to Journals » Journal of Pain Research » Volume 9
Novel method for assessing age-related differences in the temporal summation of pain
Authors Naugle K, Cruz-Almeida Y ![]() , Fillingim R, Staud R
, Fillingim R, Staud R ![]() , Riley III J
, Riley III J ![]()
Received 12 December 2015
Accepted for publication 28 January 2016
Published 8 April 2016 Volume 2016:9 Pages 195—205
DOI https://doi.org/10.2147/JPR.S102379
Checked for plagiarism Yes
Review by Single anonymous peer review
Peer reviewer comments 2
Editor who approved publication: Dr Michael Schatman
Kelly M Naugle,1 Yenisel Cruz-Almeida,2,3 Roger B Fillingim,2,4 Roland Staud,2,5 Joseph L Riley III2,4
1Department of Kinesiology, School of Physical Education and Tourism Management, Indiana University – Purdue University Indianapolis, Indianapolis, IN, 2Pain Research and Intervention Center of Excellence, University of Florida, 3Department of Aging and Geriatric Research, College of Medicine, 4Department of Community Dentistry and Behavioral Science, 5Department of Medicine, College of Medicine, University of Florida, Gainesville, FL, USA
Abstract: Temporal summation (TS) of pain protocols typically involve the delivery of brief repetitive noxious stimuli held at a constant intensity and measuring the consequent increase in the perceived intensity of pain sensations. To date, no studies have examined the effect of a TS protocol on the perceived spatial dimensions of the pain experience and its interaction with age. This study used a new TS protocol that examined changes in the perceived size of the painful area in 22 younger adults and 20 older adults. Four trials of ten brief heat pulses delivered at a constant intensity were administered on the volar forearm. Interpulse intervals (IPIs) were 2.5 seconds or 3.5 seconds. Subjects rated the peak pain intensity (trials 1 and 3) or the size of the painful area (trials 2 and 4) after each pulse on a 0–100 scale. The magnitude of summation was calculated for each trial. Three seconds and 6 seconds after delivering the last heat pulse, the subjects rated the intensity or the size of any remaining pain (aftersensations). The results indicated that older adults compared to younger adults exhibited significantly greater summation of size ratings for the 2.5-second and 3.5-second IPI trials and size of pain aftersensations at 3 seconds following the 2.5-second IPI TS trial. These results suggest that aging is associated with enhanced endogenous facilitation of the perceived size of pain. The potential clinical and mechanistic implications of enhanced TS of size of pain remain unknown and warrant further investigation.
Keywords: pain modulation, aging, elderly, pain facilitation, size of pain
Introduction
Pain is modulated by complex endogenous systems that both facilitate and inhibit pain. Several studies in the past decade indicate that older adults are characterized by heightened pain facilitation and reduced inhibitory capacity,1–4 which increase the risk for severe, acute, and clinical pain.1,5–7 Specifically, older adults exhibit facilitated responses to experimental pain, including enhanced temporal summation (TS) of heat pain1–3,8 and prolonged pain following the cessation of noxious stimulation.26 These facilitated responses are presumed to be related to hyperexcitability of the central nervous system, especially of dorsal horn neurons of the spinal cord.9
TS of pain protocols typically involve the delivery of brief repetitive painful stimuli held at a constant intensity and measuring the consequent increase in the perceived intensity of late pain sensations.10 Interestingly, a recent study by Quevedo and Coghill11 revealed that individual differences in the intensity-related percepts of pain are only minimally related to differences in the spatial-related percepts of noxious stimuli. Thus, measures of the spatial perception of pain likely represent a distinct and important dimension of the pain experience. To our knowledge, no studies have examined the effect of a TS protocol on the perceived spatial dimensions of the pain experience. Furthermore, the majority of pain and aging studies have focused on differences in perceived pain intensity of noxious stimulation, rather than perceived size of pain areas during or following noxious stimulation.
This study used a new TS protocol that examined changes in the perceived size of the painful area in healthy younger and older adults. The first goal of this study was to evaluate whether the size of the perceived pain area significantly summated in younger and older adults during a TS of heat protocol. Second, we sought to determine age differences in the amount of TS of the perceived size of painful area, while adjusting for individual differences in the TS of pain intensity. Following each trial, we asked subjects to rate the intensity or size of any remaining pain areas (ie, pain aftersensations). Thus, the third purpose was to evaluate age differences in the intensity and size of pain aftersensations following the TS trials. Finally, because prior work has shown that older adults exhibit enhanced summation of pain intensity particularly at lower frequencies of stimulation,3 we administered a series of stimuli during the TS trials at interpulse intervals (IPIs) of 2.5 seconds and 3.5 seconds. We chose these IPIs because previous studies have found that IPIs of <3 seconds produce TS in healthy younger and older adults,3,10 whereas IPIs of >3 seconds produce TS in older but not in younger adults. We hypothesized that older adults compared to younger adults would exhibit 1) enhanced summation of the perceived size of painful area and 2) greater perceived intensity and size of painful aftersensations. Furthermore, we hypothesized that these age differences would be more pronounced during the 3.5-second IPI TS trials compared to the 2.5-second IPI trials.
Methods
Subjects
Twenty-two healthy younger adults (age: mean [M]= 21.5±2.28 SD years, age range: 18–27 years; 12 females) and 20 healthy older adults (age: M=66.54±6.84 SD years, age range: 56–77 years; eleven females) participated in this study. Exclusion criteria included: 1) inability to reliably rate pain, 2) current use of narcotics or any tobacco products and chronic use of analgesics, 3) serious systemic disease (eg, diabetes and thyroid problems), 4) uncontrolled hypertension, 5) cardiovascular or pulmonary disease, 6) neurological problems with significant changes in somatosensory and pain perception at the intended stimulation sites, 7) serious psychiatric conditions (eg, schizophrenia and bipolar disorder), and 8) chronic pain or any ongoing pain problem (headaches, injury-related pain, etc). Subjects refrained from the use of any pain medication or coffee on the day of testing.
Study procedures
Orientation and training session
Individuals who were interested in the study were provided information about the procedures, informed about the privacy regulations, and reviewed and signed a written informed consent form. This study was approved by the University of Florida Institutional Review Board. Eligibility for the study was determined after subjects completed a health history questionnaire, supplemented by interview and a blood pressure measurement. Subjects then completed a training session to familiarize them with the pain testing procedures and to teach them the pain rating system. During this session, subjects also completed a battery of questionnaires assessing physical health and mental health status (Short-Form Health Survey [SF-36]),12 trait anxiety (State Trait Anxiety Inventory [STAI]),13 and physical activity behavior over the past week (International Physical Activity Questionnaire [IPAQ] – long form).14
Testing session
Subjects were seated on a comfortable chair and relaxed for several minutes and were also asked about medication use. Then, two blood pressure readings were taken separately by 5 minutes. A third blood pressure measurement was taken if there was a change of >5% in the first two readings. The temperature of the thermode to be used in the TS trials was then determined for each subject. The goal was to determine the temperatures at which a subject would experience mild-to-moderate pain on the volar forearm. The thermode temperature was set at 42°C for the first trial (each trial 8 seconds with an interstimulus interval of 15 seconds) and increased across trials, so that a stimulus response curve could be calculated. The temperatures were increased to a maximum pain rating of 60 (on a scale of 0–100). The individualized test temperature for the TS trials was 1°C higher than the temperature at which subjects rated between 50 and 60 on the 8-second stimulus trial.
Prior to the administration of the TS trials, subjects watched a short video 1) describing the procedure of the TS trials and 2) providing instructions on the difference between rating the intensity and size of pain area. Then, subjects were administered two practice trials on the left forearm. Four TSs of heat trials were then administered in which the heat stimulus was presented to the right volar forearm. The location of the heat stimulus on the forearm was slightly altered between trials, and a minimum of a 60-second intertrial interval was maintained to reduce sensitization. On trials 1 and 3, subjects were asked to rate the peak pain intensity that they experienced after each pulse. On trials 2 and 4, subjects were asked to rate the size of the painful area after each pulse.
Experimental stimulus
Focal thermal stimuli (45–51°C) were delivered by a constant contact thermode (23 mm × 23 mm) computer-controlled Medoc Pathway Thermal Sensory Analyzer (Medoc, Ramat Yishai, Israel). For each TS trial, ten brief heat pulses at the predetermined temperature were delivered to the volar forearm. Each pulse was 1.3 seconds in duration (rise time =0.4 seconds; peak =0.5 seconds; and return to baseline =0.4 seconds). For trials 1 and 2, the IPI was 2.5 seconds. For trials 3 and 4, the IPI was 3.5 seconds. In sum, TS trials were administered in the following order: 1) TS of pain intensity and IPI of 2.5 seconds; 2) TS of pain area size and IPI of 2.5 seconds; 3) TS of pain intensity and IPI of 3.5 seconds; and 4) TS of pain area size and IPI 3.5 seconds. Before each trial, subjects were reminded how to rate the pain and presented with an appropriate rating scale.
Assessment of pain intensity
On trials 1 and 3, subjects rated the peak pain intensity that they experienced after each pulse using a numeric rating scale (NRS). Three seconds and 6 seconds after delivering the last heat pulse, subjects rated the intensity of any remaining pain. Ratings were made on a 0–100 NRS marked in increments of ten, with 0 being no pain and 100 representing intolerable pain.
Assessment of size of painful area
On trials 2 and 4, subjects rated the size of the painful area after each pulse using a 0–100 NRS. Three seconds and 6 seconds after delivering the last heat pulse, subjects rated the size of any remaining pain. Size ratings were also made on a size scale, which presented ten circles progressively increasing in size (Figure 1). Subjects were instructed that the circles represented how large or small the area the pain feels like it is coming from. Additionally, the circles were marked in increments of ten.
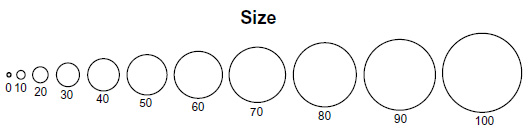 | Figure 1 Size of pain rating scale. |
Data reduction
Descriptive statistics were calculated for age, baseline blood pressure, the SF-36 mental health scale, the SF-36 physical health scale, STAI-trait score, and the IPAQ total score. When rating the size, subjects were instructed to respond with a number rating that corresponded to the circle, which best represented the size of the area of pain. Each increment of ten (ie, 10, 20, 30, 40, etc) was marked with a circle, which progressively increased in size. The numerical scale (0–100) increased in a linear progression. However, the area of the ten circles on the size scale did not increase in a linear progression (ie, ten =39 mm, 20=100 mm, 30=226 mm, 40=353 mm, etc). Thus, a mismatch existed between the progression of the circles and the progression of the numbers on the size scale. Subjects could have rated their pain using the number scale (linear scale) or they could have rated their pain using the actual size of the circles (nonlinear scale). To adjust for differences in scaling between the size and intensity, we determined the equation for the curve based on the size progression of the circles using the logarithmic trend line function in Excel (Microsoft Corporation, Redmond, WA, USA). Then the following transformation was performed on the numbers provided for the size ratings: y=0.228x2 + 0.0307x + 3.4, which resulted in R2=0.99. We conducted all further data reduction and analyses on both the raw data and the transformed data.
For trials 1 and 3, TS of pain intensity (TS-intensity) was calculated by subtracting the pain intensity rating following the first pulse from the pain intensity rating following the fifth pulse and the tenth pulse. Pain intensity ratings made 3 seconds and 6 seconds after labeling the TS-intensity trials as pain intensity aftersensations. For trials 2 and 4, TS of the size of painful area (TS-size) was calculated by subtracting the size pain rating following the first pulse from the size pain rating following the fifth pulse and the tenth pulse. Size of pain ratings made 3 seconds and 6 seconds after labeling the TS-size trials as the size of pain aftersensations.
Data analysis
To determine whether subjects could differentiate between rating the size and intensity of pain, we conducted a small pilot study in a separate sample of individuals. Eleven subjects (seven younger adults and four older adults) were administered four TS trials with an IPI of 2.5 seconds. Subjects rated pain intensity on two trials and size of pain on two trials. Test–retest reliability of the intensity and size ratings were analyzed for pulses 1, 5, and 10 with interclass correlation coefficients (ICCs). Additionally, ICCs were calculated between the intensity and size ratings for pulses 1, 5, and 10. Theoretically, ICCs should be higher for size/size trial comparisons (ie, trial 1 size rating for pulse 1 and trial 2 size rating for pulse 1) compared to size/intensity trial comparisons (ie, trial 1 size rating for pulse 1 and trial 3 pain rating for pulse 1).
Independent t-tests were conducted to determine whether the thermode test temperature and resting blood pressure differed by age. Shapiro–Wilk’s test of normality indicated that the data from the questionnaires were not normally distributed; thus, Mann–Whitney U tests were conducted to determine if SF-36, STAI-trait, and IPAQ total scores differed by age. To determine whether the size and intensity of perceived pain significantly summated in younger and older adults during the TS trials, a 2 (age: younger and older adults) ×2 (IPI: 2.5 seconds and 3.5 seconds) ×10 (pulse) mixed model analysis of variance (ANOVA) was conducted on the TS-intensity trials and on the TS-size trials. To determine whether the magnitude of summation of pain intensity and size ratings differed as a function of age and IPI, an age × IPI × change score (5-1 and 10-1) mixed model ANOVA was conducted on the TS-intensity trials and on the TS-size trials. Intensity and size of pain aftersensations were also analyzed with separate age × IPI × time (3 seconds and 6 seconds) ANOVAs. Post hoc tests were conducted using Tukey’s honestly significant difference procedure. We also wanted to determine whether age differences existed in the size of pain measures after adjusting for potential individual differences in perceived pain intensity. Thus, we conducted the planned one-way ANOVAs with age group as the between subject factor on each size of the pain measure (ie, 5-1 TS-size change score at 2.5-second IPI trial, 10-1 TS-size change score at 2.5-second IPI trial, 5-1 TS-size change score at 3.5-second IPI trial, 10-1 TS-size change score at 3.5-second IPI trial, size of pain aftersensations at 3 seconds, and size of pain aftersensations at 6 seconds), while adding the corresponding pain intensity measure as a covariate. For the size of pain aftersensations, the size rating for the tenth pulse was also added as a covariate. Thermode temperature was added as a covariate for all analyses. Finally, bivariate correlations were conducted to examine the relationship between the size and intensity of pain ratings for pulses 1, 5, and 10 across trials for older and younger adults.
Results
The results did not substantively differ between the raw data and transformed data analyses. Therefore, we are presenting the P-values in the text for the transformed data analyses only. The raw data were used in the figures to allow the reader to directly compare the intensity and size data.
Test–retest reliability for the intensity and size ratings in the pilot study
The test–retest reliability coefficients ranged from 0.72 to 0.84 for pain intensity ratings and from 0.73 to 0.89 for size of pain ratings ranged. Supporting the notion that subjects were differentiating between the size and intensity of pain, the ICCs between size and intensity ratings ranged from 0.068 to 0.67.
Subject characteristics
Subject characteristics are presented in Table 1. No significant differences existed between older and younger subjects on mental health or physical health status on the SF-36, trait anxiety on the STAI-trait, total level of physical activity on the IPAQ, resting blood pressure, or the individualized test temperatures used for the TS trials.
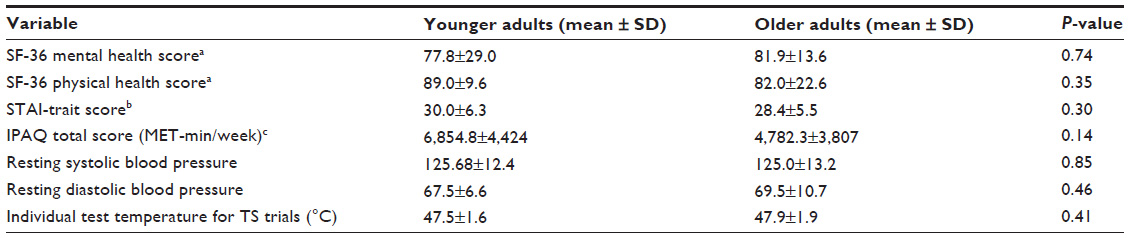 | Table 1 Descriptive characteristics for younger and older adults |
Summation of pain intensity and size ratings in younger and older adults
Figure 2 presents the intensity and size ratings for each pulse for each trial. The ANOVA on the TS-intensity trials revealed a significant main effect of pulse (P=0.001). The follow-up tests indicated that intensity ratings for pulses 2 and 3 were greater than the intensity rating for pulse 1. All other main effects and interactions were not significant, P>0.05.
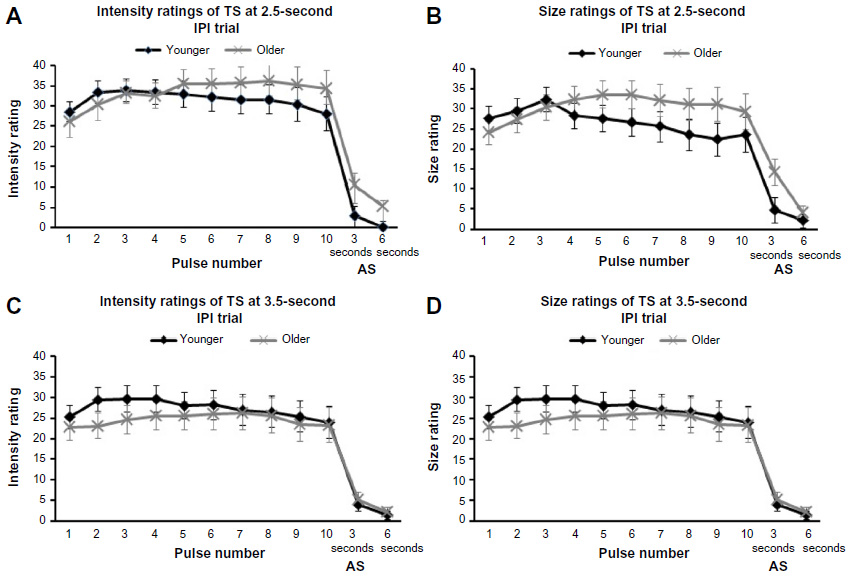 | Figure 2 Mean (SE) of size and intensity of pain ratings following each pulse for each trial for younger and older adults. |
The ANOVA on the TS-size trials revealed a significant age group × pulse interaction term (P<0.001). The follow-up tests indicated that older adults rated the size of pain greater following pulses 6–10 compared to the first and second pulse. Additionally, older adults rated pulses 6–10 higher than younger adults. No significant differences were found between the size ratings of pulses for younger adults. All other main effects and interactions were not significant, P>0.05.
Age differences in TS (change score) of pain intensity and size ratings
The three-way ANOVA on the TS-intensity trials revealed a significant main effect of change score, with the 5-1 change score (M=5.92, SE =1.76) greater than the 10-1 change score (M=3.69, SE =2.80), P=0.019. All other main effects and interactions were not significant, P>0.05.
The ANOVA conducted on the TS-size trials showed a significant effect of age group (P=0.004) and a significant age group by change score interaction (P=0.04). Older adults exhibited greater TS of the size of pain area ratings compared to the younger adults at the 5-1 and 10-1 change scores (Figure 3). All other main effects and interactions were not significant, P>0.05.
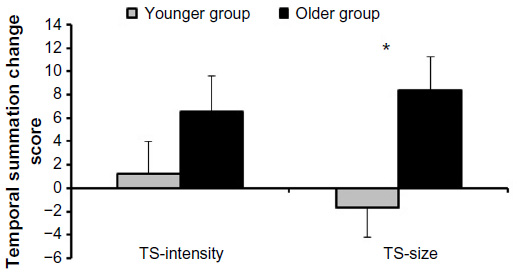 | Figure 3 Average temporal summation of pain intensity and size ratings for older and younger adults averaged across IPIs and change scores (ie, 5-1 and 10-1). |
The planned ANOVAs conducted on the size of pain measures revealed age differences even after adjusting for pain intensity ratings. During the 2.5-second IPI trial, older adults showed an increased summation of size ratings for the 5-1 change score (P=0.009) and for the 10-1 change score (P=0.006). During the 3.5-second IPI trials, older adults exhibited greater summation of size ratings compared to younger adults for the 10-1 change score (P=0.006) but not for the 5-1 change score (P=0.193). Figure 4A shows the adjusted mean and SE for the TS of size ratings for each trial for younger and older adults.
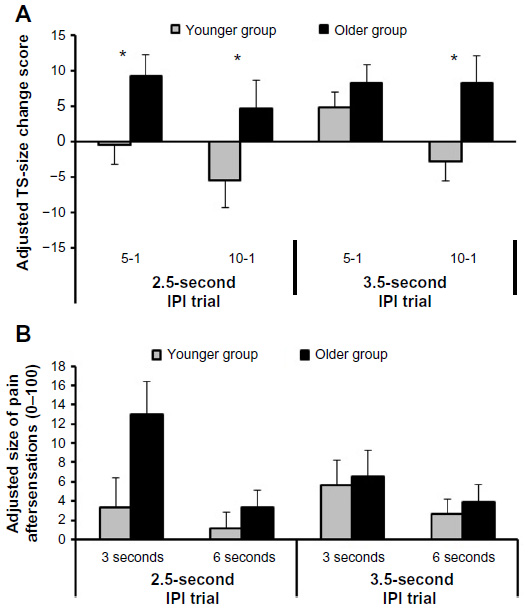 | Figure 4 (A) Adjusted average TS-size change scores for each trial for older and younger adults. Adjustments were made for thermode temperature and TS-intensity change scores. (B) Adjusted average size of pain aftersensations for each trial for older and younger adults. Adjustments were made for thermode temperature, intensity of pain aftersensation ratings, and the size rating of the tenth pulse. |
Age differences in pain intensity and size aftersensations
The three-way ANOVA conducted on the TS-intensity trials revealed a significant age group × IPI interaction, P=0.033. Older adults reported greater pain intensity aftersensations compared to younger adults during the 2.5-second IPI trials (Figure 5). All other main effects and interactions were not significant, P>0.05.
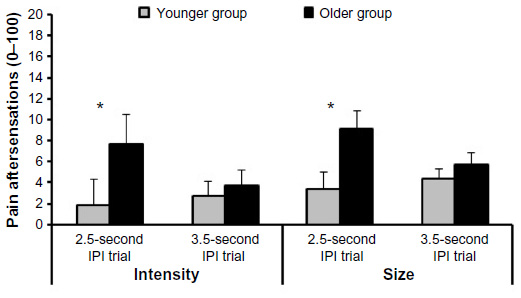 | Figure 5 Average pain intensity and size aftersensations for older and younger adults averaged across time (ie, 3 seconds and 6 seconds). |
The three-way ANOVA conducted on the TS-size trials also showed a significant age group × IPI interaction (P=0.046), with older adults reporting greater size of pain aftersensations compared to younger adults during the 2.5-second IPI trials (Figure 5). The analysis also revealed an age group × time interaction (P=0.043), with older adults reporting greater size of pain aftersensations at 3 seconds compared to younger adults at 3 seconds and 6 seconds.
After adjusting for pain intensity aftersensation ratings and size pain ratings of the tenth pulse, a nonsignificant trend was found for the size aftersensation ratings reported 3 seconds after the 2.5-second IPI trial (P=0.06). However, this same analysis on the raw data revealed significant age differences (P=0.035), in which older adults reported greater size of pain aftersensations compared to younger adults. The ANOVAs for the 2.5-second IPI trial at 6 seconds and for the 3.5-second IPI trial were not significant (P>0.05). Figure 4B shows the adjusted mean and SE for the size of pain aftersensation ratings for each trial for younger and older adults.
Correlations among size and intensity ratings for TS trials
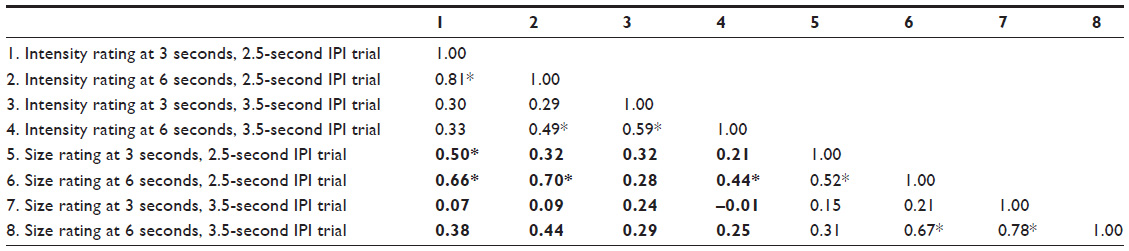
The bivariate correlations between the size and intensity ratings for the TS trials for younger adults are presented in Table 2. The data indicated moderate-to-high correlations between the intensity ratings of the 2.5-second IPI trial and the intensity ratings of the 3.5-second IPI trial. Similarly, moderate-to-high correlations were found for the size ratings of the 2.5-second and 3.5-second IPI trials. A few significant correlations were found between the intensity and size of pain ratings (indicated with bold in Table 2) for younger adults.
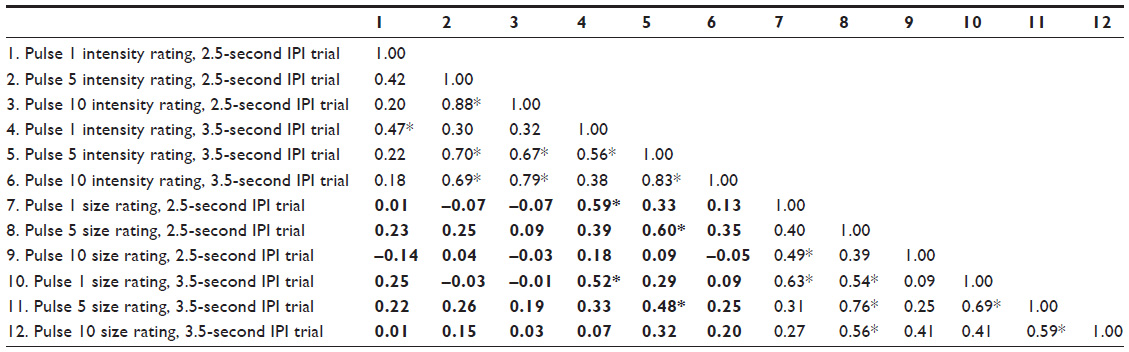 | Table 2 Bivariate correlation matrix between pain intensity and size ratings for temporal summation trials for younger adults |
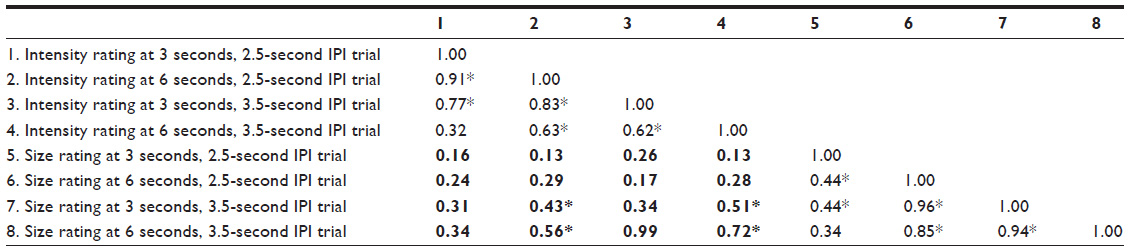
For older adults, the data revealed moderate-to-high correlations between the intensity ratings during the 2.5-second and 3.5-second IPI trials and between the size ratings during the 2.5-second and 3.5-second IPI trials (Table 3). In contrast to the younger adults, several significant relationships were found between the size and intensity ratings (indicated with bold in Table 3). Notably, moderate correlations (ranging from 0.48 to 0.70) were found between the corresponding size and intensity ratings (eg, size rating for pulse 1 of the 2.5-second IPI trial and intensity rating for pulse 1 of the 2.5-second IPI trial).
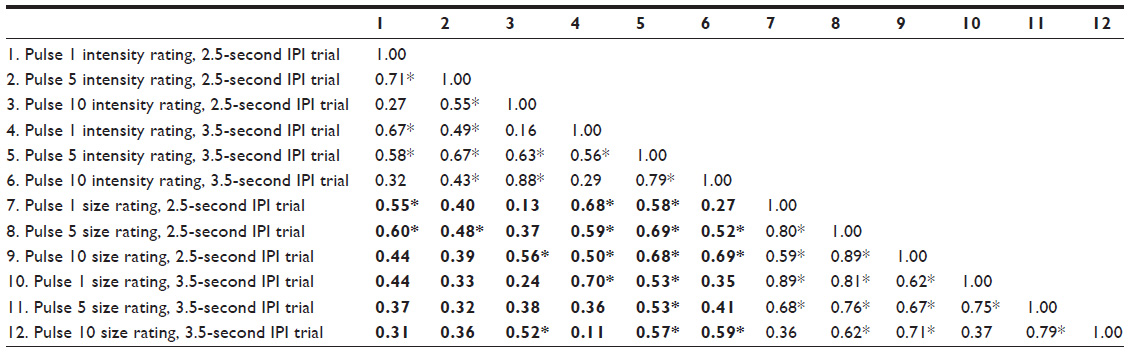 | Table 3 Bivariate correlation matrix between pain intensity and size ratings for temporal summation trials for older adults |
Correlations among size and intensity ratings for pain aftersensations
The bivariate correlations between the size and intensity ratings of the pain aftersensations are presented in Table 4 for younger adults and in Table 5 for older adults. In younger adults, the intensity ratings for the 2.5-second and 3.5-second IPI trials were moderately correlated at 6 seconds but not significantly correlated at 3 seconds. Similarly, the size ratings for the 2.5-second and 3.5-second IPI trials were moderately correlated at 6 seconds but not significantly correlated at 3 seconds. Significant moderate correlations were found between the size and intensity ratings of the pain aftersensations for the 2.5-second IPI trials but not for the 3.5-second IPI trials.
 | Table 4 Bivariate correlation matrix between pain intensity and size ratings for pain aftersensations for younger adults |
 | Table 5 Bivariate correlation matrix between pain intensity and size ratings for pain aftersensations for older adults |
For the older adults, the data showed moderate-to-high correlations between the intensity ratings following the 2.5-second and 3.5-second IPI trials and between the size ratings following the 2.5-second and 3.5-second IPI trials. No significant correlations were found between the size and intensity ratings for the 2.5-second IPI trials, whereas moderate correlations were observed between the size and intensity ratings for the 3.5-second IPI trials.
Discussion
TS of pain has typically been studied by asking subjects to rate the intensity of late pain sensations. The effect of repetitive noxious stimulation on the spatial dimensions of the pain experience remains poorly characterized. Thus, this study used a new TS protocol that examined changes in the perceived size of the painful area in younger and older adults. Subjects were asked to rate how large or small the area of pain felt after each pulse using a size scale, which presented ten circles progressively increasing in size. Our findings indicated that the perceived size of the painful area significantly summated during the TS protocol, with the magnitude of summation enhanced in older adults compared to younger adults.
Age differences in the TS of size and intensity of pain ratings
As hypothesized, our results indicated that older adults experienced greater summation of size ratings for both the 2.5-second and 3.5-second IPI trials compared to younger adults. Importantly, these size differences were maintained even after controlling for individual differences in the TS of intensity ratings. However, in contrast to previous studies of age-related changes in the TS of heat pain,1,3 we did not find significantly greater summation of pain intensity ratings among healthy older adults. However, it should be noted that the intensity results trended in the hypothesized direction. Perhaps, TS of the size of pain is a more robust measure than TS of pain intensity, particularly given the fact that TS of pain intensity was at best minimal in this study. Methodological explanations could also account for these seemingly contrasting results including the use of slightly different age ranges for the older adult samples (eg, this study age range: 56–77 years vs Lautenbacher et al3 study age range: 63–88 years) and differences in the stimulus intensities and thermode size used for the TS trials.1 For example, Edwards and Fillingim1 found age differences in the TS of heat pain only at lower stimulus intensities (47°C and 50°C) and no differences at higher stimulus intensities (53°C). To control for potential group differences in thermal sensitivity, this study used individualized heat stimulus intensities so that each individual would experience a moderate level of pain. Perhaps, age differences in the TS of pain intensity are magnified at certain stimulus temperatures and with increasing age of the older adult sample.
Enhanced TS of size ratings with age could be due to age-related changes in endogenous facilitatory or inhibitory pain processes. Electrophysiological studies indicate that TS of repetitive noxious stimuli reflects the progressive increase in dorsal horn neuron responses to repetitive C-fiber discharge.15,16 TS of pain is often exaggerated in chronic pain conditions characterized by abnormal central nociceptive processing (ie, fibromyalgia, tempromandibular joint disorder, and complex regional pain syndrome) and has been used as an indication of central sensitization.6,9 Thus, our results in combination with others suggest that older adults may be characterized by an enhancement of central sensitization.1–4 Sensitized dorsal horn neurons exhibit several property changes including an enlargement of receptive fields and changes that outlast an initiating trigger (ie, pain aftersensations).17 In an animal study, Li et al18 showed that the neuronal events leading up to TS also produce an expansion of the receptive field area of dorsal horn neurons. This expansion likely reflects recruitment of novel inputs or strengthening of weaker inputs in the surrounding fringes.19–21 It has been suggested that receptor field expansion may contribute to spatial characteristics of central sensitization, such as the spread of pain beyond the site of injury.17,22,23 Additionally, an increase in neuron recruitment during repetitive noxious stimulation via activation of peripheral zones of neighboring receptor fields of dorsal horn neurons could also produce the sensation that the size of the area of pain is increasing.11,24,25 Indeed, the radiation of pain (ie, sensation of pain spreads outward from the location of stimulation) has been attributed to the activation of peripheral zones of neighboring receptor fields.25
Alternatively, deficits in endogenous pain inhibitory systems in older adults could also cause the increased size of perceived pain during TS. Endogenous systems inhibit pain at numerous sites along the neuroaxis, including the dorsal horn neurons of the spinal cord at which TS occurs.26 Furthermore, TS of pain results from the repetitive stimulation of peripheral unmyelinated C-fibers,15 which are particularly susceptible to opioid inhibition.27,28 Thus, reduced endogenous opioid inhibition could lead to enhanced TS of pain. Importantly, animal studies have demonstrated an age-related decline in opioid and nonopioid analgesic systems.29,30 Additionally, human studies have shown that older adults exhibit reduced pain inhibitory capacity with opioid- (conditioned pain modulation3,4,31) and nonopioid-mediated (offset analgesia32) psychophysical models of pain inhibition. Nonetheless, future research is needed to further substantiate both the mechanisms producing summation of the perceived size of pain and the mechanisms underlying the increased endogenous facilitation of pain associated with aging.
Age differences in the pain intensity and size aftersensations
Pain aftersensations following TS of second pain are enhanced in chronic pain conditions characterized by generalized central sensitization, such as fibromyalgia.9,33 Animal work shows that following the cessation of repetitive nociceptive input, dorsal horn wide dynamic range (WDR) neuronal activity returns rapidly to baseline (within seconds).18,34 This is supported by human studies showing that TS of heat pain decays rapidly and becomes undetectable within 6 seconds after termination of nociceptive stimulation in healthy adults.16,33 To our knowledge, this study was the first to examine the influence of age on pain aftersensations following the cessation of a TS of pain test. Our results suggest that the size and intensity of pain sensations following the 2.5-second IPI TS trials dissipate more slowly in older adults compared to younger adults. Importantly, age difference in the size of pain aftersensations remained even after controlling for individual differences in the intensity aftersensations and the size ratings of the last pulse. These findings are in line with Riley et al4 who found increased lingering pain in older adults compared to younger adults following prolonged noxious thermal stimulation. Increased pain aftersensations represent another manifestation of a sensitized nociceptive system and, therefore, may be another indication of an age-related increase in central sensitization.
Methodological issues and future directions
An important methodological issue regarding the validity of the current results involves the ability of subjects to accurately rate the size of pain and/or differentiate between the size and intensity of pain when making each pain rating. While we cannot completely ensure that subjects always rated the size of pain vs intensity of pain when instructed to do so, several steps were taken to support the validity of the size data. First, all subjects received training on how to rate the intensity and size of pain prior to the experimental trials. Second, our planned analyses on the size data showed that age differences existed in the TS of size ratings even after controlling for individual differences in the TS of pain intensity. Third, we also examined the relationship between the intensity and size ratings for younger and older adults. The older adults generally showed moderate relationships between the intensity and size ratings. Given that a sensitized nociceptive system is characterized by temporal, spatial, and threshold changes in response to nociceptive afferent input, a positive relationship between the intensity and spatial dimensions of the pain experience should be expected. Importantly, however, the intensity ratings for the 2.5-second and 3.5-second IPI trials were generally more highly intercorrelated than the correlations between the size and intensity ratings. Interestingly, the younger adults showed little to no relationship between the size and intensity ratings, which could be due to several factors. The lack of relationship may indicate that younger adults were truly rating two different mechanistic constructs. Additionally, given that the younger adults displayed little to no summation of size and intensity ratings, the lack of variability in responses to the TS protocol may have attenuated correlation coefficients. Finally, and perhaps most importantly, our pilot testing in a subgroup of individuals indicated that subjects were rating different constructs when asked to rate pain intensity and the size of pain.
Further research is needed to validate the current findings and determine mechanistically whether the summation of size represents a different correlate of central sensitization relative to the summation of pain intensity. Furthermore, additional studies should investigate the TS of size ratings in clinical populations and determine the clinical relevance of enhanced summation of the perceived size of the painful area. For example, studies could explore whether the increased summation of size ratings is related to spatial aspects of the clinical pain experience, such as greater radiation of pain or referred pain.
Acknowledgments
This research was supported by grants R01AG039659 and K01 AG048259 from the National Institutes of Health and the National Institute on Aging, and grant T32 T32NS045551-06 from the National Institutes of Health.
Disclosure
The authors report no conflicts of interest in this work.
References
Edwards RR, Fillingim RB. Effects of age on temporal summation and habituation of thermal pain: clinical relevance in healthy older and younger adults. J Pain. 2001;2:307–317. | |
Farrell M, Gibson S. Age interacts with stimulus frequency in the temporal summation of pain. Pain Med. 2007;8:514–520. | |
Lautenbacher S, Kunz M, Strate P, Nielsen J, Arendt-Nielsen L. Age effects on pain thresholds, temporal summation and spatial summation of heat and pressure pain. Pain. 2005;115:410–418. | |
Riley JL 3rd, King CD, Wong F, Fillingim RB, Mauderli AP. Lack of endogenous modulation and reduced decay of prolonged heat pain in older adults. Pain. 2010;150:153–160. | |
Edwards RR, Ness TJ, Weigent DA, Fillingim RB. Individual differences in diffuse noxious inhibitory controls (DNIC): association with clinical variables. Pain. 2003;106:427–437. | |
Staud R. Abnormal endogenous pain modulation is a shared characteristic of many chronic pain conditions. Expert Rev Neurother. 2012;12(5):577–585. | |
Yarnitsky D, Crispel Y, Eisenberg E, et al. Prediction of chronic post-operative pain: pre-operative DNIC testing identifies patients at risk. Pain. 2008;138(1):22–28. | |
Harkins SW, Davis MD, Bush FM, Kasberger J. Suppression of first pain and slow temporal summation of second pain in relation to age. J Gerontol A Biol Sci Med Sci. 1996;51:M260–M265. | |
Staud R, Robinson ME, Price DD. Temporal summation of second pain and its maintenance are useful for characterizing widespread central sensitization of fibromyalgia patients. J Pain. 2007;8(11):893–901. | |
Price DD, Dubner R. Neurons that subserve the sensory-discriminate aspects of pain. Pain. 1977;3(4):307–338. | |
Quevedo AS, Coghill RC. Filling-in, spatial summation, and radiation of pain: evidence for a neural population code in the nociceptive system. J Neurophysiol. 2009;102(6):3544–3553. | |
Ware JE, Kosinski M, Dewey JE. How to Score Version Two of the SF-36 Health Survey. Lincoln, RI: QualityMetric, Incorporated; 2000. | |
Spielberger CD, Gorsuch RL, Lushene RE. Manual for the State-Trait Anxiety Inventory. Palo Alto, CA: Consulting Psychologists Press; 1982. | |
Craig CL, Marshall AL, Sjöström M, et al. International physical activity questionnaire: 12-country reliability and validity. Med Sci Sports Exerc. 2003;35(8):1381–1395. | |
Price DD, Hu JW, Dubner R, Gracely RH. Peripheral suppression of first pain and central summation of second pain evoked by noxious heat pulses. Pain. 1977;3(1):57–68. | |
Vierck CJ, Cannon RL, Fry G, Maixner W, Whitsel BL. Characteristics of temporal summation of second pain sensations elicited by brief contact of glabrous skin by a preheated thermode. J Neurophysiol. 1997;78(2):992–1002. | |
Latremoliere A, Woolf CJ. Central sensitization: a generator of pain hypersensitivity by central neural plasticity. J Pain. 2009; 10(9):895–926. | |
Li J, Simone DA, Larson AA. Windup leads to characteristics of central sensitization. Pain. 1999;79:75–82. | |
Cook AJ, Woolf CJ, Wall PD, McMahon SB. Dynamic receptive field plasticity in rat spinal dorsal horn following C-primary afferent input. Nature. 1987;325:151–153. | |
Pubols LM, Fogelsong ME, Vahle-Hinz C. Electorical stimulation reveals relatively ineffective sural nerve projections to dorsal horn neurons in the cat. Brain Res. 1986;371:109–122. | |
Woolf CJ, King AE. Dynamic alteration in the cutaneous mechanoreceptive fields of dorsal horn neurons in the rate spinal cord. J Neurosci. 1990;10:2717–2726. | |
Campbell JN, Meyer RA, LaMotte RH. Sensitization of myelinated nociceptive afferents that innervate monkey hand. J Neurophysiol. 1979;42:1669–1679. | |
LaMotte RH, Thalhammer JG, Robinson CJ. Peripheral neural correlates of magnitude of cutaneous pain and hyperalgesia: a comparison of neural events in monkey with sensory judgements in human. J Neurophysiol. 1983;50:1–26. | |
Coghill RC, Mayer DJ, Price DD. The roles of spatial recruitment and discharge frequency in spinal cord coding of pain: a combined electrophysiological and imaging investigation. Pain. 1993;53(3):295–309. | |
Price DD, Hayes RL, Ruda M, Dubner R. Spatial and temporal transformations of input to spinothalamic tract neurons and their relation to somatic sensations. J Neurophysiol. 1978;41:933–947. | |
Basbaum AI, Fields HL. Endogenous pain control systems: brainstem spinal pathways and endorphin circuitry. Annu Rev Neurosci. 1984;7:309–338. | |
Cooper BY, Vierck CJ Jr, Yeomans DC. Selective reduction of second pain sensations by systemic morphine in humans. Pain. 1986;24:93–116. | |
Price DD, Von der Gruen A, Miller J, Rafii A, Price C. A psychophysical analysis of morphine analgesia. Pain. 1985;22:261–269. | |
Goicoechea C, Ormazábal MJ, Alfaro MJ, Martín MI. Age-related changes in nociception, behavior, and monoamine levels in rats. Gen Pharmacol. 1997;28:331–336. | |
Hamm RJ, Knisely JS. Environmentally induced analgesia: an age-related decline in an endogenous opioid system. J Gerontol. 1985;40(3):268–274. | |
Edwards RR, Fillingim RB, Ness TJ. Age-related differences in endogenous pain modulation: a comparison of diffuse noxious inhibitory controls in healthy older and younger adults. Pain. 2003;101:155–165. | |
Naugle KM, Cruz-Almeida Y, Fillingim RB, Riley JL 3rd. Offset analgesia is reduced in older adults. Pain. 2013;154:2381–2387. | |
Staud R, Vierck CJ, Cannon RL, Mauderli AP, Price DD. Abnormal sensitization and temporal summation of second pain (wind-up) in patients with fibromyalgia syndrome. Pain. 2001;91(1–2):165–175. | |
Larson MA, McHaffie JG, Stein BE. Response properties of nociceptive and low-threshold mechanoreceptive neurons in the hamster superior colliculus. J Neurosci. 1987;7(2):547–564. |
 © 2016 The Author(s). This work is published and licensed by Dove Medical Press Limited. The
full terms of this license are available at https://www.dovepress.com/terms
and incorporate the Creative Commons Attribution
- Non Commercial (unported, 3.0) License.
By accessing the work you hereby accept the Terms. Non-commercial uses of the work are permitted
without any further permission from Dove Medical Press Limited, provided the work is properly
attributed. For permission for commercial use of this work, please see paragraphs 4.2 and 5 of our Terms.
© 2016 The Author(s). This work is published and licensed by Dove Medical Press Limited. The
full terms of this license are available at https://www.dovepress.com/terms
and incorporate the Creative Commons Attribution
- Non Commercial (unported, 3.0) License.
By accessing the work you hereby accept the Terms. Non-commercial uses of the work are permitted
without any further permission from Dove Medical Press Limited, provided the work is properly
attributed. For permission for commercial use of this work, please see paragraphs 4.2 and 5 of our Terms.