Back to Journals » Diabetes, Metabolic Syndrome and Obesity » Volume 15
Novel Insight into the Relationship Between Muscle-Fat and Bone in Type 2 Diabetes Ranging from Normal Weight to Obesity
Authors Wang H, Peng H, Zhang L, Gao W, Ye J ![]()
Received 25 February 2022
Accepted for publication 30 April 2022
Published 10 May 2022 Volume 2022:15 Pages 1473—1484
DOI https://doi.org/10.2147/DMSO.S364112
Checked for plagiarism Yes
Review by Single anonymous peer review
Peer reviewer comments 2
Editor who approved publication: Professor Ming-Hui Zou
Hui Wang,1,* Huaiming Peng,1,* Linlin Zhang,1 Wei Gao,1 Jingya Ye2,3
1Department of Endocrinology, Yancheng City No.6 People’s Hospital, Yancheng, Jiangsu Province, People’s Republic of China; 2Department of Endocrinology, Second Affiliated Hospital, Zhejiang University School of Medicine, Hangzhou, People’s Republic of China; 3Department of Endocrinology, The First Affiliated Hospital of Nanjing Medical University (Jiangsu Province Hospital), Nanjing, Jiangsu, People’s Republic of China
*These authors contributed equally to this work
Correspondence: Jingya Ye, Department of Endocrinology, Second Affiliated Hospital, Zhejiang University School of Medicine, Hangzhou, 310000, People’s Republic of China, Tel +011-86-571-87783882, Fax +011-86-571-87022776, Email [email protected]
Objective: Decreased bone mineral density (BMD) is a common complication in individuals with type 2 diabetes mellitus (T2DM). Body weight, mainly consisting of muscle and fat, is the main determinant of BMD and fracture risks but does not accurately describe nutritional status. Most studies suggest that skeletal muscle mass (SMM) promotes BMD, while body fat mass (BFM) decreases BMD. However, the combined effect of SMM and BFM on BMD is elusive. Thus, the study aims to explore the combined effect of fat and muscle by the ratio index SMM/BFM on BMD in T2DM.
Methods: BFM and SMM were measured by the bioelectrical impedance analysis (BIA) method among 593 T2DM individuals ranging from normal weight and obesity. BMD was analyzed by DXA. Novel non-linear generalized additive models (GAMs) were used as the statistical analysis method.
Results: The results demonstrated that BMD T score/Z score of both femur and lumbar vertebrae were significantly higher and waist–hip ratio (WHR) was significantly lower in the high SMM/BFM group of both normal weight and overweight groups in T2DM individuals. Hence, SMM/BFM might be a good factor indicating BMD in different weight ranges. Additionally, the relationship between muscle fat and BMD was not linear. Notably, this correlation was not influenced by hyperglycemia in T2DM since different analytic models adjusted with the age, gender, BMI and HbA1c were adopted in this study. Furthermore, the impact of trunk fat (central, visceral fat most) and non-trunk fat (peripheral, the sum of subcutaneous limb fat most) on BMD was inconsistent. BMD presented unlimited reduction with trunk BFM increasing, while sustaining minimal diminishment with non-trunk BFM accumulation.
Conclusion: Our study provided a novel viewpoint relationship between muscle-fat and bone, and SMM/BFM might be a potential biomarker for bone health and clinical treatments of diabetes and related metabolic syndromes.
Keywords: bone mineral density, skeletal muscle mass, body fat mass, type 2 diabetes, non-linear correlation
Introduction
The motion system, consisting primarily of bone, plays a fundamental role in human body maintenance and movements, and bone health is a worldwide health concern related to osteoporosis, fractures, and subsequent high death.1 Measurement of bone mineral density (BMD) is generally used as a tool for the diagnosis of osteoporosis, and low BMD is one of the most robust risk determinants for fracture.2,3 Body weight is the main determinant of bone density and fracture risks, and muscle and fat are major contributors to this relationship. Furthermore, body composition points to the amount and distribution of muscle and fat tissue of the body. It outstretches body weight and body mass index (BMI) on BMD since body weight and BMI do not accurately describe nutritional status and abnormalities in relative divisions of fat and muscle.4 For instance, the elderly with normal weight and BMI have a huge reduction in muscle and potential deteriorated bone.5 Likewise, significantly incremental visceral adipose tissue may occur regardless of changes in the whole body weight.6 Similar BMIs might consist of distinct fat and muscle deviation, body or bone health status might not be simply judged by BMI alone. It is necessary to understand the relationship between muscle-fat and bone in individuals with certain BMI ranging from normal weight and obesity.
Muscle, fat and bone function together and interact with each other; however, most previous studies considered the effect of muscle or fat on BMD separately and suggested that muscle and fat exert adverse effects on BMD or bone health. Muscle exposes biomechanical strengths on bone, making the skeleton strong, and was positively correlated with BMD.7–9 Nevertheless, body fat was supposed to be negatively correlated with BMD,10,11 as adipose tissue prompted inflammation and resulted in bone damage. Besides, adipose tissue prompted atrophy in muscles during obesity,12 leading to the decrease in BMD. However, it remains unclear that the combined effect of muscle and fat with certain body weight or BMI on BMD. Additionally, the single linear model (linear regression) used before might have limitations since weight gain in muscle or fat is not endless but within a limited range. Further, few data are available on individuals with type two diabetes (T2DM), though the relationship between BMD and body composition has been widely discussed in children, the elderly and obesity.3,13,14 This is in that fragility fractures have been recognized as a crucial diabetes complication.15 Hence, and the novelty of our study is that we firstly observe the combined effect of muscle-fat on BMD with novel non-linear covariate-adjusted penalized spline generalized additive models (GAMs) in specific T2DM individuals. This provides a novel insight into the relationship between muscle-fat and bone, as well as potential diagnostic or prognostic indicators for distinguishing between metabolic healthy obesity and metabolic unhealthy obesity such as T2DM.
Materials and Methods
Participants
This was a cross-sectional study among 593 Chinese adults diagnosed with T2DM (fasting blood glucose (FBG) ≥7.0 mmol/L, or 2-hour plasma glucose (2hPG) ≥11.1 mmol/L, or HbA1c ≥6.5%). The total number of the subjects in this study is 289 males (48.7%) and 304 females (51.3%), ages 30–88. Subjects were excluded for one or more of the following reasons: 1) with incomplete data, 2) with chronic diseases that might influence bone metabolism including thyroid or parathyroid diseases, hepatitis or diabetic nephropathy, or had been on hormone replacement therapy, or had used anti-osteoporotic drugs before blood sampling. To prevent the influence of genetic severe obesity and malnutrition, BMI is limited between 18 and 35, and extremely obese T2DM patients were excluded. To prevent the influence of genetic severe obesity and malnutrition, “Normal weight” was defined as 18< BMI ≤ 24, “Overweight” was defined as 24< BMI ≤ 30, and “Obese I” was defined as 30< BMI ≤ 35.
Laboratory Analysis
Whole-blood glucose was measured by a biochemical analyzer. Serum insulin and C-peptide were analyzed with a chemiluminescent method. HbA1c was analyzed by a chromatographic technique. Total cholesterol (TC), triglyceride (TG), LDL-cholesterol (LDL-c), HDL-cholesterol (HDL-c) and other biochemical phenotypes were measured with standard enzymatic assays in the hospital laboratory.
Anthropometry and Body Composition
Height and weight without shoes and heavy clothes were recorded. Under measurements, the participants were in normal indoor clothes (t-shirts or shorts and pants). The formula for BMI is weight in kilograms divided by height in meters squared. Meanwhile, SMM, BFM, body water, proteins, and minerals were performed in Inbody 270, a non-invasive body composition measurement using the BIA method.
Body Composition Measurements and Z/T Score
BMD was performed in Horizon DXA system including lumbar vertebrae (L1–L4) and femur vertebrae and analyzed by specialized software to calculate T-score/Z-score. A bone density test was performed to determine bone mineral density (BMD). BMD was compared to 2 norms-healthy adults (T-score) or age-matched adults (Z-score). The World Health Organization cutoff value of Z-score and T-score for osteoporosis is −2 and −2.5.16 It is considered to be decreased BMD when the T value was between −1 and −2.5. Therefore, those points were the ones emphasized in the present analysis.
Statistical Analysis
The variables were checked for normality and presented as mean ± standard deviation (SD), unless noted otherwise. Analysis of variance (ANOVA) was used to calculate significant differences among the divergent groups (normal weight, overweight and obesity I) for anthropometrics, body composition, and BMD. Student's t-test or Mann–Whitney’s U-test was utilized to determine significant differences between two groups (low and high) divided by the median of SMM/BFM. Covariate-adjusted penalized spline GAMs were used to explore the associations of 1) overall fat-free mass (FFM), 2) overall BFM, 3) components of total body fat mass (trunk and non-trunk BFM), 4) total SMM, and 5) SMM/BFM with BMD Z-score when it was adjusted by age, gender, BMI and HbA1c. The statistical methods were performed with the R studio.
Results
General Characteristics of T2DM Subjects
The T2DM subjects were divided into two groups according to the gender differences to exclude the effect of sex hormones on BMD. The mean course of diabetes history was 8.1 years in men and 8.4 years in women, respectively. To investigate the correlation of muscle-fat and bone in certain body weight or BMI, patients were further divided into three subgroups according to BMI (normal weight, overweight and obese I). In each sub-group, “low” or “high” groups were further divided by the median of SMM/BFM (Tables 1 and 2). There was no significant difference in HbA1c in subgroups. The average of HbA1c was 9.18, 9.17, and 9.17 mmol/L in male normal weight, overweight, and obesity I, respectively, and 8.98, 9.18, 9.26 mmol/L in female normal weight, overweight, and obesity I, respectively. The mean waist–hip ratio (WHR) and BMD T score of Normal weight, Overweight, and Obese I was “0.88, 0.94, 1.02” and “−1.9, −1.4, −1.5” in men and “0.89, 0.94, 1.00” and “−1.53, −1.92, −1.55” in women. Besides, the average of total cholesterol (TC), triglyceride (TG), high-density lipoprotein cholesterol (HDL-c), and low-density lipoprotein cholesterol (LDL-c) in serum lipid levels were not significantly different in BMI-divided subgroups.
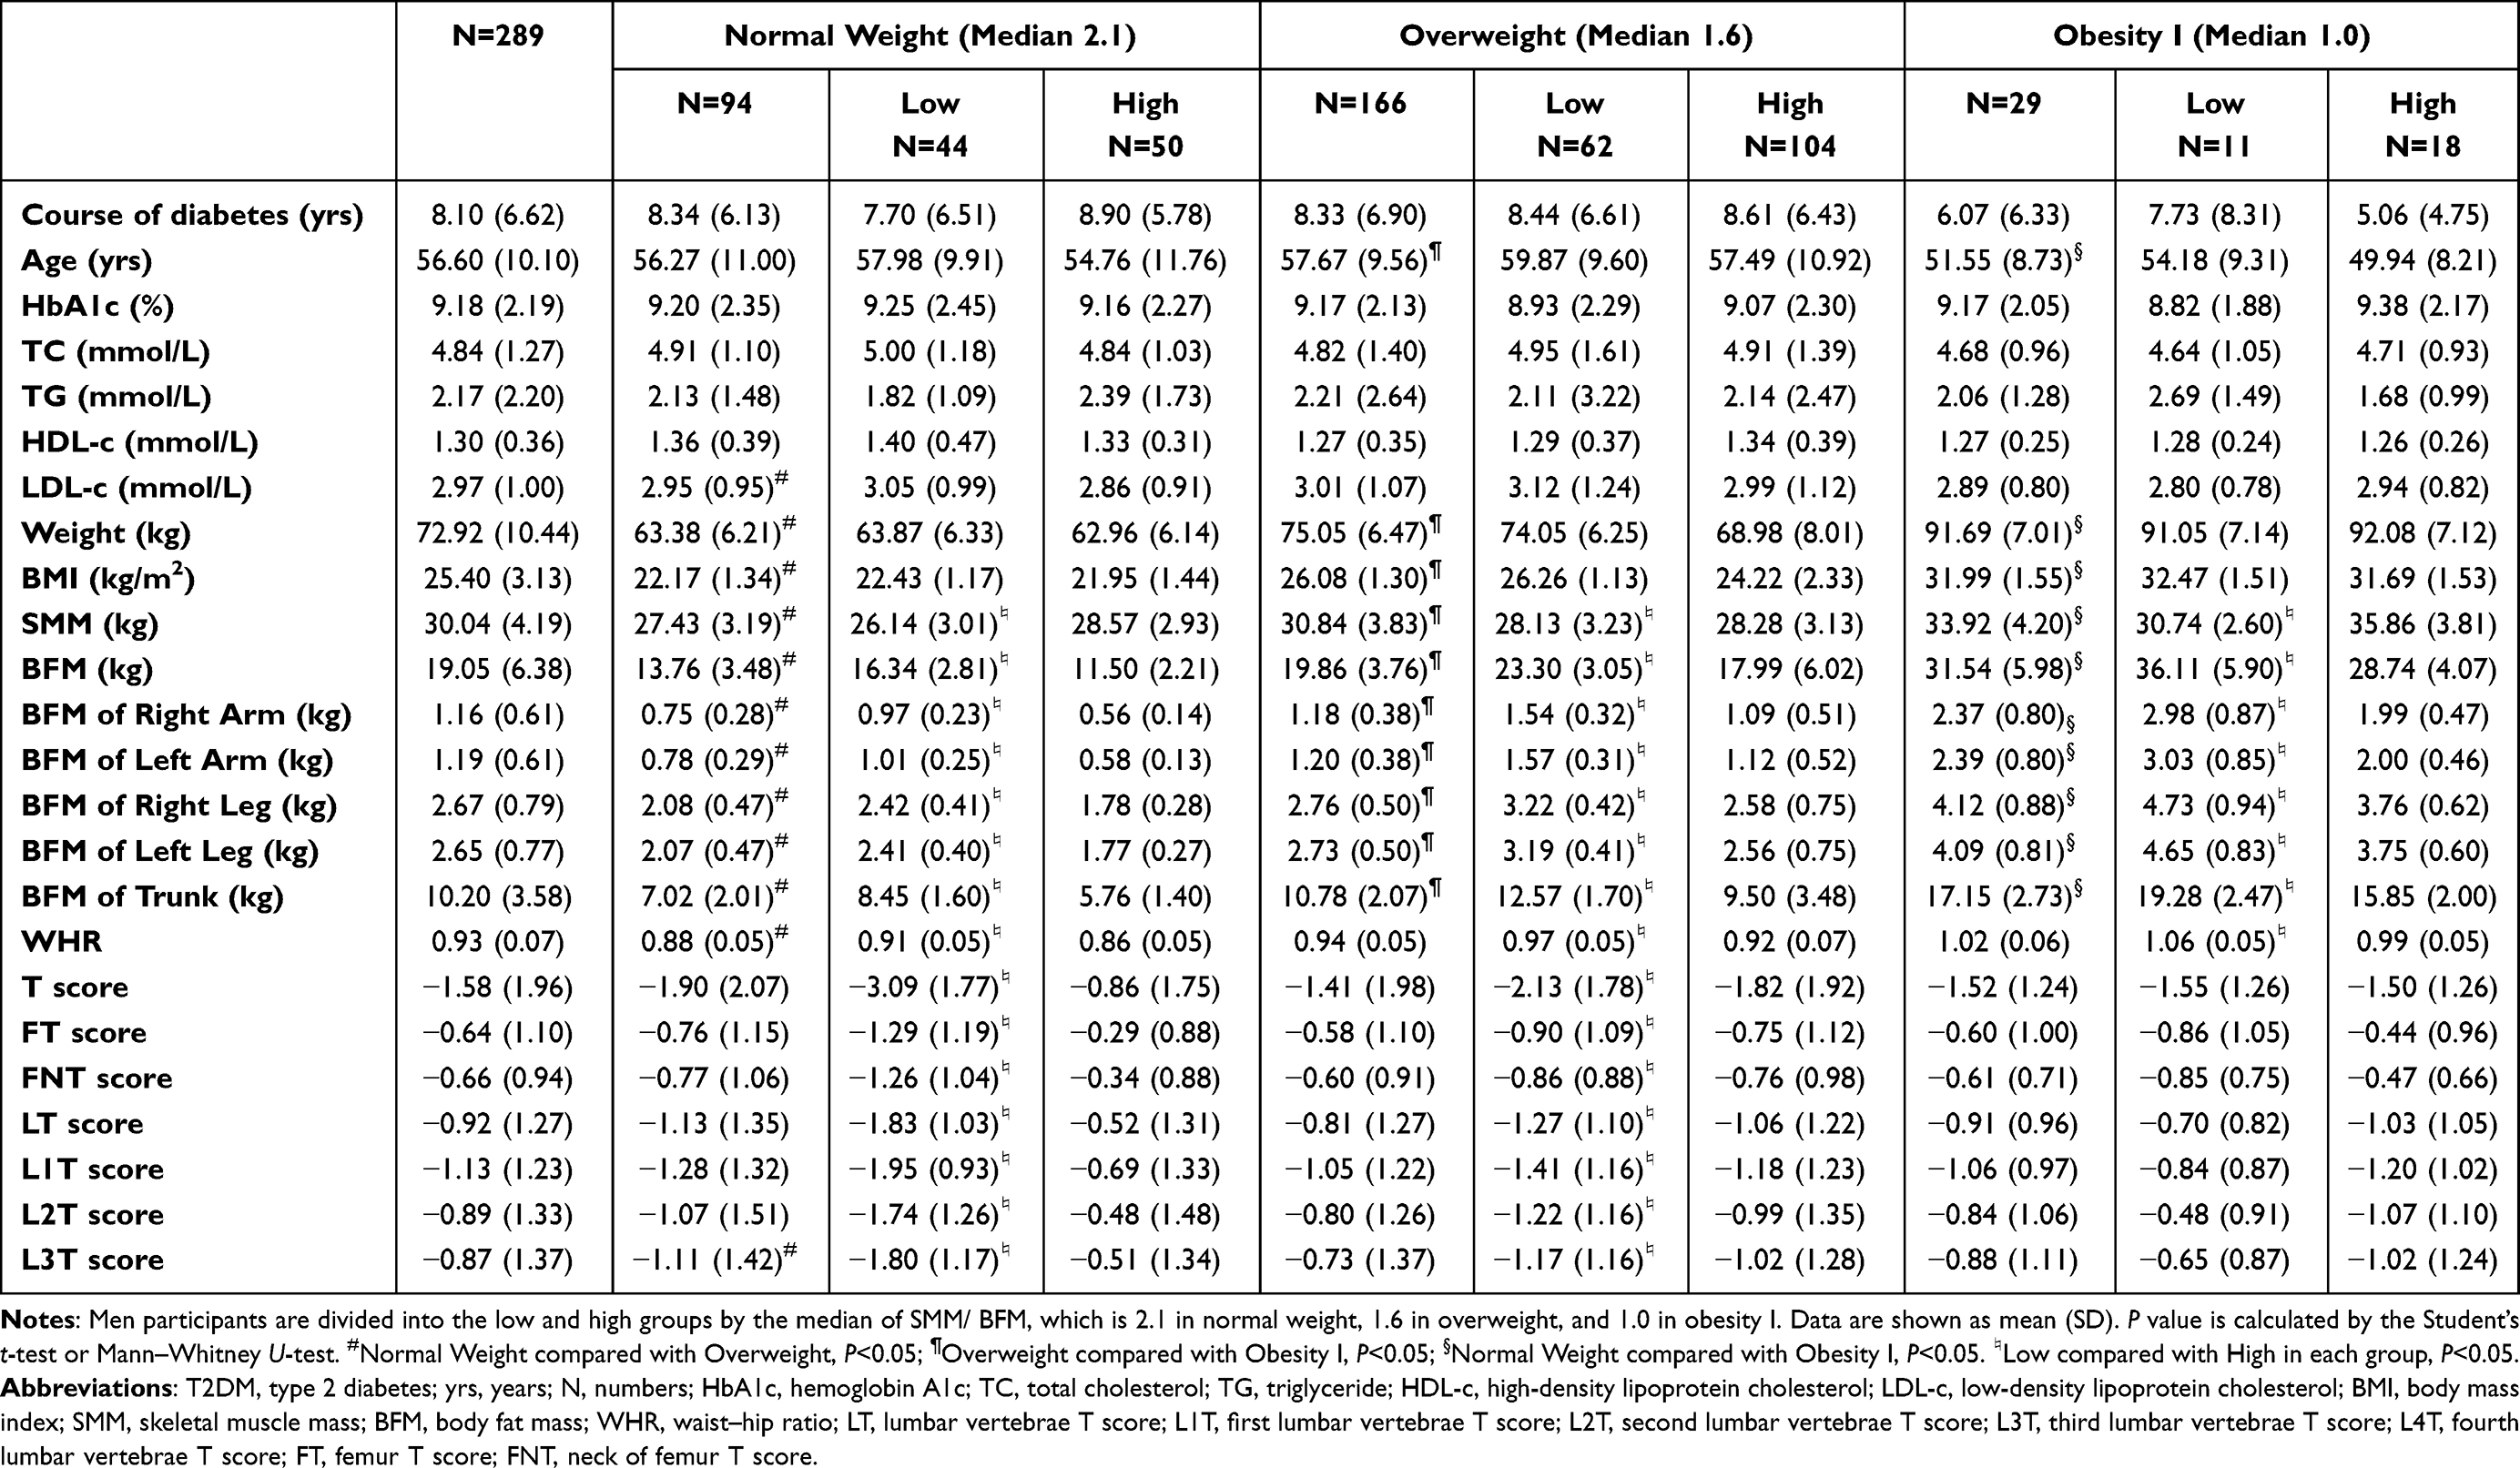 |
Table 1 Clinical Characteristics of the T2DM Adults Ranging from Normal Weight to Obesity Grouped by the Median of SMM/BFM in Men |
 |
Table 2 Clinical Characteristics of the T2DM Adults Ranging from Normal Weight to Obesity Grouped by the Median of SMM/BFM in Women |
Measurement of Body Composition BFM, SMM and BMD T Score in T2DM Individuals
This study revealed that BMD was significantly higher in the high SMM/BFM group of both normal weight and overweight groups in T2DM adults. This phenomenon disappeared in the obese group (Figures 1 and 2). These data indicated that muscle had a strong positive effect on BMD in a physiologic status. However, this effect disappeared when fat was excessively deposited in our bodies. In the normal-weight group, muscle mass was greater than fat mass (30.04 kg of SMM and 19.05 kg of BFM in men and 21.28 kg of SMM and 15.41 kg of BFM). However, fat mass was closer to muscle mass, reaching 1:1 in the obese group in men, while that of women reached 1:1 in the overweight group in women (Tables 1 and 2). In addition, trunk BFM (central, visceral fat most) increased more significantly compared to non-trunk BFM (peripheral, sum of subcutaneous limb fat most). Among men, the trunk BFM of overweight and obese men was 10.78 kg and 17.15 kg, respectively, with an increase of 53.5% and 144.3% relative to normal men; the non-trunk BFM was 7.87 kg (1.18 kg+1.20 kg+2.76 kg+2.73 kg) and 12.97 kg (2.37 kg+2.39 kg+4.12 kg+4.09 kg), respectively, with an increase of 38.5% and 128.3%, respectively. Trunk BFM in overweight and obese women was 12.55kg and 17.11kg, respectively, with an increase of 60.4% and 118.8% relative to normal women, and non-trunk BFM was 10.04kg (1.70 kg+ 1.70 kg +3.33 kg + 3.31 kg) and 13.64kg (2.55 kg + 2.57 kg+ 4.28 kg+4.24 kg), with an increase of 53% and 107.9%, respectively. Notably, the BMD of the lumbar vertebrae, not femur vertebrae T score, significantly decreased from normal weight to overweight in women. Nevertheless, only L3T reduced significantly from normal weight to overweight in men. These data suggested that increased body fat may damage lumbar vertebrae before femur bone. Moreover, both lumbar and femur T score was worse in the low SMM/BFM group compared with the high SMM/BFM group.
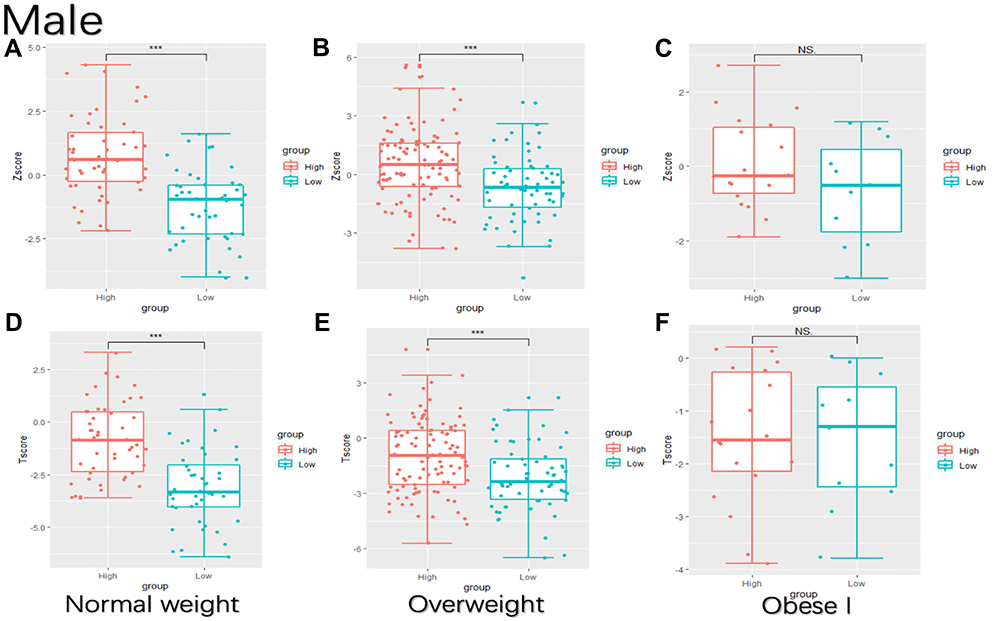 |
Figure 1 BMD calculated with Z score or T score is enhanced in the high SMM/BFM group in men. Low or high group are divided by the median of SMM/BFM, which is 1.7 in men. Low group: SMM/BFM ≤ 1.7; high group: SMM/BFM > 1.7. (A–C) BMD calculated with Z score in normal weight (A), overweight (B) and obese I (C); (D–F) BMD calculated with T score in normal weight (D), overweight (E) and obese I (F). ***P < 0.001. Abbreviations: SMM/BFM, skeletal muscle mass/body fat mass; BMD, bone mineral density; NS, not significant. |
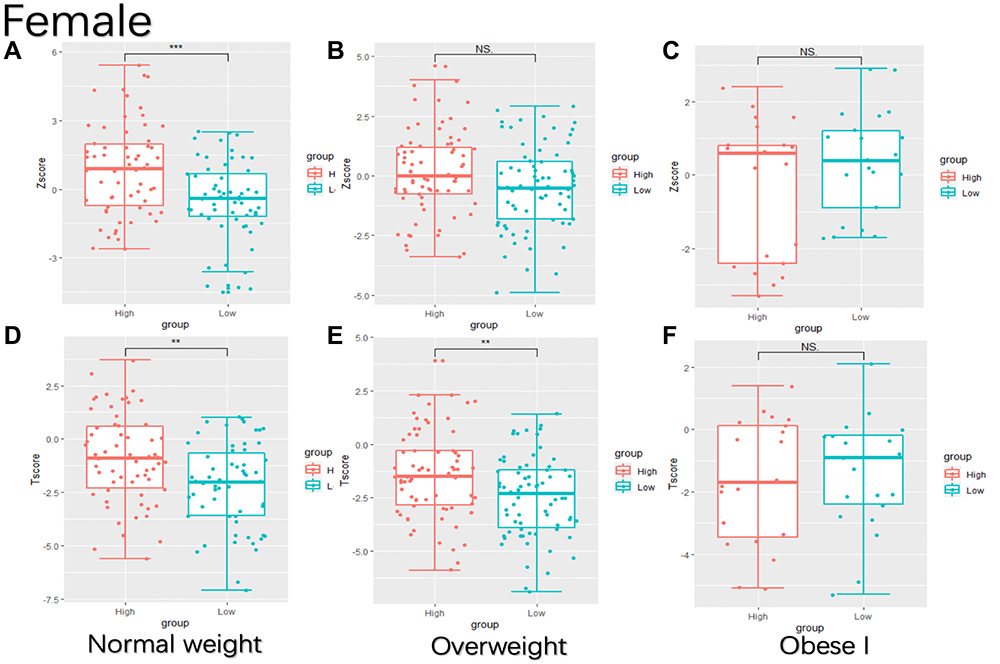 |
Figure 2 BMD calculated with Z score or T score is enhanced in the high SMM/BFM group in women. Low or high group are divided by the median of SMM/BFM, which is 1.0 in women. Low group: SMM/BFM ≤ 1.0; high group: SMM/BFM > 1.0. (A–C) BMD calculated with Z score in normal weight (A), overweight (B) and obese I (C); (D–F) BMD calculated with T score in normal weight (D), overweight (E) and obese I (F). **P < 0.01, ***P < 0.001. Abbreviations: SMM/BFM, skeletal muscle mass/body fat mass; BMD, bone mineral density; NS, not significant. |
GAMs Models with Trunk Fat and Non-Trunk Fat on BMD
Furthermore, the impact of trunk fat (central, visceral fat most) and non-trunk fat (peripheral, subcutaneous fat most) on BMD were also different. Then, individuals would like to invest in the relationship between body distribution or body composition and BMD. After correcting for age, gender, BMI, and sugar HBA1c, the adjusted aZscore was linearly positively correlated with FFM, and SMM was positively correlated with aZscore. Total BFM was negatively correlated with bone mineral density score, similar to non-trunk BFM. It seemed that non-trunk fat had a greater effect on BMD than that of trunk fat, while non-trunk fat presented a non-linear correlation with BMD. Notably, this relationship was not influenced by hyperglycemia in T2DM since the age, gender, BMI and HbA1c had been adjusted in non-linear GAMs statistical analysis (Table 3).
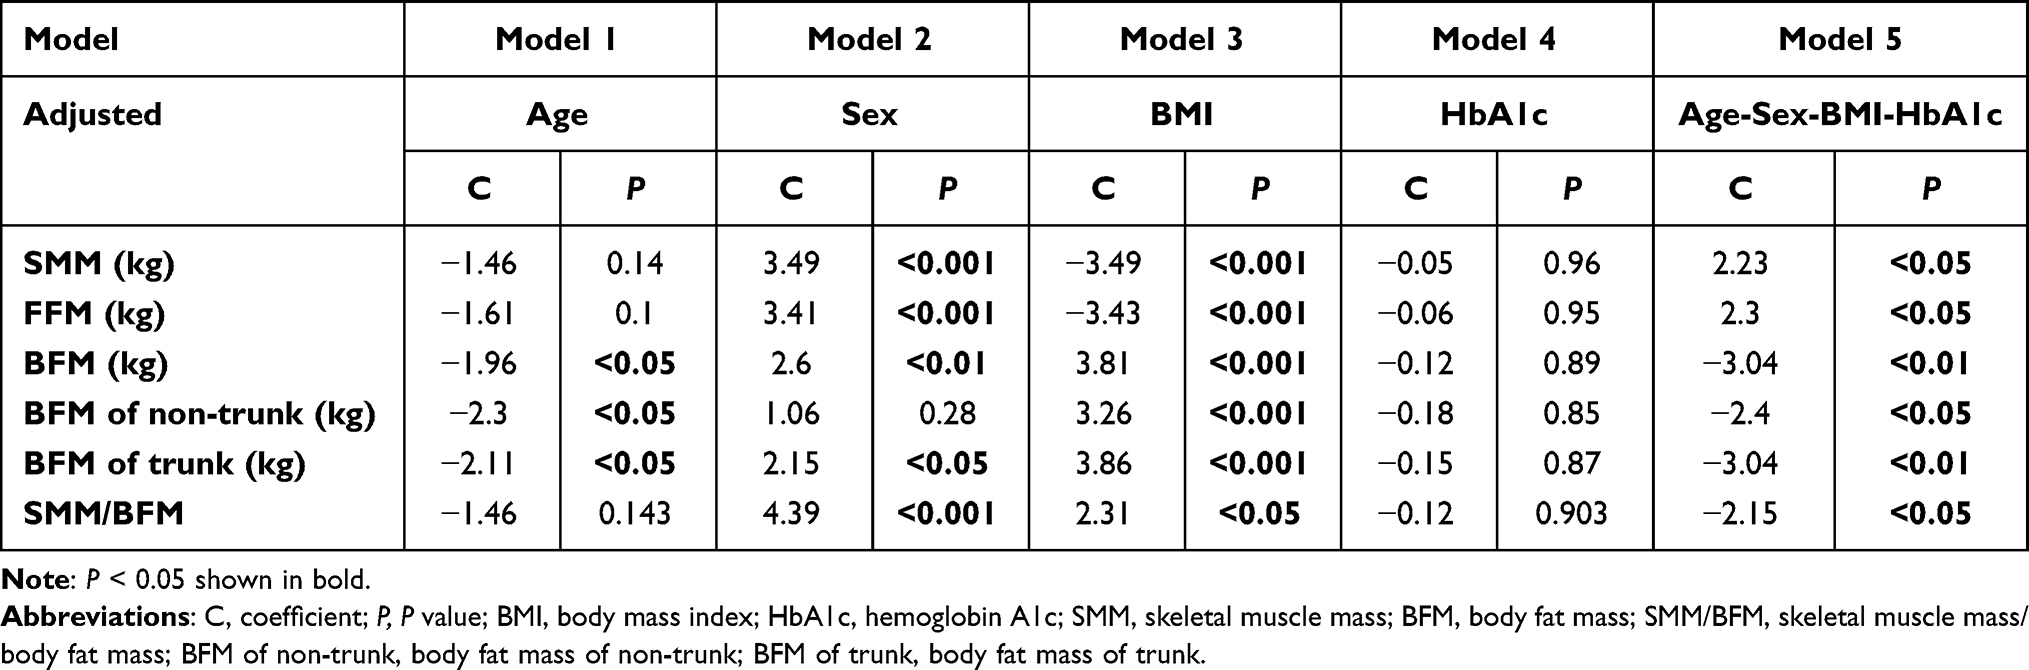 |
Table 3 Different Generalized Additive Analysis Models Between Body Composition and Adjusted Z-Score |
SMM/BFM Might Be an Indicator for BMD in T2DM
Previous studies have used BMI as a simple and easy index for metabolic health. However, body weight and BMI do not accurately describe nutritional status and abnormalities since body composition is complex. Meanwhile, muscle and body fat both occupy an important place in body shapes and health conditions. Individuals could be in totally different health conditions with the same BMI but different proportions of SMM and BFM. Thus, SMM/BFM might be a more specific and sensitive predictor for body composition and disease prediction. Additionally, the results of GAMs suggested that the relationship of fat and muscle on BMD was not one-way linear (Figure 3). The association of SMM/BFM and adjusted Z score (aZscore) was approximately linear positive (BMD increased with muscle increasing and fat decreasing) when SMM/BFM<2, the relationship kept relatively unchangeable (aZscore maintained at 1) when SMM/BFM was between 2 and 3, and the association of SMM/BFM and BMD became negative (aZscore increase with fat increasing) when SMM/BFM>3 (Figure 3 and Table 3). This is in that change of muscle in adults is limited, while the variation of body fat could be flexible in a large range. The outcomes demonstrated that fat increment would be beneficial to BMD when fat was at a physiological limit but harmed BMD when fat was at a highly harmful level.
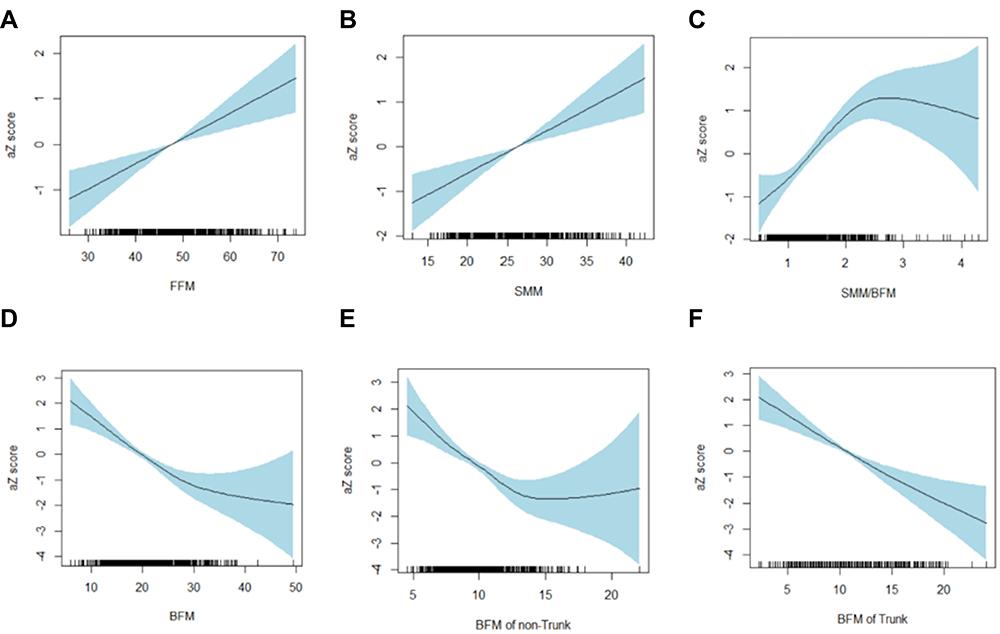 |
Figure 3 Generalized additive relations of different body compositions with aZscore. aZscore and its generalized additive models with FFM (A), SMM (B), SMM/BFM (C), BFM (D), BFM of non-trunk (E) and BFM of Trunk (F). aZscore: Z score adjusted with age, gender, BMI, and HbA1c. Areas marked by blue: confidence intervals. Abbreviations: FFM, fat-free mass; SMM, skeletal muscle mass; BFM, body fat mass; SMM/BFM, skeletal muscle mass/body fat mass; BFM of non-trunk, body fat mass of non-trunk; BFM of trunk, body fat mass of trunk. |
Discussion
In the study, the combined relationship between muscle-fat and bone in T2DM individuals ranging from normal weight and obesity was explored. The index SMM/BFM was used for the consideration of the combined effect of fat and muscle and a novel non-linear GAM analysis method was used as the statistical analysis method. The results revealed that BMD was significantly higher in the high SMM/BFM group in both normal weight and overweight groups in T2DM patients. Nonetheless, this phenomenon disappeared in the obese diabetic group. Additionally, the correlation between muscle-fat and BMD was not one-way linear. Of note, this relationship was not influenced by hyperglycemia in T2DM since the HbA1c had been adjusted in non-linear GAMs statistical analysis. These data provided a novel viewpoint relationship between muscle-fat and bone, and SMM/BFM might be a potential biomarker for bone health and clinical treatments of diabetes and related metabolic syndromes.
GAM is a type of nonparametric regression. Techniques such as linear regression are parametric, implying that they incorporate certain assumptions about the data. If an analyst uses a parametric technique with data that does not conform to its assumptions, the result of the analysis may be a weak or biased model. Nonparametric regression relaxes the assumptions of linearity, enabling the analyst to detect patterns that parametric techniques may miss. The model was increasingly used in various authoritative studies in different fields including ecology, biology, and human clinical research.17,18 A novel model was adopted to analyze the relationship between the combination of muscle-fat and bone health in our study. In our study, the results of GAMs suggested that the relationship of fat and muscle on BMD was not one-way linear (Figure 3). This is in that change of muscle in adults is limited, while the variation of body fat could be flexible in a large range. The outcomes demonstrated that fat increment would be beneficial to BMD when fat was at a physiological limit but harmed BMD when fat was at a highly harmful level. Moreover, bioelectrical impedance analysis (BIA) is a valid technique in the estimation of body composition.19,20 It measures in combination the hand-to-foot bioelectrical impedance and estimates BFM and SMM with a safe, noninvasive and inexpensive device. BIA technique can provide accurate estimations of SMM and BFM with DXA and MRI.21
A study with 7835 participants from Korea indicated that waist circumference (WC), body fat mass (BFM) and skeletal muscle mass (SMM) could be predictors for T2DM bone health.22 Moreover, individuals with the same weight or body mass index (BMI) but a different proportion of muscle and fat might present different BMDs. Since muscle and fat interact with each other and have different effects on BMD, the index SMM/BFM was used for the consideration of the combined effect of fat and muscle in our study. This study demonstrated that BMD was significantly higher in the high SMM/BFM group of both normal weight and overweight T2DM men, and this phenomenon disappeared in the obese group (Table 1 and Figure 1). Furthermore, the results were consistent with women (Table 2 and Figure 2). These data suggested that SMM/BFM might be a good factor indicating BMD in different weight ranges from normal weight to overweight. SMM/BFM could distinguish BMD in the overweight group but not in the obese group. This is in that might be excessive fat accumulation in obesity would weaken muscle changes and effects on bone. Therefore, it becomes more important to clarify the physiological boundary of SMM/BFM and adjusted the parameter of SMM/BFM when it exceeds this boundary. This boundary might be interesting for further exploration. Moreover, more type 2 diabetes obese individuals should be observed, since the possibility that an insignificant difference of in BMD of the obese T2DM group might be caused by a small sample size cannot also be eliminated in our study. However, the relative correlation of each of the two contributors to BMD has been highly controversial. Muscle was positively correlated with BMD. Muscle exposes biomechanical strengths on bone, making the skeleton strong with heavier muscle mass. The strength that muscle acts against bone is impacted by the weight-bearing of body mass, muscles and bones.23 However, the relationship between fat and BMD was controversial. A recent study reported that fat mass was negatively associated with muscle mass and mass strength24 and numerous studies showed that obese individuals showed muscle atrophy.25,26 BFM could contribute to BMD by increasing mechanical loading on the bone to some extent, and secreting some bone protective factors such as estrogen. Besides, some studies have suggested that SMM, not BFM, is highly associated with BMD,27–31 while others have shown that BFM, not SMM, is a key contributor to BMD.32,33 Still, other studies have found that both BFM and SMM are significant indicators of BMD.34–36 Studies of BFM and BMD in childhood have also presented mixed results, reporting positive,37,38 negative,39 or null associations.40 These inconsistent data suggested that the effect of BFM and SMM on BMD could be influenced by various conditions such as age, gender, BMI, race, metabolic status and sample sizes. The relationship might be combined but not separately considered.
Other studies3,13,14 demonstrated that skeletal muscle improved bone health and fat was harmful to bone density, similar to our findings that SMM or FFM exhibited a linear positive correlation with BMD and BFM with a negative correlation with BMD (Figure 3). Interestingly, the whole BFM further divided into trunk BFM and non-trunk BFM. It was discovered that BMD did not present unlimited reduction with non-trunk BFM increasing compared with a condition where trunk far increasing. Trunk fat presented a linear negative relationship with BMD in our study and this finding is persistent with a study of primarily small cohorts in which the majority41–44 but not all45 showed a negative relationship between central fat mass and BMD. These results reflected that limb fat might not be boundless proliferation, and limb fat sustained a protective effect on BMD to some extent. Thus, non-trunk fat had a greater effect on BMD than that of trunk fat and had both beneficial and adverse effects on BMD. Furthermore, the impact of trunk fat and non-trunk fat on BMD was also different. The results of GAMs suggested that the relationship of muscle-fat on BMD was not one-way linear. The association of SMM/BFM and aZscore changed from approximately linear positive to approximately linear negative with SMM/BFM increasing. The results indicate that there is an optimum point of the combined effect of muscle-fat (SMM/BFM) on BMD (the point in our study is 2.0–3.0). When SMM/BFM is in the optimal range, the mechanical loading effect of muscle-fat on bone is the strongest; thus, BMD reaches maximum. However, BMD decreases when SMM/BFM is too high or too low due to overloading, insufficient muscle nutrition, or excessive release of adipo-osteoclast factors. This might also explain why some linear studies have found conflicting associations between fat and BMD.34–36 Moreover, the finest point of SMM/BFM should be further tested in other individuals of different races and metabolic statuses.
Type 2 diabetes mellitus (T2DM) is a severe, lifelong situation with a major impact on the welfare of human beings worldwide accompanied by various metabolic disorders including insulin resistance and obesity. Moreover, the maintenance of hyperglycemia and lipid accumulation would further damage our bone health and cause osteoporosis.46 To investigate the muscle-fat and bone relationship in T2DM, we further used different models to find a correlation between SMM/BFM and BMD (Table 3). Interestingly, that non-trunk BFM did not change with gender in our study, reflecting that sex hormones such as estrogen and testosterone might impact more central abdominal fat than peripheral limb fat. These data implied that the influence of central fat on BMD was a more unfavorable effect due to the secretion of more inflammatory cytokines and the correlation was directly dependent on the weight of central fat. Besides, applying different obesity indicators would enumerate useful data to classify the performance of fat accumulation on bone health since central obesity is an alternative to visceral fat, which acts more endocrinological functions than subcutaneous fat. Non-trunk fat, similar to total BFM, presented a non-linear correlation with BMD, where aZscore decreased when non-trunk fat was less than 15 kg and increased when non-trunk fat exceeded 15kg. This study is consistent in part with the results from a recent analysis of young adults in Boston in which there was a non-linear, negative correlation only in those with levels of truncal central fat mass in the upper 15th percentile, while non-truncal fat (extremities) mass was not related to aZscore.47 Moreover, the difference between children and adults might be that the body composition and BMD of children are in the developmental and unstable period, while adults exhibit a more constant pattern as “weight-setting-point” in our hypothalamus.48
Limitations of the current study include the cross-sectional speculative study, which could not illustrate causality and consequence. Although low BMD is a powerful indicator factor in prospective risk evaluation of bone fractures, strong evidence is not enough for SAT or VAT, fracture incidence, or other measures of bone strength in our study. Additionally, no specific distinction between before and after menopause in women and the influence of estrogen was observed to consider BMD in all ages. Finally, these findings from our data fundamentally originated from the Chinese population and some conditions might require the general results in other cohorts. Our study has several advantages. First, it explored the relationship between BFM and BMD in the Chinese T2DM population. Besides, our data was processed in a group with extensive statistics on diabetic health behaviors, and used novel index SMM/BFM exposures appeared to differ in their relationship with aZscore based on adjusted BMI and HbA1c. Additionally, the possibility of non-linear associations was evaluated, instead of making the expectation of linearity for correlation between SMM/BFM and BMD. Based on the novel non-linear relationship between muscle-fat and bone in diabetes, we found that we would like to explore specific causal-effect links between muscle-fat changes and bone. Firstly, we need to validate those relationships in other ethnic obese diabetics. Then, clinical cohort follow-up studies such as association analysis before and after the onset of diabetes will be a more effective confirming way. These data demonstrated a novel combined relationship between muscle fat on BMD in T2DM and consideration of a potential biomarker for bone health and clinical diagnosis and treatment of diabetes and related metabolic syndromes. Moreover, mouse models with high fat diet (HFD) will be used to observe dynamic changes of SMM/BFM on bone and screen out specific genes resulting in obesity and diabetes-related bone diseases.
Conclusion
In summary, our study suggested a non-linear association between muscle-fat and BMD. It was revealed that BMD was significantly higher in the high SMM/BFM group of both normal weight and overweight groups in T2DM adults. This relationship was not influenced by hyperglycemia in T2DM. This relationship might be a potential diagnostic or prognostic indicator for distinguishing between metabolic healthy obesity and metabolic unhealthy obesity such as T2DM, providing a crucial guidance for weight management, body composition assessment, treatment and risk prevention of osteoporosis in obese and diabetic patients.
Ethics Approval and Informed Consent
This study protocol was approved by the Institutional Review Board of the Yancheng No.6 Hospital (2018-SR-001), and all participants provided written informed consent. All procedures involved in this study were in accordance with the ethical standards of the Helsinki declaration.
Acknowledgments
The authors acknowledge all the physicians and nurses taking part in the enrolment of participants in the Yancheng city No.6 People’s Hospital, Yancheng, Jiangsu province, China.
Author Contributions
All authors made a significant contribution to the work reported, whether that is in the conception, study design, execution, acquisition of data, analysis and interpretation, or in all these areas; took part in drafting, revising or critically reviewing the article; gave final approval of the version to be published; have agreed on the journal to which the article has been submitted; and agree to be accountable for all aspects of the work.
Funding
This work was financially supported by Yancheng Science and Technology Foundation (YK2020115).
Disclosure
The authors report no conflicts of interest in this work.
References
1. Kirk B, Feehan J, Lombardi G, Duque G. Muscle, bone, and fat crosstalk: the biological role of myokines, osteokines, and adipokines. Curr Osteoporos Rep. 2020;18:388–400. doi:10.1007/s11914-020-00599-y
2. Nguyen ND, Pongchaiyakul C, Center JR, Eisman JA, Nguyen TV. Identification of high-risk individuals for hip fracture: a 14-year prospective study. J Bone Miner Res. 2005;20:1921–1928. doi:10.1359/JBMR.050520
3. Ho-Pham LT, Nguyen UD, Nguyen TV. Association between lean mass, fat mass, and bone mineral density: a meta-analysis. J Clin Endocrinol Metab. 2014;99(1):30–38. doi:10.1210/jc.2013-3190
4. Prado CM, Maia YL, Ormsbee M, Sawyer MB, Baracos VE. Assessment of nutritional status in cancer–the relationship between body composition and pharmacokinetics. Anticancer Agents Med Chem. 2013;13:1197–1203. doi:10.2174/18715206113139990322
5. Ormsbee MJ, Prado CM, Ilich JZ, et al. Osteosarcopenic obesity: the role of bone, muscle, and fat on health. J Cachexia Sarcopenia Muscle. 2014;5(3):183–192. doi:10.1007/s13539-014-0146-x
6. Kurniawan LB, Bahrun U, Hatta M, Arif M. Body mass, total body fat percentage, and visceral fat level predict insulin resistance better than waist circumference and body mass index in healthy young male adults in Indonesia. J Clin Med. 2018;7(5):96. doi:10.3390/jcm7050096
7. Reid IR. Fat and bone. Arch Biochem Biophys. 2010;503(1):20–27. doi:10.1016/j.abb.2010.06.027
8. Williams GA, Wang Y, Callon KE, et al. In vitro and in vivo effects of adiponectin on bone. Endocrinology. 2009;150(8):3603–3610. doi:10.1210/en.2008-1639
9. Tu Q, Zhang J, Dong LQ, et al. Adiponectin inhibits osteoclastogenesis and bone resorption via APPL1-mediated suppression of Akt1. J Biol Chem. 2011;286(14):12542–12553. doi:10.1074/jbc.M110.152405
10. Liu PY, Ilich JZ, Brummel-Smith K, Ghosh S. New insight into fat, muscle and bone relationship in women: determining the threshold at which body fat assumes negative relationship with bone mineral density. Int J Prev Med. 2014;5(11):1452–1463.
11. Bierhals IO, Dos Santos Vaz J, Bielemann RM, et al. Associations between body mass index, body composition and bone density in young adults: findings from a southern Brazilian cohort. BMC Musculoskelet Disord. 2019;20:322.
12. Pellegrinelli V, Rouault C, Rodriguez-Cuenca S, et al. Human adipocytes induce inflammation and atrophy in muscle cells during obesity. Diabetes. 2015;64(9):3121–3134. doi:10.2337/db14-0796
13. Shapses SA, Sukumar D. Bone metabolism in obesity and weight loss. Annu Rev Nutr. 2012;32(1):287–309. doi:10.1146/annurev.nutr.012809.104655
14. Guo M, Zemel BS, Hawkes CP, et al. Sarcopenia and preserved bone mineral density in paediatric survivors of high-risk neuroblastoma with growth failure. J Cachexia Sarcopenia Muscle. 2021;12(4):1024–1033. doi:10.1002/jcsm.12734
15. Vianna AGD, Sanches CP, Barreto FC. Review article: effects of type 2 diabetes therapies on bone metabolism. Diabetol Metab Syndr. 2017;9(1):75. doi:10.1186/s13098-017-0274-5
16. Unnanuntana A, Gladnick BP, Donnelly E, Lane JM. The assessment of fracture risk. J Bone Joint Surg Am. 2010;92:743–753. doi:10.2106/JBJS.I.00919
17. Lee CK, Samad M, Hofer I, Cannesson M, Baldi P. Development and validation of an interpretable neural network for prediction of postoperative in-hospital mortality. NPJ Digit Med. 2021;4:8.
18. Rowney FM, Brennan GL, Skjoth CA, et al. Environmental DNA reveals links between abundance and composition of airborne grass pollen and respiratory health. Curr Biol. 2021;31:1995–2003 e1994. doi:10.1016/j.cub.2021.02.019
19. Kyle UG, Bosaeus I, De Lorenzo AD, et al. Bioelectrical impedance analysis–part I: review of principles and methods. Clin Nutr. 2004;23:1226–1243. doi:10.1016/j.clnu.2004.06.004
20. Lukaski HC. Biological indexes considered in the derivation of the bioelectrical impedance analysis. Am J Clin Nutr. 1996;64(3):397S–404S. doi:10.1093/ajcn/64.3.397S
21. Wang JG, Zhang Y, Chen HE, et al. Comparison of two bioelectrical impedance analysis devices with dual energy X-ray absorptiometry and magnetic resonance imaging in the estimation of body composition. J Strength Cond Res. 2013;27:236–243. doi:10.1519/JSC.0b013e31824f2040
22. Chi JH, Shin MS, Lee BJ, Moran JM. Association of type 2 diabetes with anthropometrics, bone mineral density, and body composition in a large-scale screening study of Korean adults. PLoS One. 2019;14(7):e0220077. doi:10.1371/journal.pone.0220077
23. Schoenau E, Neu MC, Manz F. Muscle mass during childhood–relationship to skeletal development. J Musculoskelet Neuronal Interact. 2004;4:105–108.
24. Moore BA, Bemben DA, Lein DH, Bemben MG, Singh H. Fat mass is negatively associated with muscle strength and jump test performance. J Frailty Aging. 2020;9:214–218.
25. Buch A, Carmeli E, Boker LK, et al. Muscle function and fat content in relation to sarcopenia, obesity and frailty of old age–an overview. Exp Gerontol. 2016;76:25–32. doi:10.1016/j.exger.2016.01.008
26. Kalyani RR, Corriere M, Ferrucci L. Age-related and disease-related muscle loss: the effect of diabetes, obesity, and other diseases. Lancet Diabetes Endocrinol. 2014;2:819–829. doi:10.1016/S2213-8587(14)70034-8
27. Douchi T, Kuwahata R, Matsuo T, Uto H, Oki T, Nagata Y. Relative contribution of lean and fat mass component to bone mineral density in males. J Bone Miner Metab. 2003;21:17–21. doi:10.1007/s007740300003
28. Douchi T, Matsuo T, Uto H, Kuwahata T, Oki T, Nagata Y. Lean body mass and bone mineral density in physically exercising postmenopausal women. Maturitas. 2003;45(3):185–190. doi:10.1016/S0378-5122(03)00143-9
29. Hsu YH, Venners SA, Terwedow HA, et al. Relation of body composition, fat mass, and serum lipids to osteoporotic fractures and bone mineral density in Chinese men and women. Am J Clin Nutr. 2006;83(1):146–154. doi:10.1093/ajcn/83.1.146
30. Leslie WD, Weiler HA, Nyomba BL. Ethnic differences in adiposity and body composition: the First Nations bone health study. Appl Physiol Nutr Metab. 2007;32:1065–1072. doi:10.1139/H07-068
31. Ilich-Ernst J, Brownbill RA, Ludemann MA, Fu R. Critical factors for bone health in women across the age span: how important is muscle mass? Medscape Women's Health. 2002;7(3):2.
32. Reid IR. Relationships among body mass, its components, and bone. Bone. 2002;31:547–555. doi:10.1016/S8756-3282(02)00864-5
33. Zeng H, Ge J, Xu W, et al. Type 2 diabetes is causally associated with reduced serum osteocalcin: a genome-wide association and Mendelian randomization study. J Bone Miner Res. 2021;36(9):1694–1707. doi:10.1002/jbmr.4330
34. Gnudi S, Sitta E, Fiumi N. Relationship between body composition and bone mineral density in women with and without osteoporosis: relative contribution of lean and fat mass. J Bone Miner Metab. 2007;25(5):326–332. doi:10.1007/s00774-007-0758-8
35. Ijuin M, Douchi T, Matsuo T, Yamamoto S, Uto H, Nagata Y. Difference in the effects of body composition on bone mineral density between pre- and postmenopausal women. Maturitas. 2002;43(4):239–244. doi:10.1016/S0378-5122(02)00273-6
36. Ritchie H, Nahikian-Nelms M, Roberts K, Gemma S, Shaikhkhalil A. The prevalence of aberrations in body composition in pediatric cystic fibrosis patients and relationships with pulmonary function, bone mineral density, and hospitalizations. J Cyst Fibros. 2021;20(5):837–842. doi:10.1016/j.jcf.2021.04.004
37. Ka K, Rousseau MC, Lambert M, et al. Association between lean and fat mass and indicators of bone health in prepubertal caucasian children. Horm Res Paediatr. 2013;80(3):154–162. doi:10.1159/000354043
38. Soininen S, Sidoroff V, Lindi V, et al. Body fat mass, lean body mass and associated biomarkers as determinants of bone mineral density in children 6–8 years of age - the Physical Activity and Nutrition in Children (PANIC) study. Bone. 2018;108:106–114. doi:10.1016/j.bone.2018.01.003
39. Wey HE, Binkley TL, Beare TM, Wey CL, Specker BL. Cross-sectional versus longitudinal associations of lean and fat mass with pQCT bone outcomes in children. J Clin Endocrinol Metab. 2011;96:106–114. doi:10.1210/jc.2010-0889
40. El Hage R, Moussa E, Jacob C. Bone mineral content and density in obese, overweight, and normal-weighted sedentary adolescent girls. J Adolesc Health. 2010;47:591–595. doi:10.1016/j.jadohealth.2010.04.018
41. Torres-Costoso A, Garrido-Miguel M, Gracia-Marco L, et al. The “Fat but Fit” paradigm and bone health in young adults: a cluster analysis. Nutrients. 2021;13(2):518. doi:10.3390/nu13020518
42. Russell M, Mendes N, Miller KK, et al. Visceral fat is a negative predictor of bone density measures in obese adolescent girls. J Clin Endocrinol Metab. 2010;95:1247–1255. doi:10.1210/jc.2009-1475
43. Pollock NK, Bernard PJ, Wenger K, et al. Lower bone mass in prepubertal overweight children with prediabetes. J Bone Miner Res. 2010;25(12):2760–2769. doi:10.1002/jbmr.184
44. Afghani A, Goran MI. The interrelationships between abdominal adiposity, leptin and bone mineral content in overweight Latino children. Horm Res. 2009;72(2):82–87. doi:10.1159/000232160
45. Jeon HC, Lee K, Kim J, Park TJ, Kang DW, Park DJ. The relationship between body fat percent and bone mineral density in Korean adolescents: the fifth Korea National Health and Nutrition Examination Survey (KNHANES V-1), 2010. Korean J Fam Med. 2014;35:303–308. doi:10.4082/kjfm.2014.35.6.303
46. Saeedi P, Petersohn I, Salpea P, et al. Global and regional diabetes prevalence estimates for 2019 and projections for 2030 and 2045: results from the International Diabetes Federation Diabetes Atlas, 9 (th) edition. Diabetes Res Clin Pract. 2019;157:107843. doi:10.1016/j.diabres.2019.107843
47. Rokoff LB, Rifas-Shiman SL, Switkowski KM, et al. Body composition and bone mineral density in childhood. Bone. 2019;121:9–15. doi:10.1016/j.bone.2018.12.009
48. Tam J, Fukumura D, Jain RK. A mathematical model of murine metabolic regulation by leptin: energy balance and defense of a stable body weight. Cell Metab. 2009;9:52–63. doi:10.1016/j.cmet.2008.11.005
 © 2022 The Author(s). This work is published and licensed by Dove Medical Press Limited. The
full terms of this license are available at https://www.dovepress.com/terms
and incorporate the Creative Commons Attribution
- Non Commercial (unported, 3.0) License.
By accessing the work you hereby accept the Terms. Non-commercial uses of the work are permitted
without any further permission from Dove Medical Press Limited, provided the work is properly
attributed. For permission for commercial use of this work, please see paragraphs 4.2 and 5 of our Terms.
© 2022 The Author(s). This work is published and licensed by Dove Medical Press Limited. The
full terms of this license are available at https://www.dovepress.com/terms
and incorporate the Creative Commons Attribution
- Non Commercial (unported, 3.0) License.
By accessing the work you hereby accept the Terms. Non-commercial uses of the work are permitted
without any further permission from Dove Medical Press Limited, provided the work is properly
attributed. For permission for commercial use of this work, please see paragraphs 4.2 and 5 of our Terms.
Recommended articles
Nonlinear Association Between Serum Uric Acid and Femoral Neck Bone Mineral Density in Male Patients with Metabolic Dysfunction-Associated Fatty Liver Disease
Tan J, Wang L, Li H, Wang H, Yang X
Diabetes, Metabolic Syndrome and Obesity 2025, 18:161-171
Published Date: 17 January 2025